Exhibit 99.3
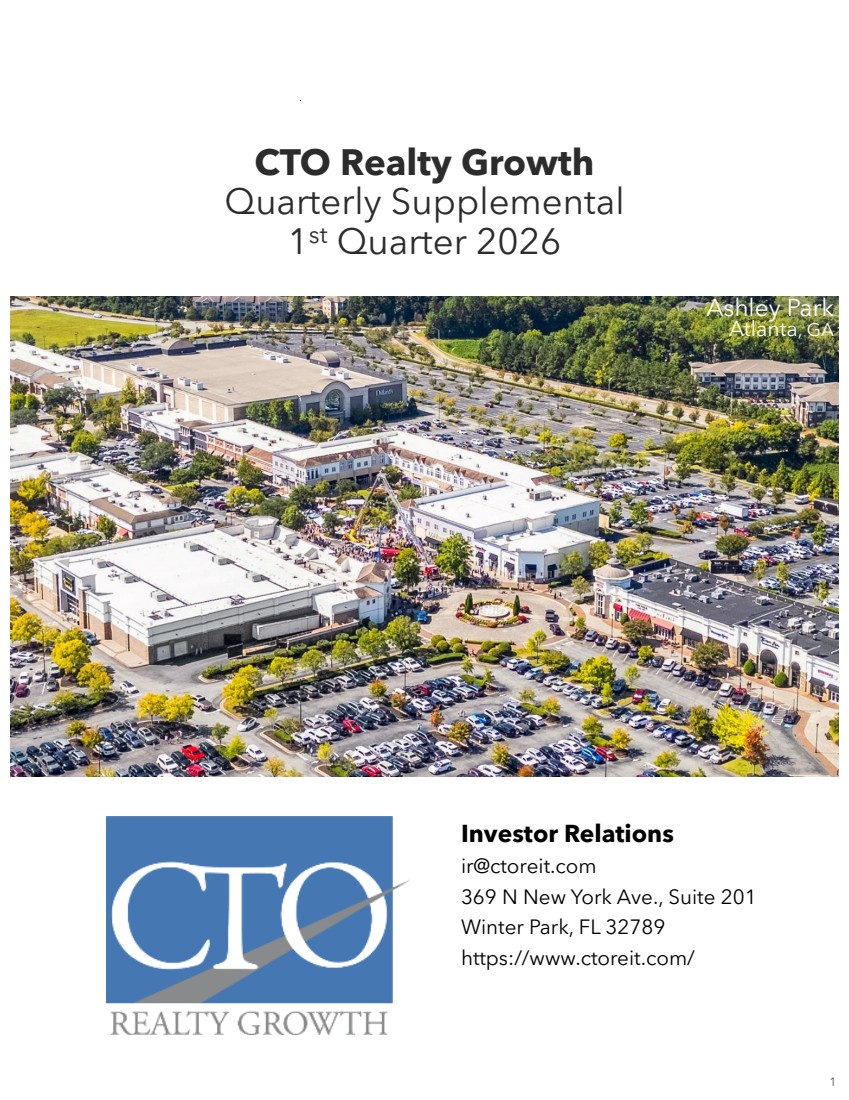
| 8 CTO Realty Growth Quarterly Supplemental 1 st Quarter 2026 Investor Relations ir@ctoreit.com 369 N New York Ave., Suite 201 Winter Park, FL 32789 https://www.ctoreit.com/ Ashley Park Atlanta, GA 1 |
| © CTO Realty Growth, Inc. | ctoreit.com 9 Table of Contents March 31, 2026 Press Release First Quarter 2026 Earnings Press Release 3 Financial Summary Results Overview & Guidance 10 Consolidated Balance Sheets 11 Consolidated Statements of Operations 12 Funds from Operations 13 Supplemental Schedule of Same-Property Net Operating Income 14 Adjusted EBITDA 15 Market Capitalization, Debt Ratios and Liquidity 16 Debt Summary 17 Real Estate Portfolio Capital Investments 18 Leasing Summary Top Tenant Summary 19 Retail Leasing Activity 20 Lease Expiration Schedule 21 Portfolio & Investment Summary Investments, Dispositions & Structured Investment Repayments 22 Portfolio Summary 23 Geographic Diversification 24 Other Investments 25 Additional Disclosures 2026 Guidance 26 Contact Information & Research Coverage 27 2 |
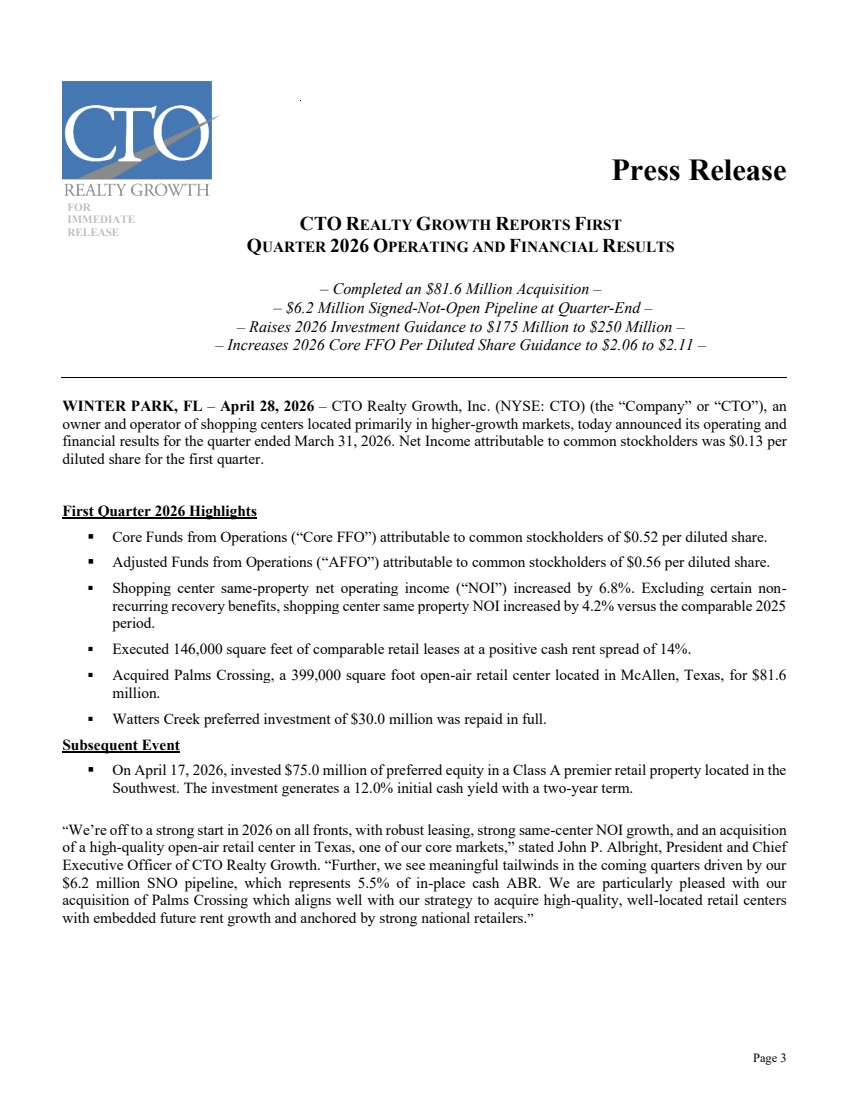
| Page 3 DRAFT DRATDDD Press Release FIRST 2024 OPERATING RESULTS FOR IMMEDIATE RELEASE CTO REALTY GROWTH REPORTS FIRST QUARTER 2026 OPERATING AND FINANCIAL RESULTS – Completed an $81.6 Million Acquisition – – $6.2 Million Signed-Not-Open Pipeline at Quarter-End – – Raises 2026 Investment Guidance to $175 Million to $250 Million – – Increases 2026 Core FFO Per Diluted Share Guidance to $2.06 to $2.11 – WINTER PARK, FL – April 28, 2026 – CTO Realty Growth, Inc. (NYSE: CTO) (the “Company” or “CTO”), an owner and operator of shopping centers located primarily in higher-growth markets, today announced its operating and financial results for the quarter ended March 31, 2026. Net Income attributable to common stockholders was $0.13 per diluted share for the first quarter. First Quarter 2026 Highlights ▪ Core Funds from Operations (“Core FFO”) attributable to common stockholders of $0.52 per diluted share. ▪ Adjusted Funds from Operations (“AFFO”) attributable to common stockholders of $0.56 per diluted share. ▪ Shopping center same-property net operating income (“NOI”) increased by 6.8%. Excluding certain non-recurring recovery benefits, shopping center same property NOI increased by 4.2% versus the comparable 2025 period. ▪ Executed 146,000 square feet of comparable retail leases at a positive cash rent spread of 14%. ▪ Acquired Palms Crossing, a 399,000 square foot open-air retail center located in McAllen, Texas, for $81.6 million. ▪ Watters Creek preferred investment of $30.0 million was repaid in full. Subsequent Event ▪ On April 17, 2026, invested $75.0 million of preferred equity in a Class A premier retail property located in the Southwest. The investment generates a 12.0% initial cash yield with a two-year term. “We’re off to a strong start in 2026 on all fronts, with robust leasing, strong same-center NOI growth, and an acquisition of a high-quality open-air retail center in Texas, one of our core markets,” stated John P. Albright, President and Chief Executive Officer of CTO Realty Growth. “Further, we see meaningful tailwinds in the coming quarters driven by our $6.2 million SNO pipeline, which represents 5.5% of in-place cash ABR. We are particularly pleased with our acquisition of Palms Crossing which aligns well with our strategy to acquire high-quality, well-located retail centers with embedded future rent growth and anchored by strong national retailers.” |
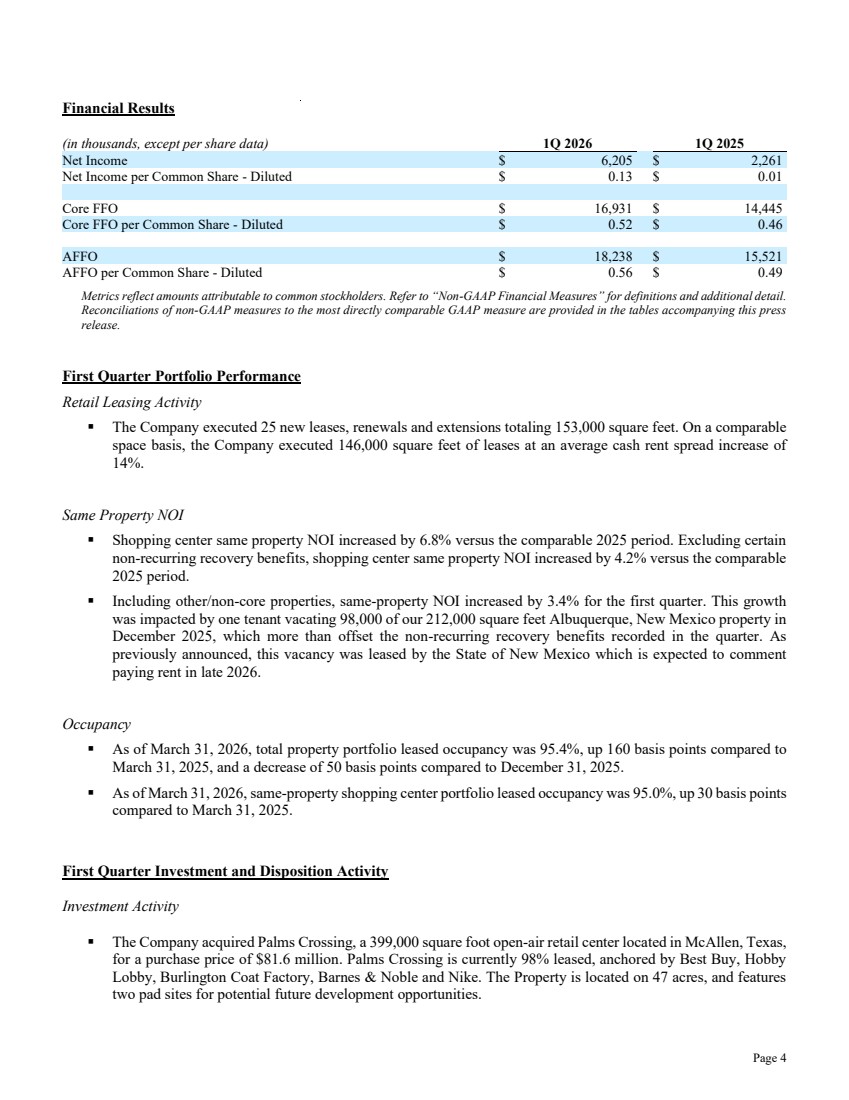
| Page 4 Financial Results (in thousands, except per share data) 1Q 2026 1Q 2025 Net Income $ 6,205 $ 2,261 Net Income per Common Share - Diluted $ 0.13 $ 0.01 Core FFO $ 16,931 $ 14,445 Core FFO per Common Share - Diluted $ 0.52 $ 0.46 AFFO $ 18,238 $ 15,521 AFFO per Common Share - Diluted $ 0.56 $ 0.49 Metrics reflect amounts attributable to common stockholders. Refer to “Non-GAAP Financial Measures” for definitions and additional detail. Reconciliations of non-GAAP measures to the most directly comparable GAAP measure are provided in the tables accompanying this press release. First Quarter Portfolio Performance Retail Leasing Activity ▪ The Company executed 25 new leases, renewals and extensions totaling 153,000 square feet. On a comparable space basis, the Company executed 146,000 square feet of leases at an average cash rent spread increase of 14%. Same Property NOI ▪ Shopping center same property NOI increased by 6.8% versus the comparable 2025 period. Excluding certain non-recurring recovery benefits, shopping center same property NOI increased by 4.2% versus the comparable 2025 period. ▪ Including other/non-core properties, same-property NOI increased by 3.4% for the first quarter. This growth was impacted by one tenant vacating 98,000 of our 212,000 square feet Albuquerque, New Mexico property in December 2025, which more than offset the non-recurring recovery benefits recorded in the quarter. As previously announced, this vacancy was leased by the State of New Mexico which is expected to comment paying rent in late 2026. Occupancy ▪ As of March 31, 2026, total property portfolio leased occupancy was 95.4%, up 160 basis points compared to March 31, 2025, and a decrease of 50 basis points compared to December 31, 2025. ▪ As of March 31, 2026, same-property shopping center portfolio leased occupancy was 95.0%, up 30 basis points compared to March 31, 2025. First Quarter Investment and Disposition Activity Investment Activity ▪ The Company acquired Palms Crossing, a 399,000 square foot open-air retail center located in McAllen, Texas, for a purchase price of $81.6 million. Palms Crossing is currently 98% leased, anchored by Best Buy, Hobby Lobby, Burlington Coat Factory, Barnes & Noble and Nike. The Property is located on 47 acres, and features two pad sites for potential future development opportunities. |
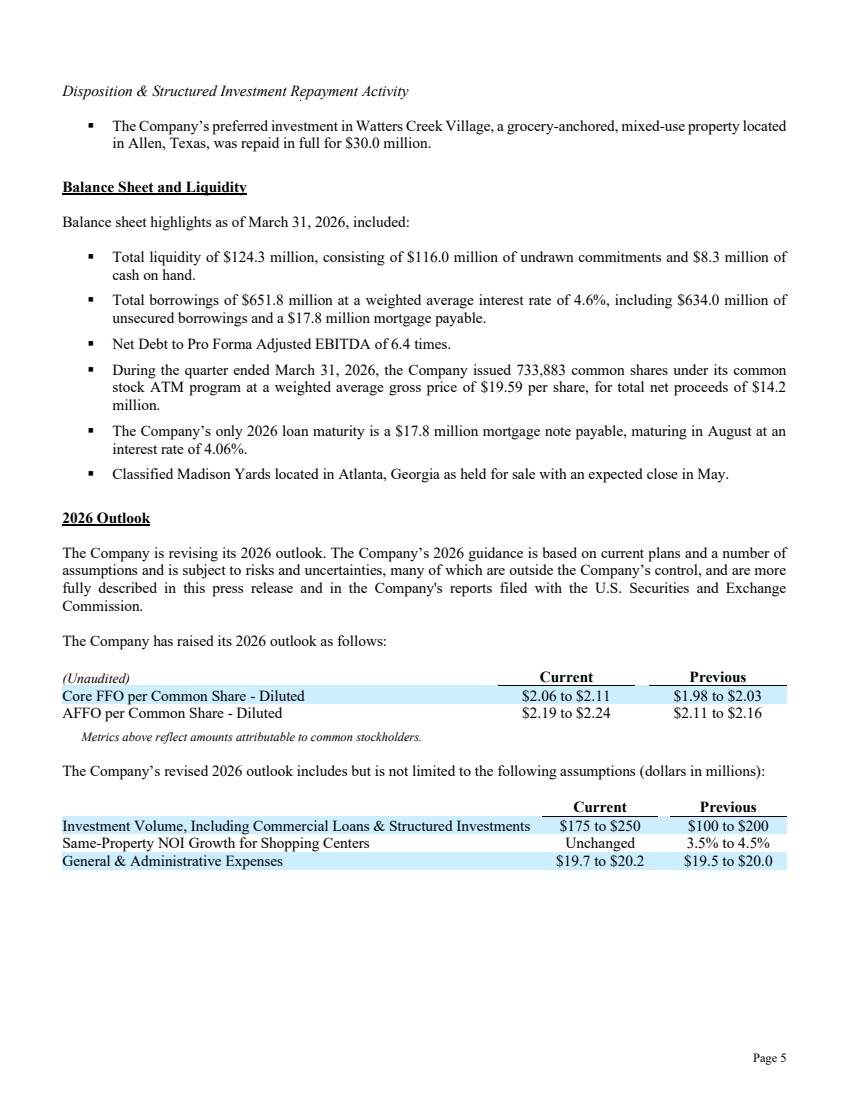
| Page 5 Disposition & Structured Investment Repayment Activity ▪ The Company’s preferred investment in Watters Creek Village, a grocery-anchored, mixed-use property located in Allen, Texas, was repaid in full for $30.0 million. Balance Sheet and Liquidity Balance sheet highlights as of March 31, 2026, included: ▪ Total liquidity of $124.3 million, consisting of $116.0 million of undrawn commitments and $8.3 million of cash on hand. ▪ Total borrowings of $651.8 million at a weighted average interest rate of 4.6%, including $634.0 million of unsecured borrowings and a $17.8 million mortgage payable. ▪ Net Debt to Pro Forma Adjusted EBITDA of 6.4 times. ▪ During the quarter ended March 31, 2026, the Company issued 733,883 common shares under its common stock ATM program at a weighted average gross price of $19.59 per share, for total net proceeds of $14.2 million. ▪ The Company’s only 2026 loan maturity is a $17.8 million mortgage note payable, maturing in August at an interest rate of 4.06%. ▪ Classified Madison Yards located in Atlanta, Georgia as held for sale with an expected close in May. 2026 Outlook The Company is revising its 2026 outlook. The Company’s 2026 guidance is based on current plans and a number of assumptions and is subject to risks and uncertainties, many of which are outside the Company’s control, and are more fully described in this press release and in the Company's reports filed with the U.S. Securities and Exchange Commission. The Company has raised its 2026 outlook as follows: (Unaudited) Current Previous Core FFO per Common Share - Diluted $2.06 to $2.11 $1.98 to $2.03 AFFO per Common Share - Diluted $2.19 to $2.24 $2.11 to $2.16 Metrics above reflect amounts attributable to common stockholders. The Company’s revised 2026 outlook includes but is not limited to the following assumptions (dollars in millions): Current Previous Investment Volume, Including Commercial Loans & Structured Investments $175 to $250 $100 to $200 Same-Property NOI Growth for Shopping Centers Unchanged 3.5% to 4.5% General & Administrative Expenses $19.7 to $20.2 $19.5 to $20.0 |
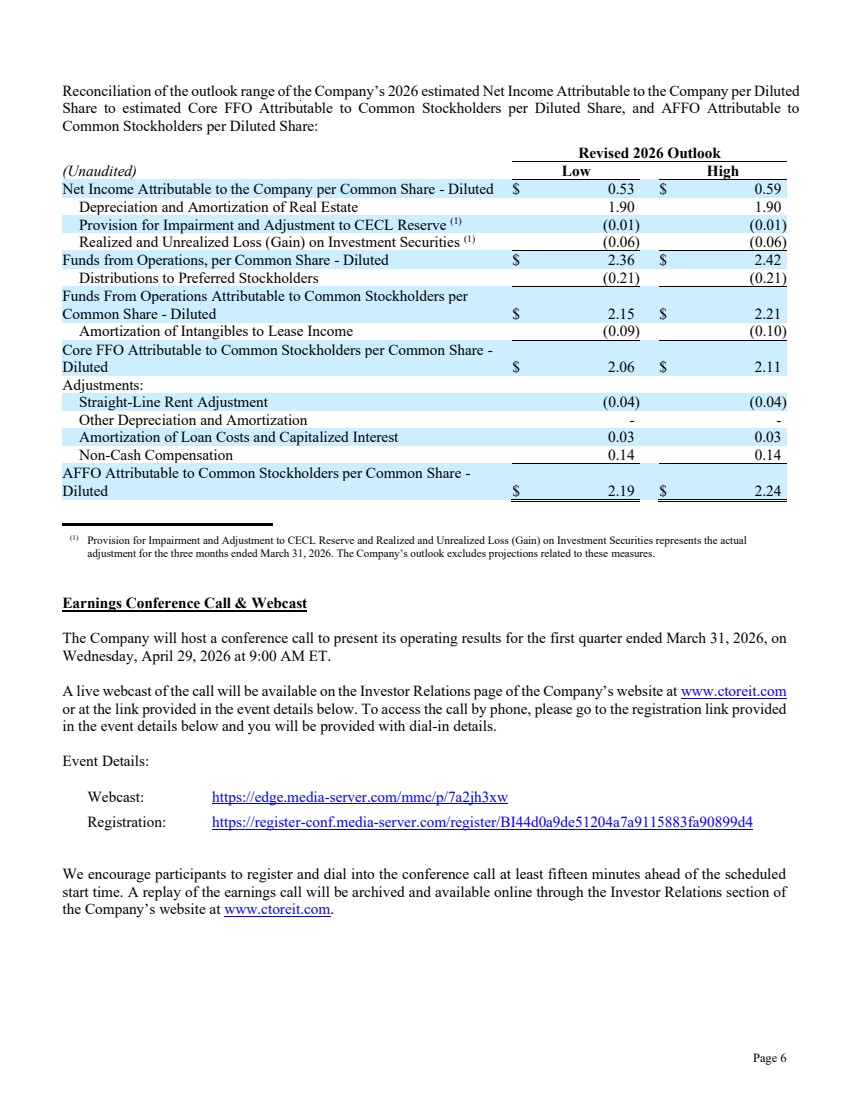
| Page 6 Reconciliation of the outlook range of the Company’s 2026 estimated Net Income Attributable to the Company per Diluted Share to estimated Core FFO Attributable to Common Stockholders per Diluted Share, and AFFO Attributable to Common Stockholders per Diluted Share: Revised 2026 Outlook (Unaudited) Low High Net Income Attributable to the Company per Common Share - Diluted $ 0.53 $ 0.59 Depreciation and Amortization of Real Estate 1.90 1.90 Provision for Impairment and Adjustment to CECL Reserve (1) (0.01) (0.01) Realized and Unrealized Loss (Gain) on Investment Securities (1) (0.06) (0.06) Funds from Operations, per Common Share - Diluted $ 2.36 $ 2.42 Distributions to Preferred Stockholders (0.21) (0.21) Funds From Operations Attributable to Common Stockholders per Common Share - Diluted $ 2.15 $ 2.21 Amortization of Intangibles to Lease Income (0.09) (0.10) Core FFO Attributable to Common Stockholders per Common Share - Diluted $ 2.06 $ 2.11 Adjustments: Straight-Line Rent Adjustment (0.04) (0.04) Other Depreciation and Amortization - - Amortization of Loan Costs and Capitalized Interest 0.03 0.03 Non-Cash Compensation 0.14 0.14 AFFO Attributable to Common Stockholders per Common Share - Diluted $ 2.19 $ 2.24 (1) Provision for Impairment and Adjustment to CECL Reserve and Realized and Unrealized Loss (Gain) on Investment Securities represents the actual adjustment for the three months ended March 31, 2026. The Company’s outlook excludes projections related to these measures. Earnings Conference Call & Webcast The Company will host a conference call to present its operating results for the first quarter ended March 31, 2026, on Wednesday, April 29, 2026 at 9:00 AM ET. A live webcast of the call will be available on the Investor Relations page of the Company’s website at www.ctoreit.com or at the link provided in the event details below. To access the call by phone, please go to the registration link provided in the event details below and you will be provided with dial-in details. Event Details: Webcast: https://edge.media-server.com/mmc/p/7a2jh3xw Registration: https://register-conf.media-server.com/register/BI44d0a9de51204a7a9115883fa90899d4 We encourage participants to register and dial into the conference call at least fifteen minutes ahead of the scheduled start time. A replay of the earnings call will be archived and available online through the Investor Relations section of the Company’s website at www.ctoreit.com. |
| Page 7 About CTO Realty Growth, Inc. CTO Realty Growth, Inc. is a publicly traded real estate investment trust that owns and operates a portfolio of high-quality shopping centers, located primarily in higher growth markets in the United States. CTO also externally manages and owns a meaningful interest in Alpine Income Property Trust, Inc. (NYSE: PINE), a publicly traded net lease REIT. We encourage you to review our most recent investor presentation and supplemental financial information, which is available on our website at www.ctoreit.com. Contact: Investor Relations ir@ctoreit.com Safe Harbor Certain statements contained in this press release (other than statements of historical fact) are forward-looking statements within the meaning of Section 27A of the Securities Act of 1933, as amended, and Section 21E of the Securities Exchange Act of 1934, as amended. Forward-looking statements can typically be identified by words such as “outlook,” “believe,” “estimate,” “expect,” “intend,” “anticipate,” “will,” “could,” “may,” “should,” “plan,” “potential,” “predict,” “forecast,” “project,” and similar expressions, as well as variations or negatives of these words. Although forward-looking statements are made based upon management’s present expectations and beliefs concerning future developments and their potential effect upon the Company, a number of factors could cause the Company’s actual results to differ materially from those set forth in the forward-looking statements. Such factors may include, but are not limited to: the Company’s ability to remain qualified as a REIT; the Company’s exposure to U.S. federal and state income tax law changes, including changes to the REIT requirements; general adverse economic and real estate conditions; macroeconomic and geopolitical factors, including but not limited to inflationary pressures, interest rate volatility, distress in the banking sector, global supply chain disruptions, and ongoing geopolitical war; credit risk associated with the Company investing in commercial loans and similarly structured investments; the ultimate geographic spread, severity and duration of pandemics such as the COVID-19 Pandemic and its variants, actions that may be taken by governmental authorities to contain or address the impact of such pandemics, and the potential negative impacts of such pandemics on the global economy and the Company’s financial condition and results of operations; the inability of major tenants or borrowers to continue paying their rent or obligations due to bankruptcy, insolvency or a general downturn in their business; the loss or failure, or decline in the business or assets of PINE; the completion of 1031 exchange transactions; the availability of investment properties that meet the Company’s investment goals and criteria; the uncertainties associated with obtaining required governmental permits and satisfying other closing conditions for planned acquisitions and sales; and the uncertainties and risk factors discussed in the Company’s Annual Report on Form 10-K for the fiscal year ended December 31, 2025 and other risks and uncertainties discussed from time to time in the Company’s filings with the U.S. Securities and Exchange Commission. There can be no assurance that future developments will be in accordance with management’s expectations or that the effect of future developments on the Company will be those anticipated by management. Readers are cautioned not to place undue reliance on these forward-looking statements, which speak only as of the date of this press release. The Company undertakes no obligation to update the information contained in this press release to reflect subsequently occurring events or circumstances. |
| Page 8 Non-GAAP Financial Measures Our reported results are presented in accordance with accounting principles generally accepted in the United States of America (“GAAP”). We also disclose Funds From Operations (“FFO”), Core Funds From Operations (“Core FFO”), Adjusted Funds From Operations (“AFFO”), Pro Forma Earnings Before Interest, Taxes, Depreciation and Amortization (“Pro Forma Adjusted EBITDA”), and Same-Property Net Operating Income (“Same-Property NOI”), each of which are non-GAAP financial measures. We believe these non-GAAP financial measures are useful to investors because they are widely accepted industry measures used by analysts and investors to compare the operating performance of REITs. FFO, Core FFO, AFFO, Pro Forma Adjusted EBITDA, and Same-Property NOI do not represent cash generated from operating activities and are not necessarily indicative of cash available to fund cash requirements; accordingly, they should not be considered alternatives to net income as a performance measure or cash flows from operating activities as reported on our statement of cash flows as a liquidity measure and should be considered in addition to, and not in lieu of, GAAP financial measures. We compute FFO in accordance with the definition adopted by the Board of Governors of the National Association of Real Estate Investment Trusts, or NAREIT. NAREIT defines FFO as GAAP net income or loss adjusted to exclude real estate related depreciation and amortization, as well as extraordinary items (as defined by GAAP) such as net gain or loss from sales of depreciable real estate assets, impairment write-downs associated with depreciable real estate assets and impairments associated with the current expected credit losses on commercial loans and investments at the time of origination and repayment, including the pro rata share of such adjustments of unconsolidated subsidiaries. The Company also excludes the gains or losses from sales of assets incidental to the primary business of the REIT which specifically include the sales of investment securities, in addition to the mark-to-market of the Company’s investment securities. To derive Core FFO, we modify the NAREIT computation of FFO to include other adjustments to GAAP net income related to gains and losses recognized on the extinguishment of debt, amortization of above- and below-market lease related intangibles, and other unforecastable market- or transaction-driven non-cash items. To derive AFFO, we further modify the NAREIT computation of FFO and Core FFO to include other adjustments to GAAP net income related to non-cash revenues and expenses such as straight-line rental revenue, non-cash compensation, and other non-cash amortization. Such items may cause short-term fluctuations in net income but have no impact on operating cash flows or long-term operating performance. We use AFFO as one measure of our performance when we formulate corporate goals. To derive Pro Forma Adjusted EBITDA, GAAP net income or loss attributable to the Company is adjusted to exclude real estate related depreciation and amortization, as well as extraordinary items (as defined by GAAP) such as net gain or loss from sales of depreciable real estate assets, impairment write-downs associated with depreciable real estate assets, impairments associated with the current expected credit losses on commercial loans and investments at the time of origination and repayment, including the pro rata share of such adjustments of unconsolidated subsidiaries, non-cash revenues and expenses such as straight-line rental revenue, amortization of deferred financing costs, gains and losses recognized on the extinguishment of debt, above- and below-market lease related intangibles, non-cash compensation, other non-recurring items such as termination fees, forfeitures of tenant security deposits, and other non-recurring items, and other non-cash income or expense. The Company also excludes the gains or losses from sales of assets incidental to the primary business of the REIT which specifically include the sales of investment securities, in addition to the mark-to-market of the Company’s investment securities. Cash interest expense is also excluded from Pro Forma Adjusted EBITDA, and GAAP net income or loss is adjusted for the annualized impact of acquisitions, dispositions and other similar activities. |
| Page 9 To derive Same-Property NOI, GAAP net income or loss attributable to the Company is adjusted to exclude real estate related depreciation and amortization, as well as extraordinary items (as defined by GAAP) such as net gain or loss from sales of depreciable real estate assets, impairment write-downs associated with depreciable real estate assets, impairments associated with the current expected credit losses on commercial loans and investments at the time of origination and repayment, including the pro rata share of such adjustments of unconsolidated subsidiaries, non-cash revenues and expenses such as straight-line rental revenue, amortization of deferred financing costs, gains and losses recognized on the extinguishment of debt, above- and below-market lease related intangibles, non-cash compensation, other non-recurring items such as termination fees, forfeitures of tenant security deposits, and other non-recurring items, and other non-cash income or expense. Interest expense, general and administrative expenses, investment and other income or loss, income tax benefit or expense, management fee income, and interest income from commercial loans and investments are also excluded from Same-Property NOI. GAAP net income or loss is further adjusted to remove the impact of properties that were not owned for the full current and prior year reporting periods presented. Cash rental income received under the leases pertaining to the Company’s assets that are presented as commercial loans and investments in accordance with GAAP is also used in lieu of the interest income equivalent. FFO is used by management, investors and analysts to facilitate meaningful comparisons of operating performance between periods and among our peers primarily because it excludes the effect of real estate depreciation and amortization and net gains or losses on sales, which are based on historical costs and implicitly assume that the value of real estate diminishes predictably over time, rather than fluctuating based on existing market conditions. We believe that Core FFO and AFFO are additional useful supplemental measures for investors to consider because they will help them to better assess our operating performance without the distortions created by other non-cash revenues or expenses. We also believe that Pro Forma Adjusted EBITDA is an additional useful supplemental measure for investors to consider as it allows for a better assessment of our operating performance without the distortions created by other non-cash revenues, expenses or certain effects of the Company’s capital structure on our operating performance. We use Same-Property NOI to compare the operating performance of our assets between periods. It is an accepted and important measurement used by management, investors and analysts because it includes all property-level revenues from the Company’s properties, less operating and maintenance expenses, real estate taxes and other property-specific expenses (“Net Operating Income” or “NOI”) of properties that have been owned and stabilized for the entire current and prior year reporting periods. Same-Property NOI attempts to eliminate differences due to the acquisition or disposition of properties during the particular period presented, and therefore provides a more comparable and consistent performance measure for the comparison of the Company’s properties. FFO, Core FFO, AFFO, Pro Forma Adjusted EBITDA, and Same-Property NOI may not be comparable to similarly titled measures employed by other companies. |
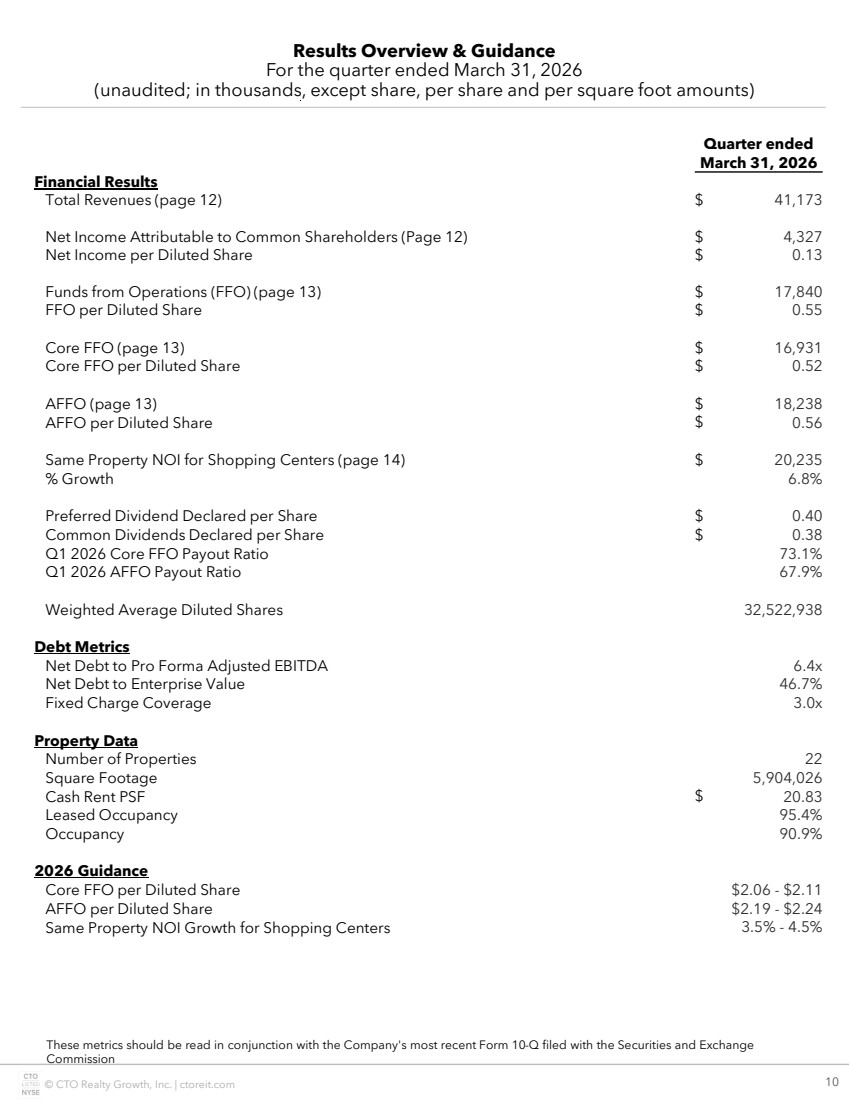
| © CTO Realty Growth, Inc. | ctoreit.com 10 Results Overview & Guidance For the quarter ended March 31, 2026 (unaudited; in thousands, except share, per share and per square foot amounts) Quarter ended March 31, 2026 Financial Results Total Revenues (page 12) $ 41,173 Net Income Attributable to Common Shareholders (Page 12) $ 4,327 Net Income per Diluted Share $ 0.13 Funds from Operations (FFO) (page 13) $ 17,840 FFO per Diluted Share $ 0.55 Core FFO (page 13) $ 16,931 Core FFO per Diluted Share $ 0.52 AFFO (page 13) $ 18,238 AFFO per Diluted Share $ 0.56 Same Property NOI for Shopping Centers (page 14) $ 20,235 % Growth 6.8% Preferred Dividend Declared per Share $ 0.40 Common Dividends Declared per Share $ 0.38 Q1 2026 Core FFO Payout Ratio 73.1% Q1 2026 AFFO Payout Ratio 67.9% Weighted Average Diluted Shares 32,522,938 Debt Metrics Net Debt to Pro Forma Adjusted EBITDA 6.4x Net Debt to Enterprise Value 46.7% Fixed Charge Coverage 3.0x Property Data Number of Properties 22 Square Footage 5,904,026 Cash Rent PSF $ 20.83 Leased Occupancy 95.4% Occupancy 90.9% 2026 Guidance Core FFO per Diluted Share $2.06 - $2.11 AFFO per Diluted Share $2.19 - $2.24 Same Property NOI Growth for Shopping Centers 3.5% - 4.5% These metrics should be read in conjunction with the Company's most recent Form 10-Q filed with the Securities and Exchange Commission |
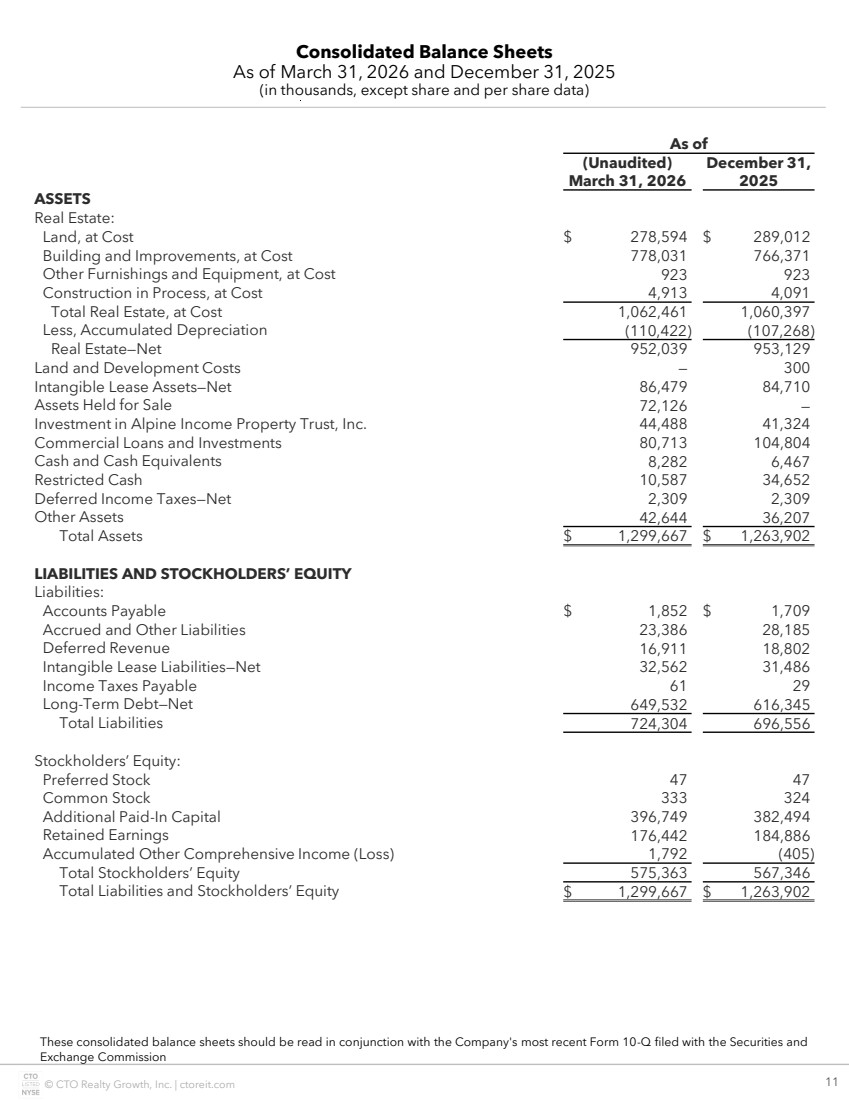
| © CTO Realty Growth, Inc. | ctoreit.com 11 Consolidated Balance Sheets As of March 31, 2026 and December 31, 2025 (in thousands, except share and per share data) As of (Unaudited) March 31, 2026 December 31, 2025 ASSETS Real Estate: Land, at Cost $ 278,594 $ 289,012 Building and Improvements, at Cost 778,031 766,371 Other Furnishings and Equipment, at Cost 923 923 Construction in Process, at Cost 4,913 4,091 Total Real Estate, at Cost 1,062,461 1,060,397 Less, Accumulated Depreciation (110,422) (107,268) Real Estate—Net 952,039 953,129 Land and Development Costs — 300 Intangible Lease Assets—Net 86,479 84,710 Assets Held for Sale 72,126 — Investment in Alpine Income Property Trust, Inc. 44,488 41,324 Commercial Loans and Investments 80,713 104,804 Cash and Cash Equivalents 8,282 6,467 Restricted Cash 10,587 34,652 Deferred Income Taxes—Net 2,309 2,309 Other Assets 42,644 36,207 Total Assets $ 1,299,667 $ 1,263,902 LIABILITIES AND STOCKHOLDERS’ EQUITY Liabilities: Accounts Payable $ 1,852 $ 1,709 Accrued and Other Liabilities 23,386 28,185 Deferred Revenue 16,911 18,802 Intangible Lease Liabilities—Net 32,562 31,486 Income Taxes Payable 61 29 Long-Term Debt—Net 649,532 616,345 Total Liabilities 724,304 696,556 Stockholders’ Equity: Preferred Stock 47 47 Common Stock 333 324 Additional Paid-In Capital 396,749 382,494 Retained Earnings 176,442 184,886 Accumulated Other Comprehensive Income (Loss) 1,792 (405) Total Stockholders’ Equity 575,363 567,346 Total Liabilities and Stockholders’ Equity $ 1,299,667 $ 1,263,902 These consolidated balance sheets should be read in conjunction with the Company's most recent Form 10-Q filed with the Securities and Exchange Commission |
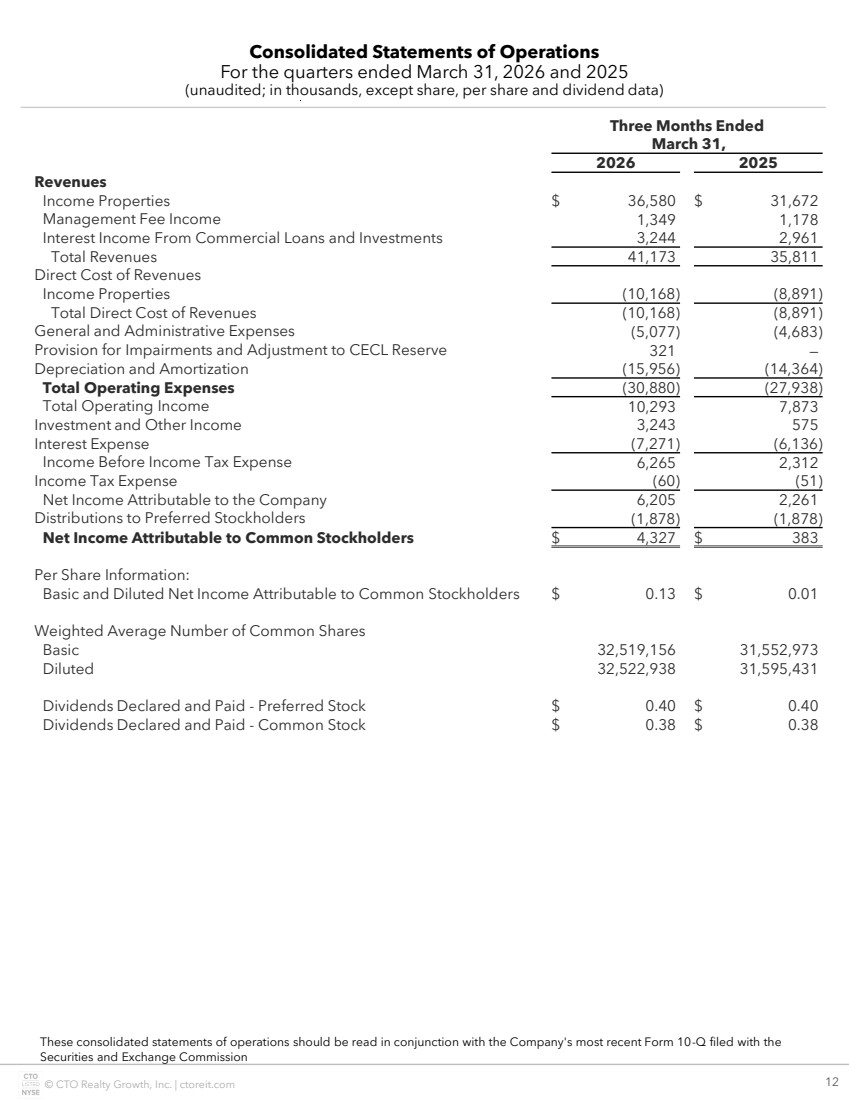
| © CTO Realty Growth, Inc. | ctoreit.com 12 Three Months Ended March 31, 2026 2025 Revenues Income Properties $ 36,580 $ 31,672 Management Fee Income 1,349 1,178 Interest Income From Commercial Loans and Investments 3,244 2,961 Total Revenues 41,173 35,811 Direct Cost of Revenues Income Properties (10,168) (8,891) Total Direct Cost of Revenues (10,168) (8,891) General and Administrative Expenses (5,077) (4,683) Provision for Impairments and Adjustment to CECL Reserve 321 — Depreciation and Amortization (15,956) (14,364) Total Operating Expenses (30,880) (27,938) Total Operating Income 10,293 7,873 Investment and Other Income 3,243 575 Interest Expense (7,271) (6,136) Income Before Income Tax Expense 6,265 2,312 Income Tax Expense (60) (51) Net Income Attributable to the Company 6,205 2,261 Distributions to Preferred Stockholders (1,878) (1,878) Net Income Attributable to Common Stockholders $ 4,327 $ 383 Per Share Information: Basic and Diluted Net Income Attributable to Common Stockholders $ 0.13 $ 0.01 Weighted Average Number of Common Shares Basic 32,519,156 31,552,973 Diluted 32,522,938 31,595,431 Dividends Declared and Paid - Preferred Stock $ 0.40 $ 0.40 Dividends Declared and Paid - Common Stock $ 0.38 $ 0.38 Consolidated Statements of Operations For the quarters ended March 31, 2026 and 2025 (unaudited; in thousands, except share, per share and dividend data) These consolidated statements of operations should be read in conjunction with the Company's most recent Form 10-Q filed with the Securities and Exchange Commission |
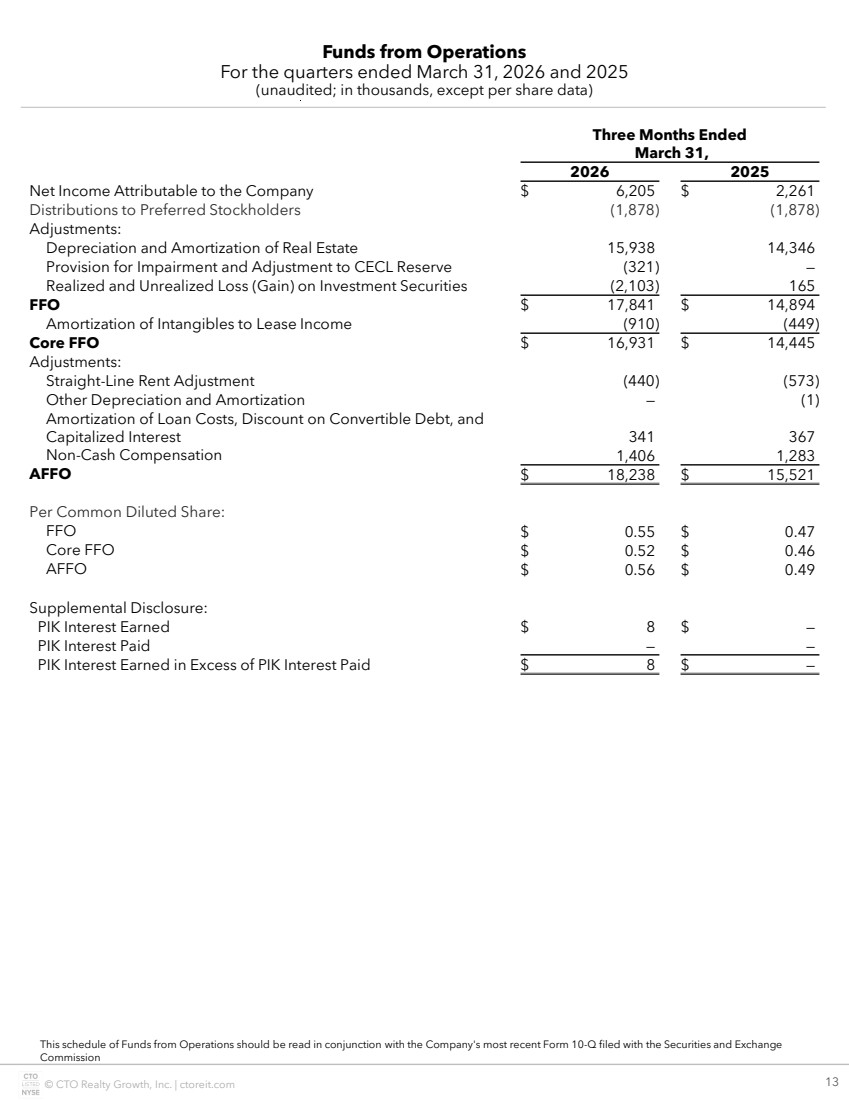
| © CTO Realty Growth, Inc. | ctoreit.com 13 Funds from Operations For the quarters ended March 31, 2026 and 2025 (unaudited; in thousands, except per share data) This schedule of Funds from Operations should be read in conjunction with the Company's most recent Form 10-Q filed with the Securities and Exchange Commission Three Months Ended March 31, 2026 2025 Net Income Attributable to the Company $ 6,205 $ 2,261 Distributions to Preferred Stockholders (1,878) (1,878) Adjustments: Depreciation and Amortization of Real Estate 15,938 14,346 Provision for Impairment and Adjustment to CECL Reserve (321) — Realized and Unrealized Loss (Gain) on Investment Securities (2,103) 165 FFO $ 17,841 $ 14,894 Amortization of Intangibles to Lease Income (910) (449) Core FFO $ 16,931 $ 14,445 Adjustments: Straight-Line Rent Adjustment (440) (573) Other Depreciation and Amortization — (1) Amortization of Loan Costs, Discount on Convertible Debt, and Capitalized Interest 341 367 Non-Cash Compensation 1,406 1,283 AFFO $ 18,238 $ 15,521 Per Common Diluted Share: FFO $ 0.55 $ 0.47 Core FFO $ 0.52 $ 0.46 AFFO $ 0.56 $ 0.49 Supplemental Disclosure: PIK Interest Earned $ 8 $ — PIK Interest Paid — — PIK Interest Earned in Excess of PIK Interest Paid $ 8 $ — |
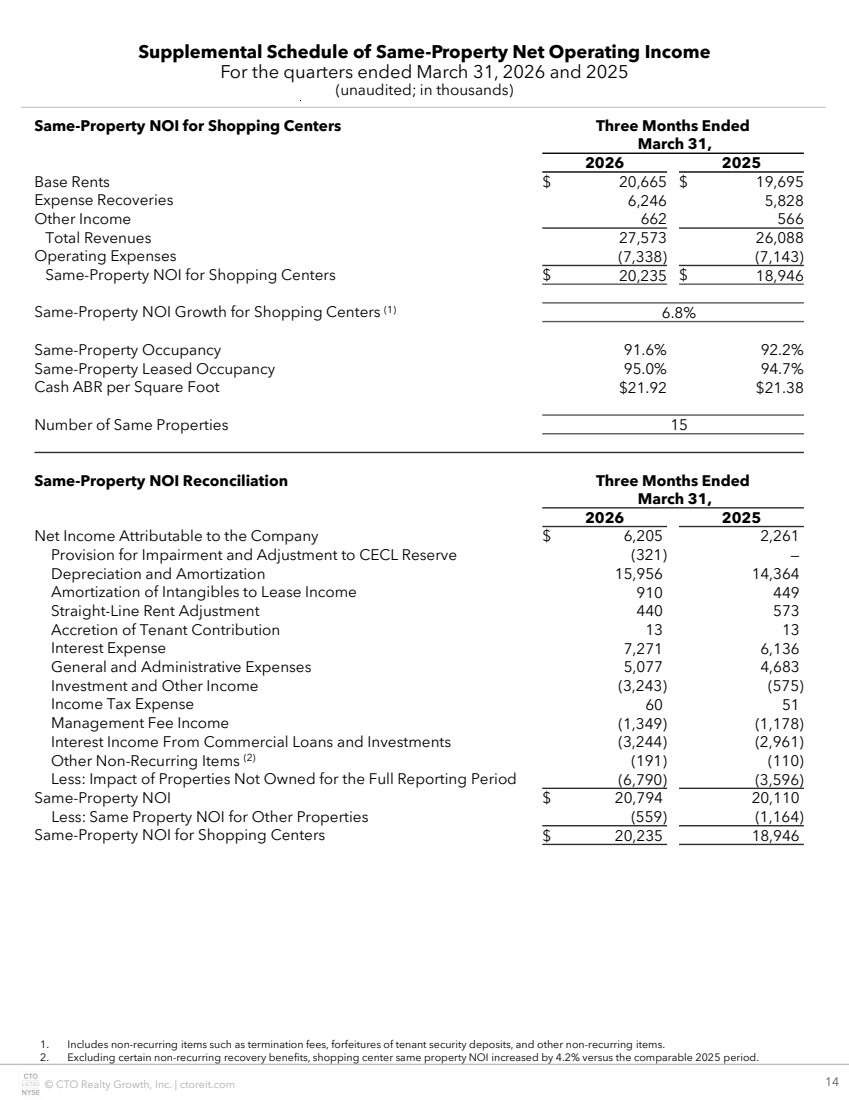
| © CTO Realty Growth, Inc. | ctoreit.com 14 Supplemental Schedule of Same-Property Net Operating Income For the quarters ended March 31, 2026 and 2025 (unaudited; in thousands) 1. Includes non-recurring items such as termination fees, forfeitures of tenant security deposits, and other non-recurring items. 2. Excluding certain non-recurring recovery benefits, shopping center same property NOI increased by 4.2% versus the comparable 2025 period. Same-Property NOI for Shopping Centers Three Months Ended March 31, 2026 2025 Base Rents $ 20,665 $ 19,695 Expense Recoveries 6,246 5,828 Other Income 662 566 Total Revenues 27,573 26,088 Operating Expenses (7,338) (7,143) Same-Property NOI for Shopping Centers $ 20,235 $ 18,946 Same-Property NOI Growth for Shopping Centers (1) 6.8% Same-Property Occupancy 91.6% 92.2% Same-Property Leased Occupancy 95.0% 94.7% Cash ABR per Square Foot $21.92 $21.38 Number of Same Properties 15 Same-Property NOI Reconciliation Three Months Ended March 31, 2026 2025 Net Income Attributable to the Company $ 6,205 2,261 Provision for Impairment and Adjustment to CECL Reserve (321) — Depreciation and Amortization 15,956 14,364 Amortization of Intangibles to Lease Income 910 449 Straight-Line Rent Adjustment 440 573 Accretion of Tenant Contribution 13 13 Interest Expense 7,271 6,136 General and Administrative Expenses 5,077 4,683 Investment and Other Income (3,243) (575) Income Tax Expense 60 51 Management Fee Income (1,349) (1,178) Interest Income From Commercial Loans and Investments (3,244) (2,961) Other Non-Recurring Items (2) (191) (110) Less: Impact of Properties Not Owned for the Full Reporting Period (6,790) (3,596) Same-Property NOI $ 20,794 20,110 Less: Same Property NOI for Other Properties (559) (1,164) Same-Property NOI for Shopping Centers $ 20,235 18,946 |
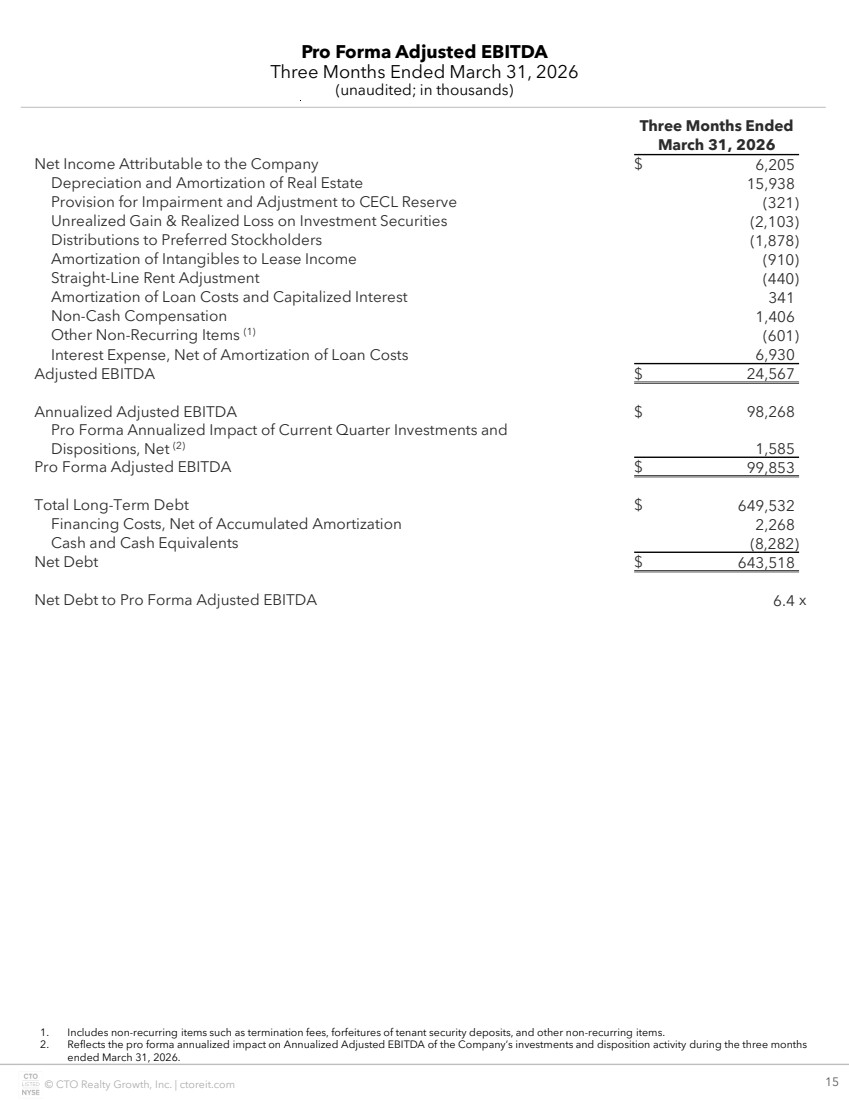
| © CTO Realty Growth, Inc. | ctoreit.com 15 Pro Forma Adjusted EBITDA Three Months Ended March 31, 2026 (unaudited; in thousands) Three Months Ended March 31, 2026 Net Income Attributable to the Company $ 6,205 Depreciation and Amortization of Real Estate 15,938 Provision for Impairment and Adjustment to CECL Reserve (321) Unrealized Gain & Realized Loss on Investment Securities (2,103) Distributions to Preferred Stockholders (1,878) Amortization of Intangibles to Lease Income (910) Straight-Line Rent Adjustment (440) Amortization of Loan Costs and Capitalized Interest 341 Non-Cash Compensation 1,406 Other Non-Recurring Items (1) (601) Interest Expense, Net of Amortization of Loan Costs 6,930 Adjusted EBITDA $ 24,567 Annualized Adjusted EBITDA $ 98,268 Pro Forma Annualized Impact of Current Quarter Investments and Dispositions, Net (2) 1,585 Pro Forma Adjusted EBITDA $ 99,853 Total Long-Term Debt $ 649,532 Financing Costs, Net of Accumulated Amortization 2,268 Cash and Cash Equivalents (8,282) Net Debt $ 643,518 Net Debt to Pro Forma Adjusted EBITDA 6.4 x 1. Includes non-recurring items such as termination fees, forfeitures of tenant security deposits, and other non-recurring items. 2. Reflects the pro forma annualized impact on Annualized Adjusted EBITDA of the Company’s investments and disposition activity during the three months ended March 31, 2026. |
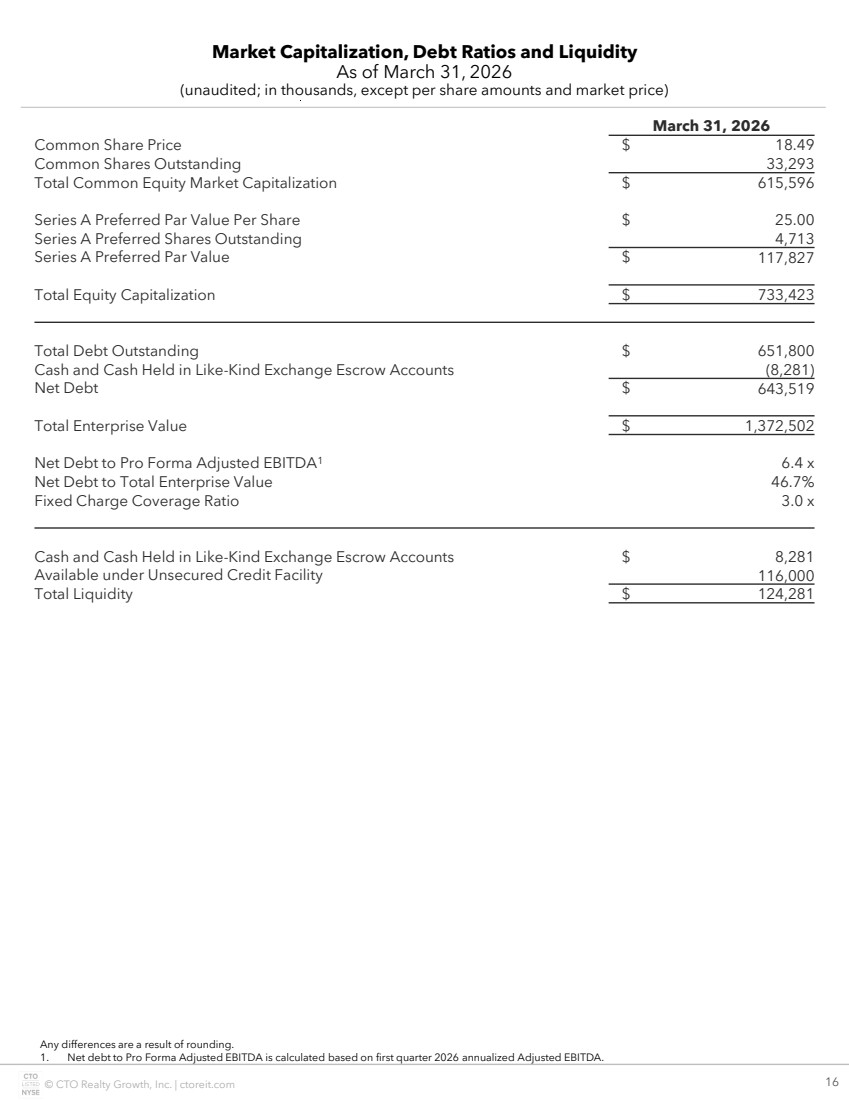
| © CTO Realty Growth, Inc. | ctoreit.com 16 Market Capitalization, Debt Ratios and Liquidity As of March 31, 2026 (unaudited; in thousands, except per share amounts and market price) Any differences are a result of rounding. 1. Net debt to Pro Forma Adjusted EBITDA is calculated based on first quarter 2026 annualized Adjusted EBITDA. March 31, 2026 Common Share Price $ 18.49 Common Shares Outstanding 33,293 Total Common Equity Market Capitalization $ 615,596 Series A Preferred Par Value Per Share $ 25.00 Series A Preferred Shares Outstanding 4,713 Series A Preferred Par Value $ 117,827 Total Equity Capitalization $ 733,423 Total Debt Outstanding $ 651,800 Cash and Cash Held in Like-Kind Exchange Escrow Accounts (8,281) Net Debt $ 643,519 Total Enterprise Value $ 1,372,502 Net Debt to Pro Forma Adjusted EBITDA1 6.4 x Net Debt to Total Enterprise Value 46.7% Fixed Charge Coverage Ratio 3.0 x Cash and Cash Held in Like-Kind Exchange Escrow Accounts $ 8,281 Available under Unsecured Credit Facility 116,000 Total Liquidity $ 124,281 |
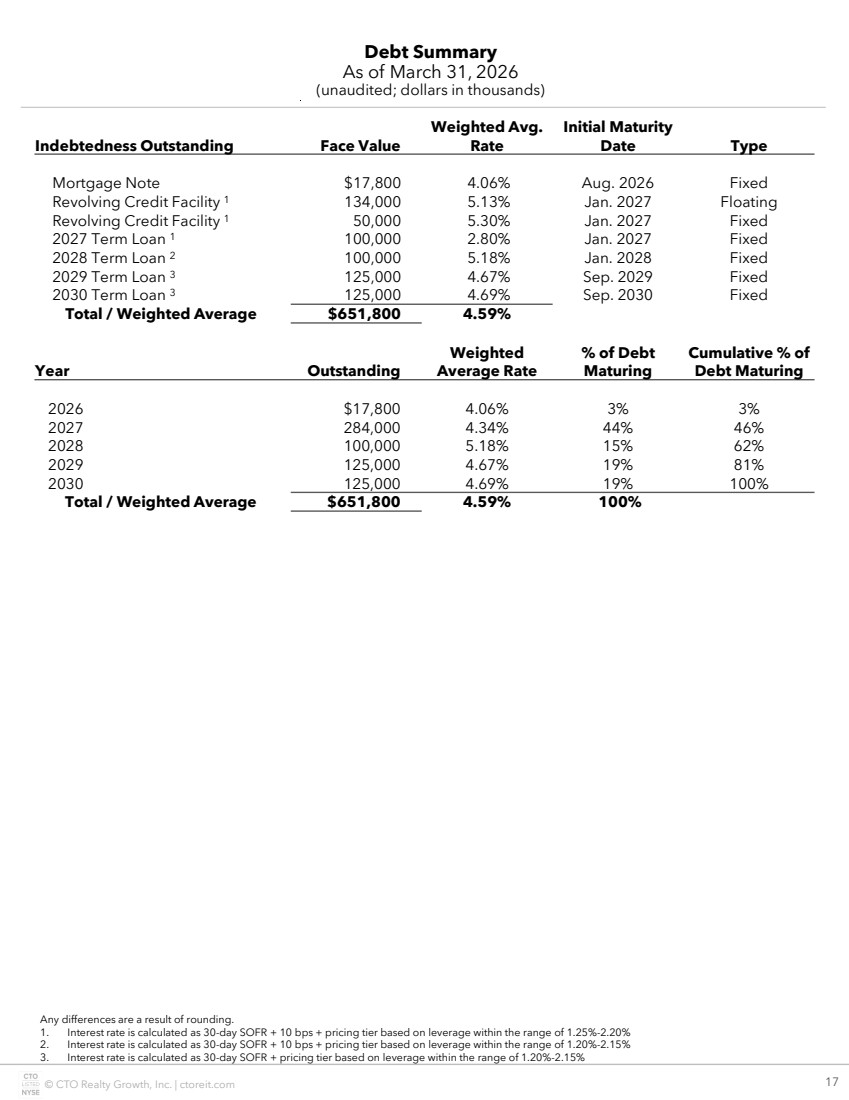
| © CTO Realty Growth, Inc. | ctoreit.com 17 Debt Summary As of March 31, 2026 (unaudited; dollars in thousands) Any differences are a result of rounding. 1. Interest rate is calculated as 30-day SOFR + 10 bps + pricing tier based on leverage within the range of 1.25%-2.20% 2. Interest rate is calculated as 30-day SOFR + 10 bps + pricing tier based on leverage within the range of 1.20%-2.15% 3. Interest rate is calculated as 30-day SOFR + pricing tier based on leverage within the range of 1.20%-2.15% Indebtedness Outstanding Face Value Weighted Avg. Rate Initial Maturity Date Type Mortgage Note $17,800 4.06% Aug. 2026 Fixed Revolving Credit Facility 1 134,000 5.13% Jan. 2027 Floating Revolving Credit Facility 1 50,000 5.30% Jan. 2027 Fixed 2027 Term Loan 1 100,000 2.80% Jan. 2027 Fixed 2028 Term Loan 2 100,000 5.18% Jan. 2028 Fixed 2029 Term Loan 3 125,000 4.67% Sep. 2029 Fixed 2030 Term Loan 3 125,000 4.69% Sep. 2030 Fixed Total / Weighted Average $651,800 4.59% Year Outstanding Weighted Average Rate % of Debt Maturing Cumulative % of Debt Maturing 2026 $17,800 4.06% 3% 3% 2027 284,000 4.34% 44% 46% 2028 100,000 5.18% 15% 62% 2029 125,000 4.67% 19% 81% 2030 125,000 4.69% 19% 100% Total / Weighted Average $651,800 4.59% 100% |
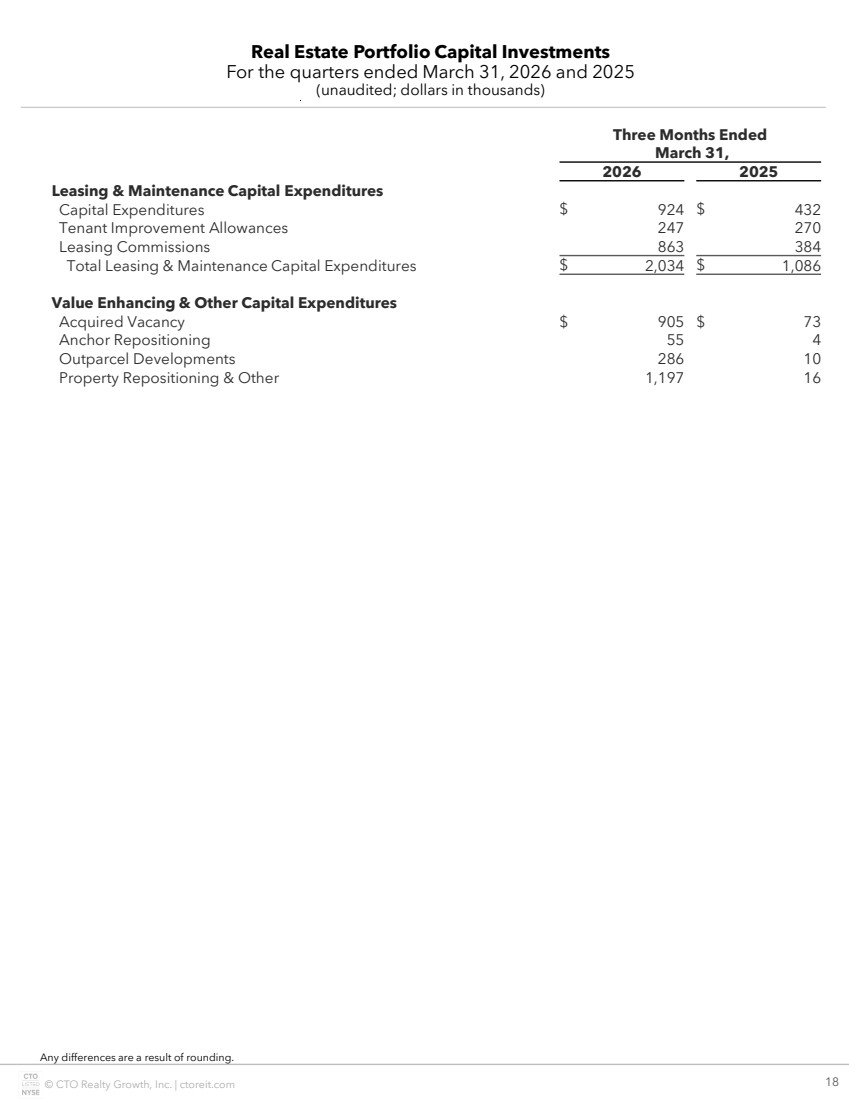
| © CTO Realty Growth, Inc. | ctoreit.com 18 Real Estate Portfolio Capital Investments For the quarters ended March 31, 2026 and 2025 (unaudited; dollars in thousands) Any differences are a result of rounding. Three Months Ended March 31, 2026 2025 Leasing & Maintenance Capital Expenditures Capital Expenditures $ 924 $ 432 Tenant Improvement Allowances 247 270 Leasing Commissions 863 384 Total Leasing & Maintenance Capital Expenditures $ 2,034 $ 1,086 Value Enhancing & Other Capital Expenditures Acquired Vacancy $ 905 $ 73 Anchor Repositioning 55 4 Outparcel Developments 286 10 Property Repositioning & Other 1,197 16 |
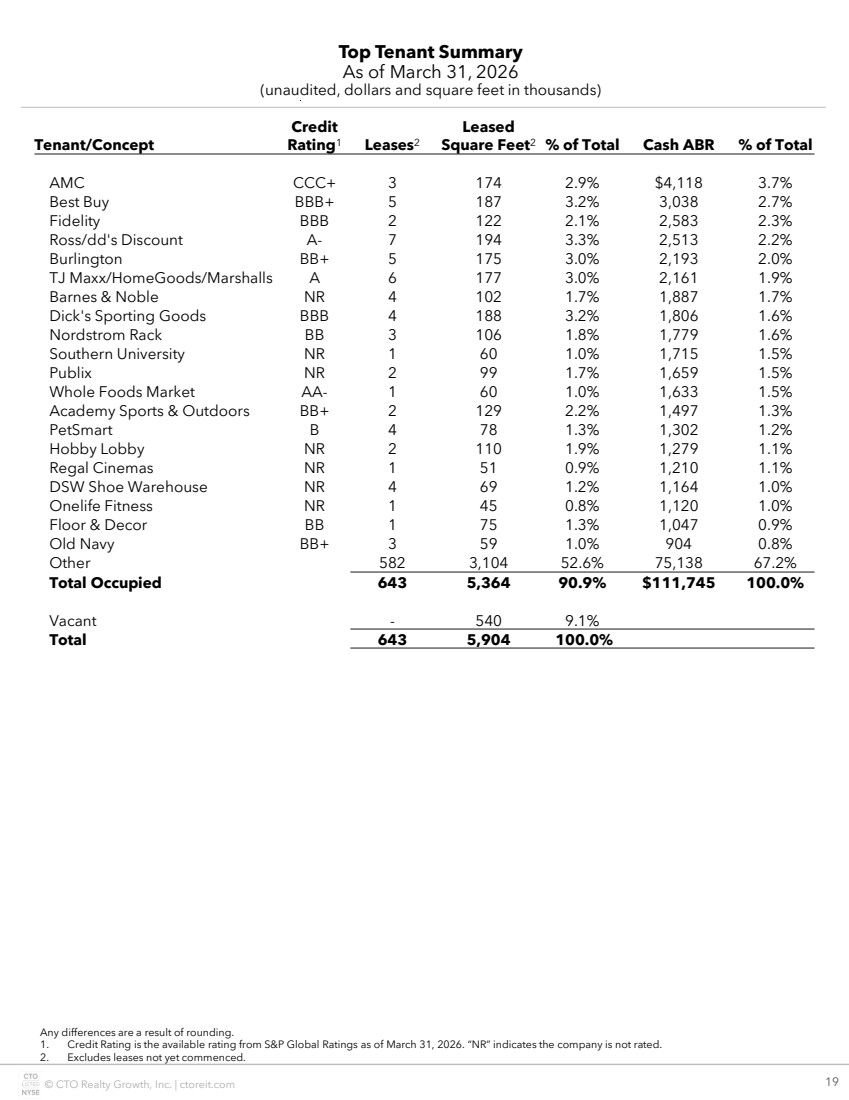
| © CTO Realty Growth, Inc. | ctoreit.com 19 Top Tenant Summary As of March 31, 2026 (unaudited, dollars and square feet in thousands) Any differences are a result of rounding. 1. Credit Rating is the available rating from S&P Global Ratings as of March 31, 2026. “NR” indicates the company is not rated. 2. Excludes leases not yet commenced. Tenant/Concept Credit Rating1 Leases2 Leased Square Feet2 % of Total Cash ABR % of Total AMC CCC+ 3 174 2.9% $4,118 3.7% Best Buy BBB+ 5 187 3.2% 3,038 2.7% Fidelity BBB 2 122 2.1% 2,583 2.3% Ross/dd's Discount A- 7 194 3.3% 2,513 2.2% Burlington BB+ 5 175 3.0% 2,193 2.0% TJ Maxx/HomeGoods/Marshalls A 6 177 3.0% 2,161 1.9% Barnes & Noble NR 4 102 1.7% 1,887 1.7% Dick's Sporting Goods BBB 4 188 3.2% 1,806 1.6% Nordstrom Rack BB 3 106 1.8% 1,779 1.6% Southern University NR 1 60 1.0% 1,715 1.5% Publix NR 2 99 1.7% 1,659 1.5% Whole Foods Market AA- 1 60 1.0% 1,633 1.5% Academy Sports & Outdoors BB+ 2 129 2.2% 1,497 1.3% PetSmart B 4 78 1.3% 1,302 1.2% Hobby Lobby NR 2 110 1.9% 1,279 1.1% Regal Cinemas NR 1 51 0.9% 1,210 1.1% DSW Shoe Warehouse NR 4 69 1.2% 1,164 1.0% Onelife Fitness NR 1 45 0.8% 1,120 1.0% Floor & Decor BB 1 75 1.3% 1,047 0.9% Old Navy BB+ 3 59 1.0% 904 0.8% Other 582 3,104 52.6% 75,138 67.2% Total Occupied 643 5,364 90.9% $111,745 100.0% Vacant - 540 9.1% Total 643 5,904 100.0% |
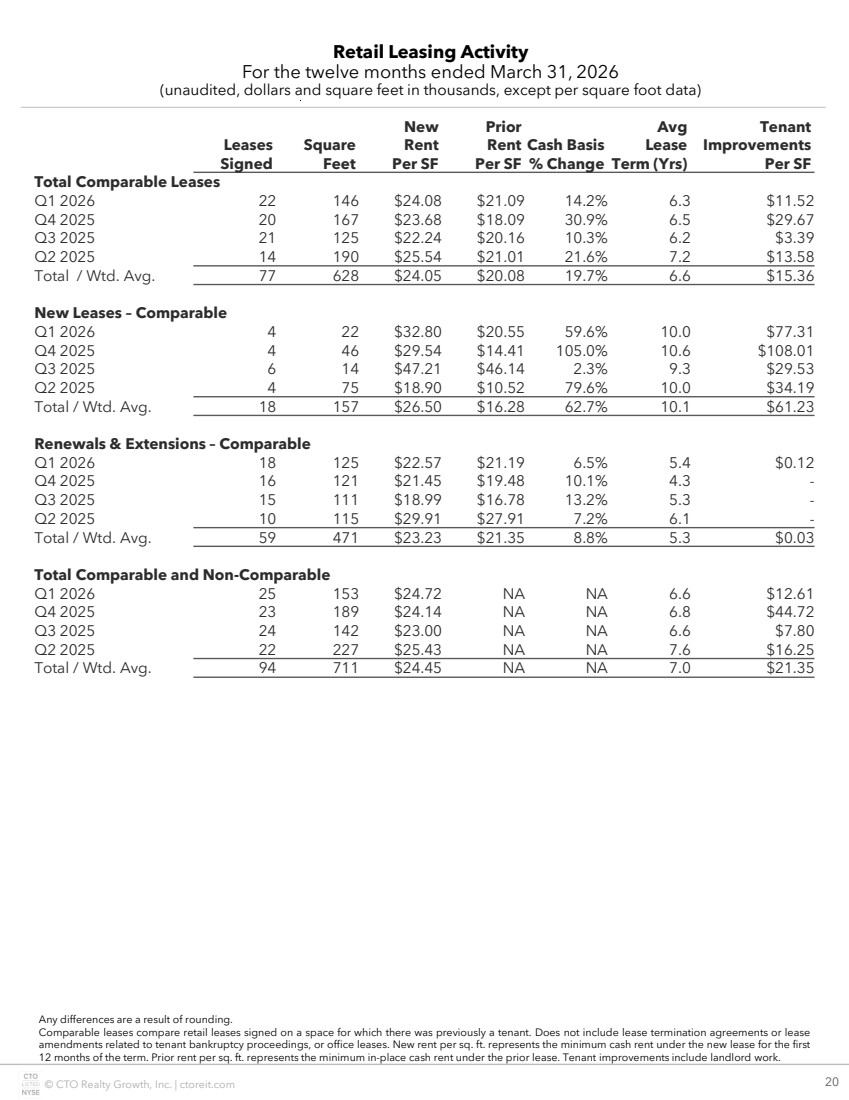
| © CTO Realty Growth, Inc. | ctoreit.com 20 Retail Leasing Activity For the twelve months ended March 31, 2026 (unaudited, dollars and square feet in thousands, except per square foot data) Any differences are a result of rounding. Comparable leases compare retail leases signed on a space for which there was previously a tenant. Does not include lease termination agreements or lease amendments related to tenant bankruptcy proceedings, or office leases. New rent per sq. ft. represents the minimum cash rent under the new lease for the first 12 months of the term. Prior rent per sq. ft. represents the minimum in-place cash rent under the prior lease. Tenant improvements include landlord work. Leases Signed Square Feet New Rent Per SF Prior Rent Per SF Cash Basis % Change Avg Lease Term (Yrs) Tenant Improvements Per SF Total Comparable Leases Q1 2026 22 146 $24.08 $21.09 14.2% 6.3 $11.52 Q4 2025 20 167 $23.68 $18.09 30.9% 6.5 $29.67 Q3 2025 21 125 $22.24 $20.16 10.3% 6.2 $3.39 Q2 2025 14 190 $25.54 $21.01 21.6% 7.2 $13.58 Total / Wtd. Avg. 77 628 $24.05 $20.08 19.7% 6.6 $15.36 New Leases – Comparable Q1 2026 4 22 $32.80 $20.55 59.6% 10.0 $77.31 Q4 2025 4 46 $29.54 $14.41 105.0% 10.6 $108.01 Q3 2025 6 14 $47.21 $46.14 2.3% 9.3 $29.53 Q2 2025 4 75 $18.90 $10.52 79.6% 10.0 $34.19 Total / Wtd. Avg. 18 157 $26.50 $16.28 62.7% 10.1 $61.23 Renewals & Extensions – Comparable Q1 2026 18 125 $22.57 $21.19 6.5% 5.4 $0.12 Q4 2025 16 121 $21.45 $19.48 10.1% 4.3 - Q3 2025 15 111 $18.99 $16.78 13.2% 5.3 - Q2 2025 10 115 $29.91 $27.91 7.2% 6.1 - Total / Wtd. Avg. 59 471 $23.23 $21.35 8.8% 5.3 $0.03 Total Comparable and Non-Comparable Q1 2026 25 153 $24.72 NA NA 6.6 $12.61 Q4 2025 23 189 $24.14 NA NA 6.8 $44.72 Q3 2025 24 142 $23.00 NA NA 6.6 $7.80 Q2 2025 22 227 $25.43 NA NA 7.6 $16.25 Total / Wtd. Avg. 94 711 $24.45 NA NA 7.0 $21.35 |
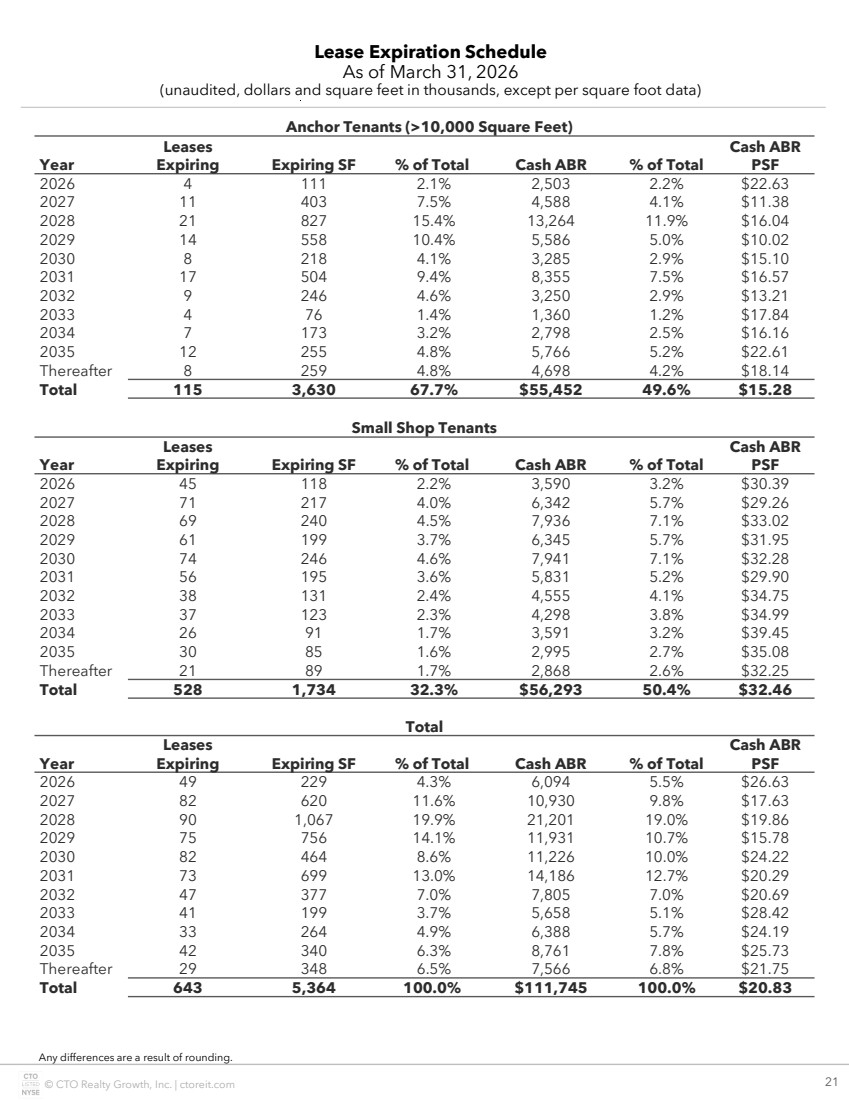
| © CTO Realty Growth, Inc. | ctoreit.com 21 Lease Expiration Schedule As of March 31, 2026 (unaudited, dollars and square feet in thousands, except per square foot data) Any differences are a result of rounding. Anchor Tenants (>10,000 Square Feet) Year Leases Expiring Expiring SF % of Total Cash ABR % of Total Cash ABR PSF 2026 4 111 2.1% 2,503 2.2% $22.63 2027 11 403 7.5% 4,588 4.1% $11.38 2028 21 827 15.4% 13,264 11.9% $16.04 2029 14 558 10.4% 5,586 5.0% $10.02 2030 8 218 4.1% 3,285 2.9% $15.10 2031 17 504 9.4% 8,355 7.5% $16.57 2032 9 246 4.6% 3,250 2.9% $13.21 2033 4 76 1.4% 1,360 1.2% $17.84 2034 7 173 3.2% 2,798 2.5% $16.16 2035 12 255 4.8% 5,766 5.2% $22.61 Thereafter 8 259 4.8% 4,698 4.2% $18.14 Total 115 3,630 67.7% $55,452 49.6% $15.28 Small Shop Tenants Year Leases Expiring Expiring SF % of Total Cash ABR % of Total Cash ABR PSF 2026 45 118 2.2% 3,590 3.2% $30.39 2027 71 217 4.0% 6,342 5.7% $29.26 2028 69 240 4.5% 7,936 7.1% $33.02 2029 61 199 3.7% 6,345 5.7% $31.95 2030 74 246 4.6% 7,941 7.1% $32.28 2031 56 195 3.6% 5,831 5.2% $29.90 2032 38 131 2.4% 4,555 4.1% $34.75 2033 37 123 2.3% 4,298 3.8% $34.99 2034 26 91 1.7% 3,591 3.2% $39.45 2035 30 85 1.6% 2,995 2.7% $35.08 Thereafter 21 89 1.7% 2,868 2.6% $32.25 Total 528 1,734 32.3% $56,293 50.4% $32.46 Total Year Leases Expiring Expiring SF % of Total Cash ABR % of Total Cash ABR PSF 2026 49 229 4.3% 6,094 5.5% $26.63 2027 82 620 11.6% 10,930 9.8% $17.63 2028 90 1,067 19.9% 21,201 19.0% $19.86 2029 75 756 14.1% 11,931 10.7% $15.78 2030 82 464 8.6% 11,226 10.0% $24.22 2031 73 699 13.0% 14,186 12.7% $20.29 2032 47 377 7.0% 7,805 7.0% $20.69 2033 41 199 3.7% 5,658 5.1% $28.42 2034 33 264 4.9% 6,388 5.7% $24.19 2035 42 340 6.3% 8,761 7.8% $25.73 Thereafter 29 348 6.5% 7,566 6.8% $21.75 Total 643 5,364 100.0% $111,745 100.0% $20.83 |
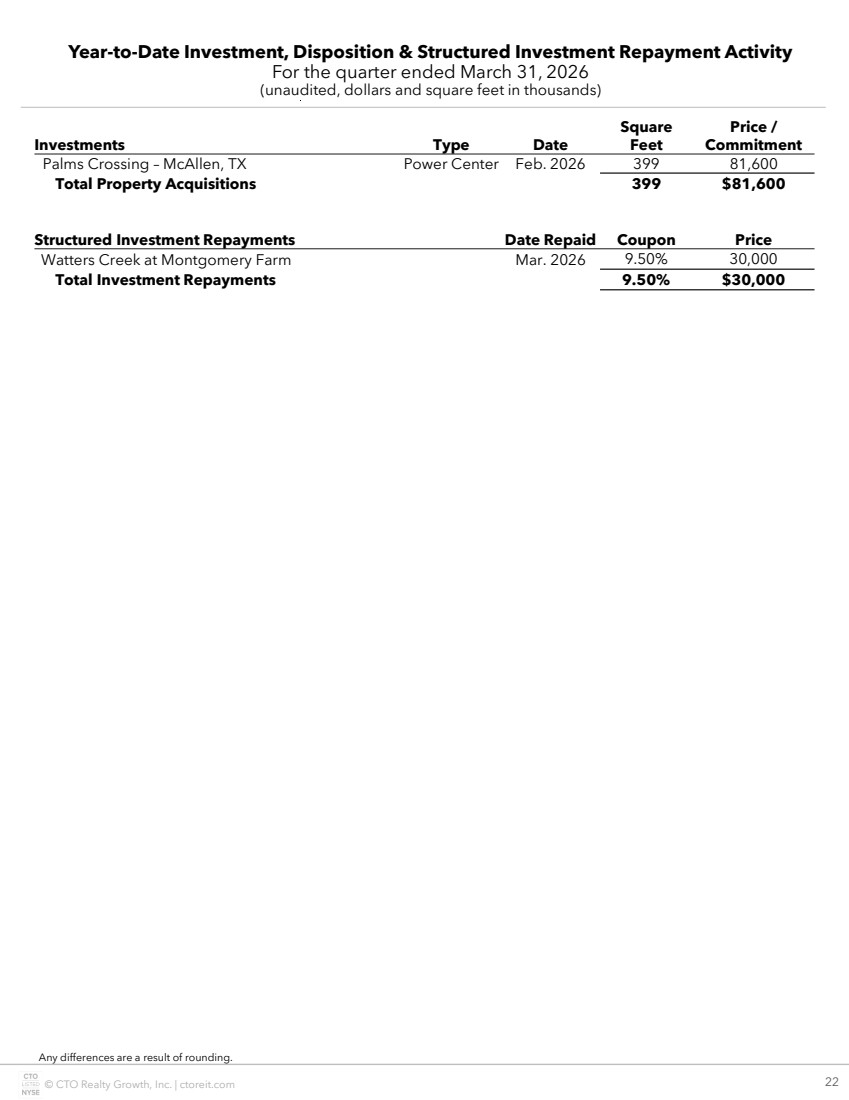
| © CTO Realty Growth, Inc. | ctoreit.com 22 Year-to-Date Investment, Disposition & Structured Investment Repayment Activity For the quarter ended March 31, 2026 (unaudited, dollars and square feet in thousands) Any differences are a result of rounding. Investments Type Date Square Feet Price / Commitment Palms Crossing – McAllen, TX Power Center Feb. 2026 399 81,600 Total Property Acquisitions 399 $81,600 Structured Investment Repayments Date Repaid Coupon Price Watters Creek at Montgomery Farm Mar. 2026 9.50% 30,000 Total Investment Repayments 9.50% $30,000 |
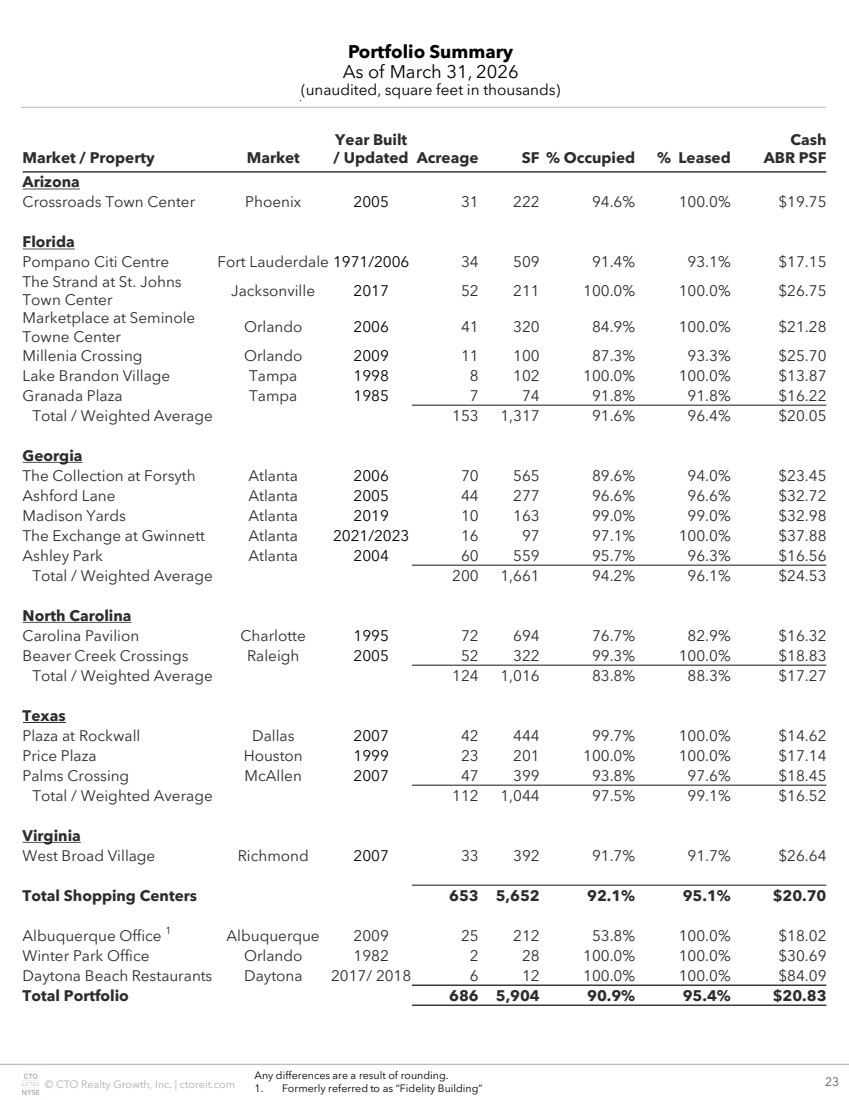
| © CTO Realty Growth, Inc. | ctoreit.com 23 Portfolio Summary As of March 31, 2026 (unaudited, square feet in thousands) Any differences are a result of rounding. 1. Formerly referred to as “Fidelity Building” Market / Property Market Year Built / Updated Acreage SF % Occupied % Leased Cash ABR PSF Arizona Crossroads Town Center Phoenix 2005 31 222 94.6% 100.0% $19.75 Florida Pompano Citi Centre Fort Lauderdale 1971/2006 34 509 91.4% 93.1% $17.15 The Strand at St. Johns Town Center Jacksonville 2017 52 211 100.0% 100.0% $26.75 Marketplace at Seminole Towne Center Orlando 2006 41 320 84.9% 100.0% $21.28 Millenia Crossing Orlando 2009 11 100 87.3% 93.3% $25.70 Lake Brandon Village Tampa 1998 8 102 100.0% 100.0% $13.87 Granada Plaza Tampa 1985 7 74 91.8% 91.8% $16.22 Total / Weighted Average 153 1,317 91.6% 96.4% $20.05 Georgia The Collection at Forsyth Atlanta 2006 70 565 89.6% 94.0% $23.45 Ashford Lane Atlanta 2005 44 277 96.6% 96.6% $32.72 Madison Yards Atlanta 2019 10 163 99.0% 99.0% $32.98 The Exchange at Gwinnett Atlanta 2021/2023 16 97 97.1% 100.0% $37.88 Ashley Park Atlanta 2004 60 559 95.7% 96.3% $16.56 Total / Weighted Average 200 1,661 94.2% 96.1% $24.53 North Carolina Carolina Pavilion Charlotte 1995 72 694 76.7% 82.9% $16.32 Beaver Creek Crossings Raleigh 2005 52 322 99.3% 100.0% $18.83 Total / Weighted Average 124 1,016 83.8% 88.3% $17.27 Texas Plaza at Rockwall Dallas 2007 42 444 99.7% 100.0% $14.62 Price Plaza Houston 1999 23 201 100.0% 100.0% $17.14 Palms Crossing McAllen 2007 47 399 93.8% 97.6% $18.45 Total / Weighted Average 112 1,044 97.5% 99.1% $16.52 Virginia West Broad Village Richmond 2007 33 392 91.7% 91.7% $26.64 Total Shopping Centers 653 5,652 92.1% 95.1% $20.70 Albuquerque Office 1 Albuquerque 2009 25 212 53.8% 100.0% $18.02 Winter Park Office Orlando 1982 2 28 100.0% 100.0% $30.69 Daytona Beach Restaurants Daytona 2017/ 2018 6 12 100.0% 100.0% $84.09 Total Portfolio 686 5,904 90.9% 95.4% $20.83 |
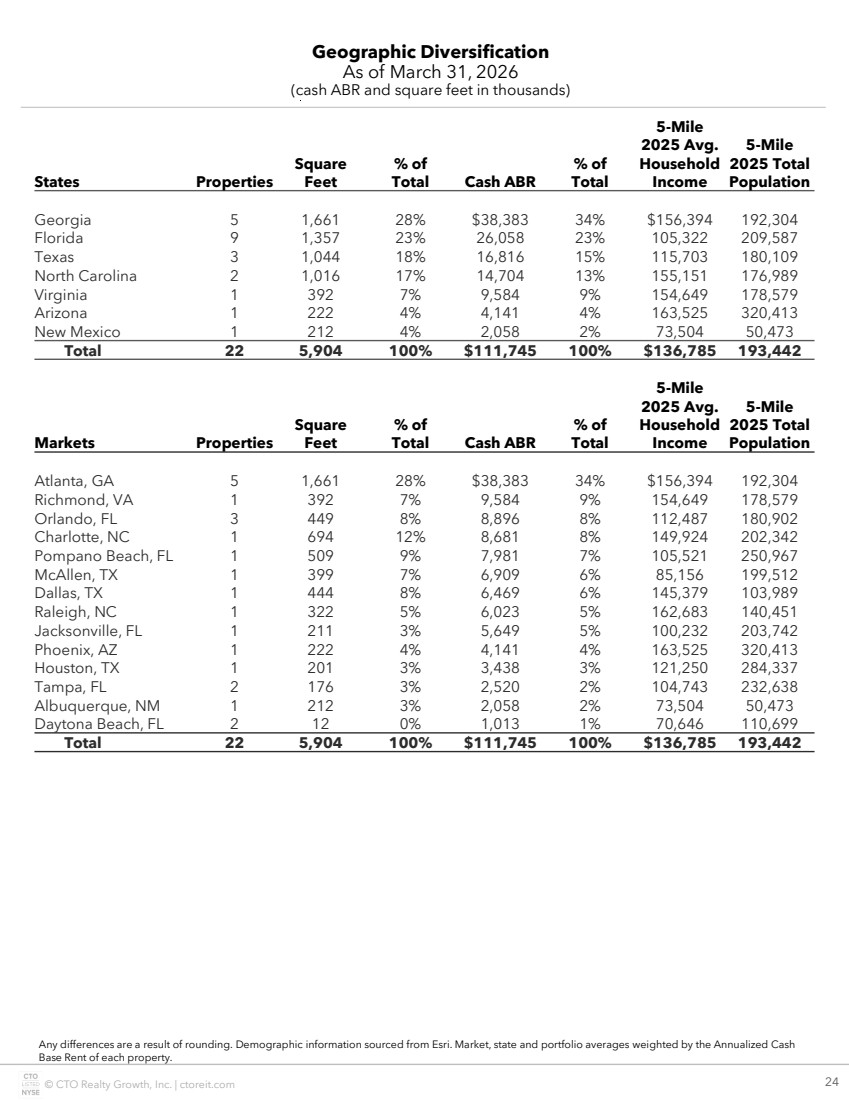
| © CTO Realty Growth, Inc. | ctoreit.com 24 Geographic Diversification As of March 31, 2026 (cash ABR and square feet in thousands) Any differences are a result of rounding. Demographic information sourced from Esri. Market, state and portfolio averages weighted by the Annualized Cash Base Rent of each property. States Properties Square Feet % of Total Cash ABR % of Total 5-Mile 2025 Avg. Household Income 5-Mile 2025 Total Population Georgia 5 1,661 28% $38,383 34% $156,394 192,304 Florida 9 1,357 23% 26,058 23% 105,322 209,587 Texas 3 1,044 18% 16,816 15% 115,703 180,109 North Carolina 2 1,016 17% 14,704 13% 155,151 176,989 Virginia 1 392 7% 9,584 9% 154,649 178,579 Arizona 1 222 4% 4,141 4% 163,525 320,413 New Mexico 1 212 4% 2,058 2% 73,504 50,473 Total 22 5,904 100% $111,745 100% $136,785 193,442 Markets Properties Square Feet % of Total Cash ABR % of Total 5-Mile 2025 Avg. Household Income 5-Mile 2025 Total Population Atlanta, GA 5 1,661 28% $38,383 34% $156,394 192,304 Richmond, VA 1 392 7% 9,584 9% 154,649 178,579 Orlando, FL 3 449 8% 8,896 8% 112,487 180,902 Charlotte, NC 1 694 12% 8,681 8% 149,924 202,342 Pompano Beach, FL 1 509 9% 7,981 7% 105,521 250,967 McAllen, TX 1 399 7% 6,909 6% 85,156 199,512 Dallas, TX 1 444 8% 6,469 6% 145,379 103,989 Raleigh, NC 1 322 5% 6,023 5% 162,683 140,451 Jacksonville, FL 1 211 3% 5,649 5% 100,232 203,742 Phoenix, AZ 1 222 4% 4,141 4% 163,525 320,413 Houston, TX 1 201 3% 3,438 3% 121,250 284,337 Tampa, FL 2 176 3% 2,520 2% 104,743 232,638 Albuquerque, NM 1 212 3% 2,058 2% 73,504 50,473 Daytona Beach, FL 2 12 0% 1,013 1% 70,646 110,699 Total 22 5,904 100% $111,745 100% $136,785 193,442 |
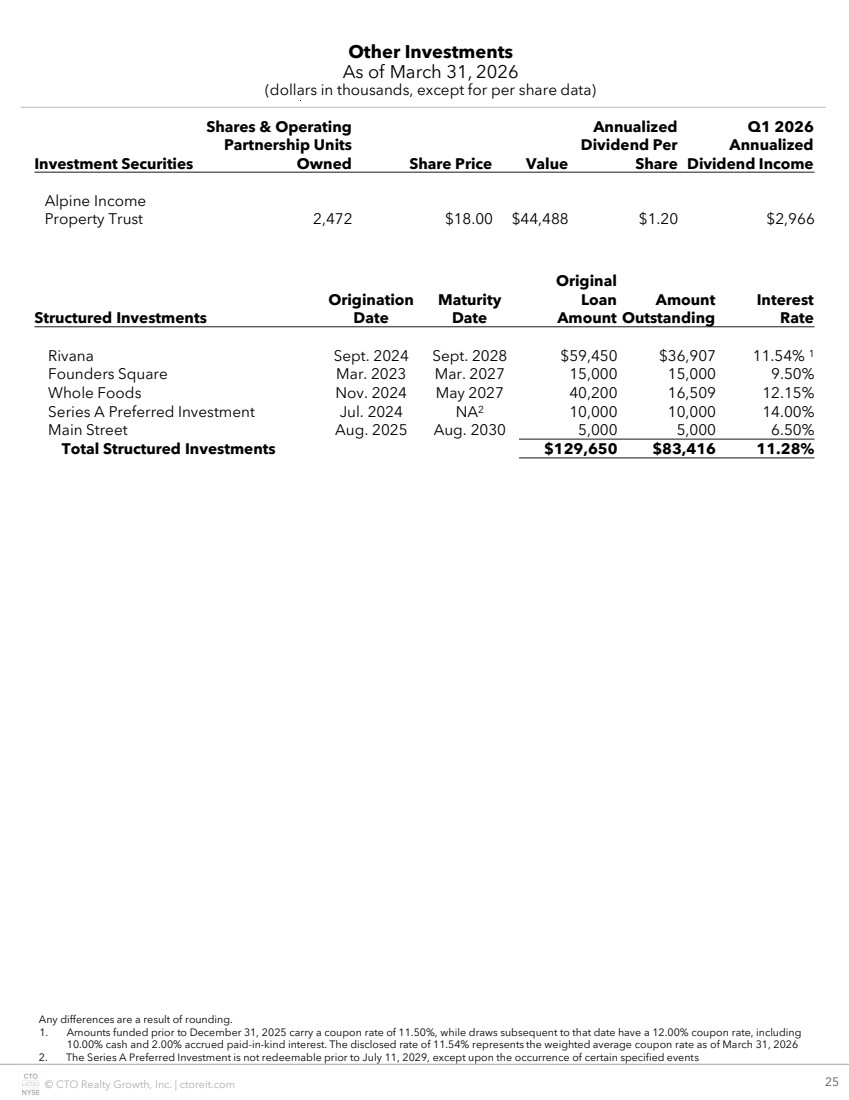
| © CTO Realty Growth, Inc. | ctoreit.com 25 Other Investments As of March 31, 2026 (dollars in thousands, except for per share data) Any differences are a result of rounding. 1. Amounts funded prior to December 31, 2025 carry a coupon rate of 11.50%, while draws subsequent to that date have a 12.00% coupon rate, including 10.00% cash and 2.00% accrued paid-in-kind interest. The disclosed rate of 11.54% represents the weighted average coupon rate as of March 31, 2026 2. The Series A Preferred Investment is not redeemable prior to July 11, 2029, except upon the occurrence of certain specified events Investment Securities Shares & Operating Partnership Units Owned Share Price Value Annualized Dividend Per Share Q1 2026 Annualized Dividend Income Alpine Income Property Trust 2,472 $18.00 $44,488 $1.20 $2,966 Structured Investments Origination Date Maturity Date Original Loan Amount Amount Outstanding Interest Rate Rivana Sept. 2024 Sept. 2028 $59,450 $36,907 11.54% 1 Founders Square Mar. 2023 Mar. 2027 15,000 15,000 9.50% Whole Foods Nov. 2024 May 2027 40,200 16,509 12.15% Series A Preferred Investment Jul. 2024 NA2 10,000 10,000 14.00% Main Street Aug. 2025 Aug. 2030 5,000 5,000 6.50% Total Structured Investments $129,650 $83,416 11.28% |
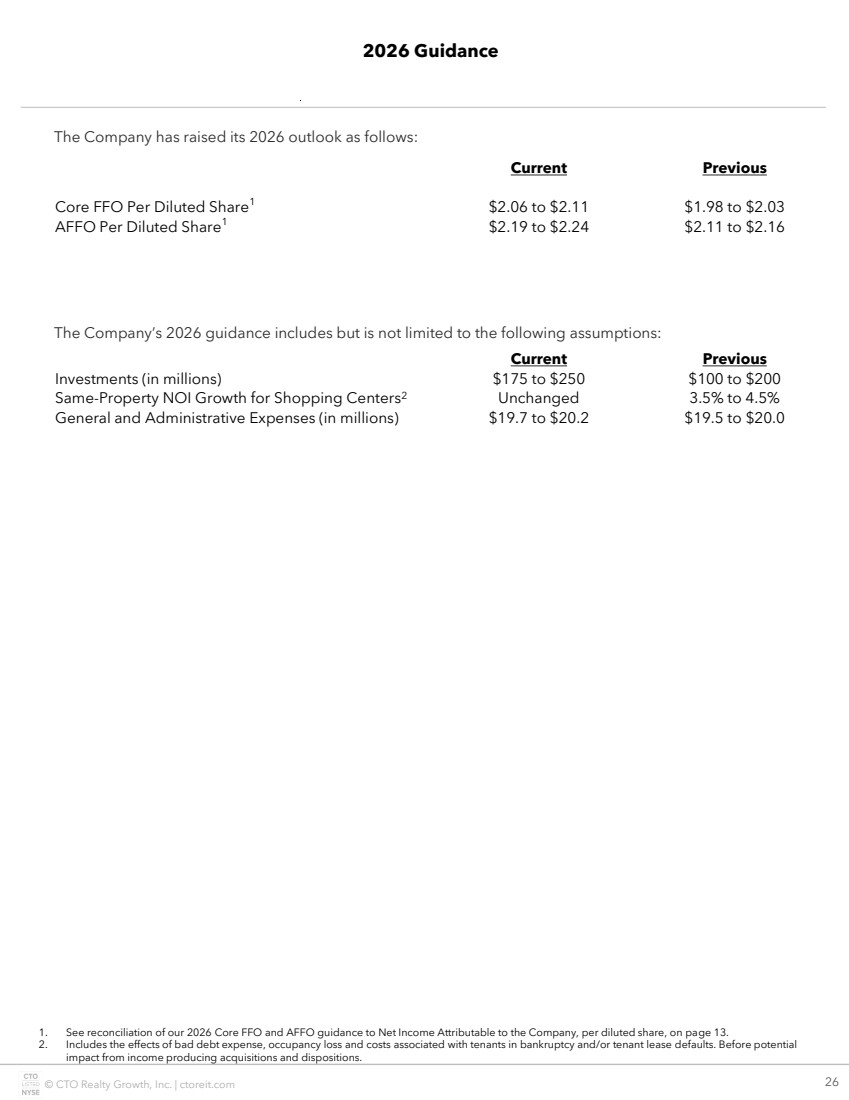
| © CTO Realty Growth, Inc. | ctoreit.com 26 2026 Guidance 1. See reconciliation of our 2026 Core FFO and AFFO guidance to Net Income Attributable to the Company, per diluted share, on page 13. 2. Includes the effects of bad debt expense, occupancy loss and costs associated with tenants in bankruptcy and/or tenant lease defaults. Before potential impact from income producing acquisitions and dispositions. Current Previous Core FFO Per Diluted Share1 $2.06 to $2.11 $1.98 to $2.03 AFFO Per Diluted Share1 $2.19 to $2.24 $2.11 to $2.16 The Company has raised its 2026 outlook as follows: The Company’s 2026 guidance includes but is not limited to the following assumptions: Current Previous Investments (in millions) $175 to $250 $100 to $200 Same-Property NOI Growth for Shopping Centers2 Unchanged 3.5% to 4.5% General and Administrative Expenses (in millions) $19.7 to $20.2 $19.5 to $20.0 |
| © CTO Realty Growth, Inc. | ctoreit.com 27 Contact Information & Research Coverage Contact Information Corporate Office Locations Investor Relations New York Stock Exchange 369 N. New York Ave., Suite 201 Winter Park, FL 32789 1140 N. Williamson Blvd., Suite 140 Daytona Beach, FL 32114 ir@ctoreit.com Ticker Symbol: CTO Series A Preferred Ticker Symbol: CTO/PA www.ctoreit.com Research Analyst Coverage Institution Coverage Analyst Email Alliance Global Partners Gaurav Mehta gmehta@allianceg.com B. Riley John Massocca jmassocca@brileyfin.com Cantor Fitzgerald Jay Kornreich jay.kornreich@cantor.com Jones Research Jason Weaver jweaver@jonestrading.com Lucid Capital Markets Craig Kucera ckucera@lucidcm.com Raymond James RJ Milligan rjmilligan@raymondjames.com |