Prospectus

•
Voya Global High Dividend Low Volatility Portfolio
Class/Ticker: ADV/IGHAX; I/IIGZX S/IGHSX; S2/IWTTX
•
Voya Government Money Market Portfolio
Class/Ticker: I/IVMXX
•
Voya Growth and Income Portfolio
Class/Ticker: ADV/IAVGX; I/IIVGX; S/ISVGX; S2/IGISX
•
Voya Index Plus LargeCap Portfolio
Class/Ticker: ADV/VIPAX; I/IPLIX; S/IPLSX
•
Voya Index Plus MidCap Portfolio
Class/Ticker: I/IPMIX; S/IPMSX
•
Voya Index Plus SmallCap Portfolio
Class/Ticker: I/IPSIX; S/IPSSX
•
Voya Intermediate Bond Portfolio
Class/Ticker: ADV/IIBPX; I/IPIIX; S/IPISX; S2/IIBTX
•
Voya Small Company Portfolio
Class/Ticker: ADV/IASCX; I/IVCSX; R6/VSPRX; S/IVPSX
Each Portfolio's shares may be offered to insurance company separate accounts serving as investment options under variable annuity contracts and variable life insurance policies (“Variable Contracts”), qualified pension and retirement plans (“Qualified Plans”), custodial accounts, and certain investment advisers and their affiliates in connection with the creation or management of the Portfolios, other investment companies, and other permitted investors.
NOT ALL PORTFOLIOS MAY BE AVAILABLE IN ALL JURISDICTIONS, UNDER ALL VARIABLE CONTRACTS OR UNDER ALL QUALIFIED PLANS.
The U.S. Securities and Exchange Commission (the “SEC”) has not approved or disapproved these securities nor has the SEC judged whether the information in this Prospectus is accurate or adequate. Any representation to the contrary is a criminal offense.

Table of Contents
|
SUMMARY SECTION
|
|
|
1 | |
|
7 | |
|
12 | |
|
19 | |
|
25 | |
|
31 | |
|
37 | |
|
45 | |
|
52 | |
|
52 | |
|
52 | |
|
52 | |
|
52 | |
|
53 | |
|
53 | |
|
53 | |
|
54 | |
|
54 | |
|
54 | |
|
54 | |
|
55 | |
|
66 | |
|
68 | |
|
69 | |
|
69 | |
|
69 | |
|
70 | |
|
73 | |
|
73 | |
|
74 | |
|
75 | |
|
75 | |
|
77 | |
|
78 | |
|
79 | |
|
80 | |
|
82 | |
|
87 | |
|
Back Cover |
Voya Global High Dividend Low Volatility Portfolio
Investment Objective
The Portfolio seeks long-term capital growth and current income.
Fees and Expenses of the Portfolio
The table describes the fees and expenses that you may pay if you buy, hold, and sell shares of the Portfolio. You may pay other fees and expenses such as fees and expenses imposed under your variable annuity contracts or variable life insurance policies (“Variable Contract”) or a qualified pension or retirement plan (“Qualified Plan”), which are not reflected in the tables and examples below. If these fees or expenses were included in the table, the Portfolio’s expenses would be higher. For more information on these charges, please refer to the documents governing your Variable Contract or Qualified Plan or consult your plan administrator.
Annual Portfolio Operating Expenses1
Expenses you pay each year as a % of the value of your investment
Expenses you pay each year as a % of the value of your investment
|
Class |
|
ADV |
I |
S |
S2 |
|
Management Fees |
% |
0.56 |
0.56 |
0.56 |
0.56 |
|
Distribution and/or Shareholder Services (12b-1) Fees |
% |
0.50 |
None |
0.25 |
0.40 |
|
Other Expenses |
% |
0.14 |
0.14 |
0.14 |
0.14 |
|
Total Annual Portfolio Operating Expenses |
% |
1.20 |
0.70 |
0.95 |
1.10 |
|
Waivers and Reimbursements2 |
% |
(0.10) |
(0.10) |
(0.10) |
(0.10) |
|
Total Annual Portfolio Operating Expenses
after Waivers and Reimbursements |
% |
1.10 |
0.60 |
0.85 |
1.00 |
1
Expense information has been restated to reflect current contractual rates.
2
Voya Investments, LLC (the “Investment Adviser”) is contractually obligated to limit expenses to 1.10%, 0.60%, 0.85%, and 1.00% for Class ADV, Class I, Class S, and Class S2 shares, respectively, through May 1, 2027 (the “ Expense Limitation Agreement ” ). The limitation does not extend to interest, taxes, other investment- related costs, fees, leverage expenses, extraordinary expenses such as litigation or other expenses not incurred in the ordinary course of business, and expenses of any counsel or other persons or services retained by the directors who are not “ interested persons ” as that term is defined by the Investment Company Act of 1940, as amended. Modification of the Expense Limitation Agreement requires written agreement signed by each of the parties and approval by the Portfolio ’ s Board of Directors (the “ Board ” ). The Expense Limitation Agreement shall terminate with respect to the Portfolio upon termination of the Portfolio’s advisory agreement with the Investment Adviser, or it may be terminated by Voya Variable Portfolios, Inc. (the “ Company ” ), without payment of any penalty, upon written notice to the Investment Adviser at its principal place of business.
Expense Example
This Example is intended to help you compare the cost of investing in shares of the Portfolio with the costs of investing in other mutual funds. The Example does not reflect expenses and charges which are, or may be, imposed under your Variable Contract or Qualified Plan. The Example assumes that you invest $10,000 in the Portfolio for the time periods indicated. The Example also assumes that your investment had a 5% return each year and that the Portfolio's operating expenses remain the same. The Example reflects applicable expense limitation agreements and/or waivers in effect, if any, for the one-year period and the first year of the time periods indicated . Although your actual costs may be higher or lower, based on these assumptions your costs would be:
|
Class |
|
1 Yr |
3 Yrs |
5 Yrs |
10 Yrs |
|
ADV |
$ |
112 |
371 |
650 |
1,446 |
|
I |
$ |
61 |
214 |
380 |
861 |
|
S |
$ |
87 |
293 |
516 |
1,157 |
|
S2 |
$ |
102 |
340 |
597 |
1,331 |
Portfolio Turnover
The Portfolio pays transaction costs, such as commissions, when it buys and sells securities (or “turns over” its portfolio). A higher portfolio turnover rate may indicate higher transaction costs. These costs, which are not reflected in Annual Portfolio Operating Expenses or in the Expense Example, affect the Portfolio's performance.
During the most recent fiscal year, the Portfolio's portfolio turnover rate was 67% of the average value of its portfolio.
1
Voya Global High Dividend Low Volatility Portfolio
Principal Investment Strategies
Under normal circumstances, the Portfolio invests at least 80% of its net assets (plus the amount of any borrowings for investment purposes) in a portfolio of equity securities.
The Portfolio invests primarily in equity securities included in the MSCI World Value IndexSM (the “Index”). The Portfolio invests in securities of issuers in a number of different countries, including the United States.
The sub-adviser (the “Sub-Adviser”) seeks to maximize total return to the extent consistent with maintaining lower volatility than the Index. Volatility generally measures how much a portfolio’s returns have varied over a specified time frame.
The Portfolio may invest in derivative instruments, including, but not limited to, index futures. The Portfolio typically uses derivatives as a substitute for purchasing securities included in the Index or for the purpose of maintaining equity market exposure on its cash balance.
The Portfolio may invest in real estate-related securities, including real estate investment trusts (“REITs”).
The Portfolio may invest in other investment companies, including exchange-traded funds (“ETFs”), to the extent permitted under the Investment Company Act of 1940, as amended, and the rules and regulations thereunder, and under the terms of applicable no-action relief or exemptive orders granted thereunder.
The Sub-Adviser creates a target universe that consists of dividend paying securities by screening for companies that exhibit stable dividend yields within each industry sector. Once the Sub-Adviser creates this target universe, the Sub-Adviser seeks to identify the most attractive securities within various geographic regions and sectors by ranking each security relative to other securities within its region or sector, as applicable, using proprietary fundamental sector-specific quantitative investment models. The Sub-Adviser then uses optimization techniques to seek to achieve the Portfolio’s target dividend yield, which is expected to be higher than the Index in aggregate, manage target beta, determine active weights, and neutralize region and sector exposures in order to create a portfolio that the Sub-Adviser believes will provide the potential for maximum total return consistent with maintaining lower volatility than the Index. Under certain circumstances, the Portfolio will likely earn a lower level of total return than it would in the absence of its strategy of maintaining a relatively low level of volatility.
In evaluating investments for the Portfolio, the Sub-Adviser, through its quantitative methods and models, takes into account a wide variety of factors and considerations to determine whether any or all of those factors or considerations might have a material effect on the value, risks, or prospects of a company. Among the factors considered, the Sub-Adviser expects that its quantitative methods and models will typically take into account environmental, social, and governance (“ESG”) factors. In considering ESG factors, the Sub-Adviser’s quantitative methods and models will rely primarily on factors identified through the Sub-Adviser’s proprietary empirical research and on third-party evaluations of a company’s ESG standing, when available. ESG factors will be only one of many considerations in the evaluation of any potential investment; the extent to which ESG factors will affect the Sub-Adviser’s decision to invest in a company, if at all, will depend on the operation of the Sub-Adviser’s quantitative processes and the judgment of the Sub-Adviser.
The Portfolio may lend portfolio securities on a short-term or long-term basis, up to 33 1∕3% of its total assets.
Principal Risks
You could lose money on an investment in the Portfolio. Any of the following risks, among others, could affect Portfolio performance or cause the Portfolio to lose money or to underperform market averages of other funds. The principal risks are presented in alphabetical order to facilitate readability, and their order does not imply that the realization of one risk is more likely to occur or have a greater adverse impact than another risk.
Company: The price of a company’s stock could decline or underperform for many reasons, including, among others, poor management, financial problems, reduced demand for the company’s goods or services, regulatory fines and judgments, or business challenges. If a company is unable to meet its financial obligations, declares bankruptcy, or becomes insolvent, its stock could become worthless.
Currency: To the extent that the Portfolio invests directly or indirectly in foreign (non-U.S.) currencies or in securities denominated in, or that trade in, foreign (non-U.S.) currencies, it is subject to the risk that those foreign (non-U.S.) currencies will decline in value relative to the U.S. dollar or, in the case of hedging positions, that the U.S. dollar will decline in value relative to the currency being hedged by the Portfolio through foreign currency exchange transactions.
Derivative Instruments: Derivative instruments are subject to a number of risks, including the risk of changes in the market price of the underlying asset, reference rate, or index, credit risk with respect to the counterparty, risk of loss due to changes in market interest rates, liquidity risk, valuation risk, and volatility risk. The amounts required to purchase certain derivatives may be small relative to the magnitude of exposure assumed by the Portfolio. Therefore, the purchase of certain derivatives may have an economic leveraging effect on the Portfolio and exaggerate any increase or decrease in the net asset value. Derivatives may not perform as expected, so the Portfolio may not realize the intended benefits. When used for hedging
Voya Global High Dividend Low Volatility Portfolio
2
purposes, the change in value of a derivative may not correlate as expected with the asset, reference rate, or index being hedged. When used as an alternative or substitute for direct cash investment, the return provided by the derivative may not provide the same return as direct cash investment.
Dividend: Companies that issue dividend yielding equity securities are not required to continue to pay dividends on such securities. Therefore, there is a possibility that such companies could reduce or eliminate the payment of dividends in the future. As a result, the Portfolio’s ability to execute its investment strategy may be limited.
Environmental, Social, and Governance (Quantitative): The Sub-Adviser’s consideration of ESG factors in selecting investments for the Portfolio depends on the operation of quantitative methods and models whose design reflects qualitative and subjective judgments of the Sub-Adviser, including reliance on, or incorporation of, data in respect of ESG factors that may rely on third-party data that might be incorrect or based on incomplete or inaccurate information. There is no minimum percentage of the Portfolio’s assets that will be invested in companies that the Sub-Adviser views favorably in light of ESG factors, and the Sub-Adviser may not invest in companies that compare favorably to other companies on the basis of ESG factors. It is possible that the Portfolio will have less exposure to certain companies due to the Sub-Adviser’s assessment of ESG factors than other comparable mutual funds. There can be no assurance that an investment selected by the Sub-Adviser, which includes its consideration of ESG factors, when available, will provide more favorable investment performance than another potential investment, and such an investment may, in fact, underperform other potential investments.
Foreign (Non-U.S.) Investments: Investing in foreign (non-U.S.) securities may result in the Portfolio experiencing more rapid and extreme changes in value than a fund that invests exclusively in securities of U.S. companies due, in part, to: smaller markets; differing reporting, accounting, auditing and financial reporting standards and practices; nationalization, expropriation, or confiscatory taxation; foreign currency fluctuations, currency blockage, or replacement; potential for default on sovereign debt; and political changes or diplomatic developments, which may include the imposition of economic sanctions (or the threat of new or modified sanctions) or other measures by the U.S. or other governments and supranational organizations. Markets and economies throughout the world are becoming increasingly interconnected, and conditions or events in one market, country or region may adversely impact investments or issuers in another market, country or region.
Investment Model: The Sub-Adviser’s proprietary investment model may not adequately take into account existing or unforeseen market factors or the interaction among such factors, including changes in how such factors interact, and there is no guarantee that the use of a proprietary investment model will result in effective investment decisions for the Portfolio. Volatility management techniques may not always be successful in reducing volatility, may not protect against market declines, and may limit the Portfolio’s participation in market gains, negatively impacting performance even during periods when the market is rising. During sudden or significant market rallies, such underperformance may be significant. Moreover, volatility management strategies may increase portfolio transaction costs, which may increase losses or reduce gains. The Portfolio’s volatility may not be lower than that of the Portfolio’s Index during all market cycles due to market factors. Portfolios that are actively managed, in whole or in part, according to a quantitative investment model (including models that utilize forms of artificial intelligence, such as machine learning) can perform differently from the market, based on the investment model and the factors used in the analysis, the weight placed on each factor, and changes from the factors’ historical trends. Technical issues in the design, development, implementation, application, and maintenance of the models (e.g., stale or inaccurate data, human error, programming or other software issues, coding errors, and technology failures) may create errors or limitations that might go undetected or are discovered only after the errors or limitations have negatively impacted performance.
Liquidity: If a security is illiquid, the Portfolio might be unable to sell the security at a time when the Portfolio’s manager might wish to sell, or at all. Further, the lack of an established secondary market may make it more difficult to value illiquid securities, exposing the Portfolio to the risk that the prices at which it sells illiquid securities will be less than the prices at which they were valued when held by the Portfolio, which could cause the Portfolio to lose money. The prices of illiquid securities may be more volatile than more liquid securities, and the risks associated with illiquid securities may be greater in times of financial stress. Certain securities that are liquid when purchased may later become illiquid, particularly in times of overall economic distress or due to geopolitical events such as sanctions, trading halts, or wars. In addition, markets or securities may become illiquid quickly.
Market: The market values of securities will fluctuate, sometimes sharply and unpredictably, based on overall economic conditions, governmental actions or intervention, market disruptions caused by trade disputes or other factors, political developments, and other factors. Prices of equity securities tend to rise and fall more dramatically than those of debt instruments. Additionally, legislative, regulatory or tax policies or developments may adversely impact the investment techniques available to a manager, add to costs, and impair the ability of the Portfolio to achieve its investment objectives.
Market Capitalization: Stocks fall into three broad market capitalization categories: large, mid, and small. Investing primarily in one category carries the risk that, due to current market conditions, that category may be out of favor with investors. If valuations of large-capitalization companies appear to be greatly out of proportion to the valuations of mid- or small-capitalization
Voya Global High Dividend Low Volatility Portfolio
3
companies, investors may migrate to the stocks of mid- and small-capitalization companies causing a fund that invests in these companies to increase in value more rapidly than a fund that invests in large-capitalization companies. Investing in mid- and small-capitalization companies may be subject to special risks associated with narrower product lines, more limited financial resources, smaller management groups, more limited publicly available information, and a more limited trading market for their stocks as compared with large-capitalization companies. As a result, stocks of mid- and small-capitalization companies may be more volatile and may decline significantly in market downturns.
Market Disruption and Geopolitical: The Portfolio is subject to the risk that geopolitical events will disrupt securities markets and adversely affect global economies and markets. Due to the increasing interdependence among global economies and markets, conditions in one country, market, or region might adversely impact markets, issuers and/or foreign exchange rates in other countries, including the United States. Wars, terrorism, global health crises and pandemics, trade disputes, tariffs and other restrictions on trade or economic sanctions, rapid technological developments (such as artificial intelligence technologies), and other geopolitical events that have led, and may continue to lead, to increased market volatility and may have adverse short- or long-term effects on U.S. and global economies and markets, generally. For example, the COVID-19 pandemic resulted in significant market volatility, exchange suspensions and closures, declines in global financial markets, higher default rates, supply chain disruptions, and a substantial economic downturn in economies throughout the world. The economic impacts of COVID-19 have created a unique challenge for real estate markets. Many businesses have either partially or fully transitioned to a remote-working environment and this transition may negatively impact the occupancy rates of commercial real estate over time. Natural and environmental disasters and systemic market dislocations are also highly disruptive to economies and markets. Military action by Russia in Ukraine, the prolonged conflict between Hamas and Israel, the Iranian conflict that commenced in February 2026, and political upheaval in Venezuela have resulted, and may continue to result, in sanctions, market disruptions, declines in regional and global stock markets, unusual volatility in global commodity markets, and disruptions to energy production or transportation, including through key shipping routes, any of which could adversely affect the value of the Portfolio ' s investments, including beyond the Portfolio's direct exposure to issuers in the affected regions. The escalation or expansion of hostilities including the involvement of additional nations, could introduce further uncertainty and volatility in global energy, commodity, and financial markets. The extent and duration of these conflicts, related sanctions, and resulting market disruptions are impossible to predict but could be substantial. A number of U.S. domestic banks and foreign (non-U.S.) banks have experienced financial difficulties and, in some cases, failures. There can be no certainty that the actions taken by regulators to limit the effect of those financial difficulties and failures on other banks or other financial institutions or on the U.S. or foreign (non-U.S.) economies generally will be successful. It is possible that more banks or other financial institutions will experience financial difficulties or fail, which may affect adversely other U.S. or foreign (non-U.S.) financial institutions and economies. These events as well as other changes in foreign (non-U.S.) and domestic economic, social, and political conditions also could adversely affect individual issuers or related groups of issuers, securities markets, interest rates, credit ratings, inflation, investor sentiment, and other factors affecting the value of the Portfolio’s investments. Any of these occurrences could disrupt the operations of the Portfolio and of the Portfolio’s service providers. Recent technological developments in, and the increasingly widespread use of, artificial intelligence, including machine learning technology and generative artificial intelligence (“AI”), may pose risks to the Portfolio. For instance, the economy may be significantly impacted by the advanced development and increased regulation of AI. As AI is used more widely, the profitability and growth of Portfolio holdings may be impacted, which could significantly impact the overall performance of the Portfolio. The legal and regulatory frameworks within which AI operates continue to rapidly evolve, and it is not possible to predict the full extent of current or future risks related thereto.
Other Investment Companies: The main risk of investing in other investment companies, including ETFs, is the risk that the value of an investment company’s underlying investments might decrease. Shares of investment companies that are listed on an exchange may trade at a discount or premium from their net asset value. You will pay a proportionate share of the expenses of those other investment companies (including management fees, administration fees, and custodial fees) in addition to the Portfolio’s expenses. The investment policies of the other investment companies may not be the same as those of the Portfolio; as a result, an investment in the other investment companies may be subject to additional or different risks than those to which the Portfolio is typically subject. In addition, shares of ETFs may trade at a premium or discount to net asset value and are subject to secondary market trading risks. Secondary markets may be subject to irregular trading activity, wide bid/ask spreads, and extended trade settlement periods in times of market stress because market makers and authorized participants may step away from making a market in an ETF’s shares, which could cause a material decline in the ETF’s net asset value.
Real Estate Companies and Real Estate Investment Trusts: Investing in real estate companies and REITs may subject the Portfolio to risks similar to those associated with the direct ownership of real estate, including losses from casualty or condemnation, changes in local and general economic conditions, supply and demand, market interest rates, zoning laws, regulatory limitations on rents, property taxes, overbuilding, high foreclosure rates, and operating expenses in addition to terrorist attacks, wars, or other acts that destroy real property. In addition, REITs may also be affected by tax and regulatory requirements in that a
Voya Global High Dividend Low Volatility Portfolio
4
REIT may not qualify for favorable tax treatment or regulatory exemptions. Investments in REITs are affected by the management skill of the REIT’s sponsor. The Portfolio will indirectly bear its proportionate share of expenses, including management fees, paid by each REIT in which it invests.
Securities Lending: Securities lending involves two primary risks: “ investment risk ” and “ borrower default risk. ” When lending securities, the Portfolio will receive cash or U.S. government securities as collateral. Investment risk is the risk that the Portfolio will lose money from the investment of the cash collateral received from the borrower. Borrower default risk is the risk that the Portfolio will lose money due to the failure of a borrower to return a borrowed security. Securities lending may result in leverage. The use of leverage may exaggerate any increase or decrease in the net asset value, causing the Portfolio to be more volatile. The use of leverage may increase expenses and increase the impact of the Portfolio’s other risks.
An investment in the Portfolio is not a bank deposit and is not insured or guaranteed by the Federal Deposit Insurance Corporation, the Federal Reserve Board or any other government agency.
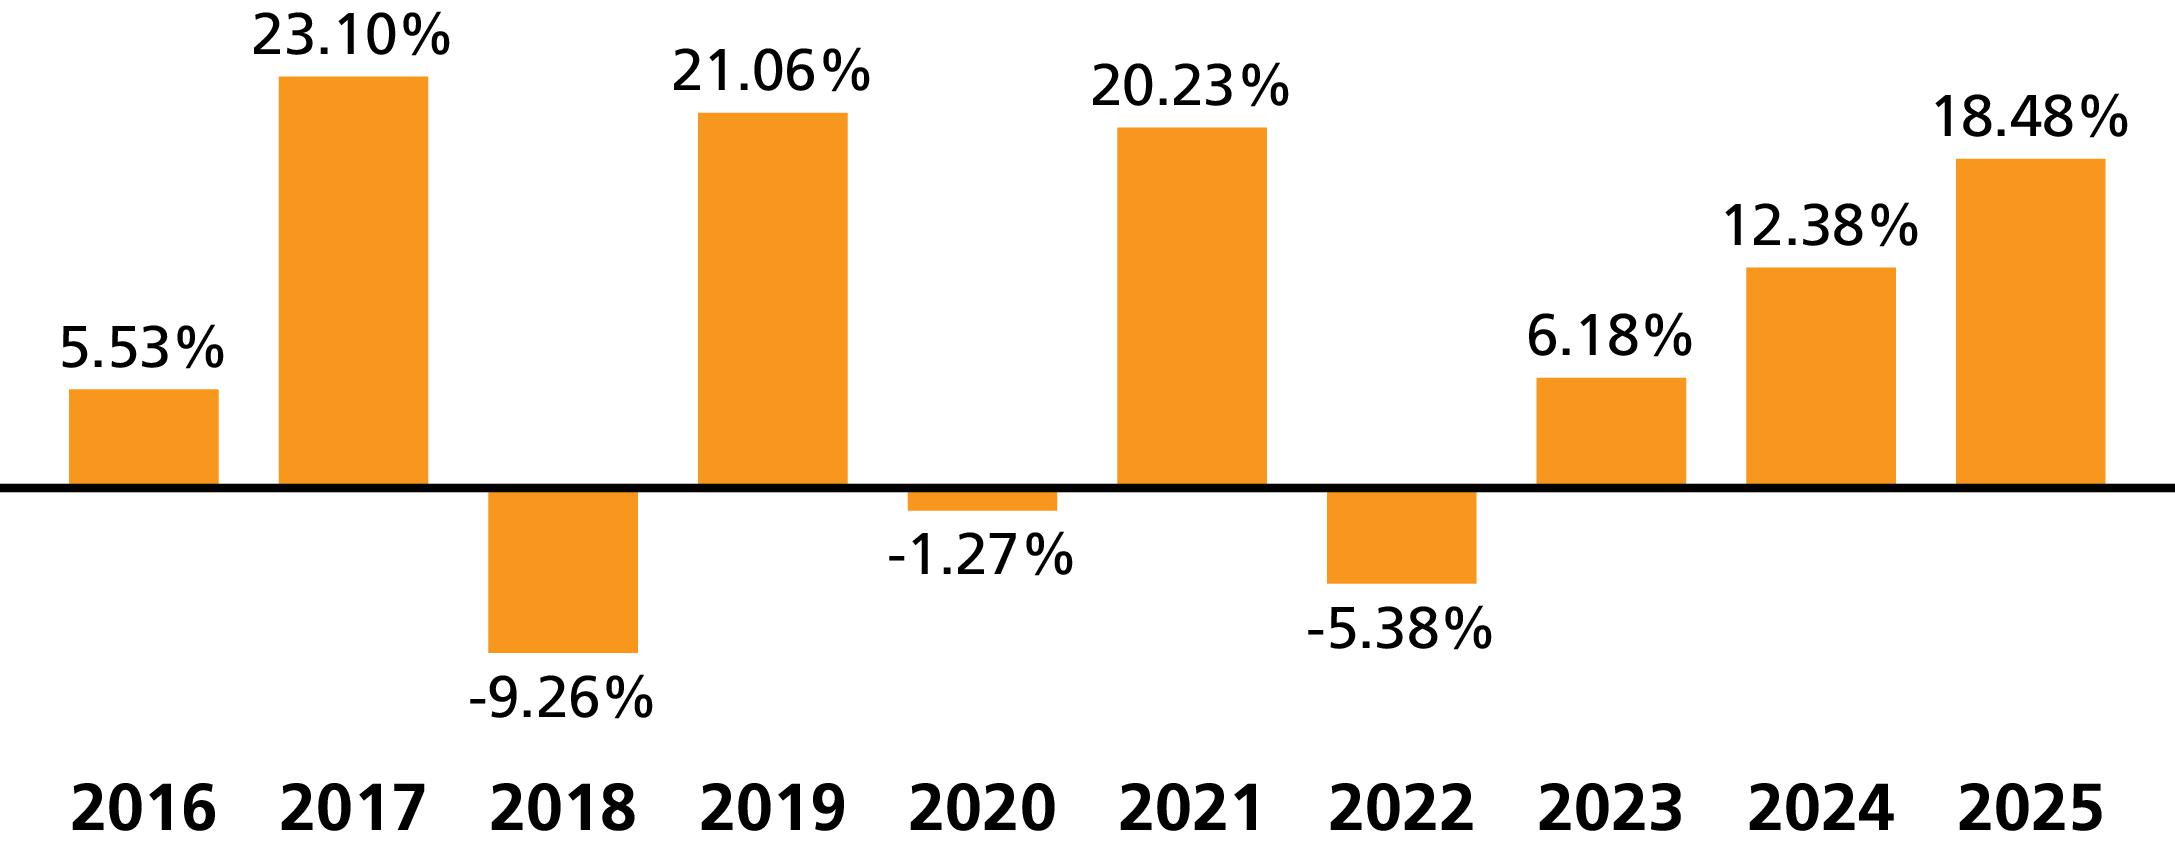
Performance Information
The following information is intended to help you understand the risks of investing in the Portfolio. The following bar chart shows the changes in the Portfolio's performance from year to year, and the table compares the Portfolio's performance to the performance of a broad-based securities market index and an additional index with investment characteristics similar to those of the Portfolio for the same period. In 2024, the Investment Adviser changed the Portfolio’s primary benchmark from the MSCI World Value IndexSM to the MSCI All Country World IndexSM (“MSCI ACWI”) in accordance with changes to regulatory disclosure requirements. The Portfolio continues to use the MSCI World Value IndexSM as an additional benchmark that the Investment Adviser believes more closely reflects the Portfolio’s principal investment strategies. The Portfolio's performance information reflects applicable fee waivers and/or expense limitations in effect during the period presented. Absent such fee waivers/expense limitations, if any, performance would have been lower. The bar chart shows the performance of the Portfolio's Class ADV shares. Performance for other share classes would differ to the extent they have differences in their fees and expenses. The Class I shares performance shown for the period prior to their inception date is the performance of Class S shares without adjustment for any differences in expenses between the two classes. If adjusted for such differences, returns would be different.
Performance shown in the bar chart and in the Average Annual Total Returns table does not include insurance-related charges imposed under a Variable Contract or expenses related to a Qualified Plan. If these charges or expenses were included, performance would be lower. Thus, you should not compare the Portfolio's performance directly with the performance information of other investment products without taking into account all insurance-related charges and expenses payable under your Variable Contract or Qualified Plan. The Portfolio's past performance is no guarantee of future results.
The Portfolio’s performance prior to December 31, 2020 reflects returns achieved pursuant to different principal investment strategies. The Portfolio’s performance prior to May 1, 2018 reflects returns achieved pursuant to different principal investment strategies. If the Portfolio’s current principal investment strategies had been in place for the prior periods, the performance information shown would have been different.
Calendar Year Total Returns Class ADV
(as of December 31 of each year)
(as of December 31 of each year)
|
Best quarter: |
4th Quarter 2022 |
13.98% |
|
Worst quarter: |
1st Quarter 2020 |
-23.36% |
Voya Global High Dividend Low Volatility Portfolio
5
Average Annual Total Returns %
(for the periods ended December 31, 2025)
(for the periods ended December 31, 2025)
|
|
|
1 Yr |
5 Yrs |
10 Yrs |
Since
Inception |
Inception
Date |
|
Class ADV |
% |
18.48 |
9.97 |
8.53 |
N/A |
1/28/2008 |
|
MSCI ACWI1 |
% |
22.34 |
11.19 |
11.72 |
N/A |
|
|
MSCI World Value IndexSM 1 |
% |
20.79 |
11.35 |
9.23 |
N/A |
|
|
Class I |
% |
19.00 |
10.52 |
9.05 |
N/A |
3/5/2015 |
|
MSCI ACWI1 |
% |
22.34 |
11.19 |
11.72 |
N/A |
|
|
MSCI World Value IndexSM 1 |
% |
20.79 |
11.35 |
9.23 |
N/A |
|
|
Class S |
% |
18.73 |
10.25 |
8.78 |
N/A |
1/28/2008 |
|
MSCI ACWI1 |
% |
22.34 |
11.19 |
11.72 |
N/A |
|
|
MSCI World Value IndexSM 1 |
% |
20.79 |
11.35 |
9.23 |
N/A |
|
|
Class S2 |
% |
18.47 |
10.08 |
8.63 |
N/A |
3/5/2015 |
|
MSCI ACWI1 |
% |
22.34 |
11.19 |
11.72 |
N/A |
|
|
MSCI World Value IndexSM 1 |
% |
20.79 |
11.35 |
9.23 |
N/A |
|
1
The index returns include the reinvestment of dividends and distributions net of withholding taxes, but do not reflect fees, brokerage commissions, or other expenses.
Portfolio Management
|
Investment Adviser |
|
Voya Investments, LLC |
|
Sub-Adviser |
|
Voya Investment Management Co. LLC |
|
Portfolio Managers |
|
|
Steve Gao, PhD, CFA, FRM
Portfolio Manager (since 10/2025) |
Russell Shtern, CFA
Portfolio Manager (since 10/2025) |
|
Kai Yee Wong
Portfolio Manager (since 5/2018) |
|
Purchase and Sale of Portfolio Shares
Shares of the Portfolio are not offered directly to the public. Purchase and sale of shares may be made only by separate accounts of insurance companies serving as investment options under Variable Contracts or by Qualified Plans, custodian accounts, and certain investment advisers and their affiliates, other investment companies, or permitted investors. Please refer to the prospectus for the appropriate insurance company separate account, investment company, or your plan documents for information on how to direct investments in, or sale from, an investment option corresponding to the Portfolio and any fees that may apply. Participating insurance companies and certain other designated organizations are authorized to receive purchase orders on the Portfolio's behalf.
Tax Information
Distributions made by the Portfolio to a Variable Contract or Qualified Plan, and exchanges and redemptions of Portfolio shares made by a Variable Contract or Qualified Plan, ordinarily do not cause the corresponding contract holder or plan participant to recognize income or gain for U.S. federal income tax purposes. See the Variable Contract prospectus or the governing documents of your Qualified Plan for information regarding the U.S. federal income tax treatment of the distributions to your Variable Contract or Qualified Plan and the holders of the contracts or plan participants.
Payments to Broker-Dealers and Other Financial Intermediaries
If you invest in the Portfolio through a Variable Contract issued by an insurance company or through a Qualified Plan that, in turn, was purchased or serviced through an insurance company, broker-dealer or other financial intermediary, the Portfolio and its Investment Adviser or distributor or their affiliates may: (1) make payments to the insurance company issuer of the Variable Contract or to the company servicing the Qualified Plan and (2) make payments to the insurance company, broker-dealer, or other financial intermediary. These payments may create a conflict of interest by: (1) influencing the insurance company or the company servicing the Qualified Plan to make the Portfolio available as an investment option for the Variable Contract or the Qualified Plan or (2) influencing the broker-dealer or other intermediary and your salesperson to recommend the Variable Contract or the pension servicing agent and/or the Portfolio over other options. Ask your salesperson or Qualified Plan administrator or visit your financial intermediary's website for more information.
Voya Global High Dividend Low Volatility Portfolio
6
Voya Government Money Market Portfolio
Investment Objective
The Portfolio seeks to provide high current return, consistent with preservation of capital and liquidity, through investment in high-quality money market instruments while maintaining a stable share price of $1.00.
Fees and Expenses of the Portfolio
The table describes the fees and expenses that you may pay if you buy, hold, and sell shares of the Portfolio. You may pay other fees and expenses such as fees and expenses imposed under your variable annuity contracts or variable life insurance policies (“Variable Contract”) or a qualified pension or retirement plan (“Qualified Plan”), which are not reflected in the tables and examples below. If these fees or expenses were included in the table, the Portfolio’s expenses would be higher. For more information on these charges, please refer to the documents governing your Variable Contract or Qualified Plan or consult your plan administrator.
Annual Portfolio Operating Expenses1
Expenses you pay each year as a % of the value of your investment
Expenses you pay each year as a % of the value of your investment
|
Class |
|
I |
|
Management Fees |
% |
0.35 |
|
Distribution and/or Shareholder Services (12b-1) Fees |
% |
None |
|
Other Expenses |
% |
0.18 |
|
Total Annual Portfolio Operating Expenses |
% |
0.53 |
|
Waivers and Reimbursements2 |
% |
(0.13) |
|
Total Annual Portfolio Operating Expenses
after Waivers and Reimbursements |
% |
0.40 |
1
Expense information has been restated to reflect current contractual rates.
2
Voya Investments, LLC (the “Investment Adviser”) and the distributor are contractually obligated to waive a portion of their advisory fees and distribution and/or shareholder servicing fees, as applicable, and to reimburse certain expenses of the Portfolio to the extent necessary to assist the Portfolio in maintaining a net yield of not less than zero through May 1, 2026. There is no guarantee that the Portfolio will maintain such a yield. The Investment Adviser is contractually obligated to waive 0.40% of the management fee through May 1, 2027. Termination or modification of these obligations requires approval by the Portfolio’s Board of Trustees (the “Board”).
Expense Example
This Example is intended to help you compare the cost of investing in shares of the Portfolio with the costs of investing in other mutual funds. The Example does not reflect expenses and charges which are, or may be, imposed under your Variable Contract or Qualified Plan. The Example assumes that you invest $10,000 in the Portfolio for the time periods indicated. The Example also assumes that your investment had a 5% return each year and that the Portfolio's operating expenses remain the same. The Example reflects applicable expense limitation agreements and/or waivers in effect, if any, for the one-year period and the first year of the time periods indicated . Although your actual costs may be higher or lower, based on these assumptions your costs would be:
|
Class |
|
1 Yr |
3 Yrs |
5 Yrs |
10 Yrs |
|
I |
$ |
41 |
157 |
283 |
652 |
Principal Investment Strategies
The Portfolio invests at least 99.5% of its total assets in government securities, cash and repurchase agreements collateralized fully by government securities or cash. In addition, under normal circumstances, the Portfolio invests at least 80% of its net assets (plus the amount of any borrowings for investment purposes) in government securities and repurchase agreements that are collateralized by government securities. For purposes of the Portfolio’s 99.5% policy and 80% policy, government securities means any security issued or guaranteed as to principal or interest by the United States, or by a person controlled or supervised by and acting as an agency or instrumentality of the government of the United States pursuant to authority granted by the Congress of the United States; or any certificate of deposit for any of the foregoing.
The Portfolio invests in a portfolio of securities maturing in 397 days or less (with certain exceptions) that will have a dollar-weighted average maturity of 60 days or less and a dollar-weighted average life of 120 days or less. The Portfolio may invest in variable and floating rate instruments, and transact in securities on a when-issued, delayed delivery, or forward commitment basis.
7
Voya Government Money Market Portfolio
The Portfolio operates as a “money market fund” and the securities purchased by the Portfolio are subject to the quality, diversification, and other requirements of Rule 2a-7 under the Investment Company Act of 1940, as amended, and the rules and regulations thereunder, and under the terms of applicable no-action relief or exemptive orders granted thereunder (the “1940 Act”), and other rules adopted by the U.S. Securities and Exchange Commission (the “SEC”). Portfolio investments are valued based on the amortized cost valuation method pursuant to Rule 2a-7 under the 1940 Act.
The Portfolio may maintain a rating from one or more rating agencies that provide ratings on money market funds. There can be no assurance that the Portfolio will maintain any particular rating or maintain it with a particular rating agency. To maintain a rating, the sub-adviser (the “Sub-Adviser”) may manage the Portfolio more conservatively than if it was not rated.
The Portfolio may invest in other investment companies that are money market funds to the extent permitted under the 1940 Act.
In choosing investments for the Portfolio, the Sub-Adviser employs a disciplined, four-step investment process designed to ensure preservation of capital and liquidity, as well as adherence to regulatory requirements. The four steps are: first, a formal list of approved issuers is actively maintained; second, securities of issuers on the approved list that meet the Portfolio’s guidelines are selected for investment; third, diversification is continuously monitored to ensure that regulatory limits are not exceeded; and finally, portfolio maturity decisions are made based upon expected cash flows, income opportunities available in the market, and expectations of future interest rates.
Principal Risks
Any of the following risks, among others, could affect Portfolio performance or cause the Portfolio to lose money or to underperform market averages of other funds. The principal risks are presented in alphabetical order to facilitate readability, and their order does not imply that the realization of one risk is more likely to occur or have a greater adverse impact than another risk.
You could lose money by investing in the Portfolio. Although the Portfolio seeks to preserve the value of your investment at $1.00 per share, it cannot guarantee it will do so. An investment in the Portfolio is not a bank account and is not insured or guaranteed by the Federal Deposit Insurance Corporation or any other government agency. The Portfolio’s sponsor is not required to reimburse the Portfolio for losses, and you should not expect that the sponsor will provide financial support to the Portfolio at any time, including during periods of market stress.
Cash/Cash Equivalents: Investments in cash or cash equivalents may lower returns and result in potential lost opportunities to participate in market appreciation which could negatively impact the Portfolio’s performance and ability to achieve its investment objective.
Credit: The Portfolio could lose money if the issuer or guarantor of a debt instrument in which the Portfolio invests, or the counterparty to a derivative contract the Portfolio entered into, is unable or unwilling, or is perceived (whether by market participants, rating agencies, pricing services, or otherwise) as unable or unwilling, to meet its financial obligations.
Interest Rate: A rise in market interest rates generally results in a fall in the value of bonds and other debt instruments; conversely, values generally rise as market interest rates fall. Interest rate risk is generally greater for debt instruments than floating-rate instruments. The higher the credit quality of the instrument, and the longer its maturity or duration, the more sensitive it is to changes in market interest rates. Duration is a measure of sensitivity of the price of a debt instrument to a change in interest rate. The U.S. Federal Reserve Board recently lowered interest rates following a period of consistent rate increases. Declining market interest rates increase the likelihood that debt instruments will be pre-paid. Rising market interest rates have unpredictable effects on the markets and may expose debt and related markets to heightened volatility. To the extent that the Portfolio invests in debt instruments, an increase in market interest rates may lead to increased redemptions and increased portfolio turnover, which could reduce liquidity for certain investments, adversely affect values, and increase costs. Increased redemptions may cause the Portfolio to liquidate portfolio positions when it may not be advantageous to do so and may lower returns. If dealer capacity in debt markets is insufficient for market conditions, it may further inhibit liquidity and increase volatility in debt markets. Fiscal, economic, monetary, or other governmental policies or measures have in the past, and may in the future, cause or exacerbate risks associated with interest rates, including changes in interest rates. Negative or very low interest rates could magnify the risks associated with changes in interest rates. In general, changing interest rates, including rates that fall below zero, could have unpredictable effects on markets and may expose debt and related markets to heightened volatility. In the case of inverse debt instruments, the interest rate paid by the debt instruments is a floating rate, which will generally decrease when the market rate of interest to which the inverse debt instruments are indexed increases and will increase when the market rate of interest to which the inverse debt instruments are indexed decreases. Changes to monetary policy by the U.S. Federal Reserve Board or other regulatory actions could expose debt and related markets to heightened volatility, interest rate sensitivity, and reduced liquidity, which may impact the Portfolio’s operations and return potential.
Voya Government Money Market Portfolio
8
Investment Model: The Sub-Adviser’s proprietary investment model may not adequately take into account existing or unforeseen market factors or the interaction among such factors, including changes in how such factors interact, and there is no guarantee that the use of a proprietary investment model will result in effective investment decisions for the Portfolio.
Liquidity: If a security is illiquid, the Portfolio might be unable to sell the security at a time when the Portfolio’s manager might wish to sell, or at all. Further, the lack of an established secondary market may make it more difficult to value illiquid securities, exposing the Portfolio to the risk that the prices at which it sells illiquid securities will be less than the prices at which they were valued when held by the Portfolio, which could cause the Portfolio to lose money. The prices of illiquid securities may be more volatile than more liquid securities, and the risks associated with illiquid securities may be greater in times of financial stress. Certain securities that are liquid when purchased may later become illiquid, particularly in times of overall economic distress or due to geopolitical events such as sanctions, trading halts, or wars. In addition, markets or securities may become illiquid quickly.
Market Disruption and Geopolitical: The Portfolio is subject to the risk that geopolitical events will disrupt securities markets and adversely affect global economies and markets. Due to the increasing interdependence among global economies and markets, conditions in one country, market, or region might adversely impact markets, issuers and/or foreign exchange rates in other countries, including the United States. Wars, terrorism, global health crises and pandemics, trade disputes, tariffs and other restrictions on trade or economic sanctions, rapid technological developments (such as artificial intelligence technologies), and other geopolitical events that have led, and may continue to lead, to increased market volatility and may have adverse short- or long-term effects on U.S. and global economies and markets, generally. For example, the COVID-19 pandemic resulted in significant market volatility, exchange suspensions and closures, declines in global financial markets, higher default rates, supply chain disruptions, and a substantial economic downturn in economies throughout the world. The economic impacts of COVID-19 have created a unique challenge for real estate markets. Many businesses have either partially or fully transitioned to a remote-working environment and this transition may negatively impact the occupancy rates of commercial real estate over time. Natural and environmental disasters and systemic market dislocations are also highly disruptive to economies and markets. Military action by Russia in Ukraine, the prolonged conflict between Hamas and Israel, the Iranian conflict that commenced in February 2026, and political upheaval in Venezuela have resulted, and may continue to result, in sanctions, market disruptions, declines in regional and global stock markets, unusual volatility in global commodity markets, and disruptions to energy production or transportation, including through key shipping routes, any of which could adversely affect the value of the Portfolio ' s investments, including beyond the Portfolio's direct exposure to issuers in the affected regions. The escalation or expansion of hostilities including the involvement of additional nations, could introduce further uncertainty and volatility in global energy, commodity, and financial markets. The extent and duration of these conflicts, related sanctions, and resulting market disruptions are impossible to predict but could be substantial. A number of U.S. domestic banks and foreign (non-U.S.) banks have experienced financial difficulties and, in some cases, failures. There can be no certainty that the actions taken by regulators to limit the effect of those financial difficulties and failures on other banks or other financial institutions or on the U.S. or foreign (non-U.S.) economies generally will be successful. It is possible that more banks or other financial institutions will experience financial difficulties or fail, which may affect adversely other U.S. or foreign (non-U.S.) financial institutions and economies. These events as well as other changes in foreign (non-U.S.) and domestic economic, social, and political conditions also could adversely affect individual issuers or related groups of issuers, securities markets, interest rates, credit ratings, inflation, investor sentiment, and other factors affecting the value of the Portfolio’s investments. Any of these occurrences could disrupt the operations of the Portfolio and of the Portfolio’s service providers. Recent technological developments in, and the increasingly widespread use of, artificial intelligence, including machine learning technology and generative artificial intelligence (“AI”), may pose risks to the Portfolio. For instance, the economy may be significantly impacted by the advanced development and increased regulation of AI. As AI is used more widely, the profitability and growth of Portfolio holdings may be impacted, which could significantly impact the overall performance of the Portfolio. The legal and regulatory frameworks within which AI operates continue to rapidly evolve, and it is not possible to predict the full extent of current or future risks related thereto.
Money Market Regulatory: Changes in government regulations may adversely affect the value of a security held by the Portfolio. The SEC has adopted amendments to money market fund regulation that permit the Portfolio to impose discretionary liquidity fees, increase the Portfolio’s daily and weekly liquid asset minimum requirements and eliminate the ability of the Portfolio to temporarily suspend redemptions due to declines in the Portfolio's weekly liquid assets, among other changes. As of the date of this Prospectus, the Board has elected not to subject the Portfolio to such discretionary liquidity fees. These changes may result in reduced yields for money market funds, including the Portfolio, which may invest in other money market funds. The SEC or other regulators may adopt additional money market fund reforms, which may impact the structure and operation or performance of the Portfolio.
Voya Government Money Market Portfolio
9
Other Investment Companies (Money Market Funds): A money market fund may only invest in other investment companies that qualify as money market funds under Rule 2a-7 of the 1940 Act, and there is a risk that such money market funds may not comply with Rule 2a-7. You will pay a proportionate share of the expenses of those other investment companies (including management fees, administration fees, and custodial fees) in addition to the expenses of the Portfolio. The investment policies of the other investment companies may not be the same as those of the Portfolio; as a result, an investment in the other investment companies may be subject to additional or different risks than those to which the Portfolio is typically subject.
Prepayment and Extension: Many types of debt instruments are subject to prepayment and extension risk. Prepayment risk is the risk that the issuer of a debt instrument will pay back the principal earlier than expected. This risk is heightened in a falling market interest rate environment. Prepayment may expose the Portfolio to a lower rate of return upon reinvestment of principal. Also, if a debt instrument subject to prepayment has been purchased at a premium, the value of the premium would be lost in the event of prepayment. Extension risk is the risk that the issuer of a debt instrument will pay back the principal later than expected. This risk is heightened in a rising market interest rate environment. This may negatively affect performance, as the value of the debt instrument decreases when principal payments are made later than expected. Additionally, the Portfolio may be prevented from investing proceeds it would have received at a given time at the higher prevailing interest rates.
Repurchase Agreements: In the event that the other party to a repurchase agreement defaults on its obligations, the Portfolio would generally seek to sell the underlying security serving as collateral for the repurchase agreement. However, the value of collateral may be insufficient to satisfy the counterparty's obligation and/or the Portfolio may encounter delay and incur costs before being able to sell the security. Such a delay may involve loss of interest or a decline in price of the security, which could result in a loss. In addition, if the Portfolio is characterized by a court as an unsecured creditor, it would be at risk of losing some or all of the principal and interest involved in the transaction.
U.S. Government Securities and Obligations: U.S. government securities are obligations of, or guaranteed by, the U.S. government, its agencies, or government-sponsored enterprises. U.S. government securities are subject to market risk and interest rate risk, and may be subject to varying degrees of credit risk.
When-Issued, Delayed Delivery, and Forward Commitment Transactions: When-issued, delayed delivery, and forward commitment transactions involve the risk that the security the Portfolio buys will lose value prior to its delivery. These transactions may result in leverage. The use of leverage may exaggerate any increase or decrease in the net asset value, causing the Portfolio to be more volatile. The use of leverage may increase expenses and increase the impact of the Portfolio’s other risks. There also is the risk that the security will not be issued or that the other party will not meet its obligation. If this occurs, the Portfolio loses both the investment opportunity for the assets it set aside to pay for the security and any gain in the security’s price.
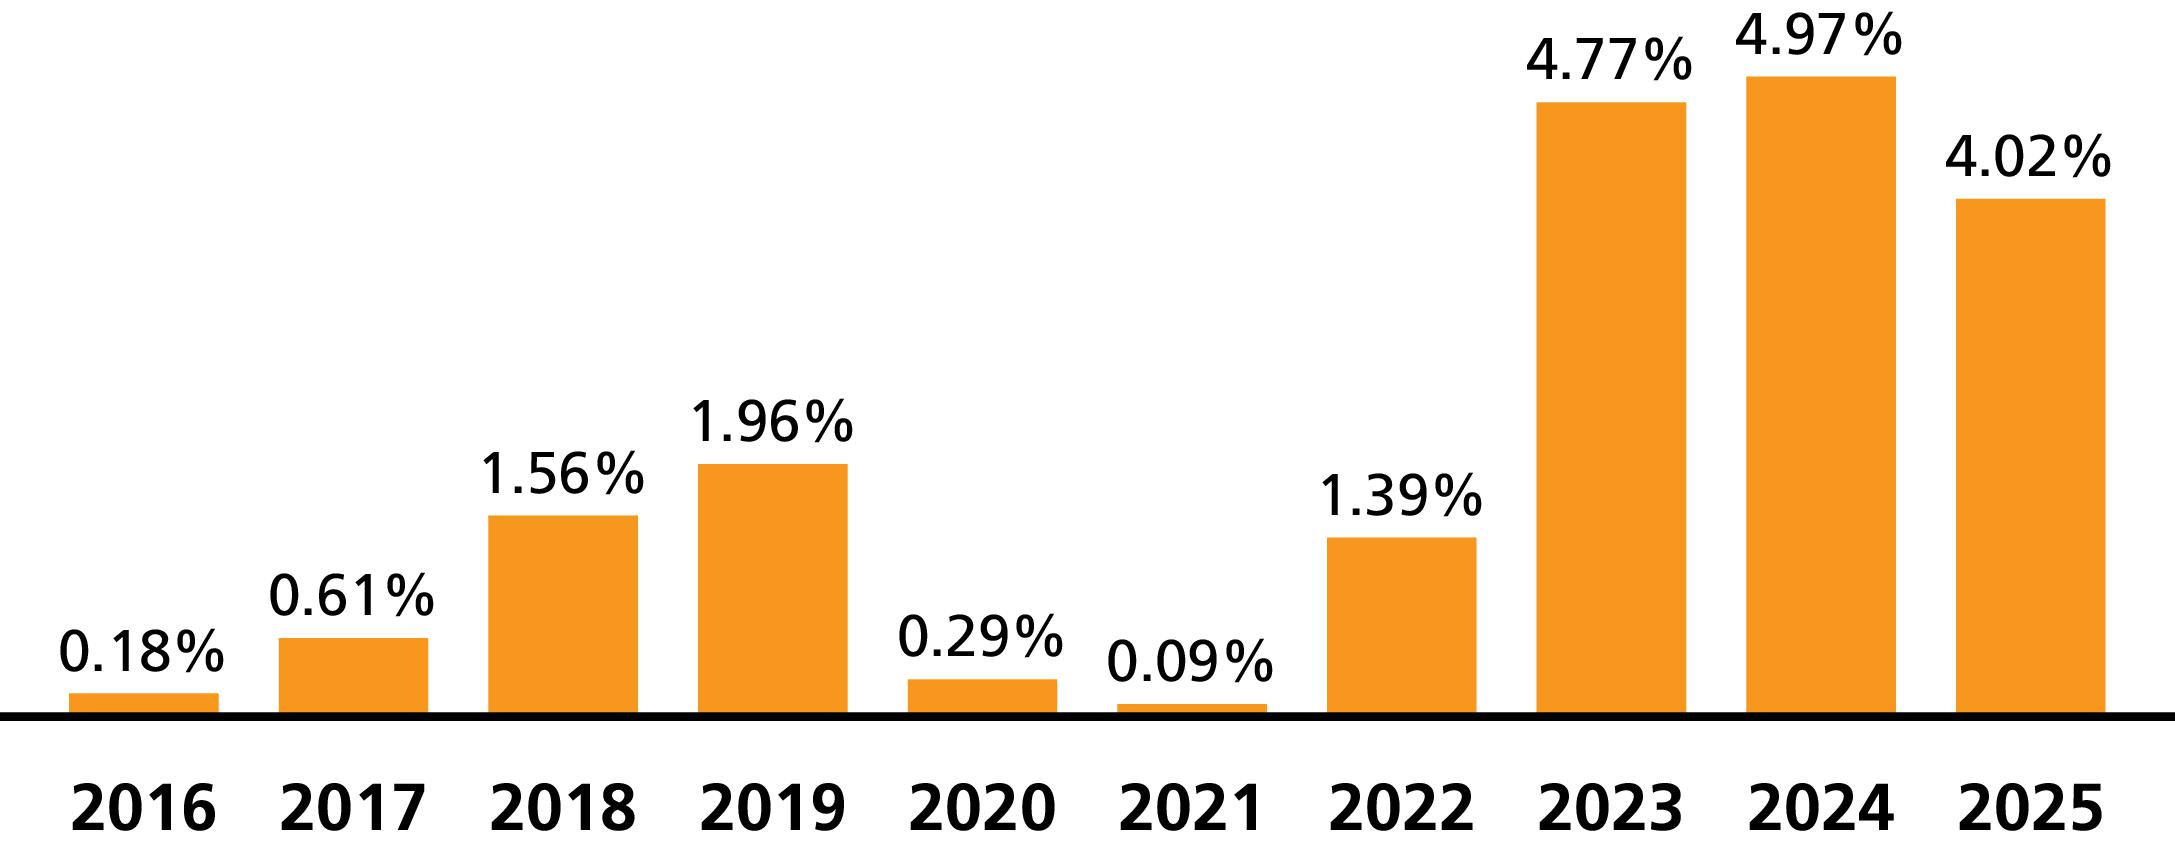
Performance Information
The following information is intended to help you understand the risks of investing in the Portfolio. The following bar chart shows the changes in the Portfolio's performance from year to year, and the table provides additional performance information. The Portfolio's performance information reflects applicable fee waivers and/or expense limitations in effect during the period presented. Absent such fee waivers/expense limitations, if any, performance would have been lower.
Performance shown in the bar chart and in the Average Annual Total Returns table does not include insurance-related charges imposed under a Variable Contract or expenses related to a Qualified Plan. If these charges or expenses were included, performance would be lower. Thus, you should not compare the Portfolio's performance directly with the performance information of other investment products without taking into account all insurance-related charges and expenses payable under your Variable Contract or Qualified Plan. The Portfolio's past performance is no guarantee of future results.
Prior to May 1, 2016, the Portfolio operated as a prime money market fund and invested in certain types of securities that the Portfolio is no longer permitted to hold. Consequently, the performance information below may have been different if the current investment limitations had been in effect during the period prior to the Portfolio’s conversion to a government money market fund.
Voya Government Money Market Portfolio
10
Calendar Year Total Returns Class I
(as of December 31 of each year)
(as of December 31 of each year)
|
Best quarter: |
4th Quarter 2023 |
1.27% |
|
Worst quarter: |
1st Quarter 2022 |
0.00% |
Average Annual Total Returns %
(for the periods ended December 31, 2025)
(for the periods ended December 31, 2025)
|
|
|
1 Yr |
5 Yrs |
10 Yrs |
Since
Inception |
Inception
Date |
|
Class I |
% |
4.02 |
3.02 |
1.96 |
N/A |
1/1/1980 |
For the Portfolio's current 7 day yield and current 7 day effective yield, when available, please call the Portfolio at 1-800-992-0180.
Portfolio Management
|
Investment Adviser |
|
Voya Investments, LLC |
|
Sub-Adviser |
|
Voya Investment Management Co. LLC |
|
Portfolio Managers |
|
|
Andrew Higley, CFA
Portfolio Manager (since 5/2026) |
Don Schatz
Portfolio Manager (since 5/2026) |
|
David S. Yealy
Portfolio Manager (since 11/2004) |
|
Purchase and Sale of Portfolio Shares
Shares of the Portfolio are not offered directly to the public. Purchase and sale of shares may be made only by separate accounts of insurance companies serving as investment options under Variable Contracts or by Qualified Plans, custodian accounts, and certain investment advisers and their affiliates, other investment companies, or permitted investors. Please refer to the prospectus for the appropriate insurance company separate account, investment company, or your plan documents for information on how to direct investments in, or sale from, an investment option corresponding to the Portfolio and any fees that may apply. Participating insurance companies and certain other designated organizations are authorized to receive purchase orders on the Portfolio's behalf.
Tax Information
Distributions made by the Portfolio to a Variable Contract or Qualified Plan, and exchanges and redemptions of Portfolio shares made by a Variable Contract or Qualified Plan, ordinarily do not cause the corresponding contract holder or plan participant to recognize income or gain for U.S. federal income tax purposes. See the Variable Contract prospectus or the governing documents of your Qualified Plan for information regarding the U.S. federal income tax treatment of the distributions to your Variable Contract or Qualified Plan and the holders of the contracts or plan participants.
Payments to Broker-Dealers and Other Financial Intermediaries
If you invest in the Portfolio through a Variable Contract issued by an insurance company or through a Qualified Plan that, in turn, was purchased or serviced through an insurance company, broker-dealer or other financial intermediary, the Portfolio and its Investment Adviser or distributor or their affiliates may: (1) make payments to the insurance company issuer of the Variable Contract or to the company servicing the Qualified Plan and (2) make payments to the insurance company, broker-dealer, or other financial intermediary. These payments may create a conflict of interest by: (1) influencing the insurance company or the company servicing the Qualified Plan to make the Portfolio available as an investment option for the Variable Contract or the Qualified Plan or (2) influencing the broker-dealer or other intermediary and your salesperson to recommend the Variable Contract or the pension servicing agent and/or the Portfolio over other options. Ask your salesperson or Qualified Plan administrator or visit your financial intermediary's website for more information.
Voya Government Money Market Portfolio
11
Expenses you pay each year as a % of the value of your investment
|
Class |
|
ADV |
I |
S |
S2 |
|
Management Fees |
% |
|
|
|
|
|
Distribution and/or Shareholder Services (12b-1) Fees |
% |
|
|
|
|
|
Other Expenses |
% |
|
|
|
|
|
Total Annual Portfolio Operating Expenses |
% |
|
|
|
|
|
Waivers and Reimbursements2 |
% |
( |
( |
( |
( |
|
Total Annual Portfolio Operating Expenses after
Waivers and Reimbursements |
% |
|
|
|
|
1
2
|
Class |
|
1 Yr |
3 Yrs |
5 Yrs |
10 Yrs |
|
ADV |
$ |
|
|
|
|
|
I |
$ |
|
|
|
|
|
S |
$ |
|
|
|
|
|
S2 |
$ |
|
|
|
|
12
Voya Growth and Income Portfolio
Principal Risks
Voya Growth and Income Portfolio
13
Voya Growth and Income Portfolio
14
Voya Growth and Income Portfolio
15
Voya Growth and Income Portfolio
16
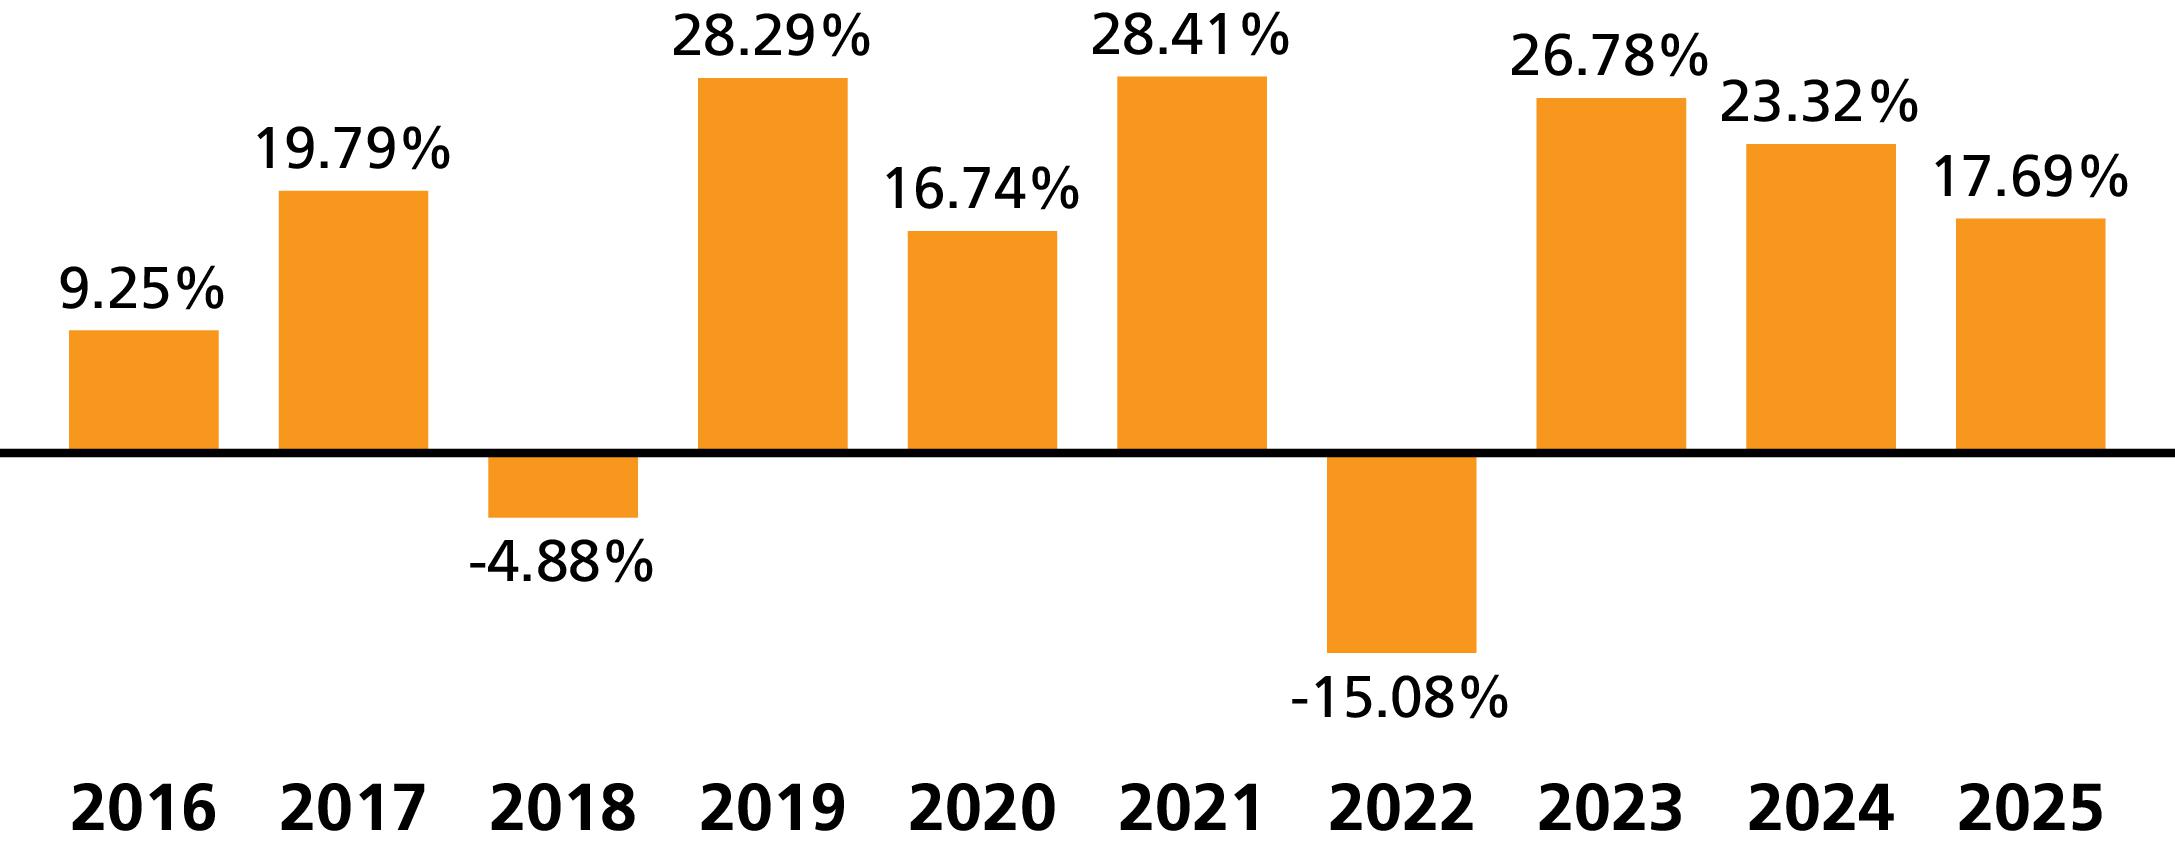
(as of December 31 of each year)
|
|
|
|
|
|
|
|
(for the periods ended December 31, 2025)
|
|
|
1 Yr |
5 Yrs |
10 Yrs |
Since
Inception |
Inception
Date |
|
Class ADV |
% |
|
|
|
N/A |
|
|
Russell 3000® Index1 |
% |
|
|
|
N/A |
|
|
S&P 500® Index1 |
% |
|
|
|
N/A |
|
|
Class I |
% |
|
|
|
N/A |
|
|
Russell 3000® Index1 |
% |
|
|
|
N/A |
|
|
S&P 500® Index1 |
% |
|
|
|
N/A |
|
|
Class S |
% |
|
|
|
N/A |
|
|
Russell 3000® Index1 |
% |
|
|
|
N/A |
|
|
S&P 500® Index1 |
% |
|
|
|
N/A |
|
|
Class S2 |
% |
|
|
|
N/A |
|
|
Russell 3000® Index1 |
% |
|
|
|
N/A |
|
|
S&P 500® Index1 |
% |
|
|
|
N/A |
|
1
Voya Growth and Income Portfolio
17
Portfolio Management
|
Investment Adviser |
|
Voya Investments, LLC |
|
Sub-Adviser |
|
Voya Investment Management Co. LLC |
|
Portfolio Managers |
|
|
James Dorment, CFA
Portfolio Manager (since 12/2015) |
Gregory Wachsman, CFA
Portfolio Manager (since 5/2021) |
Purchase and Sale of Portfolio Shares
Shares of the Portfolio are not offered directly to the public. Purchase and sale of shares may be made only by separate accounts of insurance companies serving as investment options under Variable Contracts or by Qualified Plans, custodian accounts, and certain investment advisers and their affiliates, other investment companies, or permitted investors. Please refer to the prospectus for the appropriate insurance company separate account, investment company, or your plan documents for information on how to direct investments in, or sale from, an investment option corresponding to the Portfolio and any fees that may apply. Participating insurance companies and certain other designated organizations are authorized to receive purchase orders on the Portfolio's behalf.
Tax Information
Distributions made by the Portfolio to a Variable Contract or Qualified Plan, and exchanges and redemptions of Portfolio shares made by a Variable Contract or Qualified Plan, ordinarily do not cause the corresponding contract holder or plan participant to recognize income or gain for U.S. federal income tax purposes. See the Variable Contract prospectus or the governing documents of your Qualified Plan for information regarding the U.S. federal income tax treatment of the distributions to your Variable Contract or Qualified Plan and the holders of the contracts or plan participants.
Payments to Broker-Dealers and Other Financial Intermediaries
If you invest in the Portfolio through a Variable Contract issued by an insurance company or through a Qualified Plan that, in turn, was purchased or serviced through an insurance company, broker-dealer or other financial intermediary, the Portfolio and its Investment Adviser or distributor or their affiliates may: (1) make payments to the insurance company issuer of the Variable Contract or to the company servicing the Qualified Plan and (2) make payments to the insurance company, broker-dealer, or other financial intermediary. These payments may create a conflict of interest by: (1) influencing the insurance company or the company servicing the Qualified Plan to make the Portfolio available as an investment option for the Variable Contract or the Qualified Plan or (2) influencing the broker-dealer or other intermediary and your salesperson to recommend the Variable Contract or the pension servicing agent and/or the Portfolio over other options. Ask your salesperson or Qualified Plan administrator or visit your financial intermediary's website for more information.
Voya Growth and Income Portfolio
18
Voya Index Plus LargeCap Portfolio
Investment Objective
The Portfolio seeks to outperform the total return performance of the S&P 500® Index (“Index”) while maintaining a market level of risk.
Fees and Expenses of the Portfolio
The table describes the fees and expenses that you may pay if you buy, hold, and sell shares of the Portfolio. You may pay other fees and expenses such as fees and expenses imposed under your variable annuity contracts or variable life insurance policies (“Variable Contract”) or a qualified pension or retirement plan (“Qualified Plan”), which are not reflected in the tables and examples below. If these fees or expenses were included in the table, the Portfolio’s expenses would be higher. For more information on these charges, please refer to the documents governing your Variable Contract or Qualified Plan or consult your plan administrator.
Annual Portfolio Operating Expenses1
Expenses you pay each year as a % of the value of your investment
Expenses you pay each year as a % of the value of your investment
|
Class |
|
ADV |
I |
S |
|
Management Fees |
% |
0.45 |
0.45 |
0.45 |
|
Distribution and/or Shareholder Services (12b-1) Fees |
% |
0.50 |
None |
0.25 |
|
Other Expenses |
% |
0.23 |
0.23 |
0.23 |
|
Total Annual Portfolio Operating Expenses |
% |
1.18 |
0.68 |
0.93 |
|
Waivers and Reimbursements2 |
% |
(0.13) |
(0.13) |
(0.13) |
|
Total Annual Portfolio Operating Expenses
after Waivers and Reimbursements |
% |
1.05 |
0.55 |
0.80 |
1
Expense information has been restated to reflect current contractual rates.
2
Voya Investments, LLC (the “Investment Adviser”) is contractually obligated to limit expenses to 1.05%, 0.55%, and 0.80% for Class ADV, Class I, and Class S shares, respectively, through May 1, 2027 (the “ Expense Limitation Agreement ” ) . The limitation does not extend to interest, taxes, other investment-related costs, leverage expenses, extraordinary expenses such as litigation or other expenses not incurred in the ordinary course of business, and expenses of any counsel or other persons or services retained by the directors who are not “ interested persons” as that term is defined by the Investment Company Act of 1940, as amended . Modification of the Expense Limitation Agreement requires written agreement signed by each of the parties and approval by the Portfolio's Board of Directors (the “Board”). The Expense Limitation Agreement shall terminate with respect to the Portfolio upon termination of the Portfolio' s advisory agreement with the Investment Adviser, or it may be terminated by Voya Variable Portfolios, Inc . (the “ Company ” ), without payment of any penalty, upon written notice to the Investment Adviser at its principal place of business .
Expense Example
This Example is intended to help you compare the cost of investing in shares of the Portfolio with the costs of investing in other mutual funds. The Example does not reflect expenses and charges which are, or may be, imposed under your Variable Contract or Qualified Plan. The Example assumes that you invest $10,000 in the Portfolio for the time periods indicated. The Example also assumes that your investment had a 5% return each year and that the Portfolio's operating expenses remain the same. The Example reflects applicable expense limitation agreements and/or waivers in effect, if any, for the one-year period and the first year of the time periods indicated . Although your actual costs may be higher or lower, based on these assumptions your costs would be:
|
Class |
|
1 Yr |
3 Yrs |
5 Yrs |
10 Yrs |
|
ADV |
$ |
107 |
362 |
636 |
1,420 |
|
I |
$ |
56 |
204 |
366 |
834 |
|
S |
$ |
82 |
283 |
502 |
1,131 |
Portfolio Turnover
The Portfolio pays transaction costs, such as commissions, when it buys and sells securities (or “turns over” its portfolio). A higher portfolio turnover rate may indicate higher transaction costs. These costs, which are not reflected in Annual Portfolio Operating Expenses or in the Expense Example, affect the Portfolio's performance.
During the most recent fiscal year, the Portfolio's portfolio turnover rate was 63% of the average value of its portfolio.
19
Voya Index Plus LargeCap Portfolio
Principal Investment Strategies
Under normal circumstances, the Portfolio invests at least 80% of its net assets (plus the amount of any borrowings for investment purposes) in investments tied to large-capitalization companies included in the Index. For purposes of this 80% policy, large-capitalization companies means companies that are included in the Index.
The Index is a stock market index comprised of common stocks of 500 of the largest companies traded in the United States and selected by S&P Global Ratings. The market capitalization of companies within the Index will change with market conditions. As of December 31, 2025, the market capitalization of companies within the Index ranged from $5.8 billion to $4.5 trillion.
The Portfolio may invest in derivative instruments including, but not limited to, index futures. The Portfolio typically uses derivatives as a substitute for purchasing securities included in the Index or for the purpose of maintaining equity market exposure on its cash balance.
The Portfolio may invest in real estate-related securities, including real estate investment trusts (“REITs”).
The Portfolio may invest in other investment companies, including exchange-traded funds (“ETFs”), to the extent permitted under the Investment Company Act of 1940, as amended, and the rules and regulations thereunder, and under the terms of applicable no-action relief or exemptive orders granted thereunder.
The Portfolio is actively managed. In managing the Portfolio, the sub-adviser (the “Sub-Adviser”) attempts to achieve the Portfolio’s objective by overweighting those stocks that the Sub-Adviser believes will outperform the Index, and underweighting (or avoiding altogether) those stocks in the Index that the Sub-Adviser believes will underperform the Index. In determining stock weightings, the Sub-Adviser uses both internally developed quantitative computer models and fundamental stock research to evaluate various criteria, such as the financial strength of each company and its potential for strong, sustained earnings growth. Although the Portfolio will not hold all of the stocks in the Index, the Sub-Adviser expects that there will be a close correlation between the performance of the Portfolio and that of the Index in both rising and falling markets as the Portfolio is designed to have risk characteristics (e.g., beta, size, volatility) that approximate those of the Index.
In evaluating investments for the Portfolio, the Sub-Adviser, through its quantitative methods and models, takes into account a wide variety of factors and considerations to determine whether any or all of those factors or considerations might have a material effect on the value, risks, or prospects of a company. Among the factors considered, the Sub-Adviser expects that its quantitative methods and models will typically take into account environmental, social, and governance (“ESG”) factors. In considering ESG factors, the Sub-Adviser’s quantitative methods and models will rely primarily on factors identified through the Sub-Adviser’s proprietary empirical research and on third-party evaluations of a company’s ESG standing, when available. ESG factors will be only one of many considerations in the evaluation of any potential investment; the extent to which ESG factors will affect the Sub-Adviser’s decision to invest in a company, if at all, will depend on the operation of the Sub-Adviser’s quantitative processes and the judgment of the Sub-Adviser.
The Sub-Adviser may sell securities for a variety of reasons, such as to secure gains, limit losses, or redeploy assets into opportunities believed to be more promising.
The Portfolio may lend portfolio securities on a short-term or long-term basis, up to 33 1∕3% of its total assets.
Principal Risks
You could lose money on an investment in the Portfolio. Any of the following risks, among others, could affect Portfolio performance or cause the Portfolio to lose money or to underperform market averages of other funds. The principal risks are presented in alphabetical order to facilitate readability, and their order does not imply that the realization of one risk is more likely to occur or have a greater adverse impact than another risk.
Company: The price of a company’s stock could decline or underperform for many reasons, including, among others, poor management, financial problems, reduced demand for the company’s goods or services, regulatory fines and judgments, or business challenges. If a company is unable to meet its financial obligations, declares bankruptcy, or becomes insolvent, its stock could become worthless.
Derivative Instruments: Derivative instruments are subject to a number of risks, including the risk of changes in the market price of the underlying asset, reference rate, or index, credit risk with respect to the counterparty, risk of loss due to changes in market interest rates, liquidity risk, valuation risk, and volatility risk. The amounts required to purchase certain derivatives may be small relative to the magnitude of exposure assumed by the Portfolio. Therefore, the purchase of certain derivatives may have an economic leveraging effect on the Portfolio and exaggerate any increase or decrease in the net asset value. Derivatives may not perform as expected, so the Portfolio may not realize the intended benefits. When used for hedging purposes, the change in value of a derivative may not correlate as expected with the asset, reference rate, or index being hedged. When used as an alternative or substitute for direct cash investment, the return provided by the derivative may not provide the same return as direct cash investment.
Voya Index Plus LargeCap Portfolio
20
Environmental, Social, and Governance (Quantitative): The Sub-Adviser’s consideration of ESG factors in selecting investments for the Portfolio depends on the operation of quantitative methods and models whose design reflects qualitative and subjective judgments of the Sub-Adviser, including reliance on, or incorporation of, data in respect of ESG factors that may rely on third-party data that might be incorrect or based on incomplete or inaccurate information. There is no minimum percentage of the Portfolio’s assets that will be invested in companies that the Sub-Adviser views favorably in light of ESG factors, and the Sub-Adviser may not invest in companies that compare favorably to other companies on the basis of ESG factors. It is possible that the Portfolio will have less exposure to certain companies due to the Sub-Adviser’s assessment of ESG factors than other comparable mutual funds. There can be no assurance that an investment selected by the Sub-Adviser, which includes its consideration of ESG factors, when available, will provide more favorable investment performance than another potential investment, and such an investment may, in fact, underperform other potential investments.
Investment Model: The Sub-Adviser’s proprietary investment model may not adequately take into account existing or unforeseen market factors or the interaction among such factors, including changes in how such factors interact, and there is no guarantee that the use of a proprietary investment model will result in effective investment decisions for the Portfolio. Portfolios that are actively managed, in whole or in part, according to a quantitative investment model (including models that utilize forms of artificial intelligence, such as machine learning) can perform differently from the market, based on the investment model and the factors used in the analysis, the weight placed on each factor, and changes from the factors’ historical trends. Technical issues in the design, development, implementation, application, and maintenance of the models ( e.g. , stale or inaccurate data, human error, programming or other software issues , coding errors, and technology failures ) may create errors or limitations that might go undetected or are discovered only after the errors or limitations have negatively impacted performance.
Liquidity: If a security is illiquid, the Portfolio might be unable to sell the security at a time when the Portfolio’s manager might wish to sell, or at all. Further, the lack of an established secondary market may make it more difficult to value illiquid securities, exposing the Portfolio to the risk that the prices at which it sells illiquid securities will be less than the prices at which they were valued when held by the Portfolio, which could cause the Portfolio to lose money. The prices of illiquid securities may be more volatile than more liquid securities, and the risks associated with illiquid securities may be greater in times of financial stress. Certain securities that are liquid when purchased may later become illiquid, particularly in times of overall economic distress or due to geopolitical events such as sanctions, trading halts, or wars. In addition, markets or securities may become illiquid quickly.
Market: The market values of securities will fluctuate, sometimes sharply and unpredictably, based on overall economic conditions, governmental actions or intervention, market disruptions caused by trade disputes or other factors, political developments, and other factors. Prices of equity securities tend to rise and fall more dramatically than those of debt instruments. Additionally, legislative, regulatory or tax policies or developments may adversely impact the investment techniques available to a manager, add to costs, and impair the ability of the Portfolio to achieve its investment objectives.
Market Capitalization: Stocks fall into three broad market capitalization categories: large, mid, and small. Investing primarily in one category carries the risk that, due to current market conditions, that category may be out of favor with investors. If valuations of large-capitalization companies appear to be greatly out of proportion to the valuations of mid- or small-capitalization companies, investors may migrate to the stocks of mid- and small-capitalization companies causing a fund that invests in these companies to increase in value more rapidly than a fund that invests in large-capitalization companies. Investing in mid- and small-capitalization companies may be subject to special risks associated with narrower product lines, more limited financial resources, smaller management groups, more limited publicly available information, and a more limited trading market for their stocks as compared with large-capitalization companies. As a result, stocks of mid- and small-capitalization companies may be more volatile and may decline significantly in market downturns.
Market Disruption and Geopolitical: The Portfolio is subject to the risk that geopolitical events will disrupt securities markets and adversely affect global economies and markets. Due to the increasing interdependence among global economies and markets, conditions in one country, market, or region might adversely impact markets, issuers and/or foreign exchange rates in other countries, including the United States. Wars, terrorism, global health crises and pandemics, trade disputes, tariffs and other restrictions on trade or economic sanctions, rapid technological developments (such as artificial intelligence technologies), and other geopolitical events that have led, and may continue to lead, to increased market volatility and may have adverse short- or long-term effects on U.S. and global economies and markets, generally. For example, the COVID-19 pandemic resulted in significant market volatility, exchange suspensions and closures, declines in global financial markets, higher default rates, supply chain disruptions, and a substantial economic downturn in economies throughout the world. The economic impacts of COVID-19 have created a unique challenge for real estate markets. Many businesses have either partially or fully transitioned to a remote-working environment and this transition may negatively impact the occupancy rates of commercial real estate over time. Natural and environmental disasters and systemic market dislocations are also highly disruptive to economies and markets. Military action by Russia in Ukraine, the prolonged conflict between Hamas and Israel, the Iranian conflict that commenced in February 2026, and political upheaval in Venezuela have resulted, and may continue to result, in sanctions, market disruptions,
Voya Index Plus LargeCap Portfolio
21
declines in regional and global stock markets, unusual volatility in global commodity markets, and disruptions to energy production or transportation, including through key shipping routes, any of which could adversely affect the value of the Portfolio ' s investments, including beyond the Portfolio's direct exposure to issuers in the affected regions. The escalation or expansion of hostilities including the involvement of additional nations, could introduce further uncertainty and volatility in global energy, commodity, and financial markets. The extent and duration of these conflicts, related sanctions, and resulting market disruptions are impossible to predict but could be substantial. A number of U.S. domestic banks and foreign (non-U.S.) banks have experienced financial difficulties and, in some cases, failures. There can be no certainty that the actions taken by regulators to limit the effect of those financial difficulties and failures on other banks or other financial institutions or on the U.S. or foreign (non-U.S.) economies generally will be successful. It is possible that more banks or other financial institutions will experience financial difficulties or fail, which may affect adversely other U.S. or foreign (non-U.S.) financial institutions and economies. These events as well as other changes in foreign (non-U.S.) and domestic economic, social, and political conditions also could adversely affect individual issuers or related groups of issuers, securities markets, interest rates, credit ratings, inflation, investor sentiment, and other factors affecting the value of the Portfolio’s investments. Any of these occurrences could disrupt the operations of the Portfolio and of the Portfolio’s service providers. Recent technological developments in, and the increasingly widespread use of, artificial intelligence, including machine learning technology and generative artificial intelligence (“AI”), may pose risks to the Portfolio. For instance, the economy may be significantly impacted by the advanced development and increased regulation of AI. As AI is used more widely, the profitability and growth of Portfolio holdings may be impacted, which could significantly impact the overall performance of the Portfolio. The legal and regulatory frameworks within which AI operates continue to rapidly evolve, and it is not possible to predict the full extent of current or future risks related thereto.
Other Investment Companies: The main risk of investing in other investment companies, including ETFs, is the risk that the value of an investment company’s underlying investments might decrease. Shares of investment companies that are listed on an exchange may trade at a discount or premium from their net asset value. You will pay a proportionate share of the expenses of those other investment companies (including management fees, administration fees, and custodial fees) in addition to the Portfolio’s expenses. The investment policies of the other investment companies may not be the same as those of the Portfolio; as a result, an investment in the other investment companies may be subject to additional or different risks than those to which the Portfolio is typically subject. In addition, shares of ETFs may trade at a premium or discount to net asset value and are subject to secondary market trading risks. Secondary markets may be subject to irregular trading activity, wide bid/ask spreads, and extended trade settlement periods in times of market stress because market makers and authorized participants may step away from making a market in an ETF’s shares, which could cause a material decline in the ETF’s net asset value.
Real Estate Companies and Real Estate Investment Trusts: Investing in real estate companies and REITs may subject the Portfolio to risks similar to those associated with the direct ownership of real estate, including losses from casualty or condemnation, changes in local and general economic conditions, supply and demand, market interest rates, zoning laws, regulatory limitations on rents, property taxes, overbuilding, high foreclosure rates, and operating expenses in addition to terrorist attacks, wars, or other acts that destroy real property. Some REITs may invest in a limited number of properties, in a narrow geographic area or in a single property type, which increases the risk that the Portfolio could be unfavorably affected by the poor performance of a single investment or investment type. These companies are also sensitive to factors such as changes in real estate values and property taxes, market interest rates, cash flow of underlying real estate assets, supply and demand, and the management skill and creditworthiness of the issuer. Borrowers could default on or sell investments the REIT holds, which could reduce the cash flow needed to make distributions to investors. In addition, REITs may also be affected by tax and regulatory requirements in that a REIT may not qualify for favorable tax treatment or regulatory exemptions. Investments in REITs are affected by the management skill of the REIT’s sponsor. The Portfolio will indirectly bear its proportionate share of expenses, including management fees, paid by each REIT in which it invests.
Securities Lending: Securities lending involves two primary risks: “ investment risk ” and “ borrower default risk. ” When lending securities, the Portfolio will receive cash or U.S. government securities as collateral. Investment risk is the risk that the Portfolio will lose money from the investment of the cash collateral received from the borrower. Borrower default risk is the risk that the Portfolio will lose money due to the failure of a borrower to return a borrowed security. Securities lending may result in leverage. The use of leverage may exaggerate any increase or decrease in the net asset value, causing the Portfolio to be more volatile. The use of leverage may increase expenses and increase the impact of the Portfolio’s other risks.
An investment in the Portfolio is not a bank deposit and is not insured or guaranteed by the Federal Deposit Insurance Corporation, the Federal Reserve Board or any other government agency.
Performance Information
The following information is intended to help you understand the risks of investing in the Portfolio. The following bar chart shows the changes in the Portfolio's performance from year to year, and the table compares the Portfolio's performance to the performance of a broad-based securities market index and an additional index with investment characteristics similar to
Voya Index Plus LargeCap Portfolio
22
those of the Portfolio for the same period. In 2024, the Investment Adviser changed the Portfolio’s primary benchmark from the S&P 500® Index to the Russell 3000® Index in accordance with changes to regulatory disclosure requirements. The Portfolio continues to use the S&P 500® Index as an additional benchmark that the Investment Adviser believes more closely reflects the Portfolio’s principal investment strategies. The Portfolio's performance information reflects applicable fee waivers and/or expense limitations in effect during the period presented. Absent such fee waivers/expense limitations, if any, performance would have been lower. The bar chart shows the performance of the Portfolio's Class S shares. Performance for other share classes would differ to the extent they have differences in their fees and expenses. The Class ADV shares performance shown for the period prior to their inception date is the performance of Class I shares adjusted for any differences in expenses between the classes.
Performance shown in the bar chart and in the Average Annual Total Returns table does not include insurance-related charges imposed under a Variable Contract or expenses related to a Qualified Plan. If these charges or expenses were included, performance would be lower. Thus, you should not compare the Portfolio's performance directly with the performance information of other investment products without taking into account all insurance-related charges and expenses payable under your Variable Contract or Qualified Plan. The Portfolio's past performance is no guarantee of future results.
Calendar Year Total Returns Class S
(as of December 31 of each year)
(as of December 31 of each year)
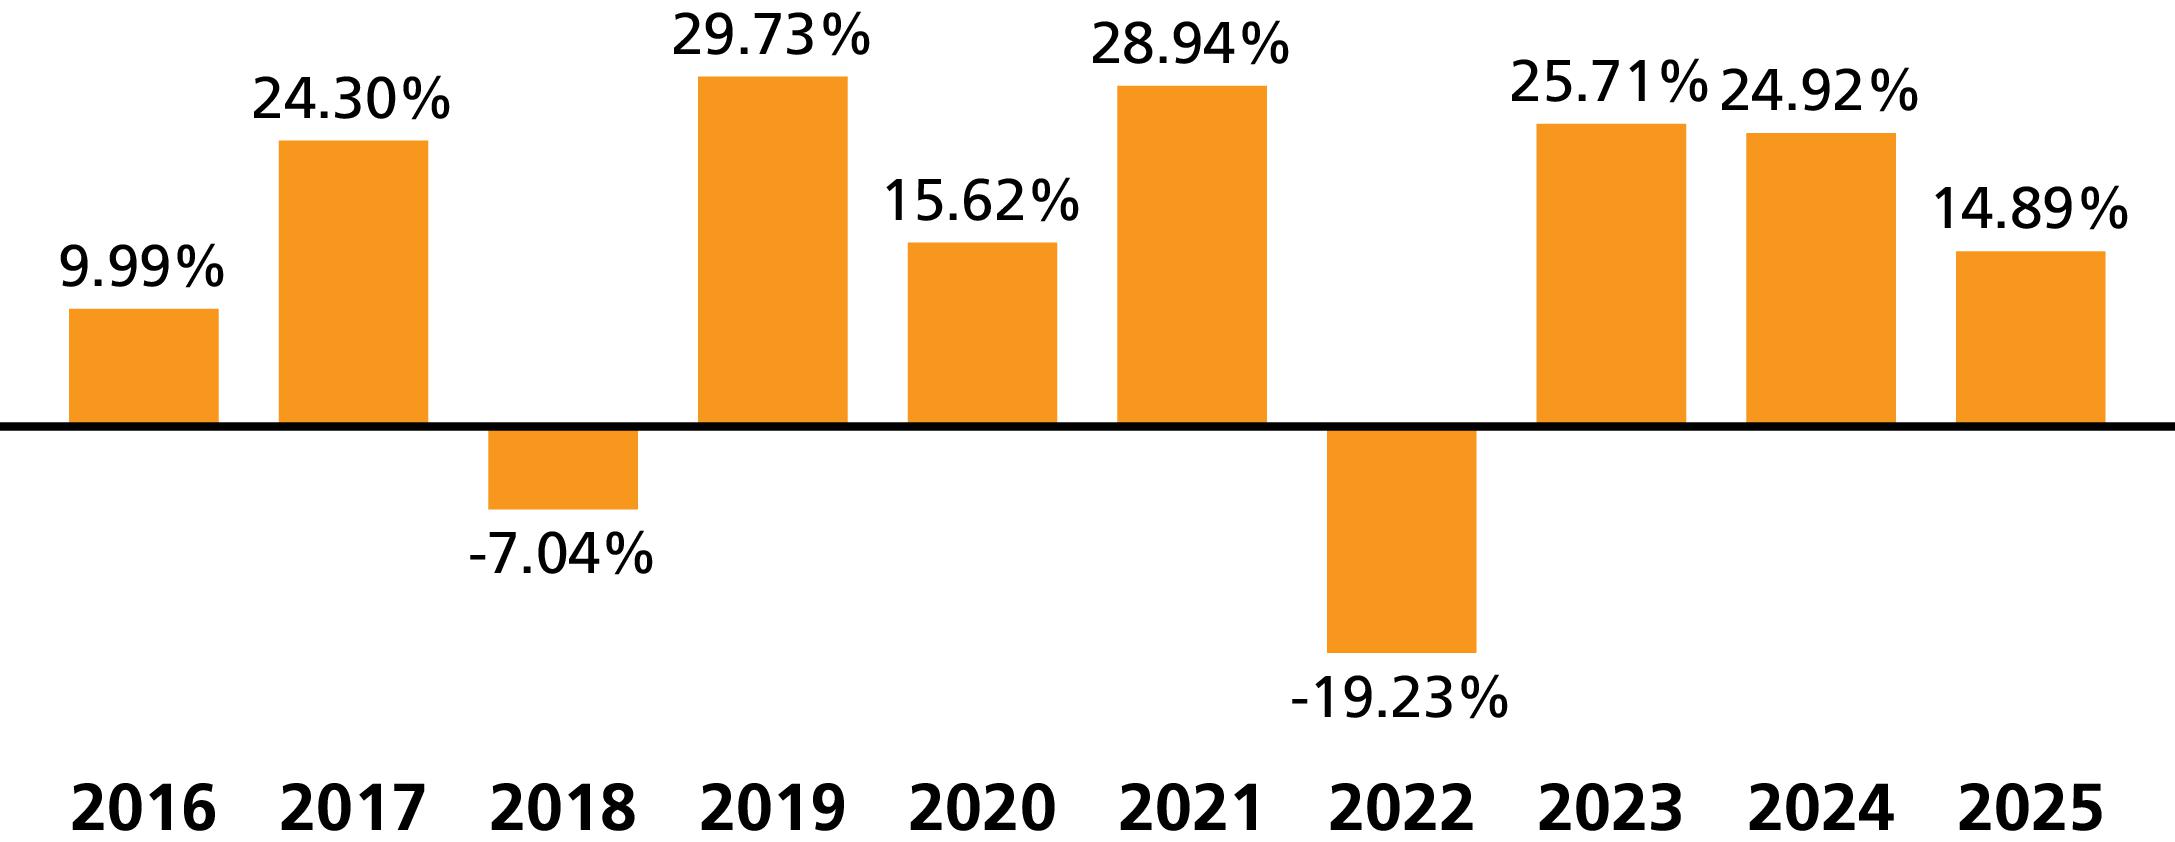
|
Best quarter: |
2nd Quarter 2020 |
21.28% |
|
Worst quarter: |
1st Quarter 2020 |
-21.55% |
Average Annual Total Returns %
(for the periods ended December 31, 2025)
(for the periods ended December 31, 2025)
|
|
|
1 Yr |
5 Yrs |
10 Yrs |
Since
Inception |
Inception
Date |
|
Class ADV |
% |
14.62 |
13.16 |
13.33 |
N/A |
8/24/2018 |
|
Russell 3000® Index1 |
% |
17.15 |
13.15 |
14.29 |
N/A |
|
|
S&P 500® Index1 |
% |
17.88 |
14.42 |
14.82 |
N/A |
|
|
Class I |
% |
15.20 |
13.73 |
13.90 |
N/A |
9/16/1996 |
|
Russell 3000® Index1 |
% |
17.15 |
13.15 |
14.29 |
N/A |
|
|
S&P 500® Index1 |
% |
17.88 |
14.42 |
14.82 |
N/A |
|
|
Class S |
% |
14.89 |
13.44 |
13.61 |
N/A |
7/16/2001 |
|
Russell 3000® Index1 |
% |
17.15 |
13.15 |
14.29 |
N/A |
|
|
S&P 500® Index1 |
% |
17.88 |
14.42 |
14.82 |
N/A |
|
1
The index returns do not reflect deductions for fees, expenses, or taxes.
Portfolio Management
|
Investment Adviser |
|
Voya Investments, LLC |
|
Sub-Adviser |
|
Voya Investment Management Co. LLC |
|
Portfolio Managers |
|
|
Steve Gao, PhD, CFA, FRM
Portfolio Manager (since 10/2025) |
Russell Shtern, CFA
Portfolio Manager (since 10/2025) |
|
Kai Yee Wong
Portfolio Manager (since 2/2019) |
|
Voya Index Plus LargeCap Portfolio
23
Purchase and Sale of Portfolio Shares
Shares of the Portfolio are not offered directly to the public. Purchase and sale of shares may be made only by separate accounts of insurance companies serving as investment options under Variable Contracts or by Qualified Plans, custodian accounts, and certain investment advisers and their affiliates, other investment companies, or permitted investors. Please refer to the prospectus for the appropriate insurance company separate account, investment company, or your plan documents for information on how to direct investments in, or sale from, an investment option corresponding to the Portfolio and any fees that may apply. Participating insurance companies and certain other designated organizations are authorized to receive purchase orders on the Portfolio's behalf.
Tax Information
Distributions made by the Portfolio to a Variable Contract or Qualified Plan, and exchanges and redemptions of Portfolio shares made by a Variable Contract or Qualified Plan, ordinarily do not cause the corresponding contract holder or plan participant to recognize income or gain for U.S. federal income tax purposes. See the Variable Contract prospectus or the governing documents of your Qualified Plan for information regarding the U.S. federal income tax treatment of the distributions to your Variable Contract or Qualified Plan and the holders of the contracts or plan participants.
Payments to Broker-Dealers and Other Financial Intermediaries
If you invest in the Portfolio through a Variable Contract issued by an insurance company or through a Qualified Plan that, in turn, was purchased or serviced through an insurance company, broker-dealer or other financial intermediary, the Portfolio and its Investment Adviser or distributor or their affiliates may: (1) make payments to the insurance company issuer of the Variable Contract or to the company servicing the Qualified Plan and (2) make payments to the insurance company, broker-dealer, or other financial intermediary. These payments may create a conflict of interest by: (1) influencing the insurance company or the company servicing the Qualified Plan to make the Portfolio available as an investment option for the Variable Contract or the Qualified Plan or (2) influencing the broker-dealer or other intermediary and your salesperson to recommend the Variable Contract or the pension servicing agent and/or the Portfolio over other options. Ask your salesperson or Qualified Plan administrator or visit your financial intermediary's website for more information.
Voya Index Plus LargeCap Portfolio
24
Voya Index Plus MidCap Portfolio
Investment Objective
The Portfolio seeks to outperform the total return performance of the S&P MidCap 400® Index (“Index”) while maintaining a market level of risk.
Fees and Expenses of the Portfolio
The table describes the fees and expenses that you may pay if you buy, hold, and sell shares of the Portfolio. You may pay other fees and expenses such as fees and expenses imposed under your variable annuity contracts or variable life insurance policies (“Variable Contract”) or a qualified pension or retirement plan (“Qualified Plan”), which are not reflected in the tables and examples below. If these fees or expenses were included in the table, the Portfolio’s expenses would be higher. For more information on these charges, please refer to the documents governing your Variable Contract or Qualified Plan or consult your plan administrator.
Annual Portfolio Operating Expenses1
Expenses you pay each year as a % of the value of your investment
Expenses you pay each year as a % of the value of your investment
|
Class |
|
I |
S |
|
Management Fees |
% |
0.50 |
0.50 |
|
Distribution and/or Shareholder Services (12b-1) Fees |
% |
None |
0.25 |
|
Other Expenses |
% |
0.19 |
0.19 |
|
Total Annual Portfolio Operating Expenses |
% |
0.69 |
0.94 |
|
Waivers and Reimbursements2 |
% |
(0.09) |
(0.09) |
|
Total Annual Portfolio Operating Expenses
after Waivers and Reimbursements |
% |
0.60 |
0.85 |
1
Expense information has been restated to reflect current contractual rates.
2
Voya Investments, LLC (the “Investment Adviser”) is contractually obligated to limit expenses to 0.60% and 0.85% for Class I and Class S shares, respectively, through May 1, 2027 (the “Expense Limitation Agreement”). The limitation does not extend to interest, taxes, other investment-related costs, leverage expenses, extraordinary expenses such as litigation or other expenses not incurred in the ordinary course of business, and expenses of any counsel or other persons or services retained by the directors who are not “ interested persons ” as that term is defined by the Investment Company Act of 1940, as amended . Modification of the Expense Limitation Agreement requires written agreement signed by each of the parties and approval by the Portfolio's Board of Directors (the “Board”). The Expense Limitation Agreement shall terminate with respect to the Portfolio upon termination of the Portfolio' s advisory agreement with the Investment Adviser, or it may be terminated by Voya Variable Portfolios, Inc . (the “ Company ” ), without payment of any penalty, upon written notice to the Investment Adviser at its principal place of business .
Expense Example
This Example is intended to help you compare the cost of investing in shares of the Portfolio with the costs of investing in other mutual funds. The Example does not reflect expenses and charges which are, or may be, imposed under your Variable Contract or Qualified Plan. The Example assumes that you invest $10,000 in the Portfolio for the time periods indicated. The Example also assumes that your investment had a 5% return each year and that the Portfolio's operating expenses remain the same. The Example reflects applicable expense limitation agreements and/or waivers in effect, if any, for the one-year period and the first year of the time periods indicated . Although your actual costs may be higher or lower, based on these assumptions your costs would be:
|
Class |
|
1 Yr |
3 Yrs |
5 Yrs |
10 Yrs |
|
I |
$ |
61 |
212 |
375 |
850 |
|
S |
$ |
87 |
291 |
511 |
1,146 |
Portfolio Turnover
The Portfolio pays transaction costs, such as commissions, when it buys and sells securities (or “turns over” its portfolio). A higher portfolio turnover rate may indicate higher transaction costs. These costs, which are not reflected in Annual Portfolio Operating Expenses or in the Expense Example, affect the Portfolio's performance.
During the most recent fiscal year, the Portfolio's portfolio turnover rate was 71% of the average value of its portfolio.
25
Voya Index Plus MidCap Portfolio
Principal Investment Strategies
Under normal circumstances, the Portfolio invests at least 80% of its net assets (plus the amount of any borrowings for investment purposes) in investments tied to mid-capitalization companies included in the Index. For purposes of this 80% policy, mid-capitalization companies means companies that are included in the Index.
The Index is a stock market index comprised of common stocks of 400 mid-capitalization companies traded in the United States and selected by S&P Global Ratings. The market capitalization of companies within the Index will change with market conditions. As of December 31, 2025, the market capitalization of companies within the Index ranged from $2.1 billion to $32.9 billion.
The Portfolio may invest in derivative instruments including, but not limited to, index futures. The Portfolio typically uses derivatives as a substitute for purchasing securities included in the Index or for the purpose of maintaining equity market exposure on its cash balance.
The Portfolio may invest in real estate-related securities, including real estate investment trusts (“REITs”).
The Portfolio may invest in other investment companies, including exchange-traded funds (“ETFs”), to the extent permitted under the Investment Company Act of 1940, as amended, and the rules and regulations thereunder, and under the terms of applicable no-action relief or exemptive orders granted thereunder.
The Portfolio is actively managed. In managing the Portfolio, the sub-adviser (the “Sub-Adviser”) attempts to achieve the Portfolio’s objective by overweighting those stocks that the Sub-Adviser believes will outperform the Index, and underweighting (or avoiding altogether) those stocks in the Index that the Sub-Adviser believes will underperform the Index. In determining stock weightings, the Sub-Adviser uses both internally developed quantitative computer models and fundamental stock research to evaluate various criteria, such as the financial strength of each company and its potential for strong, sustained earnings growth. Although the Portfolio will not hold all of the stocks in the Index, the Sub-Adviser expects that there will be a close correlation between the performance of the Portfolio and that of the Index in both rising and falling markets as the Portfolio is designed to have risk characteristics (e.g., beta, size, volatility) that approximate those of the Index.
In evaluating investments for the Portfolio, the Sub-Adviser, through its quantitative methods and models, takes into account a wide variety of factors and considerations to determine whether any or all of those factors or considerations might have a material effect on the value, risks, or prospects of a company. Among the factors considered, the Sub-Adviser expects that its quantitative methods and models will typically take into account environmental, social, and governance (“ESG”) factors. In considering ESG factors, the Sub-Adviser’s quantitative methods and models will rely primarily on factors identified through the Sub-Adviser’s proprietary empirical research and on third-party evaluations of a company’s ESG standing, when available. ESG factors will be only one of many considerations in the evaluation of any potential investment; the extent to which ESG factors will affect the Sub-Adviser’s decision to invest in a company, if at all, will depend on the operation of the Sub-Adviser’s quantitative processes and the judgment of the Sub-Adviser.
The Sub-Adviser may sell securities for a variety of reasons, such as to secure gains, limit losses, or redeploy assets into opportunities believed to be more promising.
The Portfolio may lend portfolio securities on a short-term or long-term basis, up to 33 1∕3% of its total assets.
Principal Risks
You could lose money on an investment in the Portfolio. Any of the following risks, among others, could affect Portfolio performance or cause the Portfolio to lose money or to underperform market averages of other funds. The principal risks are presented in alphabetical order to facilitate readability, and their order does not imply that the realization of one risk is more likely to occur or have a greater adverse impact than another risk.
Company: The price of a company’s stock could decline or underperform for many reasons, including, among others, poor management, financial problems, reduced demand for the company’s goods or services, regulatory fines and judgments, or business challenges. If a company is unable to meet its financial obligations, declares bankruptcy, or becomes insolvent, its stock could become worthless.
Derivative Instruments: Derivative instruments are subject to a number of risks, including the risk of changes in the market price of the underlying asset, reference rate, or index, credit risk with respect to the counterparty, risk of loss due to changes in market interest rates, liquidity risk, valuation risk, and volatility risk. The amounts required to purchase certain derivatives may be small relative to the magnitude of exposure assumed by the Portfolio. Therefore, the purchase of certain derivatives may have an economic leveraging effect on the Portfolio and exaggerate any increase or decrease in the net asset value. Derivatives may not perform as expected, so the Portfolio may not realize the intended benefits. When used for hedging
Voya Index Plus MidCap Portfolio
26
purposes, the change in value of a derivative may not correlate as expected with the asset, reference rate, or index being hedged. When used as an alternative or substitute for direct cash investment, the return provided by the derivative may not provide the same return as direct cash investment.
Environmental, Social, and Governance (Quantitative): The Sub-Adviser’s consideration of ESG factors in selecting investments for the Portfolio depends on the operation of quantitative methods and models whose design reflects qualitative and subjective judgments of the Sub-Adviser, including reliance on, or incorporation of, data in respect of ESG factors that may rely on third-party data that might be incorrect or based on incomplete or inaccurate information. There is no minimum percentage of the Portfolio’s assets that will be invested in companies that the Sub-Adviser views favorably in light of ESG factors, and the Sub-Adviser may not invest in companies that compare favorably to other companies on the basis of ESG factors. It is possible that the Portfolio will have less exposure to certain companies due to the Sub-Adviser’s assessment of ESG factors than other comparable mutual funds. There can be no assurance that an investment selected by the Sub-Adviser, which includes its consideration of ESG factors, when available, will provide more favorable investment performance than another potential investment, and such an investment may, in fact, underperform other potential investments.
Investment Model: The Sub-Adviser’s proprietary investment model may not adequately take into account existing or unforeseen market factors or the interaction among such factors, including changes in how such factors interact, and there is no guarantee that the use of a proprietary investment model will result in effective investment decisions for the Portfolio. Portfolios that are actively managed, in whole or in part, according to a quantitative investment model (including models that utilize forms of artificial intelligence, such as machine learning) can perform differently from the market, based on the investment model and the factors used in the analysis, the weight placed on each factor, and changes from the factors’ historical trends. Technical issues in the design, development, implementation, application, and maintenance of the models ( e.g. , stale or inaccurate data, human error, programming or other software issues , coding errors, and technology failures ) may create errors or limitations that might go undetected or are discovered only after the errors or limitations have negatively impacted performance.
Liquidity: If a security is illiquid, the Portfolio might be unable to sell the security at a time when the Portfolio’s manager might wish to sell, or at all. Further, the lack of an established secondary market may make it more difficult to value illiquid securities, exposing the Portfolio to the risk that the prices at which it sells illiquid securities will be less than the prices at which they were valued when held by the Portfolio, which could cause the Portfolio to lose money. The prices of illiquid securities may be more volatile than more liquid securities, and the risks associated with illiquid securities may be greater in times of financial stress. Certain securities that are liquid when purchased may later become illiquid, particularly in times of overall economic distress or due to geopolitical events such as sanctions, trading halts, or wars. In addition, markets or securities may become illiquid quickly.
Market: The market values of securities will fluctuate, sometimes sharply and unpredictably, based on overall economic conditions, governmental actions or intervention, market disruptions caused by trade disputes or other factors, political developments, and other factors. Prices of equity securities tend to rise and fall more dramatically than those of debt instruments. Additionally, legislative, regulatory or tax policies or developments may adversely impact the investment techniques available to a manager, add to costs, and impair the ability of the Portfolio to achieve its investment objectives.
Market Disruption and Geopolitical: The Portfolio is subject to the risk that geopolitical events will disrupt securities markets and adversely affect global economies and markets. Due to the increasing interdependence among global economies and markets, conditions in one country, market, or region might adversely impact markets, issuers and/or foreign exchange rates in other countries, including the United States. Wars, terrorism, global health crises and pandemics, trade disputes, tariffs and other restrictions on trade or economic sanctions, rapid technological developments (such as artificial intelligence technologies), and other geopolitical events that have led, and may continue to lead, to increased market volatility and may have adverse short- or long-term effects on U.S. and global economies and markets, generally. For example, the COVID-19 pandemic resulted in significant market volatility, exchange suspensions and closures, declines in global financial markets, higher default rates, supply chain disruptions, and a substantial economic downturn in economies throughout the world. The economic impacts of COVID-19 have created a unique challenge for real estate markets. Many businesses have either partially or fully transitioned to a remote-working environment and this transition may negatively impact the occupancy rates of commercial real estate over time. Natural and environmental disasters and systemic market dislocations are also highly disruptive to economies and markets. Military action by Russia in Ukraine, the prolonged conflict between Hamas and Israel, the Iranian conflict that commenced in February 2026, and political upheaval in Venezuela have resulted, and may continue to result, in sanctions, market disruptions, declines in regional and global stock markets, unusual volatility in global commodity markets, and disruptions to energy production or transportation, including through key shipping routes, any of which could adversely affect the value of the Portfolio ' s investments, including beyond the Portfolio's direct exposure to issuers in the affected regions. The escalation or expansion of hostilities including the involvement of additional nations, could introduce further uncertainty and volatility in global energy, commodity, and financial markets. The extent and duration of these conflicts, related sanctions, and resulting market disruptions are impossible to predict but could be substantial. A number of U.S. domestic banks and foreign (non-U.S.) banks have experienced
Voya Index Plus MidCap Portfolio
27
financial difficulties and, in some cases, failures. There can be no certainty that the actions taken by regulators to limit the effect of those financial difficulties and failures on other banks or other financial institutions or on the U.S. or foreign (non-U.S.) economies generally will be successful. It is possible that more banks or other financial institutions will experience financial difficulties or fail, which may affect adversely other U.S. or foreign (non-U.S.) financial institutions and economies. These events as well as other changes in foreign (non-U.S.) and domestic economic, social, and political conditions also could adversely affect individual issuers or related groups of issuers, securities markets, interest rates, credit ratings, inflation, investor sentiment, and other factors affecting the value of the Portfolio’s investments. Any of these occurrences could disrupt the operations of the Portfolio and of the Portfolio’s service providers. Recent technological developments in, and the increasingly widespread use of, artificial intelligence, including machine learning technology and generative artificial intelligence (“AI”), may pose risks to the Portfolio. For instance, the economy may be significantly impacted by the advanced development and increased regulation of AI. As AI is used more widely, the profitability and growth of Portfolio holdings may be impacted, which could significantly impact the overall performance of the Portfolio. The legal and regulatory frameworks within which AI operates continue to rapidly evolve, and it is not possible to predict the full extent of current or future risks related thereto.
Mid-Capitalization Company: Investments in mid-capitalization companies may involve greater risk than is customarily associated with larger, more established companies due to the greater business risks of a limited operating history, smaller size, limited markets, and financial resources, narrow product lines, less management depth, and more reliance on key personnel. Consequently, the securities of mid-capitalization companies may have limited market stability and may be subject to more abrupt or erratic market movements than securities of larger, more established growth companies or the market averages in general.
Other Investment Companies: The main risk of investing in other investment companies, including ETFs, is the risk that the value of an investment company’s underlying investments might decrease. Shares of investment companies that are listed on an exchange may trade at a discount or premium from their net asset value. You will pay a proportionate share of the expenses of those other investment companies (including management fees, administration fees, and custodial fees) in addition to the Portfolio’s expenses. The investment policies of the other investment companies may not be the same as those of the Portfolio; as a result, an investment in the other investment companies may be subject to additional or different risks than those to which the Portfolio is typically subject. In addition, shares of ETFs may trade at a premium or discount to net asset value and are subject to secondary market trading risks. Secondary markets may be subject to irregular trading activity, wide bid/ask spreads, and extended trade settlement periods in times of market stress because market makers and authorized participants may step away from making a market in an ETF’s shares, which could cause a material decline in the ETF’s net asset value.
Real Estate Companies and Real Estate Investment Trusts: Investing in real estate companies and REITs may subject the Portfolio to risks similar to those associated with the direct ownership of real estate, including losses from casualty or condemnation, changes in local and general economic conditions, supply and demand, market interest rates, zoning laws, regulatory limitations on rents, property taxes, overbuilding, high foreclosure rates, and operating expenses in addition to terrorist attacks, wars, or other acts that destroy real property. In addition, REITs may also be affected by tax and regulatory requirements in that a REIT may not qualify for favorable tax treatment or regulatory exemptions. Investments in REITs are affected by the management skill of the REIT’s sponsor. The Portfolio will indirectly bear its proportionate share of expenses, including management fees, paid by each REIT in which it invests.
Securities Lending: Securities lending involves two primary risks: “ investment risk ” and “ borrower default risk. ” When lending securities, the Portfolio will receive cash or U.S. government securities as collateral. Investment risk is the risk that the Portfolio will lose money from the investment of the cash collateral received from the borrower. Borrower default risk is the risk that the Portfolio will lose money due to the failure of a borrower to return a borrowed security. Securities lending may result in leverage. The use of leverage may exaggerate any increase or decrease in the net asset value, causing the Portfolio to be more volatile. The use of leverage may increase expenses and increase the impact of the Portfolio’s other risks.
An investment in the Portfolio is not a bank deposit and is not insured or guaranteed by the Federal Deposit Insurance Corporation, the Federal Reserve Board or any other government agency.
Performance Information
The following information is intended to help you understand the risks of investing in the Portfolio. The following bar chart shows the changes in the Portfolio's performance from year to year, and the table compares the Portfolio's performance to the performance of a broad-based securities market index and an additional index with investment characteristics similar to those of the Portfolio for the same period. In 2024, the Investment Adviser changed the Portfolio’s primary benchmark from the S&P MidCap 400® Index to the Russell 3000® Index in accordance with changes to regulatory disclosure requirements. The Portfolio continues to use the S&P MidCap 400® Index as an additional benchmark that the Investment Adviser believes more closely reflects the Portfolio’s principal investment strategies. The Portfolio's performance information reflects applicable fee waivers and/or expense limitations in effect during the period presented. Absent such fee waivers/expense limitations,
Voya Index Plus MidCap Portfolio
28
if any, performance would have been lower. The bar chart shows the performance of the Portfolio's Class S shares. Performance for other share classes would differ to the extent they have differences in their fees and expenses.
Performance shown in the bar chart and in the Average Annual Total Returns table does not include insurance-related charges imposed under a Variable Contract or expenses related to a Qualified Plan. If these charges or expenses were included, performance would be lower. Thus, you should not compare the Portfolio's performance directly with the performance information of other investment products without taking into account all insurance-related charges and expenses payable under your Variable Contract or Qualified Plan. The Portfolio's past performance is no guarantee of future results.
Calendar Year Total Returns Class S
(as of December 31 of each year)
(as of December 31 of each year)
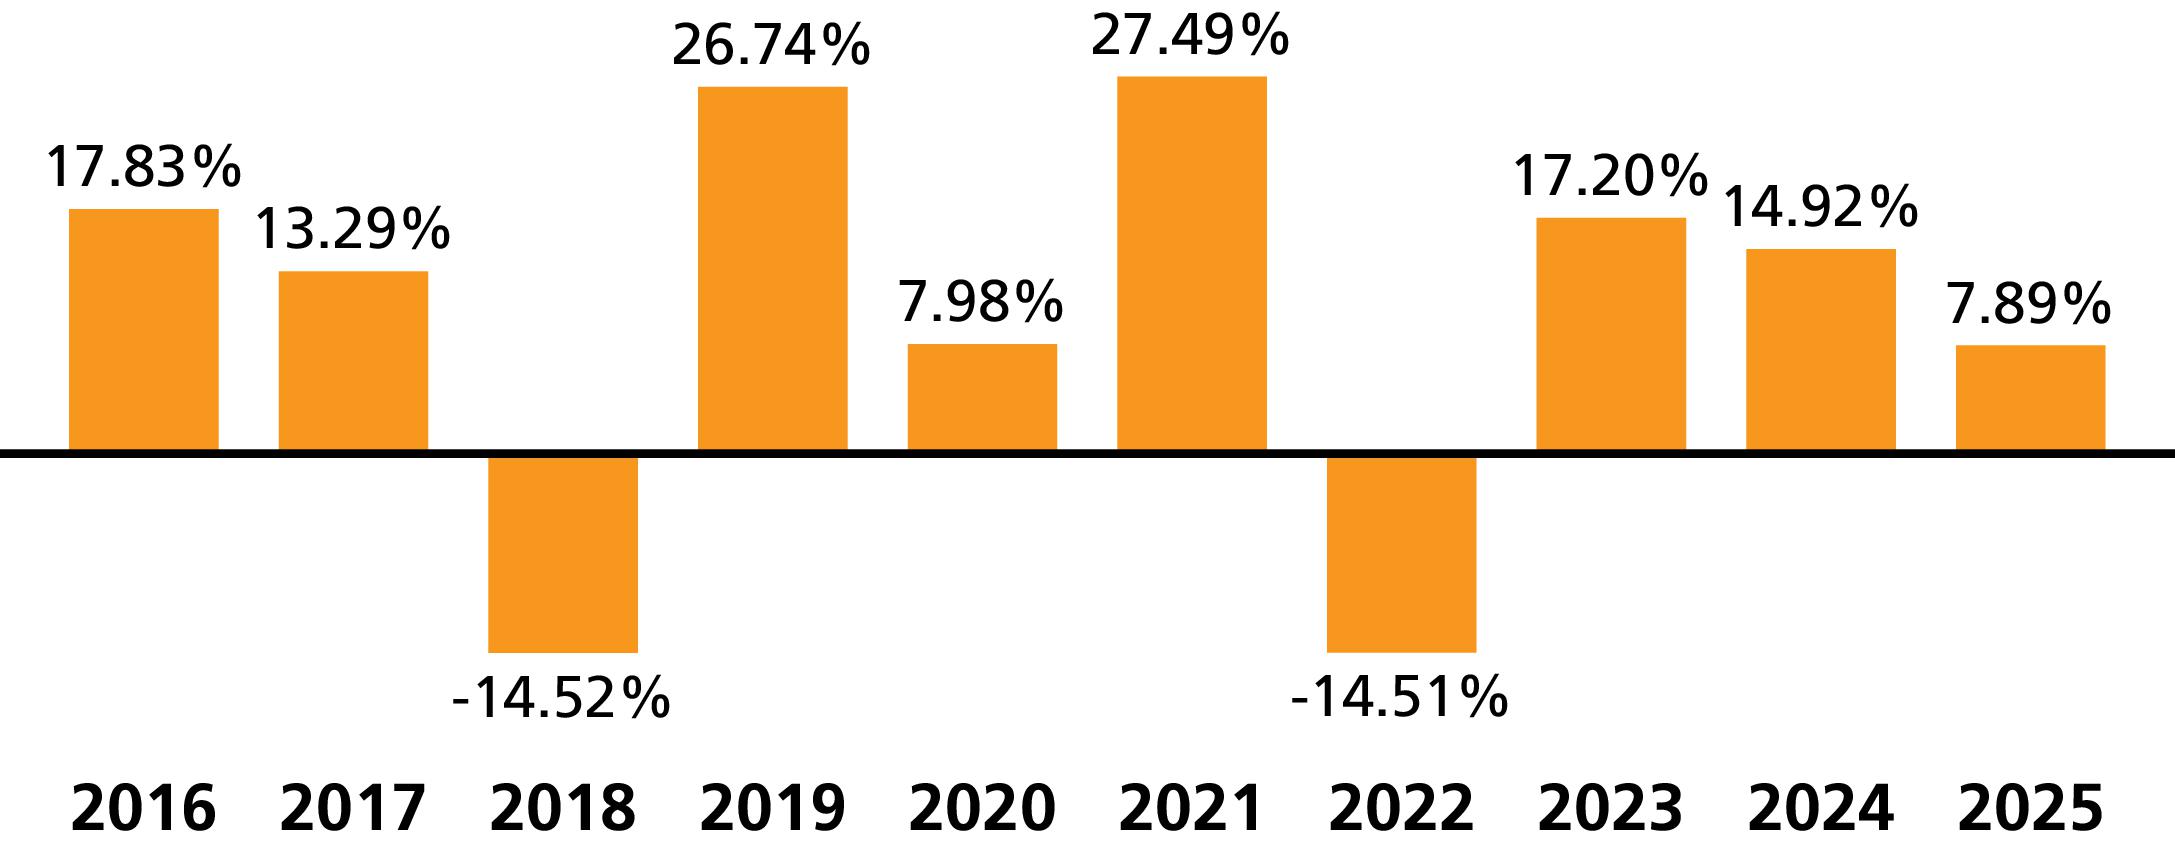
|
Best quarter: |
4th Quarter 2020 |
23.29% |
|
Worst quarter: |
1st Quarter 2020 |
-31.77% |
Average Annual Total Returns %
(for the periods ended December 31, 2025)
(for the periods ended December 31, 2025)
|
|
|
1 Yr |
5 Yrs |
10 Yrs |
Since
Inception |
Inception
Date |
|
Class I |
% |
8.16 |
9.90 |
9.75 |
N/A |
12/16/1997 |
|
Russell 3000® Index1 |
% |
17.15 |
13.15 |
14.29 |
N/A |
|
|
S&P MidCap 400® Index1 |
% |
7.50 |
9.12 |
10.72 |
N/A |
|
|
Class S |
% |
7.89 |
9.63 |
9.48 |
N/A |
7/16/2001 |
|
Russell 3000® Index1 |
% |
17.15 |
13.15 |
14.29 |
N/A |
|
|
S&P MidCap 400® Index1 |
% |
7.50 |
9.12 |
10.72 |
N/A |
|
1
The index returns do not reflect deductions for fees, expenses, or taxes.
Portfolio Management
|
Investment Adviser |
|
Voya Investments, LLC |
|
Sub-Adviser |
|
Voya Investment Management Co. LLC |
|
Portfolio Managers |
|
|
Steve Gao, PhD, CFA, FRM
Portfolio Manager (since 10/2025) |
Russell Shtern, CFA
Portfolio Manager (since 10/2025) |
|
Kai Yee Wong
Portfolio Manager (since 5/2016) |
|
Purchase and Sale of Portfolio Shares
Shares of the Portfolio are not offered directly to the public. Purchase and sale of shares may be made only by separate accounts of insurance companies serving as investment options under Variable Contracts or by Qualified Plans, custodian accounts, and certain investment advisers and their affiliates, other investment companies, or permitted investors. Please refer to the prospectus for the appropriate insurance company separate account, investment company, or your plan documents for information on how to direct investments in, or sale from, an investment option corresponding to the Portfolio and any fees that may apply. Participating insurance companies and certain other designated organizations are authorized to receive purchase orders on the Portfolio's behalf.
Voya Index Plus MidCap Portfolio
29
Tax Information
Distributions made by the Portfolio to a Variable Contract or Qualified Plan, and exchanges and redemptions of Portfolio shares made by a Variable Contract or Qualified Plan, ordinarily do not cause the corresponding contract holder or plan participant to recognize income or gain for U.S. federal income tax purposes. See the Variable Contract prospectus or the governing documents of your Qualified Plan for information regarding the U.S. federal income tax treatment of the distributions to your Variable Contract or Qualified Plan and the holders of the contracts or plan participants.
Payments to Broker-Dealers and Other Financial Intermediaries
If you invest in the Portfolio through a Variable Contract issued by an insurance company or through a Qualified Plan that, in turn, was purchased or serviced through an insurance company, broker-dealer or other financial intermediary, the Portfolio and its Investment Adviser or distributor or their affiliates may: (1) make payments to the insurance company issuer of the Variable Contract or to the company servicing the Qualified Plan and (2) make payments to the insurance company, broker-dealer, or other financial intermediary. These payments may create a conflict of interest by: (1) influencing the insurance company or the company servicing the Qualified Plan to make the Portfolio available as an investment option for the Variable Contract or the Qualified Plan or (2) influencing the broker-dealer or other intermediary and your salesperson to recommend the Variable Contract or the pension servicing agent and/or the Portfolio over other options. Ask your salesperson or Qualified Plan administrator or visit your financial intermediary's website for more information.
Voya Index Plus MidCap Portfolio
30
Voya Index Plus SmallCap Portfolio
Investment Objective
The Portfolio seeks to outperform the total return performance of the S&P SmallCap 600® Index (“Index”) while maintaining a market level of risk.
Fees and Expenses of the Portfolio
The table describes the fees and expenses that you may pay if you buy, hold, and sell shares of the Portfolio. You may pay other fees and expenses such as fees and expenses imposed under your variable annuity contracts or variable life insurance policies (“Variable Contract”) or a qualified pension or retirement plan (“Qualified Plan”), which are not reflected in the tables and examples below. If these fees or expenses were included in the table, the Portfolio’s expenses would be higher. For more information on these charges, please refer to the documents governing your Variable Contract or Qualified Plan or consult your plan administrator.
Annual Portfolio Operating Expenses1
Expenses you pay each year as a % of the value of your investment
Expenses you pay each year as a % of the value of your investment
|
Class |
|
I |
S |
|
Management Fees |
% |
0.50 |
0.50 |
|
Distribution and/or Shareholder Services (12b-1) Fees |
% |
None |
0.25 |
|
Other Expenses |
% |
0.18 |
0.18 |
|
Total Annual Portfolio Operating Expenses |
% |
0.68 |
0.93 |
|
Waivers and Reimbursements2 |
% |
(0.08) |
(0.08) |
|
Total Annual Portfolio Operating Expenses
after Waivers and Reimbursements |
% |
0.60 |
0.85 |
1
Expense information has been restated to reflect current contractual rates.
2
Voya Investments, LLC (the “Investment Adviser”) is contractually obligated to limit expenses to 0.60% and 0.85% for Class I and Class S shares, respectively, through May 1, 2027. (the “Expense Limitation Agreement”). The limitation does not extend to interest, taxes, other investment-related costs, leverage expenses, extraordinary expenses such as litigation or other expenses not incurred in the ordinary course of business, and expenses of any counsel or other persons or services retained by the directors who are not “ interested persons ” as that term is defined by the Investment Company Act of 1940, as amended . Modification of the Expense Limitation Agreement requires written agreement signed by each of the parties and approval by the Portfolio's Board of Directors (the “Board”). The Expense Limitation Agreement shall terminate with respect to the Portfolio upon termination of the Portfolio' s advisory agreement with the Investment Adviser, or it may be terminated by Voya Variable Portfolios, Inc . (the “ Company ” ), without payment of any penalty, upon written notice to the Investment Adviser at its principal place of business .
Expense Example
This Example is intended to help you compare the cost of investing in shares of the Portfolio with the costs of investing in other mutual funds. The Example does not reflect expenses and charges which are, or may be, imposed under your Variable Contract or Qualified Plan. The Example assumes that you invest $10,000 in the Portfolio for the time periods indicated. The Example also assumes that your investment had a 5% return each year and that the Portfolio's operating expenses remain the same. The Example reflects applicable expense limitation agreements and/or waivers in effect, if any, for the one-year period and the first year of the time periods indicated . Although your actual costs may be higher or lower, based on these assumptions your costs would be:
|
Class |
|
1 Yr |
3 Yrs |
5 Yrs |
10 Yrs |
|
I |
$ |
61 |
210 |
371 |
839 |
|
S |
$ |
87 |
288 |
507 |
1,136 |
Portfolio Turnover
The Portfolio pays transaction costs, such as commissions, when it buys and sells securities (or “turns over” its portfolio). A higher portfolio turnover rate may indicate higher transaction costs. These costs, which are not reflected in Annual Portfolio Operating Expenses or in the Expense Example, affect the Portfolio's performance.
During the most recent fiscal year, the Portfolio's portfolio turnover rate was 76% of the average value of its portfolio.
31
Voya Index Plus SmallCap Portfolio
Principal Investment Strategies
Under normal circumstances, the Portfolio invests at least 80% of its net assets (plus the amount of any borrowings for investment purposes) in investments tied to small-capitalization companies included in the Index. For purposes of this 80% policy, small-capitalization companies means companies that are included in the Index.
The Index is a stock market index comprised of common stocks of 600 small-capitalization companies traded in the United States and selected by S&P Global Ratings. The market capitalization of companies within the Index will change with market conditions. As of December 31, 2025, the market capitalization of companies within the Index ranged from $500.7 million to $9.2 billion.
The Portfolio may invest in derivative instruments including, but not limited to, index futures. The Portfolio typically uses derivatives as a substitute for purchasing securities included in the Index or for the purpose of maintaining equity market exposure on its cash balance.
The Portfolio may invest in real estate-related securities, including real estate investment trusts (“REITs”).
The Portfolio may invest in other investment companies, including exchange-traded funds (“ETFs”), to the extent permitted under the Investment Company Act of 1940, as amended, and the rules and regulations thereunder, and under the terms of applicable no-action relief or exemptive orders granted thereunder.
The Portfolio is actively managed. In managing the Portfolio, the sub-adviser (the “Sub-Adviser”) attempts to achieve the Portfolio's objective by overweighting those stocks that the Sub-Adviser believes will outperform the Index, and underweighting (or avoiding altogether) those stocks in the Index that the Sub-Adviser believes will underperform the Index. In determining stock weightings, the Sub-Adviser uses both internally developed quantitative computer models and fundamental stock research to evaluate various criteria, such as the financial strength of each company and its potential for strong, sustained earnings growth. Although the Portfolio will not hold all of the stocks in the Index, the Sub-Adviser expects that there will be a close correlation between the performance of the Portfolio and that of the Index in both rising and falling markets as the Portfolio is designed to have risk characteristics (e.g., beta, size, volatility) that approximate those of the Index.
In evaluating investments for the Portfolio, the Sub-Adviser, through its quantitative methods and models, takes into account a wide variety of factors and considerations to determine whether any or all of those factors or considerations might have a material effect on the value, risks, or prospects of a company. Among the factors considered, the Sub-Adviser expects that its quantitative methods and models will typically take into account environmental, social, and governance (“ESG”) factors. In considering ESG factors, the Sub-Adviser’s quantitative methods and models will rely primarily on factors identified through the Sub-Adviser’s proprietary empirical research and on third-party evaluations of a company’s ESG standing, when available. ESG factors will be only one of many considerations in the evaluation of any potential investment; the extent to which ESG factors will affect the Sub-Adviser’s decision to invest in a company, if at all, will depend on the operation of the Sub-Adviser’s quantitative processes and the judgment of the Sub-Adviser.
The Sub-Adviser may sell securities for a variety of reasons, such as to secure gains, limit losses, or redeploy assets into opportunities believed to be more promising.
The Portfolio may lend portfolio securities on a short-term or long-term basis, up to 33 1∕3% of its total assets.
Principal Risks
You could lose money on an investment in the Portfolio. Any of the following risks, among others, could affect Portfolio performance or cause the Portfolio to lose money or to underperform market averages of other funds. The principal risks are presented in alphabetical order to facilitate readability, and their order does not imply that the realization of one risk is more likely to occur or have a greater adverse impact than another risk.
Company: The price of a company’s stock could decline or underperform for many reasons, including, among others, poor management, financial problems, reduced demand for the company’s goods or services, regulatory fines and judgments, or business challenges. If a company is unable to meet its financial obligations, declares bankruptcy, or becomes insolvent, its stock could become worthless.
Derivative Instruments: Derivative instruments are subject to a number of risks, including the risk of changes in the market price of the underlying asset, reference rate, or index, credit risk with respect to the counterparty, risk of loss due to changes in market interest rates, liquidity risk, valuation risk, and volatility risk. The amounts required to purchase certain derivatives may be small relative to the magnitude of exposure assumed by the Portfolio. Therefore, the purchase of certain derivatives may have an economic leveraging effect on the Portfolio and exaggerate any increase or decrease in the net asset value. Derivatives may not perform as expected, so the Portfolio may not realize the intended benefits. When used for hedging
Voya Index Plus SmallCap Portfolio
32
purposes, the change in value of a derivative may not correlate as expected with the asset, reference rate, or index being hedged. When used as an alternative or substitute for direct cash investment, the return provided by the derivative may not provide the same return as direct cash investment.
Environmental, Social, and Governance (Quantitative): The Sub-Adviser’s consideration of ESG factors in selecting investments for the Portfolio depends on the operation of quantitative methods and models whose design reflects qualitative and subjective judgments of the Sub-Adviser, including reliance on, or incorporation of, data in respect of ESG factors that may rely on third-party data that might be incorrect or based on incomplete or inaccurate information. There is no minimum percentage of the Portfolio’s assets that will be invested in companies that the Sub-Adviser views favorably in light of ESG factors, and the Sub-Adviser may not invest in companies that compare favorably to other companies on the basis of ESG factors. It is possible that the Portfolio will have less exposure to certain companies due to the Sub-Adviser’s assessment of ESG factors than other comparable mutual funds. There can be no assurance that an investment selected by the Sub-Adviser, which includes its consideration of ESG factors, when available, will provide more favorable investment performance than another potential investment, and such an investment may, in fact, underperform other potential investments.
Investment Model: The Sub-Adviser’s proprietary investment model may not adequately take into account existing or unforeseen market factors or the interaction among such factors, including changes in how such factors interact, and there is no guarantee that the use of a proprietary investment model will result in effective investment decisions for the Portfolio. Portfolios that are actively managed, in whole or in part, according to a quantitative investment model (including models that utilize forms of artificial intelligence, such as machine learning) can perform differently from the market, based on the investment model and the factors used in the analysis, the weight placed on each factor, and changes from the factors’ historical trends. Technical issues in the design, development, implementation, application, and maintenance of the models ( e.g. , stale or inaccurate data, human error, programming or other software issues , coding errors, and technology failures ) may create errors or limitations that might go undetected or are discovered only after the errors or limitations have negatively impacted performance.
Liquidity: If a security is illiquid, the Portfolio might be unable to sell the security at a time when the Portfolio’s manager might wish to sell, or at all. Further, the lack of an established secondary market may make it more difficult to value illiquid securities, exposing the Portfolio to the risk that the prices at which it sells illiquid securities will be less than the prices at which they were valued when held by the Portfolio, which could cause the Portfolio to lose money. The prices of illiquid securities may be more volatile than more liquid securities, and the risks associated with illiquid securities may be greater in times of financial stress. Certain securities that are liquid when purchased may later become illiquid, particularly in times of overall economic distress or due to geopolitical events such as sanctions, trading halts, or wars. In addition, markets or securities may become illiquid quickly.
Market: The market values of securities will fluctuate, sometimes sharply and unpredictably, based on overall economic conditions, governmental actions or intervention, market disruptions caused by trade disputes or other factors, political developments, and other factors. Prices of equity securities tend to rise and fall more dramatically than those of debt instruments. Additionally, legislative, regulatory or tax policies or developments may adversely impact the investment techniques available to a manager, add to costs, and impair the ability of the Portfolio to achieve its investment objectives.
Market Disruption and Geopolitical: The Portfolio is subject to the risk that geopolitical events will disrupt securities markets and adversely affect global economies and markets. Due to the increasing interdependence among global economies and markets, conditions in one country, market, or region might adversely impact markets, issuers and/or foreign exchange rates in other countries, including the United States. Wars, terrorism, global health crises and pandemics, trade disputes, tariffs and other restrictions on trade or economic sanctions, rapid technological developments (such as artificial intelligence technologies), and other geopolitical events that have led, and may continue to lead, to increased market volatility and may have adverse short- or long-term effects on U.S. and global economies and markets, generally. For example, the COVID-19 pandemic resulted in significant market volatility, exchange suspensions and closures, declines in global financial markets, higher default rates, supply chain disruptions, and a substantial economic downturn in economies throughout the world. The economic impacts of COVID-19 have created a unique challenge for real estate markets. Many businesses have either partially or fully transitioned to a remote-working environment and this transition may negatively impact the occupancy rates of commercial real estate over time. Natural and environmental disasters and systemic market dislocations are also highly disruptive to economies and markets. Military action by Russia in Ukraine, the prolonged conflict between Hamas and Israel, the Iranian conflict that commenced in February 2026, and political upheaval in Venezuela have resulted, and may continue to result, in sanctions, market disruptions, declines in regional and global stock markets, unusual volatility in global commodity markets, and disruptions to energy production or transportation, including through key shipping routes, any of which could adversely affect the value of the Portfolio ' s investments, including beyond the Portfolio's direct exposure to issuers in the affected regions. The escalation or expansion of hostilities including the involvement of additional nations, could introduce further uncertainty and volatility in global energy, commodity, and financial markets. The extent and duration of these conflicts, related sanctions, and resulting market disruptions are impossible to predict but could be substantial. A number of U.S. domestic banks and foreign (non-U.S.) banks have experienced
Voya Index Plus SmallCap Portfolio
33
financial difficulties and, in some cases, failures. There can be no certainty that the actions taken by regulators to limit the effect of those financial difficulties and failures on other banks or other financial institutions or on the U.S. or foreign (non-U.S.) economies generally will be successful. It is possible that more banks or other financial institutions will experience financial difficulties or fail, which may affect adversely other U.S. or foreign (non-U.S.) financial institutions and economies. These events as well as other changes in foreign (non-U.S.) and domestic economic, social, and political conditions also could adversely affect individual issuers or related groups of issuers, securities markets, interest rates, credit ratings, inflation, investor sentiment, and other factors affecting the value of the Portfolio’s investments. Any of these occurrences could disrupt the operations of the Portfolio and of the Portfolio’s service providers. Recent technological developments in, and the increasingly widespread use of, artificial intelligence, including machine learning technology and generative artificial intelligence (“AI”), may pose risks to the Portfolio. For instance, the economy may be significantly impacted by the advanced development and increased regulation of AI. As AI is used more widely, the profitability and growth of Portfolio holdings may be impacted, which could significantly impact the overall performance of the Portfolio. The legal and regulatory frameworks within which AI operates continue to rapidly evolve, and it is not possible to predict the full extent of current or future risks related thereto.
Other Investment Companies: The main risk of investing in other investment companies, including ETFs, is the risk that the value of an investment company’s underlying investments might decrease. Shares of investment companies that are listed on an exchange may trade at a discount or premium from their net asset value. You will pay a proportionate share of the expenses of those other investment companies (including management fees, administration fees, and custodial fees) in addition to the Portfolio’s expenses. The investment policies of the other investment companies may not be the same as those of the Portfolio; as a result, an investment in the other investment companies may be subject to additional or different risks than those to which the Portfolio is typically subject. In addition, shares of ETFs may trade at a premium or discount to net asset value and are subject to secondary market trading risks. Secondary markets may be subject to irregular trading activity, wide bid/ask spreads, and extended trade settlement periods in times of market stress because market makers and authorized participants may step away from making a market in an ETF’s shares, which could cause a material decline in the ETF’s net asset value.
Real Estate Companies and Real Estate Investment Trusts: Investing in real estate companies and REITs may subject the Portfolio to risks similar to those associated with the direct ownership of real estate, including losses from casualty or condemnation, changes in local and general economic conditions, supply and demand, market interest rates, zoning laws, regulatory limitations on rents, property taxes, overbuilding, high foreclosure rates, and operating expenses in addition to terrorist attacks, wars, or other acts that destroy real property. In addition, REITs may also be affected by tax and regulatory requirements in that a REIT may not qualify for favorable tax treatment or regulatory exemptions. Investments in REITs are affected by the management skill of the REIT’s sponsor. The Portfolio will indirectly bear its proportionate share of expenses, including management fees, paid by each REIT in which it invests.
Securities Lending: Securities lending involves two primary risks: “ investment risk ” and “ borrower default risk. ” When lending securities, the Portfolio will receive cash or U.S. government securities as collateral. Investment risk is the risk that the Portfolio will lose money from the investment of the cash collateral received from the borrower. Borrower default risk is the risk that the Portfolio will lose money due to the failure of a borrower to return a borrowed security. Securities lending may result in leverage. The use of leverage may exaggerate any increase or decrease in the net asset value, causing the Portfolio to be more volatile. The use of leverage may increase expenses and increase the impact of the Portfolio’s other risks.
Small-Capitalization Company: Investments in small-capitalization companies may involve greater risk than is customarily associated with larger, more established companies due to the greater business risks of a limited operating history, small size, limited markets and financial resources, narrow product lines, less management depth and more reliance on key personnel. The securities of small-capitalization companies are subject to liquidity risk as they are often traded over-the-counter and may not be traded in volumes typically seen on national securities exchanges.
An investment in the Portfolio is not a bank deposit and is not insured or guaranteed by the Federal Deposit Insurance Corporation, the Federal Reserve Board or any other government agency.
Performance Information
The following information is intended to help you understand the risks of investing in the Portfolio. The following bar chart shows the changes in the Portfolio's performance from year to year, and the table compares the Portfolio's performance to the performance of a broad-based securities market index and an additional index with investment characteristics similar to those of the Portfolio for the same period. In 2024, the Investment Adviser changed the Portfolio’s primary benchmark from the S&P SmallCap 600® Index to the Russell 3000® Index in accordance with changes to regulatory disclosure requirements. The Portfolio continues to use the S&P SmallCap 600® Index as an additional benchmark that the Investment Adviser believes more closely reflects the Portfolio’s principal investment strategies. The Portfolio's performance information reflects applicable fee waivers and/or expense limitations in effect during the period presented. Absent such fee waivers/expense limitations,
Voya Index Plus SmallCap Portfolio
34
if any, performance would have been lower. The bar chart shows the performance of the Portfolio's Class S shares. Performance for other share classes would differ to the extent they have differences in their fees and expenses.
Performance shown in the bar chart and in the Average Annual Total Returns table does not include insurance-related charges imposed under a Variable Contract or expenses related to a Qualified Plan. If these charges or expenses were included, performance would be lower. Thus, you should not compare the Portfolio's performance directly with the performance information of other investment products without taking into account all insurance-related charges and expenses payable under your Variable Contract or Qualified Plan. The Portfolio's past performance is no guarantee of future results.
Calendar Year Total Returns Class S
(as of December 31 of each year)
(as of December 31 of each year)
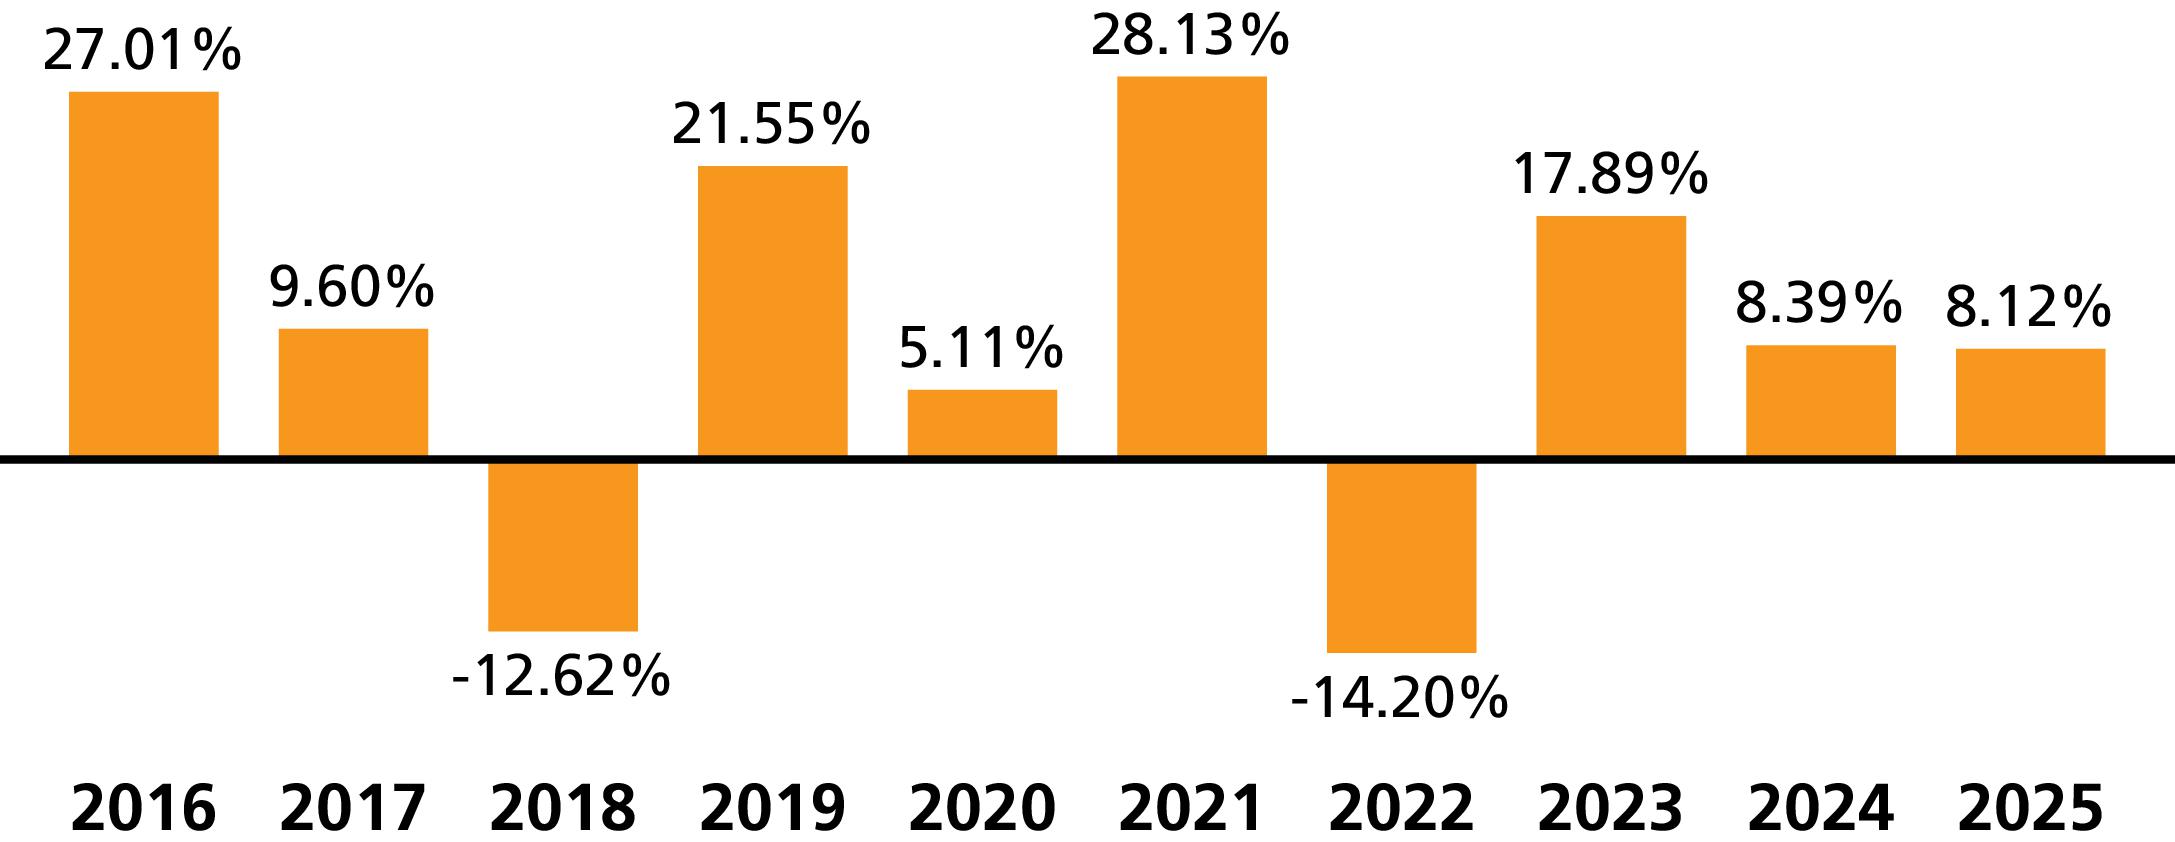
|
Best quarter: |
4th Quarter 2020 |
29.51% |
|
Worst quarter: |
1st Quarter 2020 |
-34.87% |
Average Annual Total Returns %
(for the periods ended December 31, 2025)
(for the periods ended December 31, 2025)
|
|
|
1 Yr |
5 Yrs |
10 Yrs |
Since
Inception |
Inception
Date |
|
Class I |
% |
8.27 |
8.97 |
9.23 |
N/A |
12/19/1997 |
|
Russell 3000® Index1 |
% |
17.15 |
13.15 |
14.29 |
N/A |
|
|
S&P SmallCap 600® Index1 |
% |
6.02 |
7.31 |
9.81 |
N/A |
|
|
Class S |
% |
8.12 |
8.72 |
8.97 |
N/A |
7/16/2001 |
|
Russell 3000® Index1 |
% |
17.15 |
13.15 |
14.29 |
N/A |
|
|
S&P SmallCap 600® Index1 |
% |
6.02 |
7.31 |
9.81 |
N/A |
|
1
The index returns do not reflect deductions for fees, expenses, or taxes.
Portfolio Management
|
Investment Adviser |
|
Voya Investments, LLC |
|
Sub-Adviser |
|
Voya Investment Management Co. LLC |
|
Portfolio Managers |
|
|
Steve Gao, PhD, CFA, FRM
Portfolio Manager (since 10/2025) |
Russell Shtern, CFA
Portfolio Manager (since 10/2025) |
|
Kai Yee Wong
Portfolio Manager (since 5/2016) |
|
Purchase and Sale of Portfolio Shares
Shares of the Portfolio are not offered directly to the public. Purchase and sale of shares may be made only by separate accounts of insurance companies serving as investment options under Variable Contracts or by Qualified Plans, custodian accounts, and certain investment advisers and their affiliates, other investment companies, or permitted investors. Please refer to the prospectus for the appropriate insurance company separate account, investment company, or your plan documents for information on how to direct investments in, or sale from, an investment option corresponding to the Portfolio and any fees that may apply. Participating insurance companies and certain other designated organizations are authorized to receive purchase orders on the Portfolio's behalf.
Voya Index Plus SmallCap Portfolio
35
Tax Information
Distributions made by the Portfolio to a Variable Contract or Qualified Plan, and exchanges and redemptions of Portfolio shares made by a Variable Contract or Qualified Plan, ordinarily do not cause the corresponding contract holder or plan participant to recognize income or gain for U.S. federal income tax purposes. See the Variable Contract prospectus or the governing documents of your Qualified Plan for information regarding the U.S. federal income tax treatment of the distributions to your Variable Contract or Qualified Plan and the holders of the contracts or plan participants.
Payments to Broker-Dealers and Other Financial Intermediaries
If you invest in the Portfolio through a Variable Contract issued by an insurance company or through a Qualified Plan that, in turn, was purchased or serviced through an insurance company, broker-dealer or other financial intermediary, the Portfolio and its Investment Adviser or distributor or their affiliates may: (1) make payments to the insurance company issuer of the Variable Contract or to the company servicing the Qualified Plan and (2) make payments to the insurance company, broker-dealer, or other financial intermediary. These payments may create a conflict of interest by: (1) influencing the insurance company or the company servicing the Qualified Plan to make the Portfolio available as an investment option for the Variable Contract or the Qualified Plan or (2) influencing the broker-dealer or other intermediary and your salesperson to recommend the Variable Contract or the pension servicing agent and/or the Portfolio over other options. Ask your salesperson or Qualified Plan administrator or visit your financial intermediary's website for more information.
Voya Index Plus SmallCap Portfolio
36
Voya Intermediate Bond Portfolio
Investment Objective
The Portfolio seeks to maximize total return consistent with reasonable risk. The Portfolio seeks its objective through investments in a diversified portfolio consisting primarily of debt securities. It is anticipated that capital appreciation and investment income will both be major factors in achieving total return.
Fees and Expenses of the Portfolio
The table describes the fees and expenses that you may pay if you buy, hold, and sell shares of the Portfolio. You may pay other fees and expenses such as fees and expenses imposed under your variable annuity contracts or variable life insurance policies (“Variable Contract”) or a qualified pension or retirement plan (“Qualified Plan”), which are not reflected in the tables and examples below. If these fees or expenses were included in the table, the Portfolio’s expenses would be higher. For more information on these charges, please refer to the documents governing your Variable Contract or Qualified Plan or consult your plan administrator.
Annual Portfolio Operating Expenses
Expenses you pay each year as a % of the value of your investment
Expenses you pay each year as a % of the value of your investment
|
Class |
|
ADV |
I |
S |
S2 |
|
Management Fees |
% |
0.50 |
0.50 |
0.50 |
0.50 |
|
Distribution and/or Shareholder Services (12b-1) Fees |
% |
0.50 |
None |
0.25 |
0.40 |
|
Other Expenses |
% |
0.18 |
0.18 |
0.18 |
0.18 |
|
Acquired Fund Fees and Expenses |
% |
0.02 |
0.02 |
0.02 |
0.02 |
|
Total Annual Portfolio Operating Expenses1 |
% |
1.20 |
0.70 |
0.95 |
1.10 |
|
Waivers and Reimbursements2 |
% |
(0.15) |
(0.15) |
(0.15) |
(0.15) |
|
Total Annual Portfolio Operating Expenses
after Waivers and Reimbursements |
% |
1.05 |
0.55 |
0.80 |
0.95 |
1
Total Annual Portfolio Operating Expenses shown may be higher than the Portfolio's ratio of expenses to average net assets shown in the Financial Highlights, which reflects the operating expenses of the Portfolio and does not include Acquired Fund Fees and Expenses.
2
Voya Investments, LLC (the “Investment Adviser”) is contractually obligated to limit expenses to 1.03%, 0.53%, 0.78%, and 0.93% for Class ADV, Class I, Class S, and Class S2 shares, respectively, through May 1, 2027. (the “ Expense Limitation Agreement ” ). The limitation does not extend to interest, taxes, other investment-related costs, leverage expenses, extraordinary expenses such as litigation or other expenses not incurred in the ordinary course of business, and expenses of any counsel or other persons or services retained by the trustees who are not “ interested persons ” as that term is defined by the Investment Company Act of 1940, as amended . Modification of the Expense Limitation Agreement requires written agreement signed by each of the parties and approval by the Portfolio's Board of Trustees ( the “ Board ” ). The Expense Limitation Agreement shall terminate with respect to the Portfolio upon termination of the Portfolio's advisory agreement with the Investment Adviser, or it may be terminated by Voya Intermediate Bond Portfolio (the “Trust”), without payment of any penalty, upon written notice to the Investment Adviser at its principal place of business.
Expense Example
This Example is intended to help you compare the cost of investing in shares of the Portfolio with the costs of investing in other mutual funds. The Example does not reflect expenses and charges which are, or may be, imposed under your Variable Contract or Qualified Plan. The Example assumes that you invest $10,000 in the Portfolio for the time periods indicated. The Example also assumes that your investment had a 5% return each year and that the Portfolio's operating expenses remain the same. The Example reflects applicable expense limitation agreements and/or waivers in effect, if any, for the one-year period and the first year of the time periods indicated . Although your actual costs may be higher or lower, based on these assumptions your costs would be:
|
Class |
|
1 Yr |
3 Yrs |
5 Yrs |
10 Yrs |
|
ADV |
$ |
107 |
365 |
644 |
1,438 |
|
I |
$ |
56 |
208 |
373 |
853 |
|
S |
$ |
81 |
287 |
509 |
1,149 |
|
S2 |
$ |
97 |
334 |
590 |
1,323 |
Portfolio Turnover
The Portfolio pays transaction costs, such as commissions, when it buys and sells securities (or “turns over” its portfolio). A higher portfolio turnover rate may indicate higher transaction costs. These costs, which are not reflected in Annual Portfolio Operating Expenses or in the Expense Example, affect the Portfolio's performance.
37
Voya Intermediate Bond Portfolio
During the most recent fiscal year, the Portfolio's portfolio turnover rate was 117% of the average value of its portfolio.
Principal Investment Strategies
Under normal circumstances, the Portfolio invests at least 80% of its net assets (plus the amount of any borrowings for investment purposes) in a portfolio of bonds. For purposes of this 80% policy, bonds include, without limitation, bonds, debt instruments, and other fixed income and income-producing debt instruments, of any kind, issued or guaranteed by governmental or private-sector entities.
The Portfolio invests primarily in debt instruments rated investment grade, including, but not limited to, corporate, government and mortgage bonds. Investment grade refers to ratings given by nationally recognized statistical rating organizations (“NRSROs”) (e.g., rated Baa3 or above by Moody’s Ratings (“Moody’s”), or BBB- or above by S&P Global Ratings (“S&P”) or Fitch Ratings, Inc. (“Fitch”)) or, if unrated, determined by the Portfolio to be of comparable quality. Although the Portfolio may invest a portion of its assets in debt instruments rated below investment grade (sometimes referred to as “high-yield securities”, “high-yield bonds”, or “junk bonds”), the Portfolio will seek to maintain a minimum weighted average portfolio quality rating of at least investment grade. Below investment grade refers to ratings given by NRSROs (e.g., rated Ba1 or below by Moody’s, or BB+ or below by S&P or Fitch) or, if unrated, determined by the Portfolio to be of comparable quality, are regarded as having more speculative characteristics with respect to the payment of interest and repayment of principal. Split rated debt instruments (debt instruments that receive different ratings from two or more NRSROs) are valued as follows: if three NRSROs rate a debt instrument, the debt instrument will be considered to have the median credit rating; if two of the three NRSROs rate a debt instrument, the debt instrument will be considered to have the lower credit rating of the two provided. The dollar-weighted average duration of the Portfolio will generally range between three and ten years. Duration is a commonly used measure of risk in debt instruments as it incorporates multiple features of debt instruments (e.g., yield, coupon, maturity, etc.) into one number. Duration is a measure of sensitivity of the price of a debt instrument to a change in interest rates. Duration is a weighted average of the times that interest payments and the final return of principal are received. The weights are the amounts of the payments discounted by the yield-to-maturity of the debt instrument. Duration is expressed as a number of years. The bigger the duration number, the greater the interest rate risk or reward for the debt instrument prices. For example, the price of a bond with an average duration of 5 years would be expected to fall approximately 5% if market interest rates rose by 1%. Conversely, the price of a bond with an average duration of 5 years would be expected to rise approximately 5% if market interest rates dropped by 1%.
The Portfolio may also invest in: preferred stock; high quality money market instruments; municipal bonds; debt instruments of foreign (non-U.S.) issuers (including those located in emerging market countries); securities denominated in foreign (non-U.S.) currencies; foreign (non-U.S.) currencies; mortgage-backed and asset-backed securities; bank loans and floating rate secured loans (“Senior Loans”); and derivatives including futures, options, and swaps (including credit default swaps, interest rate swaps and total return swaps) involving securities, securities indices and interest rates, which may be denominated in the U.S. dollar or foreign (non-U.S.) currencies. The Portfolio typically uses derivatives to reduce exposure to other risks, such as interest rate or currency risk, to substitute for taking a position in the underlying asset, and/or to enhance returns in the Portfolio.
The Portfolio may seek to obtain exposure to the securities in which it invests by entering into a series of purchase and sale contracts or through other investment techniques such as buy backs and dollar rolls. Buy backs and dollar rolls involve selling securities and simultaneously entering into a commitment to purchase those or similar securities on a specified future date and price from the same party.
The Portfolio may invest in other investment companies, including exchange-traded funds (“ETFs”), to the extent permitted under the Investment Company Act of 1940, as amended, and the rules and regulations thereunder, and under the terms of applicable no-action relief or exemptive orders granted thereunder.
The sub-adviser (the “Sub-Adviser”) believes that relationships between the drivers of debt instrument returns change over time and that recognizing this is key to managing such assets. Therefore, the Sub-Adviser employs a dynamic investment process that seeks to balance top-down macro economic considerations and fundamental bottom-up analysis during the steps of its investment process - sector allocation, security selection, duration, and yield curve management. This includes utilizing proprietary qualitative analysis along with quantitative tools throughout the portfolio construction process.
In evaluating investments for the Portfolio, the Sub-Adviser takes into account a wide variety of factors and considerations to determine whether any or all of those factors or considerations might have a material effect on the value, risks, or prospects of an investment. Among the factors considered, the Sub-Adviser expects typically to take into account environmental, social, and governance (“ESG”) factors to determine whether one or more factors may have a material effect. In considering ESG factors, the Sub-Adviser intends to rely primarily on factors identified through its proprietary empirical research and on third-party evaluations of an issuer’s ESG standing, when available. ESG factors will be only one of many considerations in the Sub-Adviser’s evaluation of any potential investment; the extent to which ESG factors will affect the Sub-Adviser’s decision to invest in an issuer, if at all, will depend on the analysis and judgment of the Sub-Adviser.
Voya Intermediate Bond Portfolio
38
The Sub-Adviser may sell securities for a variety of reasons, such as to secure gains, limit losses, or redeploy assets into opportunities believed to be more promising.
The Portfolio may lend portfolio securities on a short-term or long-term basis, up to 33 1∕3% of its total assets.
Principal Risks
You could lose money on an investment in the Portfolio. Any of the following risks, among others, could affect Portfolio performance or cause the Portfolio to lose money or to underperform market averages of other funds. The principal risks are presented in alphabetical order to facilitate readability, and their order does not imply that the realization of one risk is more likely to occur or have a greater adverse impact than another risk.
Bank Instruments: Bank instruments include certificates of deposit, fixed time deposits, bankers’ acceptances, and other debt and deposit-type obligations issued by banks. Changes in economic, regulatory, or political conditions, or other events that affect the banking industry may have an adverse effect on bank instruments or banking institutions that serve as counterparties in transactions with the Portfolio. In the event of a bank insolvency or failure, the Portfolio may be considered a general creditor of the bank, and it might lose some or all of the funds deposited with the bank. Even where it is recognized that a bank might be in danger of insolvency or failure, the Portfolio might not be able to withdraw or transfer its money from the bank in time to avoid any adverse effects of the insolvency or failure. Volatility in the banking system may impact the viability of banking and financial services institutions. In the event of failure of any of the financial institutions where the Portfolio maintains its cash and cash equivalents, there can be no assurance that the Portfolio would be able to access uninsured funds in a timely manner or at all and the Portfolio may incur losses. Any such event could adversely affect the business, liquidity, financial position and performance of the Portfolio.
Company: The price of a company’s stock could decline or underperform for many reasons, including, among others, poor management, financial problems, reduced demand for the company’s goods or services, regulatory fines and judgments, or business challenges. If a company is unable to meet its financial obligations, declares bankruptcy, or becomes insolvent, its stock could become worthless.
Credit: The Portfolio could lose money if the issuer or guarantor of a debt instrument in which the Portfolio invests, or the counterparty to a derivative contract the Portfolio entered into, is unable or unwilling, or is perceived (whether by market participants, rating agencies, pricing services, or otherwise) as unable or unwilling, to meet its financial obligations. Asset-backed (including mortgage-backed) securities that are not issued by U.S. government agencies may have a greater risk of default because they are not guaranteed by either the U.S. government or an agency or instrumentality of the U.S. government. The credit quality of typical asset-backed securities depends primarily on the credit quality of the underlying assets and the structural support (if any) provided to the securities.
Credit Default Swaps: The Portfolio may enter into credit default swaps, either as a buyer or a seller of the swap. A buyer of a credit default swap is generally obligated to pay the seller an upfront or a periodic stream of payments over the term of the contract until a credit event, such as a default, on a reference obligation has occurred. If a credit event occurs, the seller generally must pay the buyer the “par value” (full notional value) of the swap in exchange for an equal face amount of deliverable obligations of the reference entity described in the swap, or the seller may be required to deliver the related net cash amount if the swap is cash settled. As a seller of a credit default swap, the Portfolio would effectively add leverage to its portfolio because, in addition to its total net assets, the Portfolio would be subject to investment exposure on the full notional value of the swap. Credit default swaps are particularly subject to counterparty, credit, valuation, liquidity and leveraging risks, and the risk that the swap may not correlate with its reference obligation as expected. Certain standardized credit default swaps are subject to mandatory central clearing. Central clearing is expected to reduce counterparty credit risk and increase liquidity; however, there is no assurance that it will achieve that result, and in the meantime, central clearing and related requirements expose the Portfolio to different kinds of costs and risks. In addition, credit default swaps expose the Portfolio to the risk of improper valuation.
Currency: To the extent that the Portfolio invests directly or indirectly in foreign (non-U.S.) currencies or in securities denominated in, or that trade in, foreign (non-U.S.) currencies, it is subject to the risk that those foreign (non-U.S.) currencies will decline in value relative to the U.S. dollar or, in the case of hedging positions, that the U.S. dollar will decline in value relative to the currency being hedged by the Portfolio through foreign currency exchange transactions.
Derivative Instruments: Derivative instruments are subject to a number of risks, including the risk of changes in the market price of the underlying asset, reference rate, or index, credit risk with respect to the counterparty, risk of loss due to changes in market interest rates, liquidity risk, valuation risk, and volatility risk. The amounts required to purchase certain derivatives may be small relative to the magnitude of exposure assumed by the Portfolio. Therefore, the purchase of certain derivatives may have an economic leveraging effect on the Portfolio and exaggerate any increase or decrease in the net asset value. Derivatives may not perform as expected, so the Portfolio may not realize the intended benefits. When used for hedging
Voya Intermediate Bond Portfolio
39
purposes, the change in value of a derivative may not correlate as expected with the asset, reference rate, or index being hedged. When used as an alternative or substitute for direct cash investment, the return provided by the derivative may not provide the same return as direct cash investment.
Environmental, Social, and Governance (Fixed Income): The Sub-Adviser’s consideration of ESG factors in selecting investments for the Portfolio is based on information that is not standardized, some of which can be qualitative and subjective by nature. The Sub-Adviser’s assessment of ESG factors in respect of obligations of an issuer may rely on third-party data that might be incorrect or based on incomplete or inaccurate information. There is no minimum percentage of the Portfolio’s assets that will be invested in obligations of issuers that the Sub-Adviser views favorably in light of ESG factors, and the Sub-Adviser may choose not to invest in obligations of issuers that compare favorably to obligations of other issuers on the basis of ESG factors. It is possible that the Portfolio will have less exposure to obligations of certain issuers due to the Sub-Adviser’s assessment of ESG factors than other comparable mutual funds. There can be no assurance that an investment selected by the Sub-Adviser, which includes its consideration of ESG factors, when available, will provide more favorable investment performance than another potential investment, and such an investment may, in fact, underperform other potential investments.
Floating Rate Loans: In the event a borrower fails to pay scheduled interest or principal payments on a floating rate loan (which can include certain bank loans), the Portfolio will experience a reduction in its income and a decline in the market value of such floating rate loan. If a floating rate loan is held by the Portfolio through another financial institution, or the Portfolio relies upon another financial institution to administer the loan, the receipt of scheduled interest or principal payments may be subject to the credit risk of such financial institution. Investors in floating rate loans may not be afforded the protections of the anti-fraud provisions of the Securities Act of 1933, as amended, and the Securities Exchange Act of 1934, as amended, because loans may not be considered “securities” under such laws. Additionally, the value of collateral, if any, securing a floating rate loan can decline or may be insufficient to meet the borrower’s obligations under the loan, and such collateral may be difficult to liquidate. No active trading market may exist for many floating rate loans and many floating rate loans are subject to restrictions on resale. Transactions in loans typically settle on a delayed basis and may take longer than 7 days to settle. As a result, the Portfolio may not receive the proceeds from a sale of a floating rate loan for a significant period of time. Delay in the receipts of settlement proceeds may impair the ability of the Portfolio to meet its redemption obligations, and may limit the ability of the Portfolio to repay debt, pay dividends, or to take advantage of new investment opportunities.
Foreign (Non-U.S.) Investments/Developing and Emerging Markets: Investing in foreign (non-U.S.) securities may result in the Portfolio experiencing more rapid and extreme changes in value than a fund that invests exclusively in securities of U.S. companies due, in part, to: smaller markets; differing reporting, accounting, auditing and financial reporting standards and practices; nationalization, expropriation, or confiscatory taxation; foreign currency fluctuations, currency blockage, or replacement; potential for default on sovereign debt; and political changes or diplomatic developments, which may include the imposition of economic sanctions (or the threat of new or modified sanctions) or other measures by the U.S. or other governments and supranational organizations. Markets and economies throughout the world are becoming increasingly interconnected, and conditions or events in one market, country or region may adversely impact investments or issuers in another market, country or region. Foreign (non-U.S.) investment risks may be greater in developing and emerging markets than in developed markets.
High-Yield Securities: Lower-quality securities including securities that are or have fallen below investment grade (commonly referred to as “junk bonds”) have greater credit risk and liquidity risk than higher-quality (investment grade) securities, and their issuers' long-term ability to make payments is considered speculative. Prices of lower-quality bonds or other debt instruments are also more volatile, are more sensitive to negative news about the economy or the issuer, and have greater liquidity risk and price volatility.
Interest in Loans: The value and the income streams of interests in loans (including participation interests in lease financings and assignments in secured variable or floating rate loans) will decline if borrowers delay payments or fail to pay altogether. A significant rise in market interest rates could increase this risk. Although loans may be fully collateralized when purchased, such collateral may become illiquid or decline in value.
Interest Rate: A rise in market interest rates generally results in a fall in the value of bonds and other debt instruments; conversely, values generally rise as market interest rates fall. Interest rate risk is generally greater for debt instruments than floating-rate instruments. The higher the credit quality of the instrument, and the longer its maturity or duration, the more sensitive it is to changes in market interest rates. Duration is a measure of sensitivity of the price of a debt instrument to a change in interest rate. The U.S. Federal Reserve Board recently lowered interest rates following a period of consistent rate increases. Declining market interest rates increase the likelihood that debt instruments will be pre-paid. Rising market interest rates have unpredictable effects on the markets and may expose debt and related markets to heightened volatility. To the extent that the Portfolio invests in debt instruments, an increase in market interest rates may lead to increased redemptions and increased portfolio turnover, which could reduce liquidity for certain investments, adversely affect values, and increase costs. Increased redemptions may cause the Portfolio to liquidate portfolio positions when it may not be advantageous to
Voya Intermediate Bond Portfolio
40
do so and may lower returns. If dealer capacity in debt markets is insufficient for market conditions, it may further inhibit liquidity and increase volatility in debt markets. Fiscal, economic, monetary, or other governmental policies or measures have in the past, and may in the future, cause or exacerbate risks associated with interest rates, including changes in interest rates. Negative or very low interest rates could magnify the risks associated with changes in interest rates. In general, changing interest rates, including rates that fall below zero, could have unpredictable effects on markets and may expose debt and related markets to heightened volatility. In the case of inverse debt instruments, the interest rate paid by the debt instruments is a floating rate, which will generally decrease when the market rate of interest to which the inverse debt instruments are indexed increases and will increase when the market rate of interest to which the inverse debt instruments are indexed decreases. Changes to monetary policy by the U.S. Federal Reserve Board or other regulatory actions could expose debt and related markets to heightened volatility, interest rate sensitivity, and reduced liquidity, which may impact the Portfolio’s operations and return potential.
Investment Model: The Sub-Adviser’s proprietary investment model may not adequately take into account existing or unforeseen market factors or the interaction among such factors, including changes in how such factors interact, and there is no guarantee that the use of a proprietary investment model will result in effective investment decisions for the Portfolio. Portfolios that are actively managed, in whole or in part, according to a quantitative investment model (including models that utilize forms of artificial intelligence, such as machine learning) can perform differently from the market, based on the investment model and the factors used in the analysis, the weight placed on each factor, and changes from the factors’ historical trends. Technical issues in the design, development, implementation, application, and maintenance of the models ( e.g. , stale or inaccurate data, human error, programming or other software issues , coding errors, and technology failures ) may create errors or limitations that might go undetected or are discovered only after the errors or limitations have negatively impacted performance.
Liquidity: If a security is illiquid, the Portfolio might be unable to sell the security at a time when the Portfolio’s manager might wish to sell, or at all. Further, the lack of an established secondary market may make it more difficult to value illiquid securities, exposing the Portfolio to the risk that the prices at which it sells illiquid securities will be less than the prices at which they were valued when held by the Portfolio, which could cause the Portfolio to lose money. The prices of illiquid securities may be more volatile than more liquid securities, and the risks associated with illiquid securities may be greater in times of financial stress. Certain securities that are liquid when purchased may later become illiquid, particularly in times of overall economic distress or due to geopolitical events such as sanctions, trading halts, or wars. In addition, markets or securities may become illiquid quickly.
Market: The market values of securities will fluctuate, sometimes sharply and unpredictably, based on overall economic conditions, governmental actions or intervention, market disruptions caused by trade disputes or other factors, political developments, and other factors. Prices of equity securities tend to rise and fall more dramatically than those of debt instruments. Additionally, legislative, regulatory or tax policies or developments may adversely impact the investment techniques available to a manager, add to costs, and impair the ability of the Portfolio to achieve its investment objectives.
Market Capitalization: Stocks fall into three broad market capitalization categories: large, mid, and small. Investing primarily in one category carries the risk that, due to current market conditions, that category may be out of favor with investors. If valuations of large-capitalization companies appear to be greatly out of proportion to the valuations of mid- or small-capitalization companies, investors may migrate to the stocks of mid- and small-capitalization companies causing a fund that invests in these companies to increase in value more rapidly than a fund that invests in large-capitalization companies. Investing in mid- and small-capitalization companies may be subject to special risks associated with narrower product lines, more limited financial resources, smaller management groups, more limited publicly available information, and a more limited trading market for their stocks as compared with large-capitalization companies. As a result, stocks of mid- and small-capitalization companies may be more volatile and may decline significantly in market downturns.
Market Disruption and Geopolitical: The Portfolio is subject to the risk that geopolitical events will disrupt securities markets and adversely affect global economies and markets. Due to the increasing interdependence among global economies and markets, conditions in one country, market, or region might adversely impact markets, issuers and/or foreign exchange rates in other countries, including the United States. Wars, terrorism, global health crises and pandemics, trade disputes, tariffs and other restrictions on trade or economic sanctions, rapid technological developments (such as artificial intelligence technologies), and other geopolitical events that have led, and may continue to lead, to increased market volatility and may have adverse short- or long-term effects on U.S. and global economies and markets, generally. For example, the COVID-19 pandemic resulted in significant market volatility, exchange suspensions and closures, declines in global financial markets, higher default rates, supply chain disruptions, and a substantial economic downturn in economies throughout the world. The economic impacts of COVID-19 have created a unique challenge for real estate markets. Many businesses have either partially or fully transitioned to a remote-working environment and this transition may negatively impact the occupancy rates of commercial real estate over time. Natural and environmental disasters and systemic market dislocations are also highly disruptive to economies and markets. Military action by Russia in Ukraine, the prolonged conflict between Hamas and Israel, the Iranian conflict that commenced
Voya Intermediate Bond Portfolio
41
in February 2026, and political upheaval in Venezuela have resulted, and may continue to result, in sanctions, market disruptions, declines in regional and global stock markets, unusual volatility in global commodity markets, and disruptions to energy production or transportation, including through key shipping routes, any of which could adversely affect the value of the Portfolio ' s investments, including beyond the Portfolio's direct exposure to issuers in the affected regions. The escalation or expansion of hostilities including the involvement of additional nations, could introduce further uncertainty and volatility in global energy, commodity, and financial markets. The extent and duration of these conflicts, related sanctions, and resulting market disruptions are impossible to predict but could be substantial. A number of U.S. domestic banks and foreign (non-U.S.) banks have experienced financial difficulties and, in some cases, failures. There can be no certainty that the actions taken by regulators to limit the effect of those financial difficulties and failures on other banks or other financial institutions or on the U.S. or foreign (non-U.S.) economies generally will be successful. It is possible that more banks or other financial institutions will experience financial difficulties or fail, which may affect adversely other U.S. or foreign (non-U.S.) financial institutions and economies. These events as well as other changes in foreign (non-U.S.) and domestic economic, social, and political conditions also could adversely affect individual issuers or related groups of issuers, securities markets, interest rates, credit ratings, inflation, investor sentiment, and other factors affecting the value of the Portfolio’s investments. Any of these occurrences could disrupt the operations of the Portfolio and of the Portfolio’s service providers. Recent technological developments in, and the increasingly widespread use of, artificial intelligence, including machine learning technology and generative artificial intelligence (“AI”), may pose risks to the Portfolio. For instance, the economy may be significantly impacted by the advanced development and increased regulation of AI. As AI is used more widely, the profitability and growth of Portfolio holdings may be impacted, which could significantly impact the overall performance of the Portfolio. The legal and regulatory frameworks within which AI operates continue to rapidly evolve, and it is not possible to predict the full extent of current or future risks related thereto.
Mortgage- and/or Asset-Backed Securities: Defaults on, or low credit quality or liquidity of, the underlying assets of the asset-backed (including mortgage-backed) securities may impair the value of these securities and result in losses. There may be limitations on the enforceability of any security interest or collateral granted with respect to those underlying assets, and the value of collateral may not satisfy the obligation upon default. These securities also present a higher degree of prepayment and extension risk and interest rate risk than do other types of debt instruments.
Municipal Obligations: The municipal securities market is volatile and can be affected significantly by adverse tax, legislative, or political changes and the financial condition of the issuers of municipal securities. Among other risks, investments in municipal securities are subject to the risk that an issuer may delay payment, restructure its debt, or refuse to pay interest or repay principal on its debt.
Other Investment Companies: The main risk of investing in other investment companies, including ETFs, is the risk that the value of an investment company’s underlying investments might decrease. Shares of investment companies that are listed on an exchange may trade at a discount or premium from their net asset value. You will pay a proportionate share of the expenses of those other investment companies (including management fees, administration fees, and custodial fees) in addition to the Portfolio’s expenses. The investment policies of the other investment companies may not be the same as those of the Portfolio; as a result, an investment in the other investment companies may be subject to additional or different risks than those to which the Portfolio is typically subject. In addition, shares of ETFs may trade at a premium or discount to net asset value and are subject to secondary market trading risks. Secondary markets may be subject to irregular trading activity, wide bid/ask spreads, and extended trade settlement periods in times of market stress because market makers and authorized participants may step away from making a market in an ETF’s shares, which could cause a material decline in the ETF’s net asset value.
Preferred Stocks: Preferred stock generally has preference over common stock but is generally subordinate to debt instruments with respect to dividends and liquidation. Preferred stocks are subject to the risks associated with other types of equity securities, as well as greater credit or other risks than senior debt instruments. In addition, preferred stocks are subject to other risks, such as risks related to deferred and omitted distributions, limited voting rights, liquidity, interest rate, regulatory changes and special redemption rights.
Prepayment and Extension: Many types of debt instruments are subject to prepayment and extension risk. Prepayment risk is the risk that the issuer of a debt instrument will pay back the principal earlier than expected. This risk is heightened in a falling market interest rate environment. Prepayment may expose the Portfolio to a lower rate of return upon reinvestment of principal. Also, if a debt instrument subject to prepayment has been purchased at a premium, the value of the premium would be lost in the event of prepayment. Extension risk is the risk that the issuer of a debt instrument will pay back the principal later than expected. This risk is heightened in a rising market interest rate environment. This may negatively affect performance, as the value of the debt instrument decreases when principal payments are made later than expected. Additionally, the Portfolio may be prevented from investing proceeds it would have received at a given time at the higher prevailing interest rates.
Voya Intermediate Bond Portfolio
42
Securities Lending: Securities lending involves two primary risks: “ investment risk ” and “ borrower default risk. ” When lending securities, the Portfolio will receive cash or U.S. government securities as collateral. Investment risk is the risk that the Portfolio will lose money from the investment of the cash collateral received from the borrower. Borrower default risk is the risk that the Portfolio will lose money due to the failure of a borrower to return a borrowed security. Securities lending may result in leverage. The use of leverage may exaggerate any increase or decrease in the net asset value, causing the Portfolio to be more volatile. The use of leverage may increase expenses and increase the impact of the Portfolio’s other risks.
U.S. Government Securities and Obligations: U.S. government securities are obligations of, or guaranteed by, the U.S. government, its agencies, or government-sponsored enterprises. U.S. government securities are subject to market risk and interest rate risk, and may be subject to varying degrees of credit risk.
An investment in the Portfolio is not a bank deposit and is not insured or guaranteed by the Federal Deposit Insurance Corporation, the Federal Reserve Board or any other government agency.
Performance Information
The following information is intended to help you understand the risks of investing in the Portfolio. The following bar chart shows the changes in the Portfolio's performance from year to year, and the table compares the Portfolio's performance to the performance of a broad-based securities market index with investment characteristics similar to those of the Portfolio for the same period. The Portfolio's performance information reflects applicable fee waivers and/or expense limitations in effect during the period presented. Absent such fee waivers/expense limitations, if any, performance would have been lower. The bar chart shows the performance of the Portfolio's Class ADV shares. Performance for other share classes would differ to the extent they have differences in their fees and expenses.
Performance shown in the bar chart and in the Average Annual Total Returns table does not include insurance-related charges imposed under a Variable Contract or expenses related to a Qualified Plan. If these charges or expenses were included, performance would be lower. Thus, you should not compare the Portfolio's performance directly with the performance information of other investment products without taking into account all insurance-related charges and expenses payable under your Variable Contract or Qualified Plan. The Portfolio's past performance is no guarantee of future results.
Calendar Year Total Returns Class ADV
(as of December 31 of each year)
(as of December 31 of each year)
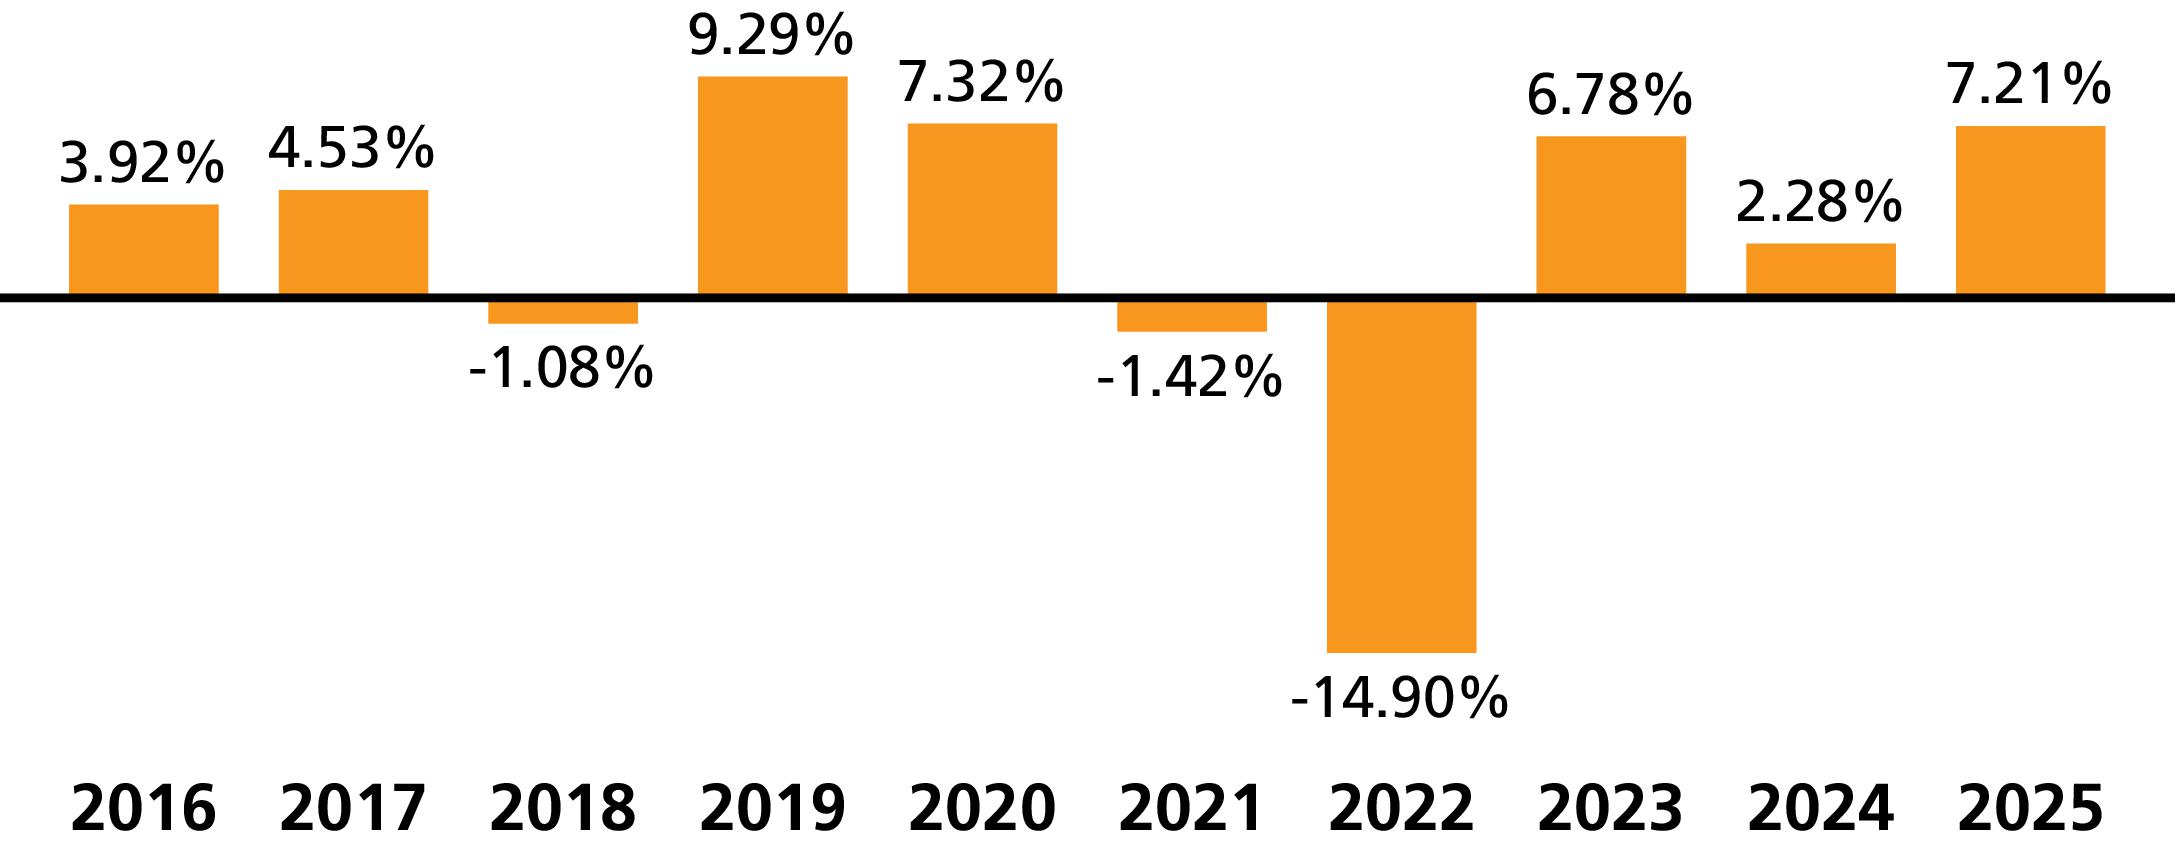
|
Best quarter: |
4th Quarter 2023 |
7.11% |
|
Worst quarter: |
1st Quarter 2022 |
-6.42% |
Average Annual Total Returns %
(for the periods ended December 31, 2025)
(for the periods ended December 31, 2025)
|
|
|
1 Yr |
5 Yrs |
10 Yrs |
Since
Inception |
Inception
Date |
|
Class ADV |
% |
7.21 |
-0.36 |
2.16 |
N/A |
12/20/2006 |
|
Bloomberg U.S. Aggregate Bond Index1 |
% |
7.30 |
-0.36 |
2.01 |
N/A |
|
|
Class I |
% |
7.71 |
0.15 |
2.66 |
N/A |
5/23/1973 |
|
Bloomberg U.S. Aggregate Bond Index1 |
% |
7.30 |
-0.36 |
2.01 |
N/A |
|
|
Class S |
% |
7.46 |
-0.09 |
2.42 |
N/A |
5/3/2002 |
|
Bloomberg U.S. Aggregate Bond Index1 |
% |
7.30 |
-0.36 |
2.01 |
N/A |
|
|
Class S2 |
% |
7.32 |
-0.26 |
2.26 |
N/A |
2/27/2009 |
|
Bloomberg U.S. Aggregate Bond Index1 |
% |
7.30 |
-0.36 |
2.01 |
N/A |
|
1
The index returns do not reflect deductions for fees, expenses, or taxes.
Voya Intermediate Bond Portfolio
43
Portfolio Management
|
Investment Adviser |
|
Voya Investments, LLC |
|
Sub-Adviser |
|
Voya Investment Management Co. LLC |
|
Portfolio Managers |
|
|
Sean Banai, CFA
Portfolio Manager (since 7/2021) |
David Goodson
Portfolio Manager (since 4/2017) |
|
Rajen Jadav, CFA
Portfolio Manager (since 2/2026) |
Anuranjan Sharma
Portfolio Manager (since 2/2026) |
|
Vinay Viralam, CFA
Portfolio Manager (since 2/2026) |
|
Purchase and Sale of Portfolio Shares
Shares of the Portfolio are not offered directly to the public. Purchase and sale of shares may be made only by separate accounts of insurance companies serving as investment options under Variable Contracts or by Qualified Plans, custodian accounts, and certain investment advisers and their affiliates, other investment companies, or permitted investors. Please refer to the prospectus for the appropriate insurance company separate account, investment company, or your plan documents for information on how to direct investments in, or sale from, an investment option corresponding to the Portfolio and any fees that may apply. Participating insurance companies and certain other designated organizations are authorized to receive purchase orders on the Portfolio's behalf.
Tax Information
Distributions made by the Portfolio to a Variable Contract or Qualified Plan, and exchanges and redemptions of Portfolio shares made by a Variable Contract or Qualified Plan, ordinarily do not cause the corresponding contract holder or plan participant to recognize income or gain for U.S. federal income tax purposes. See the Variable Contract prospectus or the governing documents of your Qualified Plan for information regarding the U.S. federal income tax treatment of the distributions to your Variable Contract or Qualified Plan and the holders of the contracts or plan participants.
Payments to Broker-Dealers and Other Financial Intermediaries
If you invest in the Portfolio through a Variable Contract issued by an insurance company or through a Qualified Plan that, in turn, was purchased or serviced through an insurance company, broker-dealer or other financial intermediary, the Portfolio and its Investment Adviser or distributor or their affiliates may: (1) make payments to the insurance company issuer of the Variable Contract or to the company servicing the Qualified Plan and (2) make payments to the insurance company, broker-dealer, or other financial intermediary. These payments may create a conflict of interest by: (1) influencing the insurance company or the company servicing the Qualified Plan to make the Portfolio available as an investment option for the Variable Contract or the Qualified Plan or (2) influencing the broker-dealer or other intermediary and your salesperson to recommend the Variable Contract or the pension servicing agent and/or the Portfolio over other options. Ask your salesperson or Qualified Plan administrator or visit your financial intermediary's website for more information.
Voya Intermediate Bond Portfolio
44
Voya Small Company Portfolio
Investment Objective
The Portfolio seeks growth of capital primarily through investment in a diversified portfolio of common stock of companies with smaller market capitalizations.
Fees and Expenses of the Portfolio
The table describes the fees and expenses that you may pay if you buy, hold, and sell shares of the Portfolio. You may pay other fees and expenses such as fees and expenses imposed under your variable annuity contracts or variable life insurance policies (“Variable Contract”) or a qualified pension or retirement plan (“Qualified Plan”), which are not reflected in the tables and examples below. If these fees or expenses were included in the table, the Portfolio’s expenses would be higher. For more information on these charges, please refer to the documents governing your Variable Contract or Qualified Plan or consult your plan administrator.
Annual Portfolio Operating Expenses1
Expenses you pay each year as a % of the value of your investment
Expenses you pay each year as a % of the value of your investment
|
Class |
|
ADV |
I |
R6 |
S |
|
Management Fees |
% |
0.75 |
0.75 |
0.75 |
0.75 |
|
Distribution and/or Shareholder Services (12b-1) Fees |
% |
0.50 |
None |
None |
0.25 |
|
Other Expenses |
% |
0.27 |
0.27 |
0.05 |
0.27 |
|
Total Annual Portfolio Operating Expenses |
% |
1.52 |
1.02 |
0.80 |
1.27 |
|
Waivers and Reimbursements2 |
% |
(0.15) |
(0.15) |
None |
(0.15) |
|
Total Annual Portfolio Operating Expenses after Waivers and
Reimbursements |
% |
1.37 |
0.87 |
0.80 |
1.12 |
1
Expense information has been restated to reflect current contractual rates.
2
Voya Investments, LLC (the “Investment Adviser”) is contractually obligated to limit expenses to 1.36%, 0.86%, 0.86%, and 1.11% for Class ADV, Class I, Class R6 and Class S shares, respectively, through May 1, 2027. (the “ Expense Limitation Agreement ” ). The limitation does not extend to interest, taxes, other investment-related costs, leverage expenses, extraordinary expenses such as litigation or other expenses not incurred in the ordinary course of business, and expenses of any counsel or other persons or services retained by the directors who are not “ interested persons ” as that term is defined by the Investment Company Act of 1940, as amended . Modification of the Expense Limitation Agreement requires written agreement signed by each of the parties and approval by the Portfolio's Board of Directors (the “Board”). The Expense Limitation Agreement shall terminate with respect to the Portfolio upon termination of the Portfolio's advisory agreement with the Investment Adviser, or it may be terminated by Voya Variable Portfolios, Inc . (the “ Company ” ), without payment of any penalty, upon written notice to the Investment Adviser at its principal place of business .
Expense Example
This Example is intended to help you compare the cost of investing in shares of the Portfolio with the costs of investing in other mutual funds. The Example does not reflect expenses and charges which are, or may be, imposed under your Variable Contract or Qualified Plan. The Example assumes that you invest $10,000 in the Portfolio for the time periods indicated. The Example also assumes that your investment had a 5% return each year and that the Portfolio's operating expenses remain the same. The Example reflects applicable expense limitation agreements and/or waivers in effect, if any, for the one-year period and the first year of the time periods indicated . Although your actual costs may be higher or lower, based on these assumptions your costs would be:
|
Class |
|
1 Yr |
3 Yrs |
5 Yrs |
10 Yrs |
|
ADV |
$ |
139 |
466 |
815 |
1,800 |
|
I |
$ |
89 |
310 |
549 |
1,234 |
|
R6 |
$ |
82 |
255 |
444 |
990 |
|
S |
$ |
114 |
388 |
683 |
1,521 |
Portfolio Turnover
The Portfolio pays transaction costs, such as commissions, when it buys and sells securities (or “turns over” its portfolio). A higher portfolio turnover rate may indicate higher transaction costs. These costs, which are not reflected in Annual Portfolio Operating Expenses or in the Expense Example, affect the Portfolio's performance.
During the most recent fiscal year, the Portfolio's portfolio turnover rate was 111% of the average value of its portfolio.
45
Voya Small Company Portfolio
Principal Investment Strategies
Under normal circumstances, the Portfolio invests at least 80% of its net assets (plus the amount of any borrowings for investment purposes) in investments tied to small-capitalization companies. For purposes of this 80% policy, small-capitalization companies means companies with market capitalizations that fall within the capitalization range of companies within the Russell 2000® Index (the “Index”) or the S&P SmallCap 600® Index.
The market capitalization of companies within the indices will change with market conditions. As of December 31, 2025, the market capitalization of companies within the Index ranged from $5.0 million to $31.3 billion, and the market capitalization of companies within the S&P SmallCap 600® Index ranged from $500.7 million to $9.2 billion.
In managing the Portfolio, the sub-adviser and the sub-sub-adviser (together, the “Sub-Adviser”) invests in a portfolio of common stocks of small-capitalization companies that it believes have the potential to outperform the Index over the long term. The Sub-Adviser uses quantitative methods, including machine-learning based artificial intelligence (“AI”) models, to select securities for potential investment and to support portfolio trading.
As part of the securities selection process, the AI models analyze a variety of inputs, including among other things, financial, fundamental, macro, and technical characteristics. The data may include structured data (e.g., financial information) and unstructured data (e.g., press releases and news articles). The AI model is designed to identify companies whose perceived value is not reflected in the stock price by identifying persistent patterns in company data that have historically been correlated with outperformance. The Sub-Adviser utilizes a dynamic portfolio construction process and trades opportunistically based on the AI models’ selections; such trading may be frequent. The Sub-Adviser may also use other AI techniques or inputs to implement its investment strategy. Portfolio managers and analysts at the Sub-Adviser review the AI models’ selections, oversee the operation of all AI models, and seek to mitigate a number of risks the models might pose, including lack of transparency regarding the bases for the models' selections and any biases or operational deficiencies in the models that are identified.
The Portfolio may invest in derivative instruments including, but not limited to, put and call options. The Portfolio may use derivative instruments to seek to reduce exposure to other risks, such as currency risk, to substitute for taking a position in the underlying asset, to maintain equity market exposure on its cash balance, and/or to seek to enhance returns in the Portfolio.
The Portfolio may invest, to a limited extent, in foreign (non-U.S.) stocks and depositary receipts.
The Portfolio may invest in real estate-related securities, including real estate investment trusts (“REITs”).
The Portfolio may invest in other investment companies, including exchange-traded funds (“ETFs”), to the extent permitted under the Investment Company Act of 1940, as amended, and the rules and regulations thereunder, and under the terms of applicable no-action relief or exemptive orders granted thereunder.
In evaluating investments for the Portfolio, the Sub-Adviser takes into account a wide variety of factors and considerations to determine whether any or all of those factors or considerations might have a material effect on the value, risks, or prospects of a company. Among the factors considered, the Sub-Adviser expects typically to take into account environmental, social, and governance (“ESG”) factors. In considering ESG factors, the Sub-Adviser intends to rely primarily on factors identified through its proprietary empirical research and on third-party evaluations of a company’s ESG standing, when available. ESG factors will be only one of many considerations in the Sub-Adviser’s evaluation of any potential investment; the extent to which ESG factors will affect the Sub-Adviser’s decision to invest in a company, if at all, will depend on the analysis and judgment of the Sub-Adviser.
The Sub-Adviser may sell securities for a variety of reasons, such as to secure gains, limit losses, or redeploy assets into opportunities believed to be more promising.
The Portfolio may lend portfolio securities on a short-term or long-term basis, up to 33 1∕3% of its total assets.
Principal Risks
You could lose money on an investment in the Portfolio. Any of the following risks, among others, could affect Portfolio performance or cause the Portfolio to lose money or to underperform market averages of other funds. The principal risks are presented in alphabetical order to facilitate readability, and their order does not imply that the realization of one risk is more likely to occur or have a greater adverse impact than another risk.
Company: The price of a company’s stock could decline or underperform for many reasons, including, among others, poor management, financial problems, reduced demand for the company’s goods or services, regulatory fines and judgments, or business challenges. If a company is unable to meet its financial obligations, declares bankruptcy, or becomes insolvent, its stock could become worthless.
Voya Small Company Portfolio
46
Currency: To the extent that the Portfolio invests directly or indirectly in foreign (non-U.S.) currencies or in securities denominated in, or that trade in, foreign (non-U.S.) currencies, it is subject to the risk that those foreign (non-U.S.) currencies will decline in value relative to the U.S. dollar or, in the case of hedging positions, that the U.S. dollar will decline in value relative to the currency being hedged by the Portfolio through foreign currency exchange transactions.
Derivative Instruments: Derivative instruments are subject to a number of risks, including the risk of changes in the market price of the underlying asset, reference rate, or index, credit risk with respect to the counterparty, risk of loss due to changes in market interest rates, liquidity risk, valuation risk, and volatility risk. The amounts required to purchase certain derivatives may be small relative to the magnitude of exposure assumed by the Portfolio. Therefore, the purchase of certain derivatives may have an economic leveraging effect on the Portfolio and exaggerate any increase or decrease in the net asset value. Derivatives may not perform as expected, so the Portfolio may not realize the intended benefits. When used for hedging purposes, the change in value of a derivative may not correlate as expected with the asset, reference rate, or index being hedged. When used as an alternative or substitute for direct cash investment, the return provided by the derivative may not provide the same return as direct cash investment.
Environmental, Social, and Governance (Equity): The Sub-Adviser’s consideration of ESG factors in selecting investments for the Portfolio is based on information that is not standardized, some of which can be qualitative and subjective by nature. The Sub-Adviser’s assessment of ESG factors in respect of a company may rely on third-party data that might be incorrect or based on incomplete or inaccurate information. There is no minimum percentage of the Portfolio’s assets that will be invested in companies that the Sub-Adviser views favorably in light of ESG factors, and the Sub-Adviser may choose not to invest in companies that compare favorably to other companies on the basis of ESG factors. It is possible that the Portfolio will have less exposure to certain companies due to the Sub-Adviser’s assessment of ESG factors than other comparable mutual funds. There can be no assurance that an investment selected by the Sub-Adviser, which includes its consideration of ESG factors, when available, will provide more favorable investment performance than another potential investment, and such an investment may, in fact, underperform other potential investments.
Foreign (Non-U.S.) Investments: Investing in foreign (non-U.S.) securities may result in the Portfolio experiencing more rapid and extreme changes in value than a fund that invests exclusively in securities of U.S. companies due, in part, to: smaller markets; differing reporting, accounting, auditing and financial reporting standards and practices; nationalization, expropriation, or confiscatory taxation; foreign currency fluctuations, currency blockage, or replacement; potential for default on sovereign debt; and political changes or diplomatic developments, which may include the imposition of economic sanctions (or the threat of new or modified sanctions) or other measures by the U.S. or other governments and supranational organizations. Markets and economies throughout the world are becoming increasingly interconnected, and conditions or events in one market, country or region may adversely impact investments or issuers in another market, country or region.
Growth Investing: Prices of growth-oriented stocks are more sensitive to investor perceptions of the issuer’s growth potential and may fall quickly and significantly if investors suspect that actual growth may be less than expected. There is a risk that funds that invest in growth-oriented stocks may underperform other funds that invest more broadly. Growth-oriented stocks tend to be more volatile than value-oriented stocks, and may underperform the market as a whole over any given time period.
Investment Model: The Sub-Adviser’s proprietary investment model may not adequately take into account existing or unforeseen market factors or the interaction among such factors, including changes in how such factors interact, and there is no guarantee that the use of a proprietary investment model will result in effective investment decisions for the Portfolio. Portfolios that are actively managed, in whole or in part, according to a quantitative investment model (including models that utilize forms of artificial intelligence, such as machine learning) can perform differently from the market, based on the investment model and the factors used in the analysis, the weight placed on each factor, and changes from the factors’ historical trends. Technical issues in the design, development, implementation, application, and maintenance of the models ( e.g. , stale or inaccurate data, human error, programming or other software issues , coding errors, and technology failures ) may create errors or limitations that might go undetected or are discovered only after the errors or limitations have negatively impacted performance.
Artificial intelligence may produce inaccurate, misleading or incomplete outputs that could lead to errors in the Sub-Adviser’s decision-making, portfolio management or other business activities, which could have a negative impact on the performance of the Portfolio and its investments. The Sub-Adviser's ability to detect, prevent or correct these errors may be limited by the AI models' lack of transparency regarding the bases for models' selection of securities. The data and other information utilized by artificial intelligence may be insufficient, incomplete, inaccurate or contain biased information. Data deficiencies could undermine predictions or analysis that artificial intelligence models produce. In addition, the Sub-Adviser’s ability to use, manage and aggregate data may be limited by the effectiveness of its policies, systems and practices that govern how data is acquired, validated, used, stored, protected, processed, analyzed and shared. Use of artificial intelligence may also result
Voya Small Company Portfolio
47
in allegations or claims against the Sub-Adviser, the Portfolio or its investments related to violation of third-party intellectual property rights, unauthorized access to or use of proprietary information and failure to comply with open-source software requirements, which may adversely affect the Sub-Adviser’s ability to use the artificial intelligence model or adversely affect performance.
Liquidity: If a security is illiquid, the Portfolio might be unable to sell the security at a time when the Portfolio’s manager might wish to sell, or at all. Further, the lack of an established secondary market may make it more difficult to value illiquid securities, exposing the Portfolio to the risk that the prices at which it sells illiquid securities will be less than the prices at which they were valued when held by the Portfolio, which could cause the Portfolio to lose money. The prices of illiquid securities may be more volatile than more liquid securities, and the risks associated with illiquid securities may be greater in times of financial stress. Certain securities that are liquid when purchased may later become illiquid, particularly in times of overall economic distress or due to geopolitical events such as sanctions, trading halts, or wars. In addition, markets or securities may become illiquid quickly.
Market: The market values of securities will fluctuate, sometimes sharply and unpredictably, based on overall economic conditions, governmental actions or intervention, market disruptions caused by trade disputes or other factors, political developments, and other factors. Prices of equity securities tend to rise and fall more dramatically than those of debt instruments. Additionally, legislative, regulatory or tax policies or developments may adversely impact the investment techniques available to a manager, add to costs, and impair the ability of the Portfolio to achieve its investment objectives.
Market Disruption and Geopolitical: The Portfolio is subject to the risk that geopolitical events will disrupt securities markets and adversely affect global economies and markets. Due to the increasing interdependence among global economies and markets, conditions in one country, market, or region might adversely impact markets, issuers and/or foreign exchange rates in other countries, including the United States. Wars, terrorism, global health crises and pandemics, trade disputes, tariffs and other restrictions on trade or economic sanctions, rapid technological developments (such as artificial intelligence technologies), and other geopolitical events that have led, and may continue to lead, to increased market volatility and may have adverse short- or long-term effects on U.S. and global economies and markets, generally. For example, the COVID-19 pandemic resulted in significant market volatility, exchange suspensions and closures, declines in global financial markets, higher default rates, supply chain disruptions, and a substantial economic downturn in economies throughout the world. The economic impacts of COVID-19 have created a unique challenge for real estate markets. Many businesses have either partially or fully transitioned to a remote-working environment and this transition may negatively impact the occupancy rates of commercial real estate over time. Natural and environmental disasters and systemic market dislocations are also highly disruptive to economies and markets. Military action by Russia in Ukraine, the prolonged conflict between Hamas and Israel, the Iranian conflict that commenced in February 2026, and political upheaval in Venezuela have resulted, and may continue to result, in sanctions, market disruptions, declines in regional and global stock markets, unusual volatility in global commodity markets, and disruptions to energy production or transportation, including through key shipping routes, any of which could adversely affect the value of the Portfolio ' s investments, including beyond the Portfolio's direct exposure to issuers in the affected regions. The escalation or expansion of hostilities including the involvement of additional nations, could introduce further uncertainty and volatility in global energy, commodity, and financial markets. The extent and duration of these conflicts, related sanctions, and resulting market disruptions are impossible to predict but could be substantial. A number of U.S. domestic banks and foreign (non-U.S.) banks have experienced financial difficulties and, in some cases, failures. There can be no certainty that the actions taken by regulators to limit the effect of those financial difficulties and failures on other banks or other financial institutions or on the U.S. or foreign (non-U.S.) economies generally will be successful. It is possible that more banks or other financial institutions will experience financial difficulties or fail, which may affect adversely other U.S. or foreign (non-U.S.) financial institutions and economies. These events as well as other changes in foreign (non-U.S.) and domestic economic, social, and political conditions also could adversely affect individual issuers or related groups of issuers, securities markets, interest rates, credit ratings, inflation, investor sentiment, and other factors affecting the value of the Portfolio’s investments. Any of these occurrences could disrupt the operations of the Portfolio and of the Portfolio’s service providers. Recent technological developments in, and the increasingly widespread use of, artificial intelligence, including machine learning technology and generative artificial intelligence (“AI”), may pose risks to the Portfolio. For instance, the economy may be significantly impacted by the advanced development and increased regulation of AI. As AI is used more widely, the profitability and growth of Portfolio holdings may be impacted, which could significantly impact the overall performance of the Portfolio. The legal and regulatory frameworks within which AI operates continue to rapidly evolve, and it is not possible to predict the full extent of current or future risks related thereto.
Other Investment Companies: The main risk of investing in other investment companies, including ETFs, is the risk that the value of an investment company’s underlying investments might decrease. Shares of investment companies that are listed on an exchange may trade at a discount or premium from their net asset value. You will pay a proportionate share of the expenses of those other investment companies (including management fees, administration fees, and custodial fees) in addition to the Portfolio’s expenses. The investment policies of the other investment companies may not be the same as those of
Voya Small Company Portfolio
48
the Portfolio; as a result, an investment in the other investment companies may be subject to additional or different risks than those to which the Portfolio is typically subject. In addition, shares of ETFs may trade at a premium or discount to net asset value and are subject to secondary market trading risks. Secondary markets may be subject to irregular trading activity, wide bid/ask spreads, and extended trade settlement periods in times of market stress because market makers and authorized participants may step away from making a market in an ETF’s shares, which could cause a material decline in the ETF’s net asset value.
Real Estate Companies and Real Estate Investment Trusts: Investing in real estate companies and REITs may subject the Portfolio to risks similar to those associated with the direct ownership of real estate, including losses from casualty or condemnation, changes in local and general economic conditions, supply and demand, market interest rates, zoning laws, regulatory limitations on rents, property taxes, overbuilding, high foreclosure rates, and operating expenses in addition to terrorist attacks, wars, or other acts that destroy real property. In addition, REITs may also be affected by tax and regulatory requirements in that a REIT may not qualify for favorable tax treatment or regulatory exemptions. Investments in REITs are affected by the management skill of the REIT’s sponsor. The Portfolio will indirectly bear its proportionate share of expenses, including management fees, paid by each REIT in which it invests.
Securities Lending: Securities lending involves two primary risks: “ investment risk ” and “ borrower default risk. ” When lending securities, the Portfolio will receive cash or U.S. government securities as collateral. Investment risk is the risk that the Portfolio will lose money from the investment of the cash collateral received from the borrower. Borrower default risk is the risk that the Portfolio will lose money due to the failure of a borrower to return a borrowed security. Securities lending may result in leverage. The use of leverage may exaggerate any increase or decrease in the net asset value, causing the Portfolio to be more volatile. The use of leverage may increase expenses and increase the impact of the Portfolio’s other risks.
Small-Capitalization Company: Investments in small-capitalization companies may involve greater risk than is customarily associated with larger, more established companies due to the greater business risks of a limited operating history, small size, limited markets and financial resources, narrow product lines, less management depth and more reliance on key personnel. The securities of small-capitalization companies are subject to liquidity risk as they are often traded over-the-counter and may not be traded in volumes typically seen on national securities exchanges.
Value Investing: Securities that appear to be undervalued may never appreciate to the extent expected. Further, because the prices of value-oriented securities tend to correlate more closely with economic cycles than growth-oriented securities, they generally are more sensitive to changing economic conditions, such as changes in market interest rates, corporate earnings and industrial production. The manager may be wrong in its assessment of a company’s value and the securities the Portfolio holds may not reach their full values. Risks associated with value investing include that a security that is perceived by the manager to be undervalued may actually be appropriately priced and, thus, may not appreciate and provide anticipated capital growth. The market may not favor value-oriented securities and may not favor equities at all. During those periods, the Portfolio’s relative performance may suffer. There is a risk that funds that invest in value-oriented securities may underperform other funds that invest more broadly.
An investment in the Portfolio is not a bank deposit and is not insured or guaranteed by the Federal Deposit Insurance Corporation, the Federal Reserve Board or any other government agency.
Performance Information
The following information is intended to help you understand the risks of investing in the Portfolio. The following bar chart shows the changes in the Portfolio's performance from year to year, and the table compares the Portfolio's performance to the performance of a broad-based securities market index and an additional index with investment characteristics similar to those of the Portfolio for the same period. In 2024, the Investment Adviser changed the Portfolio’s primary benchmark from the Russell 2000® Index to the Russell 3000® Index in accordance with changes to regulatory disclosure requirements. The Portfolio continues to use the Russell 2000® Index as an additional benchmark that the Investment Adviser believes more closely reflects the Portfolio’s principal investment strategies. The Portfolio's performance information reflects applicable fee waivers and/or expense limitations in effect during the period presented. Absent such fee waivers/expense limitations, if any, performance would have been lower. The bar chart shows the performance of the Portfolio's Class ADV shares. Performance for other share classes would differ to the extent they have differences in their fees and expenses. The Class R6 shares performance shown for the period prior to their inception date is the performance of Class I shares without adjustment for any differences in expenses between the two classes. If adjusted for such differences, returns would be different.
Performance shown in the bar chart and in the Average Annual Total Returns table does not include insurance-related charges imposed under a Variable Contract or expenses related to a Qualified Plan. If these charges or expenses were included, performance would be lower. Thus, you should not compare the Portfolio's performance directly with the performance information of other investment products without taking into account all insurance-related charges and expenses payable under your Variable Contract or Qualified Plan. The Portfolio's past performance is no guarantee of future results.
Voya Small Company Portfolio
49
Calendar Year Total Returns Class ADV
(as of December 31 of each year)
(as of December 31 of each year)
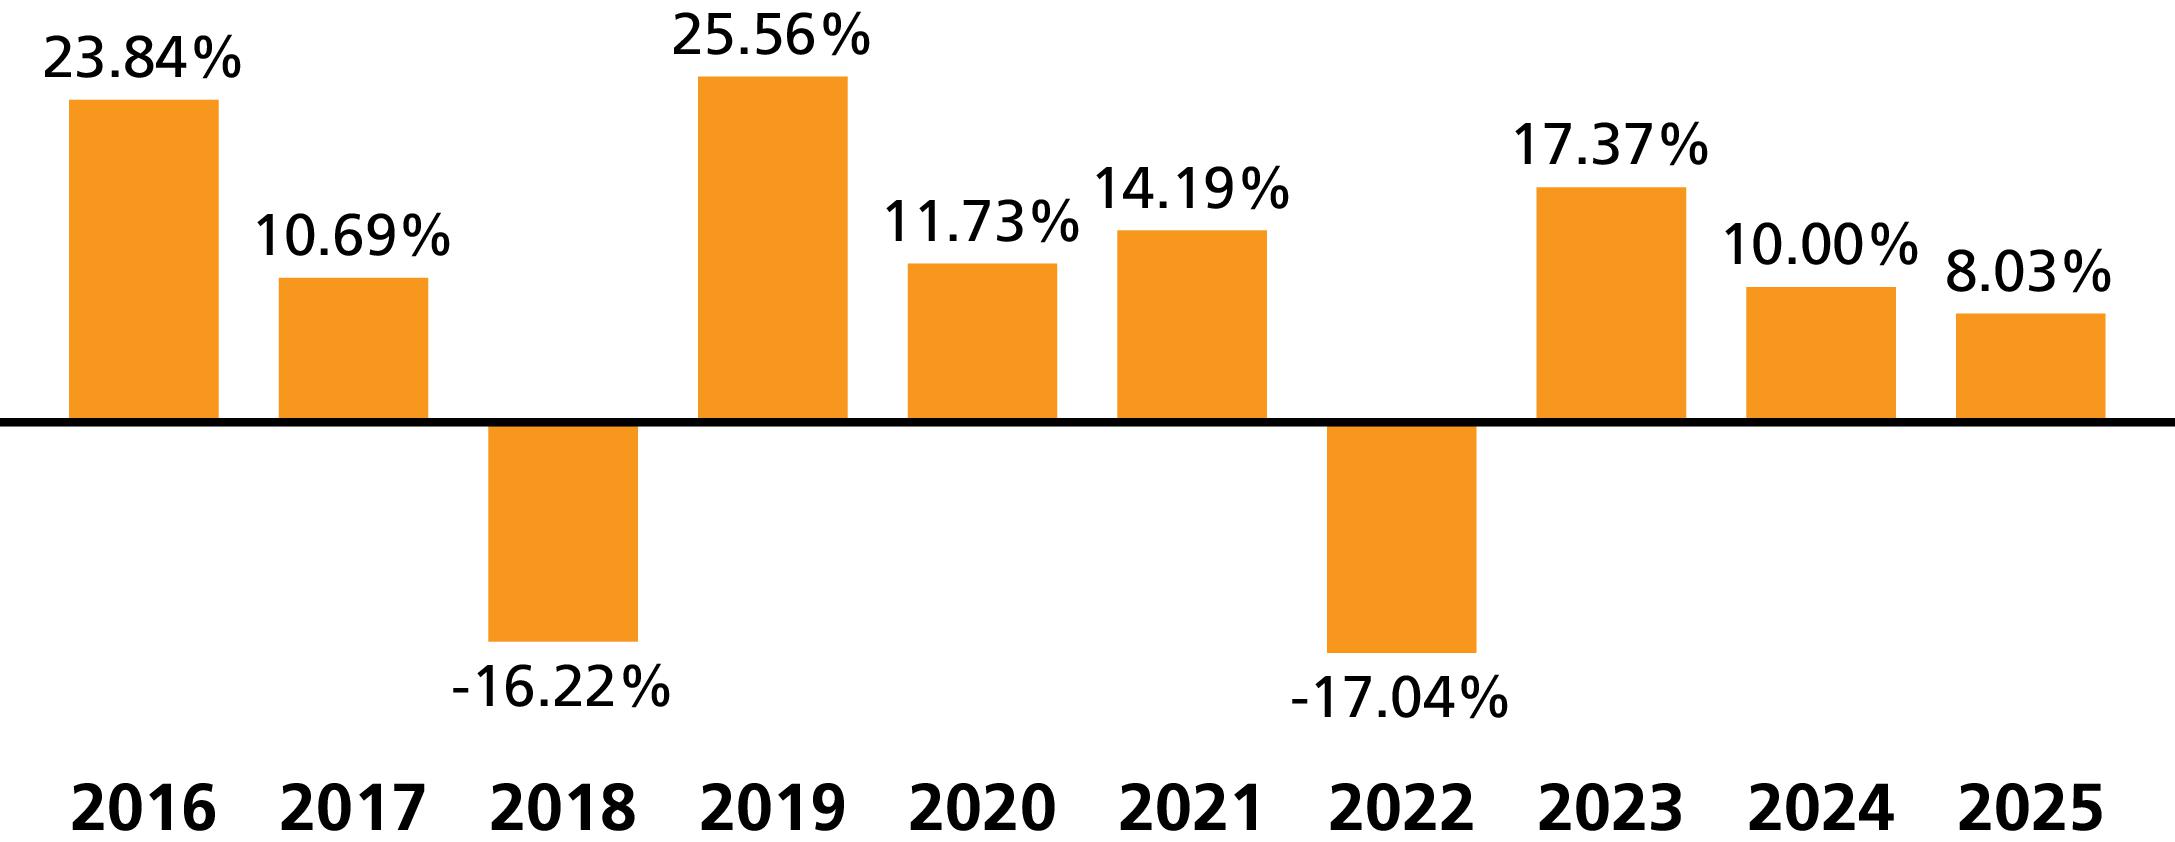
|
Best quarter: |
4th Quarter 2020 |
30.92% |
|
Worst quarter: |
1st Quarter 2020 |
-32.18% |
Average Annual Total Returns %
(for the periods ended December 31, 2025)
(for the periods ended December 31, 2025)
|
|
|
1 Yr |
5 Yrs |
10 Yrs |
Since
Inception |
Inception
Date |
|
Class ADV |
% |
8.03 |
5.73 |
7.85 |
N/A |
12/16/2008 |
|
Russell 3000® Index1 |
% |
17.15 |
13.15 |
14.29 |
N/A |
|
|
Russell 2000® Index1 |
% |
12.81 |
6.09 |
9.62 |
N/A |
|
|
Class I |
% |
8.59 |
6.26 |
8.39 |
N/A |
12/27/1996 |
|
Russell 3000® Index1 |
% |
17.15 |
13.15 |
14.29 |
N/A |
|
|
Russell 2000® Index1 |
% |
12.81 |
6.09 |
9.62 |
N/A |
|
|
Class R6 |
% |
8.62 |
6.31 |
8.42 |
N/A |
11/24/2015 |
|
Russell 3000® Index1 |
% |
17.15 |
13.15 |
14.29 |
N/A |
|
|
Russell 2000® Index1 |
% |
12.81 |
6.09 |
9.62 |
N/A |
|
|
Class S |
% |
10.15 |
6.36 |
8.31 |
N/A |
11/1/2001 |
|
Russell 3000® Index1 |
% |
17.15 |
13.15 |
14.29 |
N/A |
|
|
Russell 2000® Index1 |
% |
12.81 |
6.09 |
9.62 |
N/A |
|
1
The index returns do not reflect deductions for fees, expenses, or taxes.
Portfolio Management
|
Investment Adviser |
|
Voya Investments, LLC |
|
Sub-Adviser |
|
Voya Investment Management Co. LLC |
|
Portfolio Managers |
|
|
Russell Shtern, CFA
Portfolio Manager (since 7/2022) |
Kai Yee Wong
Portfolio Manager (since 8/2025) |
|
Sub-Sub-Adviser |
|
Voya Investment Management (UK) Limited |
|
Portfolio Manager |
|
Sanne V. De Boer, PhD, CFA
Portfolio Manager (since 8/2025) |
Purchase and Sale of Portfolio Shares
Shares of the Portfolio are not offered directly to the public. Purchase and sale of shares may be made only by separate accounts of insurance companies serving as investment options under Variable Contracts or by Qualified Plans, custodian accounts, and certain investment advisers and their affiliates, other investment companies, or permitted investors. Please refer to the prospectus for the appropriate insurance company separate account, investment company, or your plan documents for information on how to direct investments in, or sale from, an investment option corresponding to the Portfolio and any fees that may apply. Participating insurance companies and certain other designated organizations are authorized to receive purchase orders on the Portfolio's behalf.
Voya Small Company Portfolio
50
Tax Information
Distributions made by the Portfolio to a Variable Contract or Qualified Plan, and exchanges and redemptions of Portfolio shares made by a Variable Contract or Qualified Plan, ordinarily do not cause the corresponding contract holder or plan participant to recognize income or gain for U.S. federal income tax purposes. See the Variable Contract prospectus or the governing documents of your Qualified Plan for information regarding the U.S. federal income tax treatment of the distributions to your Variable Contract or Qualified Plan and the holders of the contracts or plan participants.
Payments to Broker-Dealers and Other Financial Intermediaries
If you invest in the Portfolio through a Variable Contract issued by an insurance company or through a Qualified Plan that, in turn, was purchased or serviced through an insurance company, broker-dealer or other financial intermediary, the Portfolio and its Investment Adviser or distributor or their affiliates may: (1) make payments to the insurance company issuer of the Variable Contract or to the company servicing the Qualified Plan and (2) make payments to the insurance company, broker-dealer, or other financial intermediary. These payments may create a conflict of interest by: (1) influencing the insurance company or the company servicing the Qualified Plan to make the Portfolio available as an investment option for the Variable Contract or the Qualified Plan or (2) influencing the broker-dealer or other intermediary and your salesperson to recommend the Variable Contract or the pension servicing agent and/or the Portfolio over other options. Ask your salesperson or Qualified Plan administrator or visit your financial intermediary's website for more information.
Voya Small Company Portfolio
51
KEY PORTFOLIO INFORMATION
This Prospectus contains information about each Portfolio and is designed to provide you with important information to help you with your investment decisions. Please read it carefully and keep it for future reference.
Each Portfolio's Statement of Additional Information (the “SAI”) is incorporated by reference into (legally made a part of) this Prospectus. It identifies investment restrictions, more detailed risk descriptions, a description of how the bond rating system works, and other information that may be helpful to you in your decision to invest. You may obtain a copy, without charge, from each Portfolio.
Neither this Prospectus, nor the related SAI, nor other communications to shareholders, such as proxy statements, is intended, or should be read, to be or give rise to an agreement or contract between Voya Intermediate Bond Portfolio; Voya Government Money Market Portfolio; Voya Variable Funds; Voya Variable Portfolios, Inc. (each, a “Company” or “Trust,” as applicable), the Board of Directors/Trustees (the “Board”), or each Portfolio and any investor, or to give rise to any rights to any shareholder or other person other than any rights under U.S. federal or state law.
Other Voya mutual funds may also be offered to the public that have similar names, investment objectives, and principal investment strategies as those of a Portfolio. You should be aware that each Portfolio is likely to differ from these other Voya mutual funds in size and cash flow pattern, as well as other factors. Accordingly, the performance of each Portfolio can be expected to vary from the performance of other Voya mutual funds.
Other mutual funds and/or funds-of-funds may invest in a Portfolio. So long as a Portfolio accepts investments by other investment companies, it will not purchase securities of other investment companies, except to the extent permitted under the Investment Company Act of 1940, as amended, and the rules and regulations thereunder, and under the terms of applicable no-action relief or exemptive orders granted thereunder (the “1940 Act”).
All the Portfolios (except Voya Government Money Market Portfolio, Voya Growth and Income Portfolio, and Voya Intermediate Bond Portfolio) are a series of Voya Variable Portfolios, Inc., a Maryland corporation. Voya Government Money Market Portfolio is a series of Voya Government Money Market Portfolio; Voya Growth and Income Portfolio is a series of Voya Variable Funds; and Voya Intermediate Bond Portfolio is a series of Voya Intermediate Bond Portfolio, each a Massachusetts business trust. Each Portfolio is managed by Voya Investments, LLC (“Voya Investments” or the “Investment Adviser”).
Portfolio shares may be classified into different classes of shares. The classes of shares of a Portfolio would be substantially the same except for different expenses, certain related rights, and certain shareholder services. All share classes of a Portfolio have a common investment objective and investment portfolio.
Fundamental Investment Policies
Fundamental investment policies contained in the SAI may not be changed without shareholder approval. Other policies and investment strategies may be changed without a shareholder vote.
Portfolio Diversification
Each Portfolio is diversified, as such term is defined in the 1940 Act. A diversified fund may not, as to 75% of its total assets, invest more than 5% of its total assets in any one issuer and may not purchase more than 10% of the outstanding voting securities of any one issuer (other than securities issued or guaranteed by the U.S. government or any of its agencies or instrumentalities, or other investment companies). A non-diversified fund is not limited by the 1940 Act in the percentage of its assets that it may invest in the obligations of a single issuer.
Investor Diversification
Although each Portfolio is designed to serve as a component of a diversified investment portfolio of securities, no single mutual fund can provide an appropriate investment program for all investors. You should evaluate a Portfolio in the context of your personal financial situation, investment objectives, and other investments.
Temporary Defensive Positions
When the Investment Adviser or the sub-adviser (the “Sub-Adviser”) anticipates adverse or unusual market, economic, political, or other conditions, a Portfolio may temporarily depart from its principal investment strategies as a defensive measure. In such circumstances, a Portfolio may make investments believed to present less risk, such as cash, cash equivalents, money market fund shares and other money market instruments, higher quality debt instruments, more
52
KEY PORTFOLIO INFORMATION (continued)
liquid securities, or others. While a Portfolio invests defensively, it may not achieve its investment objective. A Portfolio's defensive investment position may not be effective in protecting its value. It is impossible to predict accurately how long such defensive position may be utilized.
Percentage and Rating Limitations
Unless otherwise indicated or as required by applicable law or regulation, the percentage and rating limitations on Portfolio investments listed in this Prospectus apply at the time of investment. If such a limitation is complied with at the time of an investment, any subsequent change in percentage resulting from a change in values or assets or a change in market capitalization of a company, or any subsequent change in rating, will generally not constitute a violation of that limitation.
Investment Not Guaranteed
Please note your investment is not a bank deposit and is not insured or guaranteed by the Federal Deposit Insurance Corporation, the Federal Reserve Board, or any other government agency.
Shareholder Reports
Each Portfolio's fiscal year ends December 31. Shareholders are provided with annual and semi-annual shareholder reports that highlight key information to shareholders. Other information, including financial statements, is available on the Voya funds’ website (https://individuals.voya.com/literature), delivered free of charge upon request, and filed with the SEC on a semi-annual basis on Form N-CSR. You may elect to receive shareholder reports and other communications from a fund electronically anytime by contacting your financial intermediary (such as a broker-dealer or bank) or, if you are a direct investor, by calling 1-800-992-0180 or by sending an e-mail request to Voyaim_literature@voya.com.
53
MORE INFORMATION ABOUT THE PORTFOLIOS
Additional Information About the Investment Objective
Each Portfolio's investment objective is non-fundamental and may be changed by a vote of the Board, without shareholder approval. A Portfolio will provide 60 days' prior written notice of any change in a non-fundamental investment objective. There is no guarantee a Portfolio will achieve its investment objective.
Additional Information About Principal Investment Strategies
For a complete description of each Portfolio's principal investment strategies, please see the Portfolio's summary prospectus or the Portfolio’s summary section in this Prospectus.
Additional Information About 80% Investment Policies Related to Portfolio Names
Each Portfolio listed in the table below has adopted a policy to invest in accordance with the investment focus that the Portfolio’s name suggests (the “80% Investment Policy”). A Portfolio will provide shareholders with at least 60 days' prior notice of any change in its 80% Investment Policy.
For purposes of satisfying its 80% Investment Policy, each Portfolio listed below may also invest in derivatives and other synthetic instruments and other investment companies, including ETFs, as applicable, that provide investment exposure to, or exposure to risk factors associated with, the investment focus that the Portfolio's name suggests.
|
Portfolio |
80% Investment Policy |
Additional Information About the 80%
Investment Policy |
|
Voya Government Money Market Portfolio |
Under normal circumstances, the Portfolio
invests at least 80% of its net assets (plus
the amount of any borrowings for
investment purposes) in government
securities and repurchase agreements that
are collateralized by government
securities. |
For purposes of this 80% policy,
government securities means any security
issued or guaranteed as to principal or
interest by the United States, or by a
person controlled or supervised by and
acting as an agency or instrumentality of
the government of the United States
pursuant to authority granted by the
Congress of the United States; or any
certificate of deposit for any of the
foregoing. |
|
Voya Growth and Income Portfolio |
Under normal circumstances, the Portfolio
invests at least 80% of its net assets (plus
the amount of any borrowings for
investment purposes) in investments that
the Portfolio believes have potential for
growth, income, or both. |
For purposes of this 80% policy, growth
means investments that are expected to
generate capital appreciation. For
purposes of this 80% policy, income
means investments or instruments of any
kind that are expected to produce income,
including, without limitation, those that
pay dividends and/or interest, whether in
cash or in kind; that generate premiums;
that are issued at a discount; or that
otherwise generate or result in income for
the Portfolio. |
|
Voya Index Plus LargeCap Portfolio |
Under normal circumstances, the Portfolio
invests at least 80% of its net assets (plus
the amount of any borrowings for
investment purposes) in investments tied
to large-capitalization companies included
in the Index. |
For purposes of this 80% policy,
large-capitalization companies means
companies that are included in the Index. |
54
MORE INFORMATION ABOUT THE PORTFOLIOS (continued)
|
Portfolio |
80% Investment Policy |
Additional Information About the 80%
Investment Policy |
|
Voya Index Plus MidCap Portfolio |
Under normal circumstances, the Portfolio
invests at least 80% of its net assets (plus
the amount of any borrowings for
investment purposes) in investments tied
to mid-capitalization companies included
in the Index. |
For purposes of this 80% policy,
mid-capitalization companies means
companies that are included in the Index. |
|
Voya Index Plus SmallCap Portfolio |
Under normal circumstances, the Portfolio
invests at least 80% of its net assets (plus
the amount of any borrowings for
investment purposes) in investments tied
to small-capitalization companies
included in the Index. |
For purposes of this 80% policy,
small-capitalization companies means
companies that are included in the Index. |
|
Voya Intermediate Bond Portfolio |
Under normal circumstances, the Portfolio
invests at least 80% of its net assets (plus
the amount of any borrowings for
investment purposes) in a portfolio of
bonds. |
For purposes of this 80% policy, bonds
include, without limitation, bonds, debt
instruments, and other fixed income and
income-producing debt instruments, of
any kind, issued or guaranteed by
governmental or private-sector entities. |
|
Voya Small Company Portfolio |
Under normal circumstances, the Portfolio
invests at least 80% of its net assets (plus
the amount of any borrowings for
investment purposes) in investments tied
to small-capitalization companies. |
For purposes of this 80% policy,
small-capitalization companies means
companies with market capitalizations
that fall within the capitalization range of
companies within the Russell 2000®
Index or the S&P SmallCap 600® Index. |
Additional Information About the Principal Risks
All mutual funds involve risk—some more than others—and there is always the chance that you could lose money or not earn as much as you hope. Each Portfolio's risk profile is largely a factor of the principal securities in which it invests and investment techniques that it uses. Below is a discussion of the principal risks associated with certain types of the investments in which a Portfolio may invest and certain of the investment practices that a Portfolio may use. The discussion below expands on the risks included in each Portfolio's summary section of the Prospectus. The principal risks are presented in alphabetical order to facilitate readability, and their order does not imply that the realization of one risk is more likely to occur or have a greater adverse impact than another risk.
Many of the investment techniques and strategies discussed in this Prospectus and in the SAI are discretionary, which means that the Investment Adviser or Sub-Adviser, as the case may be, can decide whether to use them. A Portfolio may invest in these securities or use these techniques as part of its principal investment strategies. However, the Investment Adviser or Sub-Adviser may also use these investment techniques or make investments in securities that are not a part of a Portfolio’s principal investment strategies.
For more information about these and other types of securities and investment techniques that may be used by each Portfolio, see the SAI.
Bank Instruments: Bank instruments include certificates of deposit, fixed time deposits, bankers’ acceptances, and other debt and deposit-type obligations issued by banks. Changes in economic, regulatory, or political conditions, or other events that affect the banking industry may have an adverse effect on bank instruments or banking institutions that serve as counterparties in transactions with a Portfolio. In the event of a bank insolvency or failure, a Portfolio may be considered a general creditor of the bank, and it might lose some or all of the funds deposited with the bank. Even where it is recognized that a bank might be in danger of insolvency or failure, a Portfolio might not be able to withdraw or transfer its money from the bank in time to avoid any adverse effects of the insolvency or failure. Volatility in the banking system may impact the viability of banking and financial services institutions. In the event of failure of
55
MORE INFORMATION ABOUT THE PORTFOLIOS (continued)
any of the financial institutions where a Portfolio maintains its cash and cash equivalents, there can be no assurance that the Portfolio would be able to access uninsured funds in a timely manner or at all and the Portfolio may incur losses. Any such event could adversely affect the business, liquidity, financial position and performance of the Portfolio.
Cash/Cash Equivalents: Investments in cash or cash equivalents may lower returns and result in potential lost opportunities to participate in market appreciation which could negatively impact a Portfolio’s performance and ability to achieve its investment objective.
Company: The price of a company’s stock could decline or underperform for many reasons, including, among others, poor management, financial problems, reduced demand for the company’s goods or services, regulatory fines and judgments, or business challenges. If a company is unable to meet its financial obligations, declares bankruptcy, or becomes insolvent, its stock could become worthless.
Convertible Securities: Convertible securities are securities that are convertible into or exercisable for common stocks at a stated price or rate. Convertible securities are subject to the usual risks associated with debt instruments, such as interest rate risk and credit risk. In addition, because convertible securities react to changes in the value of the underlying stock, they are subject to market risk. The value of a convertible security will normally fluctuate in some proportion to changes in the value of the underlying stock because of the conversion or exercise feature. However, the value of a convertible security may not increase or decrease as rapidly as the underlying stock. Convertible securities may be rated below investment grade and therefore may be subject to greater levels of credit risk and liquidity risk. In the event the issuer of a convertible security is unable to meet its financial obligations, declares bankruptcy, or becomes insolvent, a Portfolio could lose money; such events may also have the effect of reducing a Portfolio's distributable income. There is a risk that a Portfolio may convert a convertible security at an inopportune time, which may decrease the Portfolio’s returns.
Credit: A Portfolio could lose money if the issuer or guarantor of a debt instrument in which the Portfolio invests, or the counterparty to a derivative contract the Portfolio entered into, is unable or unwilling, or is perceived (whether by market participants, rating agencies, pricing services, or otherwise) as unable or unwilling, to meet its financial obligations. Asset-backed (including mortgage-backed) securities that are not issued by U.S. government agencies may have a greater risk of default because they are not guaranteed by either the U.S. government or an agency or instrumentality of the U.S. government. The credit quality of typical asset-backed securities depends primarily on the credit quality of the underlying assets and the structural support (if any) provided to the securities.
Credit Default Swaps: A Portfolio may enter into credit default swaps, either as a buyer or a seller of the swap. A buyer of a credit default swap is generally obligated to pay the seller an upfront or a periodic stream of payments over the term of the contract until a credit event, such as a default, on a reference obligation has occurred. If a credit event occurs, the seller generally must pay the buyer the “par value” (full notional value) of the swap in exchange for an equal face amount of deliverable obligations of the reference entity described in the swap, or the seller may be required to deliver the related net cash amount if the swap is cash settled. As a seller of a credit default swap, a Portfolio would effectively add leverage to its portfolio because, in addition to its total net assets, the Portfolio would be subject to investment exposure on the full notional value of the swap. Credit default swaps are particularly subject to counterparty, credit, valuation, liquidity and leveraging risks, and the risk that the swap may not correlate with its reference obligation as expected. Certain standardized credit default swaps are subject to mandatory central clearing. Central clearing is expected to reduce counterparty credit risk and increase liquidity; however, there is no assurance that it will achieve that result, and in the meantime, central clearing and related requirements expose a Portfolio to different kinds of costs and risks. In addition, credit default swaps expose a Portfolio to the risk of improper valuation.
Currency: To the extent that a Portfolio invests directly or indirectly in foreign (non-U.S.) currencies or in securities denominated in, or that trade in, foreign (non-U.S.) currencies, it is subject to the risk that those foreign (non-U.S.) currencies will decline in value relative to the U.S. dollar or, in the case of hedging positions, that the U.S. dollar will decline in value relative to the currency being hedged by the Portfolio through foreign currency exchange transactions. Currency rates may fluctuate significantly over short periods of time. Currency rates may be affected by changes in market interest rates, intervention (or the failure to intervene) by the U.S. or foreign (non-U.S.) governments, central banks or supranational entities such as the International Monetary Fund, by the imposition of currency controls, or other political or economic developments in the U.S. or abroad.
56
MORE INFORMATION ABOUT THE PORTFOLIOS (continued)
Derivative Instruments: Derivative instruments are subject to a number of risks, including the risk of changes in the market price of the underlying asset, reference rate, or index, credit risk with respect to the counterparty, risk of loss due to changes in market interest rates, liquidity risk, valuation risk, and volatility risk. The amounts required to purchase certain derivatives may be small relative to the magnitude of exposure assumed by a Portfolio. Therefore, the purchase of certain derivatives may have an economic leveraging effect on a Portfolio and exaggerate any increase or decrease in the net asset value. Derivatives may not perform as expected, so a Portfolio may not realize the intended benefits. When used for hedging purposes, the change in value of a derivative may not correlate as expected with the asset, reference rate, or index being hedged. When used as an alternative or substitute for direct cash investment, the return provided by the derivative may not provide the same return as direct cash investment. Generally, derivatives are sophisticated financial instruments whose performance is derived, at least in part, from the performance of an underlying asset, reference rate, or index. Derivatives include, among other things, swap agreements, options, forward foreign currency exchange contracts, and futures. Certain derivatives in which a Portfolio may invest may be negotiated over-the-counter with a single counterparty and as a result are subject to credit risks related to the counterparty’s ability or willingness to perform its obligations; any deterioration in the counterparty’s creditworthiness could adversely affect the value of the derivative. In addition, derivatives and their underlying instruments may experience periods of illiquidity which could cause a Portfolio to hold a position it might otherwise sell, or to sell a position it otherwise might hold at an inopportune time or price. A manager might imperfectly judge the direction of the market. For instance, if a derivative is used as a hedge to offset investment risk in another security, the hedge might not correlate to the market’s movements and may have unexpected or undesired results such as a loss or a reduction in gains. The U.S. government has enacted legislation that provides for regulation of the derivatives market, including clearing, margin, reporting, and registration requirements. The European Union (and other jurisdictions outside of the European Union, including the United Kingdom) has implemented or is in the process of implementing similar requirements, which may affect a Portfolio when it enters into a derivatives transaction with a counterparty organized in that jurisdiction or otherwise subject to that jurisdiction’s derivatives regulations. Because these requirements continue to evolve, their ultimate impact remains unclear. Central clearing is expected to reduce counterparty credit risk and increase liquidity; however, there is no assurance that it will achieve that result, and, in the meantime, central clearing and related requirements expose a Portfolio to different kinds of costs and risks.
Dividend: Companies that issue dividend yielding equity securities are not required to continue to pay dividends on such securities. Therefore, there is a possibility that such companies could reduce or eliminate the payment of dividends in the future. As a result, a Portfolio’s ability to execute its investment strategy may be limited.
Environmental, Social, and Governance (Equity): The Sub-Adviser’s consideration of ESG factors in selecting investments for a Portfolio is based on information that is not standardized, some of which can be qualitative and subjective by nature. The Sub-Adviser’s assessment of ESG factors in respect of a company may rely on third-party data that might be incorrect or based on incomplete or inaccurate information. There is no minimum percentage of a Portfolio’s assets that will be invested in companies that the Sub-Adviser views favorably in light of ESG factors, and the Sub-Adviser may choose not to invest in companies that compare favorably to other companies on the basis of ESG factors. It is possible that a Portfolio will have less exposure to certain companies due to the Sub-Adviser’s assessment of ESG factors than other comparable mutual funds. There can be no assurance that an investment selected by the Sub-Adviser, which includes its consideration of ESG factors, when available, will provide more favorable investment performance than another potential investment, and such an investment may, in fact, underperform other potential investments.
Environmental, Social, and Governance (Fixed Income): The Sub-Adviser’s consideration of ESG factors in selecting investments for a Portfolio is based on information that is not standardized, some of which can be qualitative and subjective by nature. The Sub-Adviser’s assessment of ESG factors in respect of obligations of an issuer may rely on third-party data that might be incorrect or based on incomplete or inaccurate information. There is no minimum percentage of a Portfolio’s assets that will be invested in obligations of issuers that the Sub-Adviser views favorably in light of ESG factors, and the Sub-Adviser may choose not to invest in obligations of issuers that compare favorably to obligations of other issuers on the basis of ESG factors. It is possible that a Portfolio will have less exposure to obligations of certain issuers due to the Sub-Adviser’s assessment of ESG factors than other comparable mutual funds. There can be no assurance that an investment selected by the Sub-Adviser, which includes its consideration of ESG factors, when available, will provide more favorable investment performance than another potential investment, and such an investment may, in fact, underperform other potential investments.
57
MORE INFORMATION ABOUT THE PORTFOLIOS (continued)
Environmental, Social, and Governance (Quantitative): The Sub-Adviser’s consideration of ESG factors in selecting investments for a Portfolio depends on the operation of quantitative methods and models whose design reflects qualitative and subjective judgments of the Sub-Adviser, including reliance on, or incorporation of, data in respect of ESG factors that may rely on third-party data that might be incorrect or based on incomplete or inaccurate information. There is no minimum percentage of a Portfolio’s assets that will be invested in companies that the Sub-Adviser views favorably in light of ESG factors, and the Sub-Adviser may not invest in companies that compare favorably to other companies on the basis of ESG factors. It is possible that a Portfolio will have less exposure to certain companies due to the Sub-Adviser’s assessment of ESG factors than other comparable mutual funds. There can be no assurance that an investment selected by the Sub-Adviser, which includes its consideration of ESG factors, when available, will provide more favorable investment performance than another potential investment, and such an investment may, in fact, underperform other potential investments.
Floating Rate Loans: In the event a borrower fails to pay scheduled interest or principal payments on a floating rate loan (which can include certain bank loans), a Portfolio will experience a reduction in its income and a decline in the market value of such floating rate loan. If a floating rate loan is held by a Portfolio through another financial institution, or the Portfolio relies upon another financial institution to administer the loan, the receipt of scheduled interest or principal payments may be subject to the credit risk of such financial institution. Investors in floating rate loans may not be afforded the protections of the anti-fraud provisions of the Securities Act of 1933, as amended, and the Securities Exchange Act of 1934, as amended, because loans may not be considered “securities” under such laws. Additionally, the value of collateral, if any, securing a floating rate loan can decline or may be insufficient to meet the borrower’s obligations under the loan, and such collateral may be difficult to liquidate. No active trading market may exist for many floating rate loans and many floating rate loans are subject to restrictions on resale. Transactions in loans typically settle on a delayed basis and may take longer than 7 days to settle. As a result, a Portfolio may not receive the proceeds from a sale of a floating rate loan for a significant period of time. Delay in the receipts of settlement proceeds may impair the ability of a Portfolio to meet its redemption obligations, and may limit the ability of the Portfolio to repay debt, pay dividends, or to take advantage of new investment opportunities.
Foreign (Non-U.S.) Investments/Developing and Emerging Markets: To the extent a Portfolio invests in securities of issuers in markets outside the U.S., its share price may be more volatile than if it invested in securities of issuers in the U.S. market due to, among other things, the following factors: comparatively unstable political, social, and economic conditions and limited or ineffectual judicial systems; wars; comparatively small market sizes, making securities less liquid and securities prices more sensitive to the movements of large investors and more vulnerable to manipulation; governmental policies or actions, such as high taxes, restrictions on currency movements, replacement of currency, potential for default on sovereign debt, trade or diplomatic disputes, which may include the imposition of economic sanctions (or the threat of new or modified sanctions) or other measures by the U.S. or other governments and supranational organizations, creation of monopolies, and seizure of private property through confiscatory taxation and expropriation or nationalization of company assets; incomplete, outdated, or unreliable information about securities issuers due to less stringent market regulation and accounting, auditing and financial reporting standards and practices; comparatively undeveloped markets and weak banking and financial systems; market inefficiencies, such as higher transaction costs, and administrative difficulties, such as delays in processing transactions; and fluctuations in foreign currency exchange rates, which could reduce gains or widen losses.
Economic or other sanctions imposed on a foreign (non-U.S.) country or issuer by the U.S. or on the U.S. by a foreign (non-U.S.) country, could impair a Portfolio's ability to buy, sell, hold, receive, deliver, or otherwise transact in certain securities. In addition, foreign withholding or other taxes could reduce the income available for distribution to shareholders, and special U.S. tax considerations could apply to foreign (non-U.S.) investments. Depositary receipts are subject to risks of foreign (non-U.S.) investments and might not always track the price of the underlying foreign (non-U.S.) security. Markets and economies throughout the world are becoming increasingly interconnected, and conditions or events in one market, country or region may adversely impact investments or issuers in another market, country or region.
The United Kingdom (the “UK”) left the European Union (the “EU”) on January 31, 2020 (commonly known as “Brexit”). The UK and the EU entered into a Trade and Cooperation Agreement that sets out the agreement for certain parts of the future relationship from January 1, 2021, but uncertainty remains in certain areas regarding the future UK-EU relationship.
58
MORE INFORMATION ABOUT THE PORTFOLIOS (continued)
From January 1, 2021, EU laws ceased to apply in the UK, with many being assimilated into UK law. The UK government has enacted legislation to repeal, replace or make substantial amendments to these laws, with a view to them being replaced by purely domestic legislation. The process of revoking EU laws and replacing them with bespoke UK laws has already begun, creating unpredictable consequences for financial markets and investments. Brexit could significantly impact the UK, European, and global macroeconomic conditions, leading to prolonged political, legal, regulatory, tax, and economic uncertainty. This uncertainty may affect opportunities, pricing, availability, and cost of financing, regulation, values, or exit opportunities of companies or assets based in, doing business with, or having significant relationships in the UK or EU.
Additionally, certain European countries have developed increasingly strained relationships with the U.S., and if these relations were to worsen, they could adversely affect European issuers that rely on the U.S. for trade. Moreover, the national politics of countries in Europe have been unpredictable and subject to influence by disruptive political groups and ideologies, including for example, secessionist movements. The governments of European countries may be subject to change and such countries may experience social and political unrest.
Foreign (non-U.S.) investment risks may be greater in developing and emerging markets than in developed markets, for such reasons as social or political unrest, heavy economic dependence on international aid, agriculture or exports (particularly commodities), undeveloped or overburdened infrastructures and legal systems, vulnerability to natural disasters, significant and unpredictable government intervention in markets or the economy, volatile currency exchange rates, currency devaluations, runaway inflation, business practices that depart from norms for developed countries, and generally less developed or liquid markets. In certain emerging market countries, governments participate to a significant degree, through ownership or regulation, in their respective economies. Action by these governments could have a significant adverse effect on market prices of securities and payments of dividends. The Public Company Accounting Oversight Board, which regulates auditors of U.S. public companies, is unable to inspect audit work papers in certain foreign (non-U.S.) countries. Investors in foreign (non-U.S.) countries often have limited rights and few practical remedies to pursue shareholder claims, including class actions or fraud claims, and the ability of the SEC, the U.S. Department of Justice and other authorities to bring and enforce actions against foreign (non-U.S.) issuers or persons is limited. Settlement and asset custody practices for transactions in emerging markets may differ from those in developed markets. Such differences may include possible delays in settlement and certain settlement practices, such as delivery of securities prior to receipt of payment, which increases the likelihood of a “failed settlement.” Failed settlements can result in losses.
In addition, the Holding Foreign Companies Accountable Act (the “HFCAA”) could cause securities of a foreign (non-U.S.) company, including American Depositary Receipts, to be delisted from U.S. stock exchanges if the company does not allow the U.S. government to oversee the auditing of its financial information. Although the requirements of the HFCAA apply to securities of all foreign (non-U.S.) issuers, the SEC has thus far limited its enforcement efforts to securities of Chinese companies. If securities are delisted, a Portfolio’s ability to transact in such securities will be impaired, and the liquidity and market price of the securities may decline. A Portfolio may also need to seek other markets in which to transact in such securities, which could increase the Portfolio’s costs.
Growth Investing: Prices of growth-oriented stocks are more sensitive to investor perceptions of the issuer’s growth potential and may fall quickly and significantly if investors suspect that actual growth may be less than expected. There is a risk that funds that invest in growth-oriented stocks may underperform other funds that invest more broadly. Growth-oriented stocks tend to be more volatile than value-oriented stocks, and may underperform the market as a whole over any given time period. Growth-oriented stocks typically sell at relatively high valuations as compared to other types of securities. Securities of growth companies may be more volatile than other stocks because they usually invest a high portion of earnings in their business, and they may lack the dividends of value-oriented stocks that can cushion stock prices in a falling market. The market may not favor growth-oriented stocks or may not favor equities at all. In addition, earnings disappointments may lead to sharply falling prices because investors buy growth-oriented stocks in anticipation of superior earnings growth. Historically, growth-oriented stocks have been more volatile than value-oriented stocks.
High-Yield Securities: Lower-quality securities including securities that are or have fallen below investment grade (commonly referred to as “junk bonds”) have greater credit risk and liquidity risk than higher-quality (investment grade) securities, and their issuers' long-term ability to make payments is considered speculative. Prices of lower-quality bonds or other debt instruments are also more volatile, are more sensitive to negative news about the economy or the issuer, and have greater liquidity risk and price volatility.
59
MORE INFORMATION ABOUT THE PORTFOLIOS (continued)
Interest in Loans: The value and the income streams of interests in loans (including participation interests in lease financings and assignments in secured variable or floating rate loans) will decline if borrowers delay payments or fail to pay altogether. A significant rise in market interest rates could increase this risk. Although loans may be fully collateralized when purchased, such collateral may become illiquid or decline in value.
Interest Rate: A rise in market interest rates generally results in a fall in the value of bonds and other debt instruments; conversely, values generally rise as market interest rates fall. Interest rate risk is generally greater for debt instruments than floating-rate instruments. The higher the credit quality of the instrument, and the longer its maturity or duration, the more sensitive it is to changes in market interest rates. Duration is a measure of sensitivity of the price of a debt instrument to a change in interest rate. The U.S. Federal Reserve Board recently lowered interest rates following a period of consistent rate increases. Declining market interest rates increase the likelihood that debt instruments will be pre-paid. Rising market interest rates have unpredictable effects on the markets and may expose debt and related markets to heightened volatility. To the extent that a Portfolio invests in debt instruments, an increase in market interest rates may lead to increased redemptions and increased portfolio turnover, which could reduce liquidity for certain investments, adversely affect values, and increase costs. Increased redemptions may cause a Portfolio to liquidate portfolio positions when it may not be advantageous to do so and may lower returns. If dealer capacity in debt markets is insufficient for market conditions, it may further inhibit liquidity and increase volatility in debt markets. Fiscal, economic, monetary, or other governmental policies or measures have in the past, and may in the future, cause or exacerbate risks associated with interest rates, including changes in interest rates. Negative or very low interest rates could magnify the risks associated with changes in interest rates. In general, changing interest rates, including rates that fall below zero, could have unpredictable effects on markets and may expose debt and related markets to heightened volatility. In the case of inverse debt instruments, the interest rate paid by the debt instruments is a floating rate, which will generally decrease when the market rate of interest to which the inverse debt instruments are indexed increases and will increase when the market rate of interest to which the inverse debt instruments are indexed decreases. Changes to monetary policy by the U.S. Federal Reserve Board or other regulatory actions could expose debt and related markets to heightened volatility, interest rate sensitivity, and reduced liquidity, which may impact a Portfolio’s operations and return potential.
Investment Model: The Sub-Adviser’s proprietary investment model may not adequately take into account existing or unforeseen market factors or the interaction among such factors, including changes in how such factors interact, and there is no guarantee that the use of a proprietary investment model will result in effective investment decisions for a Portfolio. Proprietary investment models used by the Sub-Adviser to evaluate securities or securities markets are based on the Sub-Adviser’s understanding of the interplay of market factors and do not assure successful investment. The markets, or the price of individual securities, may be affected by factors not foreseen in the construction of the proprietary investment models. Volatility management techniques may not always be successful in reducing volatility, may not protect against market declines, and may limit a Portfolio’s participation in market gains, negatively impacting performance even during periods when the market is rising. During sudden or significant market rallies, such underperformance may be significant. Moreover, volatility management strategies may increase portfolio transaction costs, which may increase losses or reduce gains. A Portfolio’s volatility may not be lower than that of the Portfolio’s Index during all market cycles due to market factors. Portfolios that are actively managed, in whole or in part, according to a quantitative investment model (including models that utilize forms of artificial intelligence, such as machine learning) can perform differently from the market, based on the investment model and the factors used in the analysis, the weight placed on each factor, and changes from the factors’ historical trends. Technical issues in the design, development, implementation, application, and maintenance of the models (e.g., stale or inaccurate data, human error, programming or other software issues, coding errors, and technology failures) may create errors or limitations that might go undetected or are discovered only after the errors or limitations have negatively impacted performance.
Artificial intelligence may produce inaccurate, misleading or incomplete outputs that could lead to errors in the Sub-Adviser’s decision-making, portfolio management or other business activities, which could have a negative impact on the performance of a Portfolio and its investments. The Sub-Adviser's ability to detect, prevent or correct these errors may be limited by the AI models' lack of transparency regarding the bases for models' selection of securities. The data and other information utilized by artificial intelligence may be insufficient, incomplete, inaccurate or contain biased information. Data deficiencies could undermine predictions or analysis that artificial intelligence models produce. In addition, the Sub-Adviser’s ability to use, manage and aggregate data may be limited by the effectiveness of its policies, systems and practices that govern how data is acquired, validated, used, stored, protected, processed, analyzed and shared. Use of artificial intelligence may also result in allegations or claims against the Sub-Adviser, a Portfolio or its investments
60
MORE INFORMATION ABOUT THE PORTFOLIOS (continued)
related to violation of third-party intellectual property rights, unauthorized access to or use of proprietary information and failure to comply with open-source software requirements, which may adversely affect the Sub-Adviser’s ability to use the artificial intelligence model or adversely affect performance.
Although the Sub-Adviser may seek to oversee the operation of artificial intelligence models, the Sub-Adviser may have no or only a limited ability to examine the bases for an artificial intelligence model's selections and/or to detect errors or issues in the operation of the model, the underlying data , and model’s outputs, such in respect of the securities selected for potential investment, all of which may adversely affect Portfolio performance. As the use and availability of artificial intelligence has grown, the U.S. Congress and a number of U.S. federal and state agencies have been examining its use in a variety of industries, including financial services. These agencies have proposed or adopted a variety of rules and other guidance regarding the use of artificial intelligence. Artificial intelligence similarly faces an uncertain regulatory landscape in many foreign jurisdictions. Ongoing and future regulatory actions with respect to artificial intelligence generally or artificial intelligence’s use in any industry in particular may alter, perhaps to a materially adverse extent, the ability of the Sub-Adviser or a Portfolio to utilize artificial intelligence in the manner it has to-date, and may have an adverse impact on the ability of the Sub-Adviser or the Portfolio to continue to operate as intended.
Liquidity: If a security is illiquid, a Portfolio might be unable to sell the security at a time when the Portfolio’s manager might wish to sell, or at all. Further, the lack of an established secondary market may make it more difficult to value illiquid securities, exposing a Portfolio to the risk that the prices at which it sells illiquid securities will be less than the prices at which they were valued when held by a Portfolio, which could cause the Portfolio to lose money. The prices of illiquid securities may be more volatile than more liquid securities, and the risks associated with illiquid securities may be greater in times of financial stress. Certain securities that are liquid when purchased may later become illiquid, particularly in times of overall economic distress or due to geopolitical events such as sanctions, trading halts, or wars. In addition, markets or securities may become illiquid quickly.
Market: The market values of securities will fluctuate, sometimes sharply and unpredictably, based on overall economic conditions, governmental actions or intervention, market disruptions caused by trade disputes or other factors, political developments, and other factors. Prices of equity securities tend to rise and fall more dramatically than those of debt instruments. Additionally, legislative, regulatory or tax policies or developments may adversely impact the investment techniques available to a manager, add to costs, and impair the ability of a Portfolio to achieve its investment objectives.
Market Capitalization: Stocks fall into three broad market capitalization categories: large, mid, and small. Investing primarily in one category carries the risk that, due to current market conditions, that category may be out of favor with investors. If valuations of large-capitalization companies appear to be greatly out of proportion to the valuations of mid- or small-capitalization companies, investors may migrate to the stocks of mid- and small-capitalization companies causing a fund that invests in these companies to increase in value more rapidly than a fund that invests in large-capitalization companies. Investing in mid- and small-capitalization companies may be subject to special risks associated with narrower product lines, more limited financial resources, smaller management groups, more limited publicly available information, and a more limited trading market for their stocks as compared with large-capitalization companies. As a result, stocks of mid- and small-capitalization companies may be more volatile and may decline significantly in market downturns.
Market Disruption and Geopolitical: A Portfolio is subject to the risk that geopolitical events will disrupt securities markets and adversely affect global economies and markets. Due to the increasing interdependence among global economies and markets, conditions in one country, market, or region might adversely impact markets, issuers and/or foreign exchange rates in other countries, including the United States. Wars, terrorism, global health crises and pandemics, trade disputes, tariffs and other restrictions on trade or economic sanctions, rapid technological developments (such as artificial intelligence technologies), and other geopolitical events that have led, and may continue to lead, to increased market volatility and may have adverse short- or long-term effects on U.S. and global economies and markets, generally. For example, the COVID-19 pandemic resulted in significant market volatility, exchange suspensions and closures, declines in global financial markets, higher default rates, supply chain disruptions, and a substantial economic downturn in economies throughout the world. The economic impacts of COVID-19 have created a unique challenge for real estate markets. Many businesses have either partially or fully transitioned to a remote-working environment and this transition may negatively impact the occupancy rates of commercial real estate over time. Natural and environmental disasters and systemic market dislocations are also highly disruptive to economies and markets. Military action by Russia in Ukraine, the prolonged conflict between Hamas and Israel, the Iranian conflict that commenced in February 2026, and political upheaval in Venezuela have resulted, and may continue to result, in sanctions, market disruptions, declines in regional and global stock markets, unusual volatility in global commodity markets, and disruptions to energy production
61
MORE INFORMATION ABOUT THE PORTFOLIOS (continued)
or transportation, including through key shipping routes, any of which could adversely affect the value of a Portfolio's investments, including beyond a Portfolio' s direct exposure to issuers in the affected regions. The escalation or expansion of hostilities including the involvement of additional nations, could introduce further uncertainty and volatility in global energy, commodity, and financial markets. The extent and duration of these conflicts , related sanctions, and resulting market disruptions are impossible to predict but could be substantial. A number of U.S. domestic banks and foreign (non-U.S.) banks have experienced financial difficulties and, in some cases, failures. There can be no certainty that the actions taken by regulators to limit the effect of those financial difficulties and failures on other banks or other financial institutions or on the U.S. or foreign (non-U.S.) economies generally will be successful. It is possible that more banks or other financial institutions will experience financial difficulties or fail, which may affect adversely other U.S. or foreign (non-U.S.) financial institutions and economies. These events as well as other changes in foreign (non-U.S.) and domestic economic, social, and political conditions also could adversely affect individual issuers or related groups of issuers, securities markets, interest rates, credit ratings, inflation, investor sentiment, and other factors affecting the value of a Portfolio’s investments. Any of these occurrences could disrupt the operations of a Portfolio and of the Portfolio’s service providers. Recent technological developments in, and the increasingly widespread use of, artificial intelligence, including machine learning technology and generative artificial intelligence (“AI”), may pose risks to a Portfolio. For instance, the economy may be significantly impacted by the advanced development and increased regulation of AI. As AI is used more widely, the profitability and growth of Portfolio holdings may be impacted, which could significantly impact the overall performance of a Portfolio. The legal and regulatory frameworks within which AI operates continue to rapidly evolve, and it is not possible to predict the full extent of current or future risks related thereto.
Mid-Capitalization Company: Investments in mid-capitalization companies may involve greater risk than is customarily associated with larger, more established companies due to the greater business risks of a limited operating history, smaller size, limited markets, and financial resources, narrow product lines, less management depth, and more reliance on key personnel. Consequently, the securities of mid-capitalization companies may have limited market stability and may be subject to more abrupt or erratic market movements than securities of larger, more established growth companies or the market averages in general.
Money Market Regulatory: Changes in government regulations may adversely affect the value of a security held by a Portfolio. The SEC has adopted amendments to money market fund regulation that permit the Portfolio to impose discretionary liquidity fees, increase the Portfolio’s daily and weekly liquid asset minimum requirements and eliminate the ability of the Portfolio to temporarily suspend redemptions due to declines in the Portfolio's weekly liquid assets, among other changes. As of the date of this Prospectus, the Board has elected not to subject the Portfolio to such discretionary liquidity fees. These changes may result in reduced yields for money market funds, including the Portfolio, which may invest in other money market funds. The SEC or other regulators may adopt additional money market fund reforms, which may impact the structure and operation or performance of the Portfolio.
Mortgage- and/or Asset-Backed Securities: Defaults on, or low credit quality or liquidity of, the underlying assets of the asset-backed (including mortgage-backed) securities may impair the value of these securities and result in losses. There may be limitations on the enforceability of any security interest or collateral granted with respect to those underlying assets, and the value of collateral may not satisfy the obligation upon default. These securities also present a higher degree of prepayment and extension risk and interest rate risk than do other types of debt instruments. Small movements in interest rates (both increases and decreases) may quickly and significantly reduce the value of certain asset-backed securities. The value of longer-term securities generally changes more in response to changes in market interest rates than shorter-term securities.
These securities may be affected significantly by government regulation, market interest rates, market perception of the creditworthiness of an issuer servicer, and loan-to-value ratio of the underlying assets. During an economic downturn, the mortgages, commercial or consumer loans, trade or credit card receivables, installment purchase obligations, leases, or other debt obligations underlying an asset-backed security may experience an increase in defaults as borrowers experience difficulties in repaying their loans which may cause the valuation of such securities to be more volatile and may reduce the value of such securities. These risks are particularly heightened for investments in asset-backed securities that contain sub-prime loans, which are loans made to borrowers with weakened credit histories and often have higher default rates. In addition, certain types of real estate may be adversely affected by changing usage trends, such as office buildings as a result of work-from-home practices and commercial facilities as a result of an increase in online shopping, which could in turn result in defaults and declines in value of mortgage-backed securities secured by such properties.
62
MORE INFORMATION ABOUT THE PORTFOLIOS (continued)
Municipal Obligations: The municipal securities market is volatile and can be affected significantly by adverse tax, legislative, or political changes and the financial condition of the issuers of municipal securities. Among other risks, investments in municipal securities are subject to the risk that an issuer may delay payment, restructure its debt, or refuse to pay interest or repay principal on its debt. Municipal revenue obligations may be backed by the revenues generated from a specific project or facility and include industrial development bonds and private activity bonds. Private activity and industrial development bonds are dependent on the ability of the facility’s user to meet its financial obligations and the value of any real or personal property pledged as security for such payment. Many municipal securities are issued to finance projects relating to education, health care, transportation, and utilities. Conditions in those sectors may affect the overall municipal securities market. In addition, municipal securities backed by current or anticipated revenues from a specific project or specific asset may be adversely affected by the discontinuance of the taxation supporting the project or asset or the inability to collect revenues from the project or asset. If an issuer of a municipal security does not comply with applicable tax requirements for tax-exempt status, interest from the security may become taxable, and the security could decline in value.
Option Writing: When a Portfolio writes a covered call option on a security, it assumes the risk that it must sell the underlying security at an exercise price that may be lower than the market price of the security, and it gives up the opportunity to profit from a price increase in the underlying security above the exercise price. In addition, a Portfolio continues to bear the risk of a decline in the value of the underlying security.
When a Portfolio writes an index call option, it assumes the risk that it must pay the purchaser of the option a cash payment equal to any appreciation in the value of the index over the strike price of the call option during the option’s term. While the amount of a Portfolio’s potential loss is offset by the premium received when the option was written, the amount of the loss is theoretically unlimited. When writing a covered call option, a Portfolio may be unable to sell the underlying security during the term of the option, including to take advantage of new investment opportunities. If a covered call option written by a Portfolio expires unexercised, the Portfolio will realize a capital gain equal to the premium received at the time the option was written; however, in return for the premium received, a Portfolio gives up the opportunity to profit from any price increase in the underlying security above the exercise price during the term of the option, and, as long as its obligation under such call option continues, has retained the risk of loss should the price of the underlying security decline.
There can be no assurances that the option strategy will be effective and that a Portfolio will be able to exercise a transaction at a desirable price and time.
Other Investment Companies: The main risk of investing in other investment companies, including ETFs, is the risk that the value of an investment company’s underlying investments might decrease. Shares of investment companies that are listed on an exchange may trade at a discount or premium from their net asset value. You will pay a proportionate share of the expenses of those other investment companies (including management fees, administration fees, and custodial fees) in addition to a Portfolio’s expenses. The investment policies of the other investment companies may not be the same as those of a Portfolio; as a result, an investment in the other investment companies may be subject to additional or different risks than those to which a Portfolio is typically subject.
ETFs are exchange-traded investment companies that are, in many cases, designed to provide investment results corresponding to an index. Additional risks of investments in ETFs include that: (i) an active trading market for an ETF’s shares may not develop or be maintained; or (ii) trading may be halted if the listing exchanges’ officials deem such action appropriate, the shares are delisted from an exchange, or the activation of market-wide “circuit breakers” (which are tied to large decreases in stock prices) halts trading of an ETF’s shares. In addition, shares of ETFs may trade at a premium or discount to net asset value and are subject to secondary market trading risks. Secondary markets may be subject to irregular trading activity, wide bid/ask spreads, and extended trade settlement periods in times of market stress because market makers and authorized participants may step away from making a market in an ETF’s shares, which could cause a material decline in the ETF’s net asset value.
Other Investment Companies (Money Market Funds): A money market fund may only invest in other investment companies that qualify as money market funds under Rule 2a-7 of the 1940 Act, and there is a risk that such money market funds may not comply with Rule 2a-7. You will pay a proportionate share of the expenses of those other investment companies (including management fees, administration fees, and custodial fees) in addition to the expenses of a
63
MORE INFORMATION ABOUT THE PORTFOLIOS (continued)
Portfolio. The investment policies of the other investment companies may not be the same as those of a Portfolio; as a result, an investment in the other investment companies may be subject to additional or different risks than those to which a Portfolio is typically subject.
Preferred Stocks: Preferred stocks represent an equity interest in a company that generally entitles the holder to receive, in preference to the holders of other securities such as common stocks, dividends, and a fixed share of the proceeds resulting from a liquidation of the company. Some preferred stocks also entitle their holders to receive additional liquidation proceeds on the same basis as holders of a company’s common stock, and thus also represent an ownership interest in that company.
Preferred stock may pay fixed or adjustable rates of return. Preferred stock is subject to issuer-specific and market risks applicable generally to equity securities. In addition, a company’s preferred stock generally pays dividends only after the company makes required payments to holders of its bonds and other debt. For this reason, the value of preferred stock will usually react more strongly than bonds and other debt to actual or perceived changes in the company’s financial condition or prospects.
Preferred stock of smaller companies may be more vulnerable to adverse developments than preferred stock of larger companies.
Preferred stock includes certain hybrid securities and other types of preferred stock with different features from those of traditional preferred stock described above. Preferred stocks that are hybrid securities possess various features of both debt and traditional preferred stock and as such, they may constitute senior debt, junior debt, or preferred shares in an issuer’s capital structure. Therefore, unlike traditional preferred stock, hybrid securities may not be subordinate to a company’s debt instruments.
Preferred stock may include features permitting or requiring the issuer to defer or omit distributions. Among other things, such deferral or omission may result in adverse tax consequences for a Portfolio. Preferred stock generally does not have voting rights with respect to the issuer unless dividends have been in arrears for certain specified periods of time. Preferred stock may be less liquid than other securities. As a result, preferred stock is subject to the risk that they may be unable to be sold at the time desired by a Portfolio or at prices approximating the values at which the Portfolio is carrying the stock on its books. In addition, over longer periods of time, certain types of preferred stock may become more scarce or less liquid as a result of legislative changes. Such events may negatively affect the prices of stock held by a Portfolio, which may result in losses to the Portfolio. In addition, an issuer of preferred stock may redeem the stock prior to a specified date, which may occur due to changes in tax or securities laws or corporate actions. A redemption by the issuer may negatively impact the return of the preferred stock.
Prepayment and Extension: Many types of debt instruments are subject to prepayment and extension risk. Prepayment risk is the risk that the issuer of a debt instrument will pay back the principal earlier than expected. This risk is heightened in a falling market interest rate environment. Prepayment may expose a Portfolio to a lower rate of return upon reinvestment of principal. Also, if a debt instrument subject to prepayment has been purchased at a premium, the value of the premium would be lost in the event of prepayment. Extension risk is the risk that the issuer of a debt instrument will pay back the principal later than expected. This risk is heightened in a rising market interest rate environment. This may negatively affect performance, as the value of the debt instrument decreases when principal payments are made later than expected. Additionally, a Portfolio may be prevented from investing proceeds it would have received at a given time at the higher prevailing interest rates.
Real Estate Companies and Real Estate Investment Trusts: Investing in real estate companies and REITs may subject a Portfolio to risks similar to those associated with the direct ownership of real estate, including losses from casualty or condemnation, changes in local and general economic conditions, supply and demand, market interest rates, zoning laws, regulatory limitations on rents, property taxes, overbuilding, high foreclosure rates, and operating expenses in addition to terrorist attacks, wars, or other acts that destroy real property. Some REITs may invest in a limited number of properties, in a narrow geographic area or in a single property type, which increases the risk that a Portfolio could be unfavorably affected by the poor performance of a single investment or investment type. These companies are also sensitive to factors such as changes in real estate values and property taxes, market interest rates, cash flow of underlying real estate assets, supply and demand, and the management skill and creditworthiness of the issuer. Borrowers could default on or sell investments the REIT holds, which could reduce the cash flow needed to make distributions to investors. In addition, REITs may also be affected by tax and regulatory requirements in that a REIT
64
MORE INFORMATION ABOUT THE PORTFOLIOS (continued)
may not qualify for favorable tax treatment or regulatory exemptions. Investments in REITs are affected by the management skill of the REIT’s sponsor. A Portfolio will indirectly bear its proportionate share of expenses, including management fees, paid by each REIT in which it invests.
Repurchase Agreements: In the event that the other party to a repurchase agreement defaults on its obligations, a Portfolio would generally seek to sell the underlying security serving as collateral for the repurchase agreement. However, the value of collateral may be insufficient to satisfy the counterparty's obligation and/or a Portfolio may encounter delay and incur costs before being able to sell the security. Such a delay may involve loss of interest or a decline in price of the security, which could result in a loss. In addition, if a Portfolio is characterized by a court as an unsecured creditor, it would be at risk of losing some or all of the principal and interest involved in the transaction.
Securities Lending: Securities lending involves two primary risks: “ investment risk ” and “ borrower default risk. ” When lending securities, a Portfolio will receive cash or U.S. government securities as collateral. Investment risk is the risk that a Portfolio will lose money from the investment of the cash collateral received from the borrower. Borrower default risk is the risk that a Portfolio will lose money due to the failure of a borrower to return a borrowed security. Securities lending may result in leverage. The use of leverage may exaggerate any increase or decrease in the net asset value, causing a Portfolio to be more volatile. The use of leverage may increase expenses and increase the impact of a Portfolio’s other risks.
A Portfolio seeks to minimize investment risk by limiting the investment of cash collateral to high-quality instruments of short maturity. In the event of a borrower default, a Portfolio will be protected to the extent the Portfolio is able to exercise its rights in the collateral promptly and the value of such collateral is sufficient to purchase replacement securities. A Portfolio is protected by its securities lending agent, which has agreed to indemnify the Portfolio from losses resulting from borrower default.
Small-Capitalization Company: Investments in small-capitalization companies may involve greater risk than is customarily associated with larger, more established companies due to the greater business risks of a limited operating history, small size, limited markets and financial resources, narrow product lines, less management depth and more reliance on key personnel. The securities of small-capitalization companies are subject to liquidity risk as they are often traded over-the-counter and may not be traded in volumes typically seen on national securities exchanges.
U.S. Government Securities and Obligations: U.S. government securities are obligations of, or guaranteed by, the U.S. government, its agencies, or government-sponsored enterprises. U.S. government securities are subject to market risk and interest rate risk, and may be subject to varying degrees of credit risk. Some U.S. government securities are backed by the full faith and credit of the U.S. government and are guaranteed as to both principal and interest by the U.S. Treasury. These include direct obligations of the U.S. Treasury such as U.S. Treasury notes, bills, and bonds, as well as indirect obligations including certain securities of the Government National Mortgage Association, the Small Business Administration, and the Farmers Home Administration, among others. Other U.S. government securities are not direct obligations of the U.S. Treasury, but rather are backed by the ability to borrow directly from the U.S. Treasury, including certain securities of the Federal Financing Bank, the Federal Home Loan Bank, and the U.S. Postal Service. Other U.S. government securities are backed solely by the credit of the agency or instrumentality itself and are neither guaranteed nor insured by the U.S. government and, therefore, involve greater risk. These include securities issued by the Federal Home Loan Bank, the Federal Home Loan Mortgage Corporation, and the Federal Farm Credit Bank, among others. Consequently, the investor must look principally to the agency issuing or guaranteeing the obligation for ultimate repayment. No assurance can be given that the U.S. government would provide financial support to such agencies if it is not obligated to do so by law. The impact of greater governmental scrutiny into the operations of certain agencies and government-sponsored enterprises may adversely affect the value of securities issued by these entities. U.S. government securities may be subject to price declines due to changing market interest rates. From time to time, uncertainty regarding the status of negotiations in the U.S. government to increase the statutory debt ceiling could increase the risk that the U.S. government may default on payments on certain U.S. government securities, cause the credit rating of the U.S. government to be downgraded, increase volatility in the stock and bond markets, result in higher interest rates, reduce prices of U.S. Treasury securities, and/or increase the costs of various kinds of debt. If a U.S. government-sponsored entity is negatively impacted by legislative or regulatory action (or lack thereof), is unable to meet its obligations, or its creditworthiness declines, the performance of a Portfolio that holds securities of the entity will be adversely impacted. There is no assurance that the U.S. Congress will act to raise the debt ceiling; a failure to do so could cause market turmoil and substantial investment risks that cannot now be fully predicted.
65
MORE INFORMATION ABOUT THE PORTFOLIOS (continued)
Value Investing: Securities that appear to be undervalued may never appreciate to the extent expected. Further, because the prices of value-oriented securities tend to correlate more closely with economic cycles than growth-oriented securities, they generally are more sensitive to changing economic conditions, such as changes in market interest rates, corporate earnings and industrial production. The manager may be wrong in its assessment of a company’s value and the securities a Portfolio holds may not reach their full values. Risks associated with value investing include that a security that is perceived by the manager to be undervalued may actually be appropriately priced and, thus, may not appreciate and provide anticipated capital growth. The market may not favor value-oriented securities and may not favor equities at all. During those periods, a Portfolio’s relative performance may suffer. There is a risk that funds that invest in value-oriented securities may underperform other funds that invest more broadly.
When-Issued, Delayed Delivery, and Forward Commitment Transactions: When-issued, delayed delivery, and forward commitment transactions involve the risk that the security a Portfolio buys will lose value prior to its delivery. These transactions may result in leverage. The use of leverage may exaggerate any increase or decrease in the net asset value, causing a Portfolio to be more volatile. The use of leverage may increase expenses and increase the impact of a Portfolio’s other risks. There also is the risk that the security will not be issued or that the other party will not meet its obligation. If this occurs, a Portfolio loses both the investment opportunity for the assets it set aside to pay for the security and any gain in the security’s price.
Further Information About Principal Risks
The following provides additional information about certain aspects of the principal risks described above.
Counterparty: The entity with which a Portfolio conducts portfolio-related business (such as trading or securities lending), or that underwrites, distributes or guarantees investments or agreements that the Portfolio owns or is otherwise exposed to, may refuse or may become unable to honor its obligations under the terms of a transaction or agreement. As a result, a Portfolio may sustain losses and be less likely to achieve its investment objective. A Portfolio may obtain no or limited recovery in a bankruptcy or other reorganizational proceedings, and any recovery may be significantly delayed. Transactions that a Portfolio enters into may involve counterparties in the financials sector and, as a result, events affecting the financials sector may cause a Portfolio’s NAV to fluctuate. These risks may be greater when engaging in over-the-counter transactions or when a Portfolio conducts business with a limited number of counterparties.
Duration: One measure of risk for debt instruments is duration. Duration measures the sensitivity of a bond’s price to market interest rate movements and is one of the tools used by a portfolio manager in selecting debt instruments. Duration measures the average life of a bond on a present value basis by incorporating into one measure a bond’s yield, coupons, final maturity and call features. As a point of reference, the duration of a non-callable 7% coupon bond with a remaining maturity of 5 years is approximately 4.5 years and the duration of a non-callable 7% coupon bond with a remaining maturity of 10 years is approximately 8 years. Material changes in market interest rates may impact the duration calculation. For example, the price of a bond with an average duration of 5 years would be expected to fall approximately 5% if market interest rates rose by 1%. Conversely, the price of a bond with an average duration of 5 years would be expected to rise approximately 5% if market interest rates dropped by 1%.
Inflation: Inflation risk is the risk that the value of assets or income from a Portfolio's investments will be worth less in the future as inflation decreases the value of payments at future dates. As inflation increases, the value of a Portfolio could decline. Inflation rates may change frequently and drastically as a result of various factors and a Portfolio's investments may not keep pace with inflation, which may result in losses to the Portfolio’s investors or adversely affect the value of shareholders' investments in the Portfolio.
Investment by Other Funds: Certain funds-of-funds, including some Voya funds, may invest in a Portfolio. If investments by these other funds result in large inflows or outflows of cash from a Portfolio, a Portfolio could be required to sell securities or invest cash at times, or in ways, that could, among other things, negatively impact its performance, speed the realization of capital gains, increase its portfolio turnover, affect the liquidity of its portfolio, or increase transaction costs. The manager will monitor transactions by such funds-of-funds and will attempt to minimize any adverse effects these transactions may have on a Portfolio. If shares of a Portfolio are purchased by another fund in reliance on Section 12(d)(1)(G) of the 1940 Act or Rule 12d1-4 thereunder and the Portfolio purchases shares of other investment companies in reliance on Rule 12d1-4, the Portfolio will not be able to make new investments in other funds, including private funds, if, as a result of such investment, more than 10% of the Portfolio’s assets would be invested in other funds or private funds, subject to certain exceptions.
66
MORE INFORMATION ABOUT THE PORTFOLIOS (continued)
Leverage: Certain transactions and investment strategies may give rise to leverage. Such transactions and investment strategies include, but are not limited to: borrowing, dollar rolls, reverse repurchase agreements, loans of portfolio securities, short sales, and the use of when-issued, delayed delivery or forward commitment transactions. The use of certain derivatives may also increase leveraging risk and, in some cases, adverse changes in the value or level of a derivative’s underlying asset, rate, or index may result in potentially unlimited losses. The use of leverage may exaggerate any increase or decrease in the net asset value, causing a Portfolio to be more volatile than if the Portfolio had not been leveraged. The use of leverage may increase expenses and increase the impact of a Portfolio’s other risks. The use of leverage may cause a Portfolio to liquidate portfolio positions when it may not be advantageous to do so to satisfy its obligations or to meet regulatory requirements resulting in increased volatility of returns. There can be no guarantee that a leveraging strategy will be successful.
Manager: A Portfolio is subject to manager risk because it is an actively managed investment portfolio. The Investment Adviser, the Sub-Adviser, or each individual portfolio manager will make judgments and apply investment techniques and risk analyses in making investment decisions, but there can be no guarantee that these decisions will produce the desired results. A Portfolio’s portfolio may fail to produce the intended results, and a Portfolio’s portfolio may underperform other comparable funds because of portfolio management decisions related to, among other things, the selection of investments, portfolio construction, risk assessments, and/or the outlook on market trends and opportunities. Many managers of equity funds employ styles that are characterized as “value” or “growth.” However, these terms can have different applications by different managers. One manager’s value approach may be different from that of another, and one manager’s growth approach may be different from that of another. For example, some value managers employ a style in which they seek to identify companies that they believe are valued at a more substantial or “deeper discount” to a company’s net worth than other value managers. Therefore, some funds that are characterized as growth or value can have greater volatility than other funds managed by other managers in a growth or value style.
Operational: A Portfolio, its service providers, and other market participants increasingly depend on complex information technology and communications systems to conduct business functions. These systems are subject to a number of different threats, including operational and information security risks that could adversely affect a Portfolio and its shareholders, despite the efforts of a Portfolio and its service providers to adopt technologies, processes, and practices intended to mitigate these risks. The use of artificial intelligence (“AI”) and machine learning could exacerbate operational and information security risks or result in cybersecurity incidents that implicate personal data. Cyber-attacks, disruptions, or failures that affect a Portfolio’s service providers, counterparties, market participants, or issuers of securities held by a Portfolio may adversely affect a Portfolio and its shareholders, including by causing losses or impairing the Portfolio’s operations. Information relating to a Portfolio’s investments is delivered electronically, which can give rise to a number of risks, including, but not limited to, the risks that such communications may not be secure and may contain computer viruses or other defects, may not be accurately replicated on other systems, or may be intercepted, deleted or interfered with, without the knowledge of the sender or the intended recipient.
67
PORTFOLIO HOLDINGS INFORMATION
A description of each Portfolio's policies and procedures regarding the release of portfolio holdings information is available in the SAI. Portfolio holdings information can be reviewed online at https://individuals.voya.com/product/variable-portfolio/prospectuses-reports.
68
MANAGEMENT OF THE PORTFOLIOS
Investment Adviser
Voya Investments, an Arizona limited liability company, is registered with the SEC as an investment adviser. Voya Investments serves as the investment adviser to, and has overall responsibility for the management of, each Portfolio. Voya Investments oversees all investment advisory and portfolio management services and assists in managing and supervising all aspects of the general day-to-day business activities and operations of each Portfolio, including, but not limited to, the following: custodial, transfer agency, dividend disbursing, accounting, auditing, compliance, and related services.
Voya Investments began business as an investment adviser in 1994 and currently serves as investment adviser to certain registered investment companies, consisting of open- and closed-end registered investment companies and collateralized loan obligations. Voya Investments is an indirect subsidiary of Voya Financial, Inc. Voya Financial, Inc. is a U.S.-based financial institution whose subsidiaries operate in the retirement, investment, and insurance industries.
Voya Investments' principal business address is 7337 East Doubletree Ranch Road, Suite 100, Scottsdale, Arizona 85258.
Management Fee
The Investment Adviser receives an annual fee for its services to each Portfolio. The fee is payable in monthly installments based on the average daily net assets of each Portfolio.
The Investment Adviser is responsible for all of its own costs, including costs of the personnel required to carry out its duties.
The following table shows the aggregate annual management fee paid by each Portfolio for the most recent fiscal year as a percentage of the Portfolio’s average daily net assets.
|
|
Management Fees |
|
Voya Global High Dividend Low Volatility Portfolio |
0.56% |
|
Voya Government Money Market Portfolio |
0.35% |
|
Voya Growth and Income Portfolio |
0.60% |
|
Voya Index Plus LargeCap Portfolio |
0.45% |
|
Voya Index Plus MidCap Portfolio |
0.50% |
|
Voya Index Plus SmallCap Portfolio |
0.50% |
|
Voya Intermediate Bond Portfolio |
0.50% |
|
Voya Small Company Portfolio |
0.75% |
For information regarding the basis for the Board’s approval of the investment advisory and investment sub-advisory relationships, please refer to the Portfolios' annual financial statements and other information filed on Form N-CSR which covers the one-year period ended December 31, 2025.
Expense Limitation Agreement - Voya Government Money Market Portfolio
The distributor and the Investment Adviser have contractually agreed to waive a portion of their management fees and distribution and/or shareholder servicing fees, as applicable, and to reimburse certain expenses of the Portfolio to the extent necessary to assist the Portfolio in maintaining a net yield of not less than zero. There is no guarantee that the Portfolio will maintain such a yield. When distribution fees are reduced, dealer compensation may be reduced to the same extent. Management fees waived and expenses reimbursed by the Investment Adviser are subject to possible recoupment by the Investment Adviser within three years. In no event will the amount of the recoupment on any day exceed 20% of the yield (net of all expenses) of the Portfolio on that day. Distribution and servicing fees waived are not subject to recoupment. This arrangement will continue through at least May 1, 2027.
Sub-Adviser
The Investment Adviser has engaged a sub-adviser to provide the day-to-day management of each Portfolio's portfolio. The Sub-Adviser is an affiliate of the Investment Adviser.
The Investment Adviser acts as a “manager-of-managers” for each Portfolio. The Investment Adviser has ultimate responsibility, subject to the oversight of each Portfolio’s Board, to oversee any sub-advisers and to recommend the hiring, termination, or replacement of sub-advisers. Each Portfolio and the Investment Adviser have received exemptive relief from the SEC which permits the Investment Adviser, with the approval of the Board but without obtaining shareholder
69
MANAGEMENT OF THE PORTFOLIOS (continued)
approval, to enter into or materially amend a sub-advisory agreement with sub-advisers that are not affiliated with the Investment Adviser (“non-affiliated sub-advisers”) as well as sub-advisers that are indirect or direct, wholly-owned subsidiaries of the Investment Adviser or of another company that indirectly or directly wholly owns the Investment Adviser (“wholly-owned sub-advisers”).
Consistent with the “manager-of-managers” structure, the Investment Adviser delegates to the Sub-Adviser(s) of each Portfolio the responsibility for day-to-day investment management, subject to the Investment Adviser’s oversight. The Investment Adviser is responsible for, among other things, monitoring the investment program and performance of the Sub-Adviser(s). Pursuant to the exemptive relief, the Investment Adviser, with the approval of the Board, has the discretion to terminate any sub-adviser (including terminating a non-affiliated sub-adviser and replacing it with a wholly-owned sub-adviser), and to allocate and reallocate a Portfolio’s assets among other sub-advisers.
The Investment Adviser’s selection of sub-advisers presents conflicts of interest. The Investment Adviser will have an economic incentive to select sub-advisers that charge the lowest sub-advisory fees, to select sub-advisers affiliated with it, or to manage a portion of a Portfolio itself. The Investment Adviser may retain an affiliated sub-adviser (or delay terminating an affiliated sub-adviser) in order to help that sub-adviser achieve or maintain scale in an investment strategy or increase its assets under management. The Investment Adviser may select or retain an affiliated sub-adviser even in cases where another potential sub-adviser or an existing sub-adviser might charge a lower fee or have more favorable historical investment performance.
In the event that the Investment Adviser exercises its discretion to replace a sub-adviser or appoint a new sub-adviser, a Portfolio will provide shareholders with information about the new sub-adviser and the new sub-advisory agreement within 90 days. The replacement of an existing sub-adviser or appointment of a new sub-adviser may be accompanied by a change to a Portfolio’s name and/or investment strategies.
A sub-advisory agreement can be terminated by the Investment Adviser, a Portfolio’s Board, or the Sub-Adviser, provided that the conditions of such termination, as set forth in the agreement, are met. In addition, a sub-advisory agreement may be terminated by a Portfolio’s shareholders. In the event a sub-advisory agreement is terminated, the Sub-Adviser(s) may be replaced, subject to any regulatory requirements, or the Investment Adviser may assume day-to-day investment management of a Portfolio.
The “manager-of-managers” structure and reliance on the exemptive relief has been approved by each Portfolio’s shareholders.
Voya Investment Management Co. LLC
Voya Investment Management Co. LLC (“Voya IM” or the “Sub-Adviser”), a Delaware limited liability company, was founded in 1972 and is registered with the SEC as an investment adviser. Voya IM has acted as an investment adviser or sub-adviser to mutual funds since 1994 and has managed institutional accounts since 1972. Voya IM is an indirect subsidiary of Voya Financial, Inc. and is an affiliate of the Investment Adviser. Voya IM's principal business address is 200 Park Avenue, New York, New York 10166.
For Voya Small Company Portfolio, Voya IM has entered into a sub-sub-advisory agreement whereby Voya IM may delegate certain of its investment advisory services to Voya Investment Management (UK) Limited (“Voya UK” or, together with Voya IM, the “Sub-Adviser”) as sub-sub-adviser to the Portfolio. Voya UK is an affiliate of Voya IM and a subsidiary of Voya Holdings, Inc., which is an indirect parent of Voya IM. Voya UK’s principal business address is in the United Kingdom.
Portfolio Management
The following individuals are jointly and primarily responsible for the day-to-day management of the noted Portfolios.
70
MANAGEMENT OF THE PORTFOLIOS (continued)
|
Portfolio Manager |
Investment
Adviser or
Sub-Adviser |
Portfolio |
Professional Experience |
|
Sean Banai, CFA |
Voya IM |
Voya Intermediate Bond Portfolio |
Mr. Banai, Portfolio Manager and head of portfolio
management for the fixed-income platform, joined
Voya IM in 1999. Previously, he was a senior
portfolio manager and head of quantitative research
for proprietary fixed-income. Prior to that, Mr. Banai
was a partner in a private sector company. |
|
Sanne V. De Boer, PhD,
CFA |
Voya UK |
Voya Small Company Portfolio |
Mr. De Boer, Portfolio Manager, managing director
and head of systematic equities at Voya UK, joined
Voya UK in 2019 and is responsible for overseeing
the firm’s quantitative equity research agenda.
Previously at Voya IM (2019-2023), he was director
of quantitative equity. Prior to joining Voya IM, he
was a senior research analyst for quantitative
strategies for Invesco (2017-2019). Prior to that, he
was a research analyst for global quantitative
equities at QS and before that he was with ING
Investment Management, Voya’s predecessor firm. |
|
James Dorment, CFA |
Voya IM |
Voya Growth and Income Portfolio |
Mr. Dorment, Portfolio Manager, serves on Voya IM’s
global equity team for the large-cap value
strategies. Mr. Dorment joined Voya IM as an analyst
covering the consumer sectors in 2008. |
|
Steve Gao, PhD, CFA, FRM |
Voya IM |
Voya Global High Dividend Low
Volatility Portfolio
Voya Index Plus LargeCap Portfolio
Voya Index Plus MidCap Portfolio
Voya Index Plus SmallCap Portfolio |
Mr. Gao, Portfolio Manager, vice president and
quantitative analyst on the quantitative equity team
at Voya Investment Management. Prior to joining
Voya, Mr. Gao was a research analyst on the US
equity strategy team at Barclays, with a focus on
quantitative analysis of US equities. Prior to that, Mr.
Gao worked at Macquarie as a quantitative equity
researcher. While at Macquarie, Mr. Gao conducted
in-depth factor related research for asset
managers. |
|
David Goodson |
Voya IM |
Voya Intermediate Bond Portfolio |
Mr. Goodson, Senior Portfolio Manager for
mortgage-backed securities and asset-backed
securities strategies, is head of securitized
fixed-income at Voya IM. Prior to joining Voya IM in
2002, he was a principal at an independent
investment bank focused on asset-backed
commercial paper transactions. Mr. Goodson began
his career as a vice-president in Wachovia
Securities’ asset-backed finance group, marketing
and executing securitizations for the bank’s
corporate clients. |
|
Andrew Higley, CFA |
Voya IM |
Voya Government Money Market
Portfolio |
Mr. Higley, CFA, Portfolio Manager, is a senior vice
president at Voya IM. He serves as Head of
Derivatives & Liquid Trading and is responsible for
oversight of derivatives portfolio management and
liquid trading activities supporting fixed income
investment strategies. Prior to joining Voya IM in
2006, Mr. Higley was a senior trader at the Federal
Home Loan Bank of Atlanta. |
71
MANAGEMENT OF THE PORTFOLIOS (continued)
|
Portfolio Manager |
Investment
Adviser or
Sub-Adviser |
Portfolio |
Professional Experience |
|
Rajen Jadav, CFA |
Voya IM |
Voya Intermediate Bond Portfolio |
Mr. Jadav, Portfolio Manager, joined Voya IM in
2019. Prior to joining Voya IM, he was a senior
product specialist at Allianz Global Investors where
he was responsible for covering and supporting
sales and distribution of the global fixed income
team’s product offering in North America. Prior to
that, Mr. Jadav was a portfolio manager at
AllianceBernstein where he held various positions
managing US multi-sector, US TIPS, stable value,
global multi-sector and municipal money market
portfolios. |
|
Don Schatz |
Voya IM |
Voya Government Money Market
Portfolio |
Mr. Schatz, Portfolio Manager, is a vice president at
Voya IM. Mr. Schatz assists with money market
trading and portfolio management. Prior to joining
Voya IM, he was a senior fixed income portfolio
manager at Wells Fargo and has held senior trading
and portfolio management roles at Morgan
Stanley/Eaton Vance and BNY Mellon. |
|
Anuranjan Sharma |
Voya IM |
Voya Intermediate Bond Portfolio |
Mr. Sharma, Portfolio Manager and macro strategist
at Voya IM, previously was a senior research analyst
at Oppenheimer Funds, where he was responsible
for emerging market and macro overlay for their
multisector fund and worked on international debt
and emerging local funds. Prior to that, Mr. Sharma
held roles at Voya IM in asset allocation and fixed
income where he focused on global rates, foreign
exchange, and business cycle analysis for
developed and emerging markets. |
|
Russell Shtern, CFA |
Voya IM |
Voya Global High Dividend Low
Volatility Portfolio
Voya Index Plus LargeCap Portfolio
Voya Index Plus MidCap Portfolio
Voya Index Plus SmallCap Portfolio
Voya Small Company Portfolio |
Mr. Shtern, Portfolio Manager, joined Voya IM in
2022. Prior to joining Voya IM, he served as a senior
portfolio manager at Franklin Templeton’s
Investment Solutions group (2020-2022) where he
was responsible for managing smart beta and active
multi-factor equity strategies. Prior to that, Mr.
Shtern was head of equity portfolio management
and trading and a member of the global equity
management team for QS Investors (a Legg Mason
affiliate), a quantitative multi-asset and equity
manager (2014-2020). |
|
Vinay Viralam, CFA |
Voya IM |
Voya Intermediate Bond Portfolio |
Mr. Viralam, Portfolio Manager, is a senior vice
president and portfolio manager for the fixed
income team at Voya IM. Prior to joining Voya IM, he
worked at Goldman Sachs Asset Management for
11 years, focused on cross-sector research and
portfolio management. |
72
MANAGEMENT OF THE PORTFOLIOS (continued)
|
Portfolio Manager |
Investment
Adviser or
Sub-Adviser |
Portfolio |
Professional Experience |
|
Gregory Wachsman, CFA |
Voya IM |
Voya Growth and Income Portfolio |
Mr. Wachsman, Portfolio Manager and equity
analyst, joined Voya IM in 2017 and serves on Voya
IM's value team where he covers the financials
sector. Prior to joining Voya IM, he was an equity
analyst covering U.S. banks, brokers, specialty
finance, and exchanges at Lord Abbett & Co.
(2010-2017). |
|
Kai Yee Wong |
Voya IM |
Voya Global High Dividend Low
Volatility Portfolio
Voya Index Plus LargeCap Portfolio
Voya Index Plus MidCap Portfolio
Voya Index Plus SmallCap Portfolio
Voya Small Company Portfolio |
Ms. Wong, Portfolio Manager, joined Voya IM in 2012
and is responsible for the portfolio management of
the index, active quantitative, and smart beta
strategies. Prior to that, she worked as a senior
equity portfolio manager at Northern Trust
(2003-2009) where she was responsible for
managing various global indices, including
developed, emerging, real estate, Topix, and socially
responsible benchmarks. |
|
David S. Yealy |
Voya IM |
Voya Government Money Market
Portfolio |
Mr. Yealy, Portfolio Manager, joined Voya IM in 2004.
Prior to that, he was a managing director with Trusco
Capital Management (1991-2004) where he
managed over $9 billion of assets and was
instrumental in the development and marketing of
that firm’s cash management business. |
Additional Information Regarding the Portfolio Managers
The SAI provides additional information about each portfolio manager’s compensation, other accounts managed by each portfolio manager, and the securities each portfolio manager owns in the Portfolio(s) the portfolio manager manages.
Distributor
Voya Investments Distributor, LLC (the “Distributor”), a Delaware limited liability company, is the principal underwriter and distributor of each Portfolio. The Distributor is an indirect subsidiary of Voya Financial, Inc. and is an affiliate of the Investment Adviser. The Distributor’s principal business address is 7337 East Doubletree Ranch Road, Suite 100, Scottsdale, Arizona 85258. See “Principal Underwriter” in the SAI.
The Distributor is a member of the Financial Industry Regulatory Authority, Inc. (“FINRA”). To obtain information about FINRA member firms and their associated persons, you may contact FINRA at www.finra.org or the Public Disclosure Hotline at 800-289-9999.
Contractual Arrangements
Each Portfolio has contractual arrangements with various service providers, which may include, among others, investment advisers, distributors, custodians and fund accounting agents, shareholder service providers, and transfer agents, who provide services to each Portfolio. Shareholders are not parties to, or intended (“third-party”) beneficiaries of, any of those contractual arrangements, and those contractual arrangements are not intended to create in any individual shareholder or group of shareholders any right to enforce them against the service providers or to seek any remedy under them against the service providers, either directly or on behalf of a Portfolio. This paragraph is not intended to limit any rights granted to shareholders under federal or state securities laws.
73
HOW SHARES ARE PRICED
Each Portfolio is open for business every day the New York Stock Exchange (the “NYSE”) opens for regular trading (each such day, a “Business Day”). The net asset value (the “NAV”) per share for each class of each Portfolio is determined each Business Day as of the close of the regular trading session (“Market Close”), as determined by the Consolidated Tape Association (the “CTA”), the central distributor of transaction prices for exchange-traded securities (normally 4:00 p.m. Eastern Time unless otherwise designated by the CTA). The NAV per share of each class of each Portfolio is calculated by taking the value of the Portfolio’s assets attributable to that class, subtracting the Portfolio’s liabilities attributable to that class, and dividing by the number of shares of that class that are outstanding. On days when a Portfolio is closed for business, Portfolio shares will not be priced, and the Portfolio will not process purchase or redemption orders. To the extent a Portfolio’s assets are traded in other markets on days when the Portfolio does not price its shares, the value of the Portfolio’s assets will likely change and you will not be able to purchase or redeem shares of the Portfolio.
Portfolio holdings for which market quotations are readily available are valued at market value. Investments in open-end registered investment companies that do not trade on an exchange are valued at the end-of-day NAV per share. The prospectuses of the open-end registered investment companies in which each Portfolio may invest explain the circumstances under which they will use fair value pricing and the effects of using fair value pricing. Foreign (non-U.S.) securities’ prices are converted into U.S. dollar amounts using the applicable exchange rates as of Market Close.
When a market quotation for a portfolio security is not readily available or is deemed unreliable (for example, when trading has been halted or there are unexpected market closures or other material events that would suggest that the market quotation is unreliable) and for purposes of determining the value of other portfolio holdings, the portfolio holding is priced at its fair value. The Board has designated the Investment Adviser, as the valuation designee, to make fair value determinations in good faith. In determining the fair value of a Portfolio’s portfolio holdings, the Investment Adviser, pursuant to its fair valuation policy, may consider inputs from pricing service providers, broker-dealers, or a Portfolio’s Sub-Adviser(s). Issuer specific events, transaction price, position size, nature and duration of restrictions on disposition of the security, market trends, bid/ask quotes of brokers, and other market data may be reviewed in the course of making a good faith determination of the fair value of a portfolio holding. Because trading hours for certain foreign (non-U.S.) securities end before Market Close, closing market quotations may become unreliable. The prices of foreign (non-U.S.) securities will generally be adjusted based on inputs from a third-party pricing service that are intended to reflect valuation changes through Market Close. Because of the inherent uncertainties of fair valuation, the values used to determine each Portfolio’s NAV may materially differ from the value received upon actual sale of those investments. Thus, fair valuation may have an unintended dilutive or accretive effect on the value of shareholders’ investments in each Portfolio.
When your Variable Contract or Qualified Plan is buying shares of a Portfolio, it will pay the NAV that is next calculated after the order from the Variable Contract owner or Qualified Plan participant is received in proper form. When the Variable Contract owner or Qualified Plan participant is selling shares, it will normally receive the NAV that is next calculated after the order form is received from the Variable Contract owner or Qualified Plan participant in proper form. Investments will be processed at the NAV next calculated after an order is received and accepted by a Portfolio or its designated agent. In order to receive that day's price, your order must be received by Market Close.
Voya Government Money Market Portfolio
Voya Government Money Market Portfolio uses the amortized cost method to value its portfolio securities and seeks to maintain a constant NAV of $1.00 per share, although there may be circumstances under which this goal cannot be achieved. The amortized cost method involves valuing a security at its cost and amortizing any discount or premium over the period until maturity, regardless of the impact of fluctuating interest rates or the market value of the security. Although the Portfolio's Board has established procedures designed to stabilize, to the extent reasonably possible, the share price of the Portfolio, there can be no assurance that the Portfolio's NAV can be maintained at $1.00 per share.
74
HOW TO BUY AND SELL SHARES
Each Portfolio's shares may be offered to insurance company separate accounts serving as investment options under Variable Contracts, Qualified Plans outside the separate account context, custodial accounts, certain investment advisers and their affiliates in connection with the creation or management of a Portfolio, other investment companies (as permitted by the 1940 Act), and other investors as permitted by the diversification and other requirements of section 817(h) of the Internal Revenue Code of 1986, as amended (the “Code”) and the underlying U.S. Treasury Regulations.
Class R6 shares are only offered to investors that do not require a Portfolio or an affiliate of a Portfolio (including the Investment Adviser and any affiliate of the Investment Adviser) to make, and a Portfolio or affiliate does not pay, any type of servicing, administrative, or revenue sharing payments with respect to Class R6 shares. Notwithstanding the foregoing, affiliates of Voya, including affiliates that are intermediaries that sell Class R6 shares of a Portfolio, may benefit financially from the revenue Voya receives for the services it provides to Class R6 shares of a Portfolio. Availability of Class R6 shares is subject to management’s determination of the appropriateness of investment in Class R6 shares.
Each Portfolio may not be available as an investment option in your Variable Contract, through your Qualified Plan, or other investment company. Please refer to the prospectus for the appropriate insurance company separate account, investment company, or your plan documents for information on how to direct investments in, or redemptions from, an investment option corresponding to a Portfolio and any fees that may apply. Participating insurance companies and certain other designated organizations are authorized to receive purchase orders on each Portfolio's behalf.
Each Portfolio currently does not foresee any disadvantages to investors if it serves as an investment option for Variable Contracts and if it offers its shares directly to Qualified Plans and other permitted investors. However, it is possible that the interests of Variable Contract owners, plan participants, and other permitted investors for which a Portfolio serves as an investment option might, at some time, be in conflict because of differences in tax treatment or other considerations. The Board directed the Investment Adviser to monitor events to identify any material conflicts between Variable Contract owners, plan participants, and other permitted investors and would have to determine what action, if any, should be taken in the event of such conflict. If such a conflict occurred, an insurance company participating in a Portfolio might be required to redeem the investment of one or more of its separate accounts from the Portfolio or a Qualified Plan, investment company, or other permitted investor might be required to redeem its investment, which might force the Portfolio to sell securities at disadvantageous prices. Each Portfolio may discontinue sales to a Qualified Plan and require plan participants with existing investments to redeem those investments if the Qualified Plan loses (or in the opinion of the Investment Adviser, is at risk of losing) its Qualified Plan status.
Each Portfolio reserves the right to suspend the offering of shares or to reject any specific purchase order. Each Portfolio may suspend redemptions or postpone payments when the NYSE is closed or when trading is restricted for any reason or under emergency circumstances as determined by the SEC.
Distribution Plans and Shareholder Service Plans
Each Portfolio listed in the table below has a distribution and shareholder service plan (the “12b-1 Plan”) in accordance with Rule 12b-1 under the 1940 Act for Class ADV and Class S2 shares. These payments are made to the Distributor on an ongoing basis as compensation for services the Distributor provides and expenses it bears in connection with the marketing and other fees to support the sale and distribution of Class ADV and Class S2 shares and for shareholder services provided by securities dealers (including the Distributor) and other financial intermediaries and plan administrators that provide administrative services relating to Class ADV and Class S2 shares and their shareholders, including Variable Contract owners or Qualified Plan participants with interests in the Portfolios. The annual distribution and shareholder service fees under the 12b-1 Plan for Class ADV shares may equal up to 0.50% (0.25% for distribution fees and 0.25% for shareholder service fees), and the annual distribution and shareholder service fees under the 12b-1 Plan for Class S2 shares may equal up to 0.40% (0.15% for distribution fees and 0.25% for shareholder service fees) of a Portfolio’s average daily net assets attributable to each of its Class ADV and Class S2 shares. The Distributor has contractually agreed to waive 0.05% of the distribution fee for Class ADV shares of Voya Growth and Income Portfolio through May 1, 2027.
Each Portfolio listed in the table below has a distribution/shareholder service plan (the “Distribution/Shareholder Service Plan”) in accordance with Rule 12b-1 under the 1940 Act for Class S shares. These payments are made to the Distributor on an ongoing basis as compensation for services the Distributor provides and expenses it bears in connection with the marketing and other fees to support the sale and distribution of Class S shares and for shareholder services provided by securities dealers (including the Distributor) and other financial intermediaries and plan administrators
75
HOW TO BUY AND SELL SHARES (continued)
that provide administrative services relating to Class S shares and their shareholders, including Variable Contract owners or Qualified Plan participants with interests in the Portfolios. Under the Distribution/Shareholder Service Plan each Portfolio makes payment at an annual rate of 0.25% of the Portfolio’s average daily net assets.
Because these distribution and shareholder service fees are paid out of a Portfolio’s assets on an ongoing basis, over time these fees will increase the cost of your investment and may cost you more than paying other types of sales charges.
|
Portfolio |
Class ADV |
Class S |
Class S2 |
|
Voya Global High Dividend Low Volatility Portfolio |
0.50% |
0.25% |
0.40% |
|
Voya Growth and Income Portfolio |
0.50% |
0.25% |
0.40% |
|
Voya Index Plus LargeCap Portfolio |
0.50% |
0.25% |
N/A |
|
Voya Index Plus MidCap Portfolio |
N/A |
0.25% |
N/A |
|
Voya Index Plus SmallCap Portfolio |
N/A |
0.25% |
N/A |
|
Voya Intermediate Bond Portfolio |
0.50% |
0.25% |
0.40% |
|
Voya Small Company Portfolio |
0.50% |
0.25% |
N/A |
76
FREQUENT TRADING - MARKET TIMING
Each Portfolio is intended for long-term investment and not as a short-term trading vehicle. Accordingly, organizations or individuals that use market timing investment strategies and make frequent transfers should not purchase shares of a Portfolio. Shares of each Portfolio are primarily sold through omnibus account arrangements with financial intermediaries, as investment options for Variable Contracts issued by insurance companies and as investment options for Qualified Plans. Omnibus accounts generally do not identify customers' trading activity on an individual basis. The Investment Adviser or affiliated entities have agreements which require such intermediaries to provide detailed account information, including trading history, upon request of a Portfolio.
The Board has made a determination not to adopt a separate policy for each Portfolio with respect to frequent purchases and redemptions of shares by a Portfolio’s shareholders, but rather to rely on the financial intermediaries to monitor frequent, short-term trading within a Portfolio by its customers. You should review the materials provided to you by your financial intermediary including, in the case of a Variable Contract, the prospectus that describes the contract or, in the case of a Qualified Plan, the plan documentation for its policies regarding frequent, short-term trading. With trading information received as a result of these agreements, a Portfolio may make a determination that certain trading activity is harmful to the Portfolio and its shareholders, even if such activity is not strictly prohibited by the intermediaries' excessive trading policy. As a result, a shareholder investing directly or indirectly in a Portfolio may have their trading privileges suspended without violating the stated excessive trading policy of the intermediary. Each Portfolio reserves the right, in its sole discretion and without prior notice, to reject, restrict, or refuse purchase orders whether directly or by exchange including purchase orders that have been accepted by a financial intermediary. Each Portfolio seeks assurances from the financial intermediaries that they have procedures adequate to monitor and address frequent, short-term trading. There is, however, no guarantee that the procedures of the financial intermediaries will be able to curtail frequent, short-term trading activity.
Each Portfolio believes that market timing or frequent, short-term trading in any account, including a Variable Contract or Qualified Plan account, is not in the best interest of the Portfolio or its shareholders. Due to the disruptive nature of this activity, it can adversely impact the ability of the Investment Adviser or the Sub-Adviser (if applicable) to invest assets in an orderly, long-term manner. Frequent trading can disrupt the management of a Portfolio and raise their expenses through: increased trading and transaction costs; forced and unplanned portfolio turnover; lost opportunity costs; and large asset swings that decrease the Portfolio's ability to provide maximum investment return to all shareholders. This in turn can have an adverse effect on a Portfolio's performance.
Portfolios that invest in foreign (non-U.S.) securities may present greater opportunities for market timers and thus be at a greater risk for excessive trading. If an event occurring after the close of a foreign market, but before the time a Portfolio computes its current NAV, causes a change in the price of the foreign (non-U.S.) security and such price is not reflected in its current NAV, investors may attempt to take advantage of anticipated price movements in securities held by a Portfolio based on such pricing discrepancies. This is often referred to as “price arbitrage.” Such price arbitrage opportunities may also occur in portfolios which do not invest in foreign (non-U.S.) securities. For example, if trading in a security held by a Portfolio is halted and does not resume prior to the time it calculates its NAV such “stale pricing” presents an opportunity for investors to take advantage of the pricing discrepancy. Similarly, portfolios that hold thinly-traded securities, such as certain small-capitalization securities, may be exposed to varying levels of pricing arbitrage. Each Portfolio has adopted fair valuation policies and procedures intended to reduce its exposure to price arbitrage, stale pricing and other potential pricing discrepancies. However, to the extent that a Portfolio does not immediately reflect these changes in market conditions, short-term trading may dilute the value of the Portfolio’s shares which negatively affects long-term shareholders.
The following transactions are excluded when determining whether trading activity is excessive:
•
Rebalancing to facilitate fund-of-fund arrangements or a Portfolio’s systematic exchange privileges; and
•
Purchases or sales initiated by certain other funds in the Voya family of funds.
Although the policies and procedures known to a Portfolio that are followed by the financial intermediaries that use the Portfolio and the monitoring by the Portfolio are designed to discourage frequent, short-term trading, none of these measures can eliminate the possibility that frequent, short-term trading activity in the Portfolio will occur. Moreover, decisions about allowing trades in a Portfolio may be required. These decisions are inherently subjective, and will be made in a manner that is in the best interest of a Portfolio's shareholders.
77
PAYMENTS TO FINANCIAL INTERMEDIARIES
Voya mutual funds may be offered as investment options in Variable Contracts issued by affiliated and non-affiliated insurance companies and in Qualified Plans. Fees derived from a Portfolio's Distribution and/or Service Plans (if applicable) may be paid to insurance companies, broker-dealers, and companies that service Qualified Plans for selling the Portfolio's shares and/or for servicing shareholder accounts. Fees derived from a Portfolio’s Service Plan may be paid to insurance companies, broker-dealers, and companies that service Qualified Plans for servicing shareholder accounts. Shareholder services may include, among other things, administrative, record keeping, or other services that insurance companies or Qualified Plans provide to the clients who use a Portfolio as an investment option. In addition, the Investment Adviser, Distributor, or their affiliated entities, out of their own resources and without additional cost to a Portfolio or its shareholders, may pay additional compensation to these insurance companies, broker-dealers, or companies that service Qualified Plans. The Investment Adviser, Distributor, or affiliated entities of a Portfolio may also share their profits with affiliated insurance companies or other Voya entities through inter-company payments.
For non-affiliated insurance companies and Qualified Plans, payments from a Portfolio's Distribution and/or Service Plans (if applicable) as well as payments (if applicable) from the Investment Adviser and/or Distributor generally are based upon an annual percentage of the average net assets held in a Portfolio by those companies. Payments to financial intermediaries by the Distributor or its affiliates or by a Portfolio may provide an incentive for insurance companies or Qualified Plans to make a Portfolio available through Variable Contracts or Qualified Plans over other mutual funds or products.
As of the date of this Prospectus, the Distributor has entered into agreements with the following non-affiliated insurance companies: C.M. Life Insurance Company, First Security Benefit Life Insurance and Annuity Company of New York, First Symetra National Life Insurance Company of New York, Lincoln Financial Group, Lincoln National Life Insurance Company, Massachusetts Mutual Life Insurance Company, Nationwide Life Insurance Company, New York Life Insurance and Annuity Corporation, Security Benefit Life Insurance Company, Security Equity Life Insurance Company, Security Life of Denver Insurance Company, Standard Life Insurance Company, Symetra Life Insurance Company, Talcott Resolution Life Insurance Company, TIAA Life Insurance Company, Transamerica Life Insurance Company, Transamerica Financial Life Insurance Company, Union Securities, Venerable Insurance and Annuity Company, and Zurich American Life Insurance Company. Except as discussed in further detail below, the fees payable under these agreements are for compensation for providing distribution and/or shareholder services for which the insurance companies are paid at annual rates that range from 0.00% to 0.55%. This is computed as a percentage of the average aggregate amount invested in the Portfolio by Variable Contract holders through the relevant insurance company's Variable Contracts.
The insurance companies issuing Variable Contracts or Qualified Plans that use a Portfolio as an investment option may also pay fees to third parties in connection with distribution of the Variable Contracts and for services provided to Variable Contract owners. Entities that service Qualified Plans may also pay fees to third parties to help service the Qualified Plans or the accounts of their participants. Neither a Portfolio, the Investment Adviser, nor the Distributor are parties to these arrangements. Variable Contract owners should consult the prospectus and statement of additional information for their Variable Contracts for a discussion of these payments and should consult with their agent or broker. Qualified Plan participants should consult with their pension servicing agent.
Ultimately, the agent or broker selling the Variable Contract to you could have a financial interest in selling you a particular product to increase the compensation they receive. Please make sure you read fully each prospectus and discuss any questions you have with your agent or broker.
Class R6
Voya mutual funds are distributed by the Distributor. The Distributor is a broker-dealer that is licensed to sell securities. The Distributor generally does not sell directly to the public but sells and markets its products through financial intermediaries. Each Voya mutual fund also has an investment adviser which is responsible for managing the money invested in each of the mutual funds. No dealer compensation is paid from the sale of Class R6 shares of a Portfolio. Class R6 shares do not have sales commissions, pay 12b-1 fees, or make payments to financial intermediaries for assisting the Distributor in promoting the sales of a Portfolio's shares. In addition, neither a Portfolio nor its affiliates (including the Investment Adviser and any affiliate of the Investment Adviser) make any type of administrative, service, or revenue sharing payments in connection with Class R6 shares. Notwithstanding the foregoing, affiliates of Voya, including affiliates that are intermediaries that sell Class R6 shares of a Portfolio, may benefit financially from the revenue Voya receives for the services it provides to Class R6 shares of a Portfolio.
78
DIVIDENDS, DISTRIBUTIONS, AND TAXES
Dividends and Distributions
Each Portfolio generally distributes most or all of its net earnings in the form of dividends, consisting of net investment income and capital gains distributions, if any. Each Portfolio distributes capital gains, if any, annually. Each Portfolio (except Voya Global High Dividend Low Volatility Portfolio, Voya Government Money Market Portfolio, Voya Growth and Income Portfolio, and Voya Intermediate Bond Portfolio) also declares dividends and pays dividends consisting of net investment income, if any, annually. Voya Global High Dividend Low Volatility Portfolio declares dividends and pays dividends consisting of net investment income, if any, quarterly. Voya Growth and Income Portfolio declares dividends and pays dividends consisting of net investment income, if any, semi-annually. Voya Government Money Market Portfolio and Voya Intermediate Bond Portfolio declare dividends daily and pay dividends consisting of net investment income, if any, monthly.
All dividends and capital gains distributions will be automatically reinvested in additional shares of a Portfolio at the NAV of such shares on the payment date unless a participating insurance company’s separate account is permitted to hold cash and elects to receive payment in cash.
From time to time a portion of a Portfolio’s distributions may constitute a return of capital. To comply with U.S. federal tax laws, a Portfolio may also pay additional distributions of capital gains and/or ordinary income.
Tax Consequences
Holders of Variable Contracts should refer to the prospectus for their contracts for information regarding the tax consequences of owning such contracts and should consult their tax advisers before investing.
Each Portfolio intends to qualify as a regulated investment company (“RIC”) for U.S. federal income tax purposes by satisfying the requirements under Subchapter M of the Code, including requirements with respect to diversification of assets, distribution of income and sources of income. As a RIC, a Portfolio generally will not be subject to tax on its net investment company taxable income and net realized capital gains that it timely distributes to its shareholders.
Each Portfolio also intends to comply with the diversification requirements of Section 817(h) of the Code and the underlying regulations for Variable Contracts so that owners of these contracts should not be subject to U.S. federal tax on distributions of dividends and income from the Portfolio to an applicable insurance company's separate accounts.
Since the sole shareholders of each Portfolio will be separate accounts of insurance companies or other permitted investors, no discussion is included herein as to the U.S. federal income tax consequences at the shareholder level. For information concerning the U.S. federal income tax consequences to purchasers of Variable Contracts, see the prospectus for the applicable contract.
See the SAI for further information about tax matters.
The tax status of your investment in a Portfolio depends upon the features of your Variable Contract. For further information, please refer to the prospectus for the Variable Contract.
79
INDEX DESCRIPTIONS
The Bloomberg U.S. Aggregate Bond Index is a broad-based benchmark that measures the investment grade, US dollar-denominated, fixed-rate taxable bond market. The Bloomberg U.S. Aggregate Bond Index includes U.S. Treasuries, government-related and corporate securities, fixed-rate agency mortgage-backed securities, asset-backed securities, and commercial mortgage-backed securities (agency and non-agency). The Bloomberg U.S. Aggregate Bond Index is provided by Bloomberg Index Services Limited.
The MSCI All Country World IndexSM (“MSCI ACWI”) is a free-float adjusted market capitalization index that is designed to measure equity market performance in the global developed and emerging markets.
The MSCI World Value IndexSM captures large and mid cap securities exhibiting overall value style characteristics across 23 developed markets countries.
The Russell 2000® Index measures the performance of the small-capitalization segment of the U.S. equity universe. The Russell 2000® Index is a subset of the Russell 3000® Index, includes approximately 2,000 of the smallest securities (based on a combination of their market capitalization and current index membership), and represents approximately 7% of the total market capitalization of the Russell 3000® Index. The Russell 2000® Index is provided by FTSE Russell.
The Russell 3000® Index measures the performance of the largest 3,000 U.S. companies representing approximately 98% of the investable U.S. equity market.
The S&P 500® Index is designed as a gauge of the performance of the large-cap segment of the U.S. equity market, is composed of 500 constituent companies, and covers approximately 80% of available market capitalization. The S&P 500® Index is a float-adjusted market cap weighted index provided by S&P Dow Jones Indices LLC.
The S&P MidCap 400® Index measures the performance of the mid-size company segment of the U.S. market.
The S&P SmallCap 600® Index measures the small-cap segment of the U.S. equity market.
FTSE Russell Index Data Source: London Stock Exchange Group plc and its group undertakings (collectively, the “LSE Group”). © LSE Group 2026. FTSE Russell is a trading name of certain of the LSE Group companies. “FTSE®”, “Russell®”, “FTSE Russell®”, “Russell 2000®” and “Russell 3000®” are trade marks of the relevant LSE Group companies and are trade marks of the relevant LSE Group companies and are used by any other LSE Group company under license. All rights in the FTSE Russell indexes or data vest in the relevant LSE Group company which owns the index or the data. Neither LSE Group nor its licensors accept any liability for any errors or omissions in the indexes or data and no party may rely on any indexes or data contained in this communication. No further distribution of data from the LSE Group is permitted without the relevant LSE Group company’s express written consent. The LSE Group does not promote, sponsor or endorse the content of this communication.
Certain information contained herein (the “Information”) is sourced from/copyright of MSCI Inc., MSCI ESG Research LLC, or their affiliates (“MSCI”), or information providers (together, the “MSCI Parties”) and may have been used to calculate scores, signals, or other indicators. The Information is for internal use only and may not be reproduced or disseminated in whole or part without prior written permission. The Information may not be used for, nor does it constitute, an offer to buy or sell, or a promotion or recommendation of, any security, financial instrument or product, trading strategy, or index, nor should it be taken as an indication or guarantee of any future performance. Some funds may be based on or linked to MSCI indexes, and MSCI may be compensated based on the fund’s assets under management or other measures. MSCI has established an information barrier between index research and certain Information. None of the Information in and of itself can be used to determine which securities to buy or sell or when to buy or sell them. The Information is provided “as is” and the user assumes the entire risk of any use it may make or permit to be made of the Information. No MSCI Party warrants or guarantees the originality, accuracy and/or completeness of the Information and each expressly disclaims all express or implied warranties. No MSCI Party shall have any liability for any errors or omissions in connection with any Information herein, or any liability for any direct, indirect, special, punitive, consequential or any other damages (including lost profits) even if notified of the possibility of such damages.
The S&P 500® Index, S&P MidCap 400® Index, and S&P SmallCap 600® Index are products of S&P Dow Jones Indices LLC (“SPDJI”), and have been licensed for use by Voya Services Company and certain affiliates (“Voya”). S&P®, S&P MidCap 400®, S&P SmallCap 600® and S&P 500® are trademarks of Standard & Poor’s Financial Services LLC (“S&P”); Dow Jones® is a registered trademark of Dow Jones Trademark Holdings LLC (“Dow Jones”); and these trademarks have been licensed for use by SPDJI and sublicensed for certain purposes by Voya.
80
INDEX DESCRIPTIONS (continued)
Voya’s investment products (the “Products”) based in whole or in part on the S&P 500® Index, S&P MidCap 400® Index and S&P SmallCap 600® Index (the “Indices”) are not sponsored, endorsed, sold or promoted by SPDJI, S&P, Dow Jones or any of their respective affiliates (collectively, “S&P Dow Jones Indices”). S&P Dow Jones Indices makes no representation or warranty, express or implied, to the owners of the Products or any member of the public regarding the advisability of investing in the Products or purchasing securities generally or the ability of the Indices to track general market performance. S&P Dow Jones Indices’ only relationship to Voya with respect to the Products is the licensing of the Indices and certain trademarks, service marks and/or trade names of S&P Dow Jones Indices and/or its licensors. The S&P 500® Index, S&P MidCap 400® Index and S&P SmallCap 600® Index are determined, composed and calculated by S&P Dow Jones Indices without regard to Voya or the Products. S&P Dow Jones Indices have no obligation to take the needs of Voya or the owners of the Products into consideration in determining, composing or calculating the Indices. S&P Dow Jones Indices are not responsible for and have not participated in the determination of the prices, and amount of the Products or the timing of the issuance or sale of the Products or in the determination or calculation of the equations by which the Products are to be converted into cash, surrendered or redeemed, as the case may be. S&P Dow Jones Indices have no obligation or liability in connection with the administration or marketing of the Products. There is no assurance that investment products based on the Indices will accurately track index performance or provide positive investment returns. S&P Dow Jones Indices LLC is not an investment advisor. Inclusion of a security within an index is not a recommendation by S&P Dow Jones Indices to buy, sell, or hold such security, nor is it considered to be investment advice.
S&P DOW JONES INDICES DOES NOT GUARANTEE THE ADEQUACY, ACCURACY, TIMELINESS AND/OR THE COMPLETENESS OF THE INDICES OR ANY DATA RELATED THERETO OR ANY COMMUNICATION, INCLUDING BUT NOT LIMITED TO, ORAL OR WRITTEN COMMUNICATION (INCLUDING ELECTRONIC COMMUNICATIONS) WITH RESPECT THERETO. S&P DOW JONES INDICES SHALL NOT BE SUBJECT TO ANY DAMAGES OR LIABILITY FOR ANY ERRORS, OMISSIONS, OR DELAYS THEREIN. S&P DOW JONES INDICES MAKE NO EXPRESS OR IMPLIED WARRANTIES, AND EXPRESSLY DISCLAIMS ALL WARRANTIES, OF MERCHANTABILITY OR FITNESS FOR A PARTICULAR PURPOSE OR USE OR AS TO RESULTS TO BE OBTAINED BY VOYA, OWNERS OF THE PRODUCTS, OR ANY OTHER PERSON OR ENTITY FROM THE USE OF THE INDICES OR WITH RESPECT TO ANY DATA RELATED THERETO. WITHOUT LIMITING ANY OF THE FOREGOING, IN NO EVENT WHATSOEVER SHALL S&P DOW JONES INDICES BE LIABLE FOR ANY INDIRECT, SPECIAL, INCIDENTAL, PUNITIVE, OR CONSEQUENTIAL DAMAGES INCLUDING BUT NOT LIMITED TO, LOSS OF PROFITS, TRADING LOSSES, LOST TIME OR GOODWILL, EVEN IF THEY HAVE BEEN ADVISED OF THE POSSIBLITY OF SUCH DAMAGES, WHETHER IN CONTRACT, TORT, STRICT LIABILITY, OR OTHERWISE. THERE ARE NO THIRD PARTY BENEFICIARIES OF ANY AGREEMENTS OR ARRANGEMENTS BETWEEN S&P DOW JONES INDICES AND VOYA, OTHER THAN THE LICENSORS OF S&P DOW JONES INDICES.
81
FINANCIAL HIGHLIGHTS
The financial highlights table is intended to help you understand a Portfolio's financial performance for the periods shown. Certain information reflects the financial results for a single share. The total returns in the table represent the rate of return that an investor would have earned or lost on an investment in a Portfolio (assuming reinvestment of all dividends and/or distributions). The information has been audited by Ernst & Young LLP, whose report, along with a Portfolio’s financial statements, is included in the Portfolio’s Form N-CSR, which is available upon request.
82
FINANCIAL HIGHLIGHTS (continued)
Selected data for a share of capital stock outstanding throughout each year or period.
|
|
|
Income (loss)
from
investment
operations |
|
Less distributions |
|
|
|
|
Ratios to average net assets |
Supplemental
data | |||||||
|
|
Net asset value, beginning
of year or period |
Net investment income (loss) |
Net realized and unrealized
gain (loss) |
Total from investment
operations |
From net investment income |
From net realized gains |
From return of capital |
Total distributions |
Payment from affiliate |
Net asset value, end of year or period |
Total Return(1) |
Expenses before
reductions/additions(2)(3)(4) |
Expenses net of fee waivers
and/or recoupments, if any(2)(3)(4) |
Expenses net of all
reductions/additions(2)(3)(4) |
Net investment income
(loss)(2)(3) |
Net assets, end of year or period |
Portfolio turnover rate |
|
Year or Period ended |
($) |
($) |
($) |
($) |
($) |
($) |
($) |
($) |
($) |
($) |
(%) |
(%) |
(%) |
(%) |
(%) |
($000's) |
(%) |
|
Voya Global High Dividend Low Volatility Portfolio | |||||||||||||||||
|
Class ADV |
|
|
|
|
|
|
|
|
|
|
|
|
|
|
|
|
|
|
12-31-25 |
11.68 |
0.23• |
1.84 |
2.07 |
0.22 |
1.50 |
— |
1.72 |
— |
12.03 |
18.48 |
1.22 |
1.11 |
1.11 |
1.95 |
13,123 |
67 |
|
12-31-24 |
11.01 |
0.24•
|
1.09 |
1.33 |
0.27 |
0.39 |
— |
0.66 |
— |
11.68 |
12.38 |
1.17 |
1.10 |
1.10 |
2.09 |
12,252 |
72 |
|
12-31-23 |
11.01 |
0.27•
|
0.37 |
0.64 |
0.27 |
0.37 |
— |
0.64 |
— |
11.01 |
6.18 |
1.16 |
1.10 |
1.10 |
2.54 |
10,354 |
70 |
|
12-31-22 |
12.32 |
0.25•
|
(0.93) |
(0.68) |
0.24 |
0.39 |
— |
0.63 |
— |
11.01 |
(5.38) |
1.15 |
1.10 |
1.10 |
2.23 |
11,235 |
68 |
|
12-31-21 |
10.46 |
0.21•
|
1.89 |
2.10 |
0.24 |
— |
— |
0.24 |
— |
12.32 |
20.23 |
1.16 |
1.10 |
1.10 |
1.85 |
13,886 |
71 |
|
Class I |
|
|
|
|
|
|
|
|
|
|
|
|
|
|
|
|
|
|
12-31-25 |
11.66 |
0.29• |
1.83 |
2.12 |
0.29 |
1.50 |
— |
1.79 |
— |
11.99 |
19.00 |
0.72 |
0.61 |
0.61 |
2.43 |
135,778 |
67 |
|
12-31-24 |
10.99 |
0.30•
|
1.08 |
1.38 |
0.32 |
0.39 |
— |
0.71 |
— |
11.66 |
12.94 |
0.67 |
0.60 |
0.60 |
2.59 |
124,887 |
72 |
|
12-31-23 |
10.99 |
0.32•
|
0.37 |
0.69 |
0.32 |
0.37 |
— |
0.69 |
— |
10.99 |
6.74 |
0.66 |
0.60 |
0.60 |
3.04 |
122,202 |
70 |
|
12-31-22 |
12.30 |
0.30•
|
(0.92) |
(0.62) |
0.30 |
0.39 |
— |
0.69 |
— |
10.99 |
(4.90) |
0.65 |
0.60 |
0.60 |
2.73 |
125,985 |
68 |
|
12-31-21 |
10.44 |
0.27•
|
1.89 |
2.16 |
0.30 |
— |
— |
0.30 |
— |
12.30 |
20.87 |
0.66 |
0.60 |
0.60 |
2.35 |
144,785 |
71 |
|
Class S |
|
|
|
|
|
|
|
|
|
|
|
|
|
|
|
|
|
|
12-31-25 |
11.73 |
0.29• |
1.81 |
2.10 |
0.25 |
1.50 |
— |
1.75 |
— |
12.08 |
18.73 |
0.92 |
0.85 |
0.85 |
2.35 |
31,244 |
67 |
|
12-31-24 |
11.05 |
0.27•
|
1.09 |
1.36 |
0.29 |
0.39 |
— |
0.68 |
— |
11.73 |
12.68 |
0.92 |
0.85 |
0.85 |
2.34 |
328,504 |
72 |
|
12-31-23 |
11.05 |
0.30•
|
0.36 |
0.66 |
0.29 |
0.37 |
— |
0.66 |
— |
11.05 |
6.43 |
0.91 |
0.85 |
0.85 |
2.78 |
351,456 |
70 |
|
12-31-22 |
12.36 |
0.28•
|
(0.93) |
(0.65) |
0.27 |
0.39 |
— |
0.66 |
— |
11.05 |
(5.11) |
0.90 |
0.85 |
0.85 |
2.48 |
392,545 |
68 |
|
12-31-21 |
10.49 |
0.24•
|
1.90 |
2.14 |
0.27 |
— |
— |
0.27 |
— |
12.36 |
20.56 |
0.91 |
0.85 |
0.85 |
2.10 |
474,598 |
71 |
|
Class S2 |
|
|
|
|
|
|
|
|
|
|
|
|
|
|
|
|
|
|
12-31-25 |
11.55 |
0.24• |
1.80 |
2.04 |
0.23 |
1.50 |
— |
1.73 |
— |
11.86 |
18.47 |
1.12 |
1.01 |
1.01 |
2.03 |
155 |
67 |
|
12-31-24 |
10.89 |
0.25•
|
1.08 |
1.33 |
0.28 |
0.39 |
— |
0.67 |
— |
11.55 |
12.50 |
1.07 |
1.00 |
1.00 |
2.20 |
146 |
72 |
|
12-31-23 |
10.89 |
0.28•
|
0.37 |
0.65 |
0.28 |
0.37 |
— |
0.65 |
— |
10.89 |
6.37 |
1.06 |
1.00 |
1.00 |
2.64 |
229 |
70 |
|
12-31-22 |
12.20 |
0.26•
|
(0.93) |
(0.67) |
0.25 |
0.39 |
— |
0.64 |
— |
10.89 |
(5.33) |
1.05 |
1.00 |
1.00 |
2.34 |
223 |
68 |
|
12-31-21 |
10.35 |
0.22•
|
1.88 |
2.10 |
0.25 |
— |
— |
0.25 |
— |
12.20 |
20.46 |
1.06 |
1.00 |
1.00 |
1.92 |
265 |
71 |
|
Voya Government Money Market Portfolio | |||||||||||||||||
|
Class I |
|
|
|
|
|
|
|
|
|
|
|
|
|
|
|
|
|
|
12-31-25 |
1.00 |
0.04• |
— |
0.04 |
0.04 |
0.00* |
— |
0.04 |
— |
1.00 |
4.02 |
0.45 |
0.40 |
0.40 |
3.88 |
847,574 |
— |
|
12-31-24 |
1.00 |
0.05•
|
— |
0.05 |
0.05 |
0.00* |
— |
0.05 |
— |
1.00 |
4.91 |
0.45 |
0.40 |
0.40 |
4.79 |
824,631 |
— |
|
12-31-23 |
1.00 |
0.05•
|
— |
0.05 |
0.05 |
— |
— |
0.05 |
— |
1.00 |
4.77 |
0.48 |
0.43 |
0.43 |
4.72 |
789,249 |
— |
|
12-31-22 |
1.00 |
0.01•
|
0.00* |
0.01 |
0.01 |
— |
— |
0.01 |
— |
1.00 |
1.39 |
0.50 |
0.35 |
0.35 |
1.43 |
523,130 |
— |
|
12-31-21 |
1.00 |
—•
|
0.00* |
0.00* |
0.00* |
0.00* |
— |
0.00* |
— |
1.00 |
0.09 |
0.50 |
0.05 |
0.05 |
0.00* |
485,800 |
— |
|
Voya Growth and Income Portfolio | |||||||||||||||||
|
Class ADV |
|
|
|
|
|
|
|
|
|
|
|
|
|
|
|
|
|
|
12-31-25 |
19.85 |
0.05• |
3.41 |
3.46 |
— |
1.66 |
— |
1.66 |
— |
21.65 |
17.69 |
1.16 |
1.12 |
1.12 |
0.25 |
96,509 |
90 |
|
12-31-24 |
18.60 |
0.09•
|
4.29 |
4.38 |
0.10 |
3.03 |
— |
3.13 |
— |
19.85 |
23.32 |
1.16 |
1.12 |
1.12 |
0.41 |
91,161 |
95 |
|
12-31-23 |
16.21 |
0.12•
|
4.22 |
4.34 |
0.13 |
1.82 |
— |
1.95 |
— |
18.60 |
26.78 |
1.19 |
1.12 |
1.12 |
0.64 |
83,897 |
75 |
|
12-31-22 |
22.50 |
0.13•
|
(3.55) |
(3.42) |
0.14 |
2.73 |
— |
2.87 |
— |
16.21 |
(15.08) |
1.18 |
1.11 |
1.11 |
0.64 |
73,784 |
56 |
|
12-31-21 |
29.29 |
0.13•
|
8.14 |
8.27 |
0.19 |
14.87 |
— |
15.06 |
— |
22.50 |
28.41 |
1.16 |
1.06 |
1.06 |
0.39 |
97,015 |
65 |
See Accompanying Notes to Financial Highlights
83
FINANCIAL HIGHLIGHTS (continued)
Selected data for a share of capital stock outstanding throughout each year or period.
|
|
|
Income (loss)
from
investment
operations |
|
Less distributions |
|
|
|
|
Ratios to average net
assets |
Supplemental
data | |||||||
|
|
Net asset value, beginning
of year or period |
Net investment income (loss) |
Net realized and unrealized
gain (loss) |
Total from investment
operations |
From net investment income |
From net realized gains |
From return of capital |
Total distributions |
Payment from affiliate |
Net asset value, end of year or period |
Total Return(1) |
Expenses before
reductions/additions(2)(3)(4) |
Expenses net of fee waivers
and/or recoupments, if any(2)(3)(4) |
Expenses net of all
reductions/additions(2)(3)(4) |
Net investment income
(loss)(2)(3) |
Net assets, end of year or period |
Portfolio turnover rate |
|
Year or Period ended |
($) |
($) |
($) |
($) |
($) |
($) |
($) |
($) |
($) |
($) |
(%) |
(%) |
(%) |
(%) |
(%) |
($000's) |
(%) |
|
Class I |
|
|
|
|
|
|
|
|
|
|
|
|
|
|
|
|
|
|
12-31-25 |
20.90 |
0.15• |
3.61 |
3.76 |
0.08 |
1.66 |
— |
1.74 |
— |
22.92 |
18.21 |
0.66 |
0.67 |
0.67 |
0.70 |
2,527,897 |
90 |
|
12-31-24 |
19.45 |
0.19•
|
4.49 |
4.68 |
0.20 |
3.03 |
— |
3.23 |
— |
20.90 |
23.85 |
0.66 |
0.67 |
0.67 |
0.86 |
2,293,616 |
95 |
|
12-31-23 |
16.88 |
0.21•
|
4.41 |
4.62 |
0.23 |
1.82 |
— |
2.05 |
— |
19.45 |
27.39 |
0.69 |
0.67 |
0.67 |
1.09 |
1,890,606 |
75 |
|
12-31-22 |
23.30 |
0.22•
|
(3.68) |
(3.46) |
0.23 |
2.73 |
— |
2.96 |
— |
16.88 |
(14.71) |
0.68 |
0.66 |
0.66 |
1.09 |
1,644,921 |
56 |
|
12-31-21 |
29.90 |
0.29•
|
8.33 |
8.62 |
0.35 |
14.87 |
— |
15.22 |
— |
23.30 |
29.00 |
0.66 |
0.61 |
0.61 |
0.85 |
2,137,930 |
65 |
|
Class S |
|
|
|
|
|
|
|
|
|
|
|
|
|
|
|
|
|
|
12-31-25 |
19.89 |
0.09• |
3.43 |
3.52 |
0.03 |
1.66 |
— |
1.69 |
— |
21.72 |
17.94 |
0.91 |
0.92 |
0.92 |
0.44 |
39,071 |
90 |
|
12-31-24 |
18.63 |
0.13•
|
4.30 |
4.43 |
0.14 |
3.03 |
— |
3.17 |
— |
19.89 |
23.56 |
0.91 |
0.92 |
0.92 |
0.61 |
32,627 |
95 |
|
12-31-23 |
16.23 |
0.15•
|
4.24 |
4.39 |
0.17 |
1.82 |
— |
1.99 |
— |
18.63 |
27.06 |
0.94 |
0.92 |
0.92 |
0.84 |
29,695 |
75 |
|
12-31-22 |
22.54 |
0.17•
|
(3.57) |
(3.40) |
0.18 |
2.73 |
— |
2.91 |
— |
16.23 |
(14.96) |
0.93 |
0.91 |
0.91 |
0.84 |
32,229 |
56 |
|
12-31-21 |
29.32 |
0.20•
|
8.16 |
8.36 |
0.27 |
14.87 |
— |
15.14 |
— |
22.54 |
28.72 |
0.91 |
0.86 |
0.86 |
0.59 |
42,612 |
65 |
|
Class S2 |
|
|
|
|
|
|
|
|
|
|
|
|
|
|
|
|
|
|
12-31-25 |
19.07 |
0.06• |
3.27 |
3.33 |
0.00* |
1.66 |
— |
1.66 |
— |
20.74 |
17.73 |
1.06 |
1.07 |
1.07 |
0.30 |
887 |
90 |
|
12-31-24 |
17.98 |
0.09•
|
4.15 |
4.24 |
0.12 |
3.03 |
— |
3.15 |
— |
19.07 |
23.36 |
1.06 |
1.07 |
1.07 |
0.46 |
704 |
95 |
|
12-31-23 |
15.74 |
0.12•
|
4.11 |
4.23 |
0.17 |
1.82 |
— |
1.99 |
— |
17.98 |
26.90 |
1.09 |
1.07 |
1.07 |
0.69 |
549 |
75 |
|
12-31-22 |
21.97 |
0.13•
|
(3.47) |
(3.34) |
0.16 |
2.73 |
— |
2.89 |
— |
15.74 |
(15.08) |
1.08 |
1.06 |
1.06 |
0.69 |
413 |
56 |
|
12-31-21 |
28.88 |
0.15•
|
8.03 |
8.18 |
0.22 |
14.87 |
— |
15.09 |
— |
21.97 |
28.52 |
1.06 |
1.01 |
1.01 |
0.46 |
488 |
65 |
|
Voya Index Plus LargeCap Portfolio | |||||||||||||||||
|
Class ADV |
|
|
|
|
|
|
|
|
|
|
|
|
|
|
|
|
|
|
12-31-25 |
29.63 |
0.04• |
3.67 |
3.71 |
0.06 |
3.12 |
— |
3.18 |
— |
30.16 |
14.62 |
1.05 |
1.05 |
1.05 |
0.15 |
1,360 |
63 |
|
12-31-24 |
25.09 |
0.08•
|
5.89 |
5.97 |
0.12 |
1.31 |
— |
1.43 |
— |
29.63 |
24.57 |
1.05 |
1.05 |
1.05 |
0.29 |
1,318 |
59 |
|
12-31-23 |
20.58 |
0.11•
|
5.02 |
5.13 |
0.10 |
0.51 |
— |
0.61 |
— |
25.09 |
25.42 |
1.07 |
1.05 |
1.05 |
0.49 |
1,314 |
59 |
|
12-31-22 |
34.59 |
0.10•
|
(6.73) |
(6.63) |
0.09 |
7.29 |
— |
7.38 |
— |
20.58 |
(19.44) |
1.07 |
1.05 |
1.05 |
0.40 |
1,098 |
57 |
|
12-31-21 |
29.04 |
0.08•
|
7.82 |
7.90 |
0.21 |
2.14 |
— |
2.35 |
— |
34.59 |
28.62 |
1.07 |
1.05 |
1.05 |
0.26 |
1,564 |
60 |
|
Class I |
|
|
|
|
|
|
|
|
|
|
|
|
|
|
|
|
|
|
12-31-25 |
30.23 |
0.19• |
3.74 |
3.93 |
0.23 |
3.12 |
— |
3.35 |
— |
30.81 |
15.20 |
0.55 |
0.55 |
0.55 |
0.66 |
884,169 |
63 |
|
12-31-24 |
25.56 |
0.22•
|
6.01 |
6.23 |
0.25 |
1.31 |
— |
1.56 |
— |
30.23 |
25.20 |
0.55 |
0.55 |
0.55 |
0.80 |
828,114 |
59 |
|
12-31-23 |
20.96 |
0.23•
|
5.11 |
5.34 |
0.22 |
0.51 |
— |
0.73 |
— |
25.56 |
26.07 |
0.57 |
0.55 |
0.55 |
0.99 |
707,743 |
59 |
|
12-31-22 |
35.11 |
0.22•
|
(6.83) |
(6.61) |
0.25 |
7.29 |
— |
7.54 |
— |
20.96 |
(19.04) |
0.57 |
0.55 |
0.55 |
0.91 |
617,825 |
57 |
|
12-31-21 |
29.43 |
0.24•
|
7.92 |
8.16 |
0.34 |
2.14 |
— |
2.48 |
— |
35.11 |
29.25 |
0.57 |
0.55 |
0.55 |
0.76 |
829,418 |
60 |
|
Class S |
|
|
|
|
|
|
|
|
|
|
|
|
|
|
|
|
|
|
12-31-25 |
29.80 |
0.12• |
3.67 |
3.79 |
0.15 |
3.12 |
— |
3.27 |
— |
30.32 |
14.89 |
0.80 |
0.80 |
0.80 |
0.42 |
14,433 |
63 |
|
12-31-24 |
25.21 |
0.15•
|
5.93 |
6.08 |
0.18 |
1.31 |
— |
1.49 |
— |
29.80 |
24.92 |
0.80 |
0.80 |
0.80 |
0.54 |
4,487 |
59 |
|
12-31-23 |
20.68 |
0.17•
|
5.03 |
5.20 |
0.16 |
0.51 |
— |
0.67 |
— |
25.21 |
25.71 |
0.82 |
0.80 |
0.80 |
0.74 |
98,350 |
59 |
|
12-31-22 |
34.72 |
0.16•
|
(6.75) |
(6.59) |
0.16 |
7.29 |
— |
7.45 |
— |
20.68 |
(19.23) |
0.82 |
0.80 |
0.80 |
0.65 |
89,855 |
57 |
|
12-31-21 |
29.13 |
0.16•
|
7.84 |
8.00 |
0.27 |
2.14 |
— |
2.41 |
— |
34.72 |
28.94 |
0.82 |
0.80 |
0.80 |
0.51 |
131,883 |
60 |
See Accompanying Notes to Financial Highlights
84
FINANCIAL HIGHLIGHTS (continued)
Selected data for a share of capital stock outstanding throughout each year or period.
|
|
|
Income (loss)
from
investment
operations |
|
Less distributions |
|
|
|
|
Ratios to average net
assets |
Supplemental
data | |||||||
|
|
Net asset value, beginning
of year or period |
Net investment income (loss) |
Net realized and unrealized
gain (loss) |
Total from investment
operations |
From net investment income |
From net realized gains |
From return of capital |
Total distributions |
Payment from affiliate |
Net asset value, end of year or period |
Total Return(1) |
Expenses before
reductions/additions(2)(3)(4) |
Expenses net of fee waivers
and/or recoupments, if any(2)(3)(4) |
Expenses net of all
reductions/additions(2)(3)(4) |
Net investment income
(loss)(2)(3) |
Net assets, end of year or period |
Portfolio turnover rate |
|
Year or Period ended |
($) |
($) |
($) |
($) |
($) |
($) |
($) |
($) |
($) |
($) |
(%) |
(%) |
(%) |
(%) |
(%) |
($000's) |
(%) |
|
Voya Index Plus MidCap Portfolio | |||||||||||||||||
|
Class I |
|
|
|
|
|
|
|
|
|
|
|
|
|
|
|
|
|
|
12-31-25 |
21.28 |
0.17• |
1.34 |
1.51 |
0.13 |
1.47 |
— |
1.60 |
— |
21.19 |
8.16 |
0.63 |
0.60 |
0.60 |
0.85 |
723,300 |
71 |
|
12-31-24 |
19.29 |
0.19•
|
2.68 |
2.87 |
0.22 |
0.66 |
— |
0.88 |
— |
21.28 |
15.17 |
0.66 |
0.60 |
0.60 |
0.95 |
462,353 |
60 |
|
12-31-23 |
17.31 |
0.20•
|
2.68 |
2.88 |
0.20 |
0.70 |
— |
0.90 |
— |
19.29 |
17.52 |
0.68 |
0.60 |
0.60 |
1.13 |
437,514 |
58 |
|
12-31-22 |
26.18 |
0.20•
|
(4.04) |
(3.84) |
0.21 |
4.82 |
— |
5.03 |
— |
17.31 |
(14.29) |
0.68 |
0.60 |
0.60 |
1.02 |
403,373 |
58 |
|
12-31-21 |
20.75 |
0.20•
|
5.52 |
5.72 |
0.21 |
0.08 |
— |
0.29 |
— |
26.18 |
27.74 |
0.68 |
0.60 |
0.60 |
0.81 |
517,075 |
63 |
|
Class S |
|
|
|
|
|
|
|
|
|
|
|
|
|
|
|
|
|
|
12-31-25 |
20.78 |
0.12• |
1.31 |
1.43 |
0.09 |
1.47 |
— |
1.56 |
— |
20.65 |
7.89 |
0.88 |
0.85 |
0.85 |
0.60 |
17,850 |
71 |
|
12-31-24 |
18.85 |
0.14•
|
2.62 |
2.76 |
0.17 |
0.66 |
— |
0.83 |
— |
20.78 |
14.92 |
0.91 |
0.85 |
0.85 |
0.70 |
42,410 |
60 |
|
12-31-23 |
16.93 |
0.15•
|
2.62 |
2.77 |
0.15 |
0.70 |
— |
0.85 |
— |
18.85 |
17.20 |
0.93 |
0.85 |
0.85 |
0.88 |
49,355 |
58 |
|
12-31-22 |
25.71 |
0.15•
|
(3.98) |
(3.83) |
0.13 |
4.82 |
— |
4.95 |
— |
16.93 |
(14.51) |
0.93 |
0.85 |
0.85 |
0.77 |
50,396 |
58 |
|
12-31-21 |
20.38 |
0.13•
|
5.44 |
5.57 |
0.16 |
0.08 |
— |
0.24 |
— |
25.71 |
27.49 |
0.93 |
0.85 |
0.85 |
0.56 |
70,637 |
63 |
|
Voya Index Plus SmallCap Portfolio | |||||||||||||||||
|
Class I |
|
|
|
|
|
|
|
|
|
|
|
|
|
|
|
|
|
|
12-31-25 |
22.78 |
0.22• |
1.41 |
1.63 |
0.15 |
1.17 |
— |
1.32 |
— |
23.10 |
8.27 |
0.64 |
0.60 |
0.60 |
1.04 |
348,002 |
76 |
|
12-31-24 |
21.95 |
0.25•
|
1.59 |
1.84 |
0.28 |
0.73 |
— |
1.01 |
— |
22.78 |
8.69 |
0.68 |
0.60 |
0.60 |
1.13 |
199,103 |
59 |
|
12-31-23 |
19.52 |
0.25•
|
3.10 |
3.35 |
0.22 |
0.71 |
— |
0.93 |
— |
21.95 |
18.21 |
0.70 |
0.60 |
0.60 |
1.27 |
198,371 |
57 |
|
12-31-22 |
27.28 |
0.19•
|
(4.07) |
(3.88) |
0.22 |
3.66 |
— |
3.88 |
— |
19.52 |
(14.00) |
0.69 |
0.60 |
0.60 |
0.89 |
181,927 |
57 |
|
12-31-21 |
21.39 |
0.23•
|
5.84 |
6.07 |
0.18 |
— |
— |
0.18 |
— |
27.28 |
28.45 |
0.69 |
0.60 |
0.60 |
0.91 |
227,944 |
63 |
|
Class S |
|
|
|
|
|
|
|
|
|
|
|
|
|
|
|
|
|
|
12-31-25 |
22.42 |
0.16• |
1.43 |
1.59 |
0.09 |
1.17 |
— |
1.26 |
— |
22.75 |
8.12 |
0.89 |
0.85 |
0.85 |
0.78 |
7,212 |
76 |
|
12-31-24 |
21.62 |
0.19•
|
1.56 |
1.75 |
0.22 |
0.73 |
— |
0.95 |
— |
22.42 |
8.39 |
0.93 |
0.85 |
0.85 |
0.88 |
30,472 |
59 |
|
12-31-23 |
19.23 |
0.20•
|
3.05 |
3.25 |
0.16 |
0.71 |
— |
0.87 |
— |
21.62 |
17.89 |
0.95 |
0.85 |
0.85 |
1.01 |
36,515 |
57 |
|
12-31-22 |
26.91 |
0.14•
|
(4.01) |
(3.87) |
0.15 |
3.66 |
— |
3.81 |
— |
19.23 |
(14.20) |
0.94 |
0.85 |
0.85 |
0.64 |
37,556 |
57 |
|
12-31-21 |
21.11 |
0.16•
|
5.77 |
5.93 |
0.13 |
— |
— |
0.13 |
— |
26.91 |
28.13 |
0.94 |
0.85 |
0.85 |
0.65 |
51,234 |
63 |
|
Voya Intermediate Bond Portfolio | |||||||||||||||||
|
Class ADV |
|
|
|
|
|
|
|
|
|
|
|
|
|
|
|
|
|
|
12-31-25 |
10.62 |
0.46• |
0.29 |
0.75 |
0.45 |
— |
— |
0.45 |
— |
10.92 |
7.21 |
1.18 |
1.03 |
1.03 |
4.29 |
179,349 |
117 |
|
12-31-24 |
10.82 |
0.43•
|
(0.19) |
0.24 |
0.44 |
— |
— |
0.44 |
— |
10.62 |
2.28 |
1.10 |
1.03 |
1.03 |
4.00 |
180,921 |
240 |
|
12-31-23 |
10.51 |
0.39•
|
0.31 |
0.70 |
0.39 |
— |
— |
0.39 |
— |
10.82 |
6.78 |
1.09 |
1.03 |
1.03 |
3.71 |
193,771 |
278 |
|
12-31-22 |
12.68 |
0.28•
|
(2.16) |
(1.88) |
0.29 |
— |
— |
0.29 |
— |
10.51 |
(14.90) |
1.08 |
1.03 |
1.03 |
2.51 |
203,733 |
246 |
|
12-31-21 |
13.19 |
0.26•
|
(0.44) |
(0.18) |
0.25 |
0.00* |
0.08 |
0.33 |
— |
12.68 |
(1.42) |
1.07 |
1.03 |
1.03 |
2.01 |
284,547 |
139 |
|
Class I |
|
|
|
|
|
|
|
|
|
|
|
|
|
|
|
|
|
|
12-31-25 |
10.74 |
0.52• |
0.29 |
0.81 |
0.51 |
— |
— |
0.51 |
— |
11.04 |
7.71 |
0.68 |
0.53 |
0.53 |
4.80 |
676,929 |
117 |
|
12-31-24 |
10.94 |
0.49•
|
(0.19) |
0.30 |
0.50 |
— |
— |
0.50 |
— |
10.74 |
2.82 |
0.60 |
0.53 |
0.53 |
4.50 |
658,204 |
240 |
|
12-31-23 |
10.63 |
0.45•
|
0.30 |
0.75 |
0.44 |
— |
— |
0.44 |
— |
10.94 |
7.28 |
0.59 |
0.53 |
0.53 |
4.21 |
712,402 |
278 |
|
12-31-22 |
12.82 |
0.34•
|
(2.18) |
(1.84) |
0.35 |
— |
— |
0.35 |
— |
10.63 |
(14.44) |
0.58 |
0.53 |
0.53 |
3.02 |
727,981 |
246 |
|
12-31-21 |
13.33 |
0.33•
|
(0.45) |
(0.12) |
0.31 |
0.00* |
0.08 |
0.39 |
— |
12.82 |
(0.88) |
0.57 |
0.53 |
0.53 |
2.51 |
976,144 |
139 |
See Accompanying Notes to Financial Highlights
85
FINANCIAL HIGHLIGHTS (continued)
Selected data for a share of capital stock outstanding throughout each year or period.
|
|
|
Income (loss)
from
investment
operations |
|
Less distributions |
|
|
|
|
Ratios to average net
assets |
Supplemental
data | |||||||
|
|
Net asset value, beginning
of year or period |
Net investment income (loss) |
Net realized and unrealized
gain (loss) |
Total from investment
operations |
From net investment income |
From net realized gains |
From return of capital |
Total distributions |
Payment from affiliate |
Net asset value, end of year or period |
Total Return(1) |
Expenses before
reductions/additions(2)(3)(4) |
Expenses net of fee waivers
and/or recoupments, if any(2)(3)(4) |
Expenses net of all
reductions/additions(2)(3)(4) |
Net investment income
(loss)(2)(3) |
Net assets, end of year or period |
Portfolio turnover rate |
|
Year or Period ended |
($) |
($) |
($) |
($) |
($) |
($) |
($) |
($) |
($) |
($) |
(%) |
(%) |
(%) |
(%) |
(%) |
($000's) |
(%) |
|
Class S |
|
|
|
|
|
|
|
|
|
|
|
|
|
|
|
|
|
|
12-31-25 |
10.67 |
0.49• |
0.29 |
0.78 |
0.48 |
— |
— |
0.48 |
— |
10.97 |
7.46 |
0.93 |
0.78 |
0.78 |
4.54 |
58,545 |
117 |
|
12-31-24 |
10.87 |
0.46•
|
(0.19) |
0.27 |
0.47 |
— |
— |
0.47 |
— |
10.67 |
2.55 |
0.85 |
0.78 |
0.78 |
4.28 |
60,945 |
240 |
|
12-31-23 |
10.56 |
0.42•
|
0.30 |
0.72 |
0.41 |
— |
— |
0.41 |
— |
10.87 |
7.03 |
0.84 |
0.78 |
0.78 |
3.96 |
1,401,595 |
278 |
|
12-31-22 |
12.74 |
0.31•
|
(2.17) |
(1.86) |
0.32 |
— |
— |
0.32 |
— |
10.56 |
(14.68) |
0.83 |
0.78 |
0.78 |
2.77 |
1,481,569 |
246 |
|
12-31-21 |
13.24 |
0.29•
|
(0.43) |
(0.14) |
0.28 |
0.00* |
0.08 |
0.36 |
— |
12.74 |
(1.07) |
0.82 |
0.78 |
0.78 |
2.26 |
1,956,289 |
139 |
|
Class S2 |
|
|
|
|
|
|
|
|
|
|
|
|
|
|
|
|
|
|
12-31-25 |
10.62 |
0.47• |
0.29 |
0.76 |
0.46 |
— |
— |
0.46 |
— |
10.92 |
7.32 |
1.08 |
0.93 |
0.93 |
4.39 |
7,851 |
117 |
|
12-31-24 |
10.82 |
0.44•
|
(0.19) |
0.25 |
0.45 |
— |
— |
0.45 |
— |
10.62 |
2.38 |
1.00 |
0.93 |
0.93 |
4.10 |
8,187 |
240 |
|
12-31-23 |
10.51 |
0.40•
|
0.31 |
0.71 |
0.40 |
— |
— |
0.40 |
— |
10.82 |
6.89 |
0.99 |
0.93 |
0.93 |
3.81 |
8,030 |
278 |
|
12-31-22 |
12.69 |
0.29•
|
(2.17) |
(1.88) |
0.30 |
— |
— |
0.30 |
— |
10.51 |
(14.88) |
0.98 |
0.93 |
0.93 |
2.56 |
7,618 |
246 |
|
12-31-21 |
13.19 |
0.27•
|
(0.43) |
(0.16) |
0.26 |
0.00* |
0.08 |
0.34 |
— |
12.69 |
(1.24) |
0.97 |
0.93 |
0.93 |
2.11 |
15,571 |
139 |
|
Voya Small Company Portfolio | |||||||||||||||||
|
Class ADV |
|
|
|
|
|
|
|
|
|
|
|
|
|
|
|
|
|
|
12-31-25 |
14.33 |
0.01• |
0.79 |
0.80 |
0.10 |
2.18 |
— |
2.28 |
— |
12.85 |
8.03 |
1.44 |
1.37 |
1.37 |
0.10 |
8,783 |
111 |
|
12-31-24 |
13.56 |
0.07•
|
1.23 |
1.30 |
0.08 |
0.45 |
— |
0.53 |
— |
14.33 |
10.00 |
1.42 |
1.36 |
1.36 |
0.51 |
8,698 |
183 |
|
12-31-23 |
11.56 |
0.04•
|
1.97 |
2.01 |
0.01 |
— |
— |
0.01 |
— |
13.56 |
17.37 |
1.45 |
1.36 |
1.36 |
0.36 |
8,712 |
193 |
|
12-31-22 |
19.74 |
(0.01)•
|
(3.40) |
(3.41) |
— |
4.77 |
— |
4.77 |
— |
11.56 |
(17.04) |
1.46 |
1.38 |
1.38 |
(0.05) |
7,493 |
209 |
|
12-31-21 |
17.36 |
(0.10)•
|
2.56 |
2.46 |
— |
0.08 |
— |
0.08 |
— |
19.74 |
14.19 |
1.49 |
1.40 |
1.40 |
(0.52) |
8,826 |
129 |
|
Class I |
|
|
|
|
|
|
|
|
|
|
|
|
|
|
|
|
|
|
12-31-25 |
16.03 |
0.08• |
0.93 |
1.01 |
0.17 |
2.18 |
— |
2.35 |
— |
14.69 |
8.59 |
0.94 |
0.87 |
0.87 |
0.58 |
184,579 |
111 |
|
12-31-24 |
15.09 |
0.15•
|
1.38 |
1.53 |
0.14 |
0.45 |
— |
0.59 |
— |
16.03 |
10.56 |
0.92 |
0.86 |
0.86 |
1.01 |
215,963 |
183 |
|
12-31-23 |
12.85 |
0.11•
|
2.19 |
2.30 |
0.06 |
— |
— |
0.06 |
— |
15.09 |
18.00 |
0.95 |
0.86 |
0.86 |
0.84 |
225,540 |
193 |
|
12-31-22 |
21.22 |
0.06•
|
(3.66) |
(3.60) |
— |
4.77 |
— |
4.77 |
— |
12.85 |
(16.68) |
0.96 |
0.88 |
0.88 |
0.42 |
226,999 |
209 |
|
12-31-21 |
18.59 |
(0.01)•
|
2.75 |
2.74 |
0.03 |
0.08 |
— |
0.11 |
— |
21.22 |
14.76 |
0.99 |
0.90 |
0.90 |
(0.03) |
344,506 |
129 |
|
Class R6 |
|
|
|
|
|
|
|
|
|
|
|
|
|
|
|
|
|
|
12-31-25 |
16.06 |
0.07• |
0.94 |
1.01 |
0.18 |
2.18 |
— |
2.36 |
— |
14.71 |
8.62 |
0.80 |
0.80 |
0.80 |
0.51 |
2,196 |
111 |
|
12-31-24 |
15.11 |
0.17•
|
1.38 |
1.55 |
0.15 |
0.45 |
— |
0.60 |
— |
16.06 |
10.69 |
0.79 |
0.79 |
0.79 |
1.10 |
7,892 |
183 |
|
12-31-23 |
12.87 |
0.12•
|
2.19 |
2.31 |
0.07 |
— |
— |
0.07 |
— |
15.11 |
18.05 |
0.80 |
0.80 |
0.80 |
0.92 |
5,042 |
193 |
|
12-31-22 |
21.23 |
0.07•
|
(3.66) |
(3.59) |
— |
4.77 |
— |
4.77 |
— |
12.87 |
(16.62) |
0.83 |
0.83 |
0.83 |
0.45 |
8,465 |
209 |
|
12-31-21 |
18.60 |
0.00*•
|
2.74 |
2.74 |
0.03 |
0.08 |
— |
0.11 |
— |
21.23 |
14.77 |
0.87 |
0.87 |
0.87 |
0.00* |
14,790 |
129 |
|
Class S |
|
|
|
|
|
|
|
|
|
|
|
|
|
|
|
|
|
|
12-31-25 |
15.23 |
0.01• |
1.13 |
1.14 |
0.11 |
2.18 |
— |
2.29 |
— |
14.08 |
10.15 |
1.18 |
1.11 |
1.11 |
0.09 |
762 |
111 |
|
12-31-24 |
14.36 |
0.11•
|
1.31 |
1.42 |
0.10 |
0.45 |
— |
0.55 |
— |
15.23 |
10.34 |
1.17 |
1.11 |
1.11 |
0.76 |
58,884 |
183 |
|
12-31-23 |
12.23 |
0.08•
|
2.08 |
2.16 |
0.03 |
— |
— |
0.03 |
— |
14.36 |
17.68 |
1.20 |
1.11 |
1.11 |
0.60 |
64,320 |
193 |
|
12-31-22 |
20.51 |
0.03•
|
(3.54) |
(3.51) |
— |
4.77 |
— |
4.77 |
— |
12.23 |
(16.86) |
1.21 |
1.13 |
1.13 |
0.18 |
59,003 |
209 |
|
12-31-21 |
17.99 |
(0.06)•
|
2.66 |
2.60 |
— |
0.08 |
— |
0.08 |
— |
20.51 |
14.47 |
1.24 |
1.15 |
1.15 |
(0.28) |
80,449 |
129 |
See Accompanying Notes to Financial Highlights
86
ACCOMPANYING NOTES TO FINANCIAL HIGHLIGHTS
(1)
Total return is calculated assuming reinvestment of all dividends, capital gain distributions, and return of capital distributions, if any, at net asset value and does not reflect the effect of insurance contract charges. Total return for periods less than one year is not annualized.
(2)
Annualized for periods less than one year.
(3)
Ratios reflect operating expenses of a Portfolio. Expenses before reductions/additions do not reflect amounts reimbursed or recouped by the Investment Adviser and/or the Distributor or reductions from brokerage service arrangements or other expense offset arrangements and do not represent the amount paid by a Portfolio during periods when reimbursements or reductions occur. Expenses net of fee waivers reflect expenses after reimbursement by the Investment Adviser and/or the Distributor or recoupment of previously reimbursed fees by the Investment Adviser, but prior to reductions from brokerage service arrangements or other expense offset arrangements. Expenses net of all reductions/additions represent the net expenses paid by a Portfolio. Net investment income (loss) is net of all such additions or reductions.
(4)
Ratios do not include fees and expenses charged under the variable annuity contract or variable life insurance policy.
*
Amount is less than $0.005 or 0.005% or more than $(0.005) or (0.005)%.
•
Calculated using average number of shares outstanding throughout the year or period.
87
TO OBTAIN MORE INFORMATION
You will find more information about the Portfolios in our:
ANNUAL/SEMI-ANNUAL SHAREHOLDER REPORTS AND FORM N-CSR
In each Portfolio’s annual shareholder report, you will find a discussion of the market conditions and investment strategies that significantly affected the Portfolio’s performance during its last fiscal year. In a Portfolio’s Form N-CSR, you will find the Portfolio’s financial statements.
STATEMENT OF ADDITIONAL INFORMATION
The SAI contains additional information about the Portfolios. The SAI is legally part of this Prospectus (it is incorporated by reference). A copy has been filed with the SEC.
Please write, call, or visit our website for a free copy of the current annual/semi-annual shareholder reports, the SAI, or other Portfolio information.
To make shareholder inquiries contact:
Voya Investment Management
7337 East Doubletree Ranch Road, Suite 100
Scottsdale, Arizona 85258
Scottsdale, Arizona 85258
1-800-992-0180
or visit our website at www.voyainvestments.com
Reports and other information about the Portfolios are available on the EDGAR Database on the SEC's Internet website at https://www.sec.gov, and copies of this information may be obtained, upon payment of a duplicating fee, by electronic request at the following e-mail address: publicinfo@sec.gov.
When contacting the SEC, you will want to refer to the Portfolios' SEC file numbers. The file numbers are as follows:
|
Voya Government Money Market Portfolio |
811-02565 |
|
Voya Government Money Market Portfolio | |
|
Voya Intermediate Bond Portfolio |
811-02361 |
|
Voya Intermediate Bond Portfolio |
|
|
Voya Variable Funds |
811-02514 |
|
Voya Growth and Income Portfolio | |
|
Voya Variable Portfolios, Inc. |
811-07651 |
|
Voya Global High Dividend Low Volatility Portfolio
Voya Index Plus LargeCap Portfolio
Voya Index Plus MidCap Portfolio
Voya Index Plus SmallCap Portfolio
Voya Small Company Portfolio | |
PRO-2514(0526-050126)
