The following performance information provides some indication of the risks of investing in the fund. The fund’s performance information represents only past performance and is not necessarily an indication of future results.
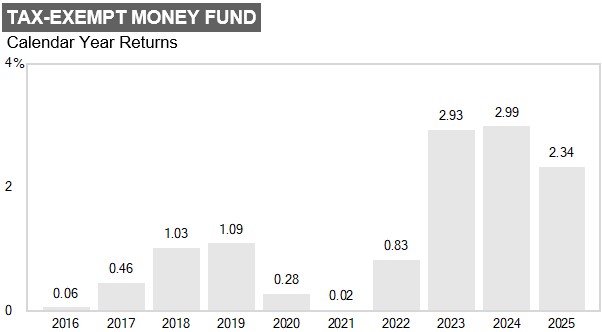
The following bar chart illustrates how much returns can differ from year to year by showing calendar year returns and the best and worst calendar quarter returns during those years for the fund’s Investor Class. Returns for other share classes vary since they have different expenses.
| Quarter Ended | Total Return |
Quarter Ended | Total Return |
|||||
| Best Quarter | 12/31/23 | 0.82% | Worst Quarter | 3/31/21 | 0.00% |
The following table shows the average annual total returns for each class of the fund that has been in operation for at least one full calendar year. In addition, the table also includes a comparative index that has investment characteristics similar to those of the fund.
Average Annual Total Returns
| Periods ended | ||||||||||||||
| December 31, 2025 | ||||||||||||||
| Since | Inception | |||||||||||||
| 1 Year | 5 Years | 10 Years | inception | date | ||||||||||
| Investor Class | 04/08/1981 | |||||||||||||
| 2.34 | % | 1.81 | % | 1.20 | % | — | % | |||||||
| I Class | 07/06/2017 | |||||||||||||
| 2.55 | 1.96 | — | 1.50 | |||||||||||
| Lipper Tax-Exempt Money Market Funds Average | ||||||||||||||
| 2.28 | 1.76 | 1.18 | 1.33 | a | ||||||||||
| a | Return since 6/30/17. |
Updated performance information is available through troweprice.com.