Pay vs Performance Disclosure - USD ($)
|
12 Months Ended |
Dec. 31, 2025 |
Dec. 31, 2024 |
Dec. 31, 2023 |
| Pay vs Performance Disclosure [Table] |
|
|
|
|
| Pay vs Performance [Table Text Block] |
|
| Year |
|
Summary
Compensation Table Total for PEO |
|
|
Compensation
Actually Paid to PEO (1) |
|
|
Average
Summary Compensation Table Total for Non-PEO NEOs |
|
|
Average
Compensation Actually Paid to Non-PEO NEOs (1) |
|
|
Total
Shareholder Return |
|
|
Net
Income / (Loss)
(in
thousands) |
|
| 2025 |
|
$ |
3,991,516 |
|
|
$ |
4,036,175 |
|
|
$ |
1,559,395 |
|
|
$ |
1,563,969 |
|
|
$ |
171.10 |
|
|
$ |
71,183 |
|
| 2024 |
|
$ |
3,506,708 |
|
|
$ |
3,988,235 |
|
|
$ |
1,452,218 |
|
|
$ |
1,622,252 |
|
|
$ |
180.84 |
|
|
$ |
(63,734 |
) |
| 2023 |
|
$ |
2,847,442 |
|
|
$ |
3,458,338 |
|
|
$ |
1,331,015 |
|
|
$ |
1,588,304 |
|
|
$ |
162.66 |
|
|
$ |
(54,188 |
) |
|
|
|
| PEO Total Compensation Amount |
|
$ 3,991,516
|
$ 3,506,708
|
$ 2,847,442
|
| PEO Actually Paid Compensation Amount |
[1] |
$ 4,036,175
|
3,988,235
|
3,458,338
|
| Adjustment To PEO Compensation, Footnote [Text Block] |
|
Reconciliation
of Summary Compensation Table Total to Compensation Actually Paid for PEO
| Year | |
2025 | |
| Summary Compensation Table Total | |
$ | 3,991,516 | |
| (Minus): Grant Date Fair Value of Equity Awards Granted in Fiscal Year | |
$ | (2,472,698 | ) |
| Plus: Fair Value at Fiscal Year End of Outstanding and Unvested Equity Awards Granted in the Fiscal Year | |
$ | 2,510,812 | |
| Plus/(Minus): Change in Fair Value of Outstanding and Unvested Equity Awards Granted in Prior Fiscal Years | |
$ | (130,123 | ) |
| Plus/(Minus): Change in Fair Value as of the Vesting Date of Equity Awards Granted in Prior Fiscal Years that Vested in the Fiscal Year | |
$ | 136,668 | |
| (Minus): Fair Value as of the Prior Fiscal Year End of Equity Awards Granted in Prior Fiscal Years that Failed to Meet Vesting Conditions in the Fiscal Year | |
$ | 0 | |
| Compensation Actually Paid | |
$ | 4,036,175 | |
|
|
|
| Non-PEO NEO Average Total Compensation Amount |
|
$ 1,559,395
|
1,452,218
|
1,331,015
|
| Non-PEO NEO Average Compensation Actually Paid Amount |
[1] |
$ 1,563,969
|
1,622,252
|
1,588,304
|
| Adjustment to Non-PEO NEO Compensation Footnote [Text Block] |
|
Reconciliation
of Summary Compensation Table Total to Compensation Actually Paid for Non-PEO NEOs
| Year |
|
2025 |
|
| Summary
Compensation Table Total |
|
$ |
1,559,395 |
|
| (Minus):
Grant Date Fair Value of Equity Awards Granted in Fiscal Year |
|
$ |
(718,200 |
) |
| Plus:
Fair Value at Fiscal Year End of Outstanding and Unvested Equity Awards Granted in the Fiscal Year |
|
$ |
720,538 |
|
| Plus/(Minus):
Change in Fair Value of Outstanding and Unvested Equity Awards Granted in Prior Fiscal Years |
|
$ |
(43,635) |
|
| Plus/(Minus):
Change in Fair Value as of the Vesting Date of Equity Awards Granted in Prior Fiscal Years that Vested in the Fiscal Year |
|
$ |
45,871 |
|
| (Minus):
Fair Value as of the Prior Fiscal Year End of Equity Awards Granted in Prior Fiscal Years that Failed to Meet Vesting Conditions
in the Fiscal Year |
|
$ |
0 |
|
| Compensation
Actually Paid |
|
$ |
1,563,969 |
|
|
|
|
| Compensation Actually Paid vs. Total Shareholder Return |
|
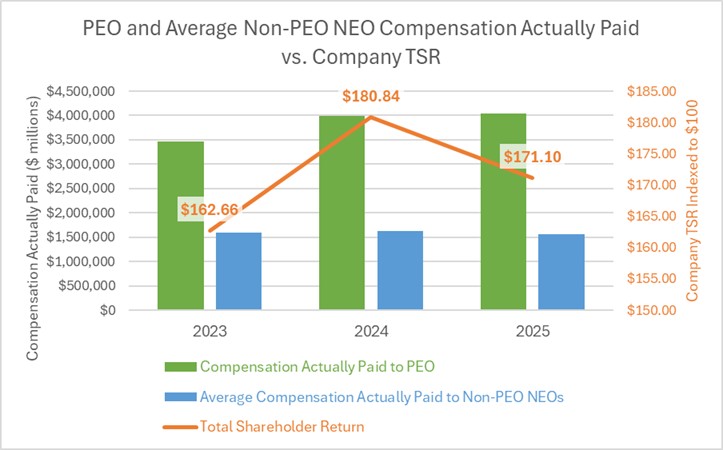
Description
of Relationship Between PEOs and Non-PEO NEO Compensation Actually Paid and Company Total Shareholder Return (“TSR”)
The
following chart sets forth the relationship between the average Compensation Actually Paid to our PEOs, the average of Compensation Actually
Paid to our Non-PEO NEOs, and the Company’s cumulative TSR over the three most recently completed fiscal years.
|
|
|
| Compensation Actually Paid vs. Net Income |
|
Description
of Relationship Between PEOs and Non-PEO NEO Compensation Actually Paid and Net Income
The
following chart sets forth the relationship between the average Compensation Actually Paid to our PEOs, the average of Compensation Actually
Paid to our Non-PEO NEOs, and our Net Income during the three most recently completed fiscal years.

|
|
|
| Total Shareholder Return Amount |
|
$ 171.10
|
180.84
|
162.66
|
| Net Income (Loss) Attributable to Parent |
|
71,183,000
|
$ (63,734,000)
|
$ (54,188,000)
|
| Minus Grant Date Fair Value of Equity Awards Granted in Fiscal Year [Member] | PEO [Member] |
|
|
|
|
| Pay vs Performance Disclosure [Table] |
|
|
|
|
| Adjustment to Compensation Amount |
|
(2,472,698)
|
|
|
| Minus Grant Date Fair Value of Equity Awards Granted in Fiscal Year [Member] | Non-PEO NEO [Member] |
|
|
|
|
| Pay vs Performance Disclosure [Table] |
|
|
|
|
| Adjustment to Compensation Amount |
|
(718,200)
|
|
|
| Plus Fair Value at Fiscal Year End of Outstanding and Unvested Equity Awards Granted in the Fiscal Year [Member] | PEO [Member] |
|
|
|
|
| Pay vs Performance Disclosure [Table] |
|
|
|
|
| Adjustment to Compensation Amount |
|
2,510,812
|
|
|
| Plus Fair Value at Fiscal Year End of Outstanding and Unvested Equity Awards Granted in the Fiscal Year [Member] | Non-PEO NEO [Member] |
|
|
|
|
| Pay vs Performance Disclosure [Table] |
|
|
|
|
| Adjustment to Compensation Amount |
|
720,538
|
|
|
| Plus Minus Change in Fair Value of Outstanding and Unvested Equity Awards Granted in Prior Fiscal Years [Member] | PEO [Member] |
|
|
|
|
| Pay vs Performance Disclosure [Table] |
|
|
|
|
| Adjustment to Compensation Amount |
|
(130,123)
|
|
|
| Plus Minus Change in Fair Value of Outstanding and Unvested Equity Awards Granted in Prior Fiscal Years [Member] | Non-PEO NEO [Member] |
|
|
|
|
| Pay vs Performance Disclosure [Table] |
|
|
|
|
| Adjustment to Compensation Amount |
|
(43,635)
|
|
|
| Plus Minus Change in Fair Value as of the Vesting Date of Equity Awards Granted in Prior Fiscal Years that Vested in the Fiscal Year [Member] | PEO [Member] |
|
|
|
|
| Pay vs Performance Disclosure [Table] |
|
|
|
|
| Adjustment to Compensation Amount |
|
136,668
|
|
|
| Plus Minus Change in Fair Value as of the Vesting Date of Equity Awards Granted in Prior Fiscal Years that Vested in the Fiscal Year [Member] | Non-PEO NEO [Member] |
|
|
|
|
| Pay vs Performance Disclosure [Table] |
|
|
|
|
| Adjustment to Compensation Amount |
|
45,871
|
|
|
| Minus Fair Value as of the Prior Fiscal Year End of Equity Awards Granted in Prior Fiscal Years that Failed to Meet Vesting Conditions in the Fiscal Year [Member] | PEO [Member] |
|
|
|
|
| Pay vs Performance Disclosure [Table] |
|
|
|
|
| Adjustment to Compensation Amount |
|
0
|
|
|
| Minus Fair Value as of the Prior Fiscal Year End of Equity Awards Granted in Prior Fiscal Years that Failed to Meet Vesting Conditions in the Fiscal Year [Member] | Non-PEO NEO [Member] |
|
|
|
|
| Pay vs Performance Disclosure [Table] |
|
|
|
|
| Adjustment to Compensation Amount |
|
0
|
|
|
| PEO [Member] |
|
|
|
|
| Pay vs Performance Disclosure [Table] |
|
|
|
|
| PEO Total Compensation Amount |
|
3,991,516
|
|
|
| PEO Actually Paid Compensation Amount |
|
4,036,175
|
|
|
| Non-PEO NEO [Member] |
|
|
|
|
| Pay vs Performance Disclosure [Table] |
|
|
|
|
| Non-PEO NEO Average Total Compensation Amount |
|
1,559,395
|
|
|
| Non-PEO NEO Average Compensation Actually Paid Amount |
|
$ 1,563,969
|
|
|
|
|