Shareholder Report
Feb. 28, 2026
USD ($)
$ / shares
WHAT
WERE THE FUND COSTS FOR THE LAST YEAR? (based
on a hypothetical $10,000 investment)
|
Class
Name |
Costs
of a $10,000 investment
|
Costs
paid as a percentage of a $10,000
investment |
|
Class
A |
$81
|
0.80%
|
HOW
DID THE FUND PERFORM LAST YEAR AND WHAT AFFECTED ITS PERFORMANCE?
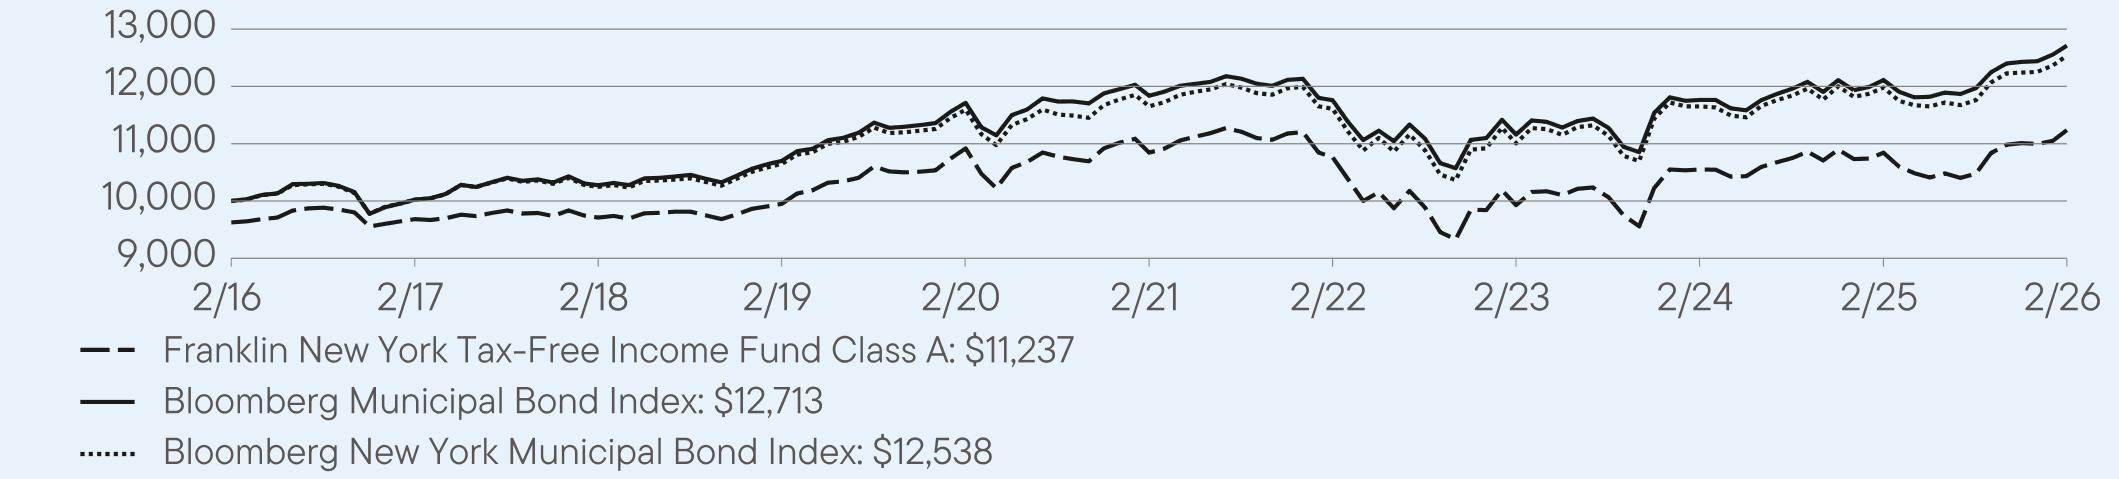
For the twelve months ended February
28, 2026, Class A shares of
Franklin New York Tax-Free Income Fund returned 3.63%.
The Fund compares its performance
to the Bloomberg New York Municipal Bond Index, which returned 4.65% for the same period.
PERFORMANCE
HIGHLIGHTS
|
Top
contributors to performance: | |
|
↑
|
Overweight
to bonds with no external credit rating |
|
↑
|
Overweight
to bonds with 20 years to maturity |
|
↑
|
Overweight
to A rated bonds |
|
Top
detractors from performance: | |
|
↓
|
Underweight
bonds with 10 years or less to maturity |
|
↓
|
Selection
in AA rated bonds |
|
↓
|
Selection
in A rated bonds |
AVERAGE
ANNUAL TOTAL RETURNS (%) Period
Ended February 28, 2026
|
|
1
Year |
5
Year |
10
Year |
|
Class
A |
3.63
|
0.71
|
1.57
|
|
Class
A (with sales charge) |
-0.25
|
-0.05
|
1.18
|
|
Bloomberg
Municipal Bond Index |
4.96
|
1.44
|
2.43
|
|
Bloomberg
New York Municipal Bond Index |
4.65
|
1.47
|
2.29
|
For current month-end performance,
please call Franklin Templeton at (800)
DIAL BEN/342-5236 or visit
https://www.franklintempleton.com/investments/options/mutual-funds.
https://www.franklintempleton.com/investments/options/mutual-funds.
Important data provider notices
and terms available at www.franklintempletondatasources.com.
KEY
FUND STATISTICS (as
of February 28, 2026)
|
Total
Net Assets |
$2,687,285,818
|
|
Total
Number of Portfolio Holdings |
450
|
|
Total
Management Fee Paid |
$12,319,831
|
|
Portfolio
Turnover Rate |
14.51%
|
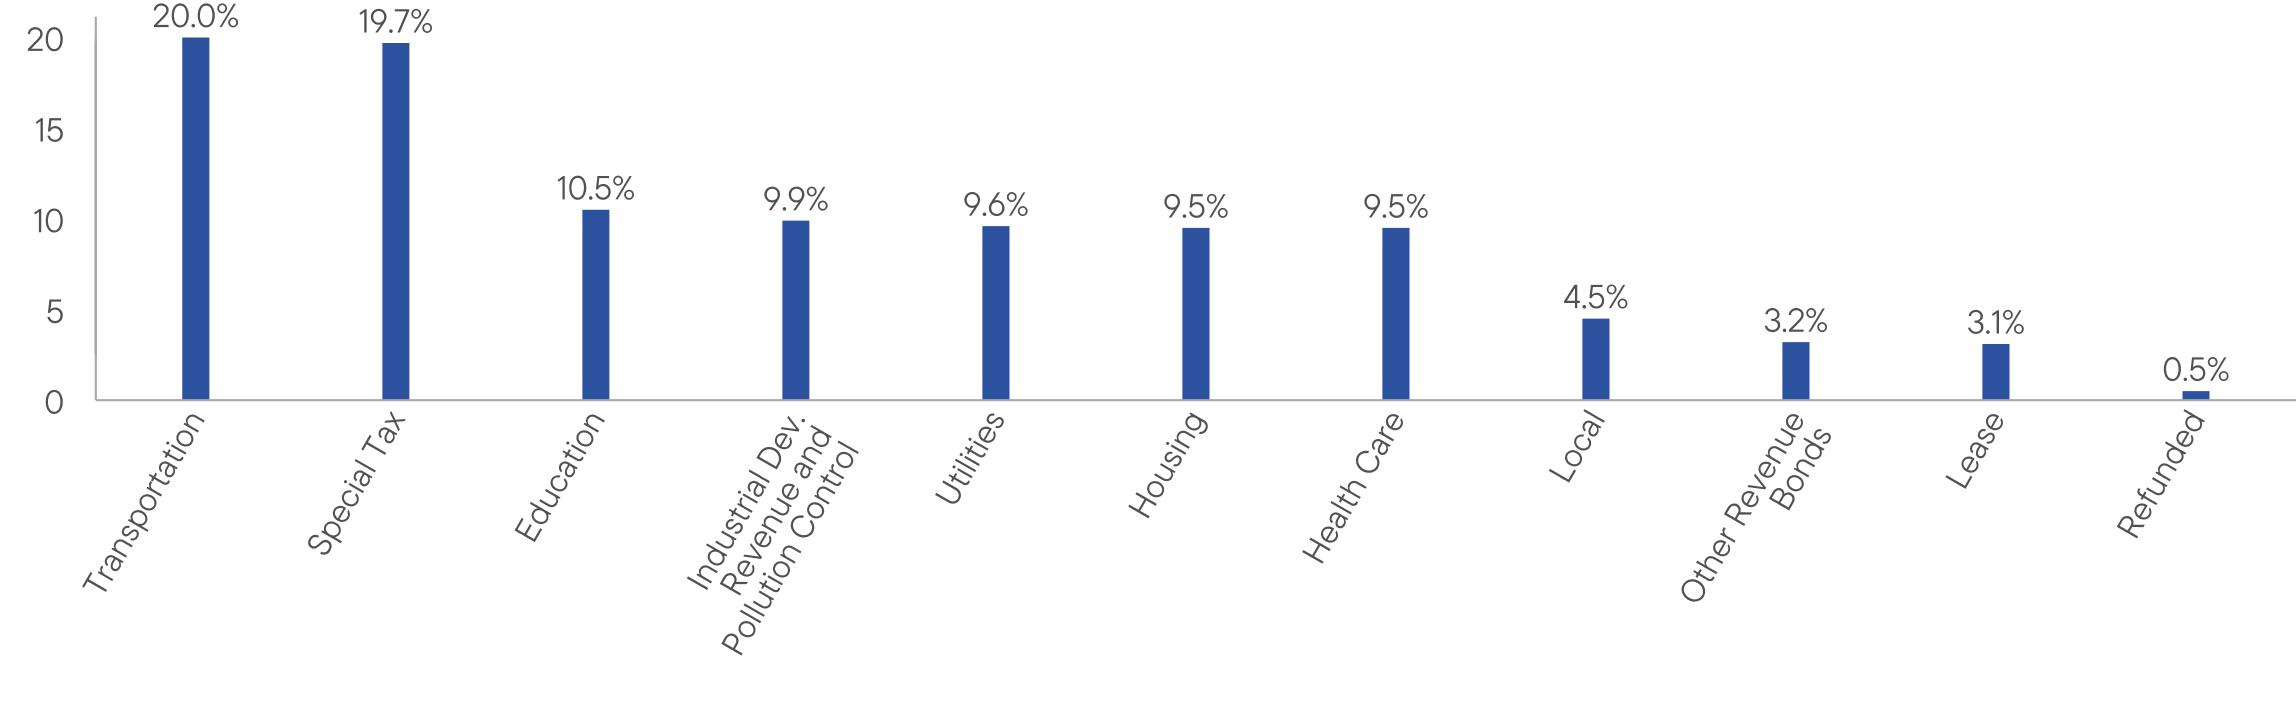
WHAT
DID THE FUND INVEST IN? (as
of February 28, 2026)
Portfolio Composition* (%
of Total Investments)

WHAT
WERE THE FUND COSTS FOR THE LAST YEAR? (based
on a hypothetical $10,000 investment)
|
Class
Name |
Costs
of a $10,000 investment
|
Costs
paid as a percentage of a $10,000
investment*
|
|
Class
A1 |
$66
|
0.65%
|
HOW
DID THE FUND PERFORM LAST YEAR AND WHAT AFFECTED ITS PERFORMANCE?
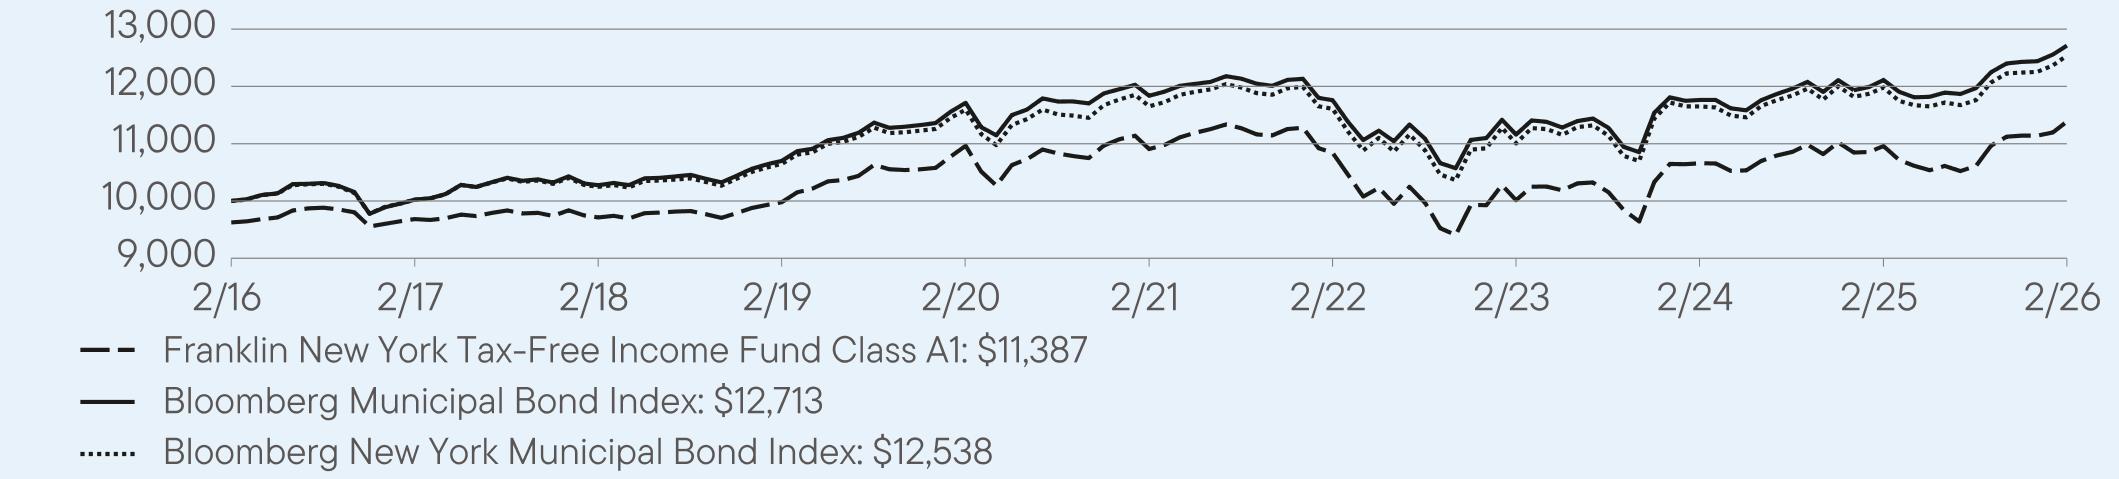
For the twelve months ended February
28, 2026, Class A1 shares of
Franklin New York Tax-Free Income Fund returned 3.89%.
The Fund compares its performance
to the Bloomberg New York Municipal Bond Index, which returned 4.65% for the same period.
PERFORMANCE
HIGHLIGHTS
|
Top
contributors to performance: | |
|
↑
|
Overweight
to bonds with no external credit rating |
|
↑
|
Overweight
to bonds with 20 years to maturity |
|
↑
|
Overweight
to A rated bonds |
|
Top
detractors from performance: | |
|
↓
|
Underweight
bonds with 10 years or less to maturity |
|
↓
|
Selection
in AA rated bonds |
|
↓
|
Selection
in A rated bonds |
AVERAGE
ANNUAL TOTAL RETURNS (%) Period
Ended February 28, 2026
|
|
1
Year |
5
Year |
10
Year |
|
Class
A1 |
3.89
|
0.86
|
1.70
|
|
Class
A1 (with sales charge) |
-0.02
|
0.09
|
1.31
|
|
Bloomberg
Municipal Bond Index |
4.96
|
1.44
|
2.43
|
|
Bloomberg
New York Municipal Bond Index |
4.65
|
1.47
|
2.29
|
For current month-end performance,
please call Franklin Templeton at (800)
DIAL BEN/342-5236 or visit
https://www.franklintempleton.com/investments/options/mutual-funds.
https://www.franklintempleton.com/investments/options/mutual-funds.
Important data provider notices
and terms available at www.franklintempletondatasources.com.
KEY
FUND STATISTICS (as
of February 28, 2026)
|
Total
Net Assets |
$2,687,285,818
|
|
Total
Number of Portfolio Holdings |
450
|
|
Total
Management Fee Paid |
$12,319,831
|
|
Portfolio
Turnover Rate |
14.51%
|
WHAT
DID THE FUND INVEST IN? (as
of February 28, 2026)
Portfolio Composition* (%
of Total Investments)
WHAT
WERE THE FUND COSTS FOR THE LAST YEAR? (based
on a hypothetical $10,000 investment)
|
Class
Name |
Costs
of a $10,000 investment
|
Costs
paid as a percentage of a $10,000
investment*
|
|
Class
C |
$122
|
1.20%
|
HOW
DID THE FUND PERFORM LAST YEAR AND WHAT AFFECTED ITS PERFORMANCE?
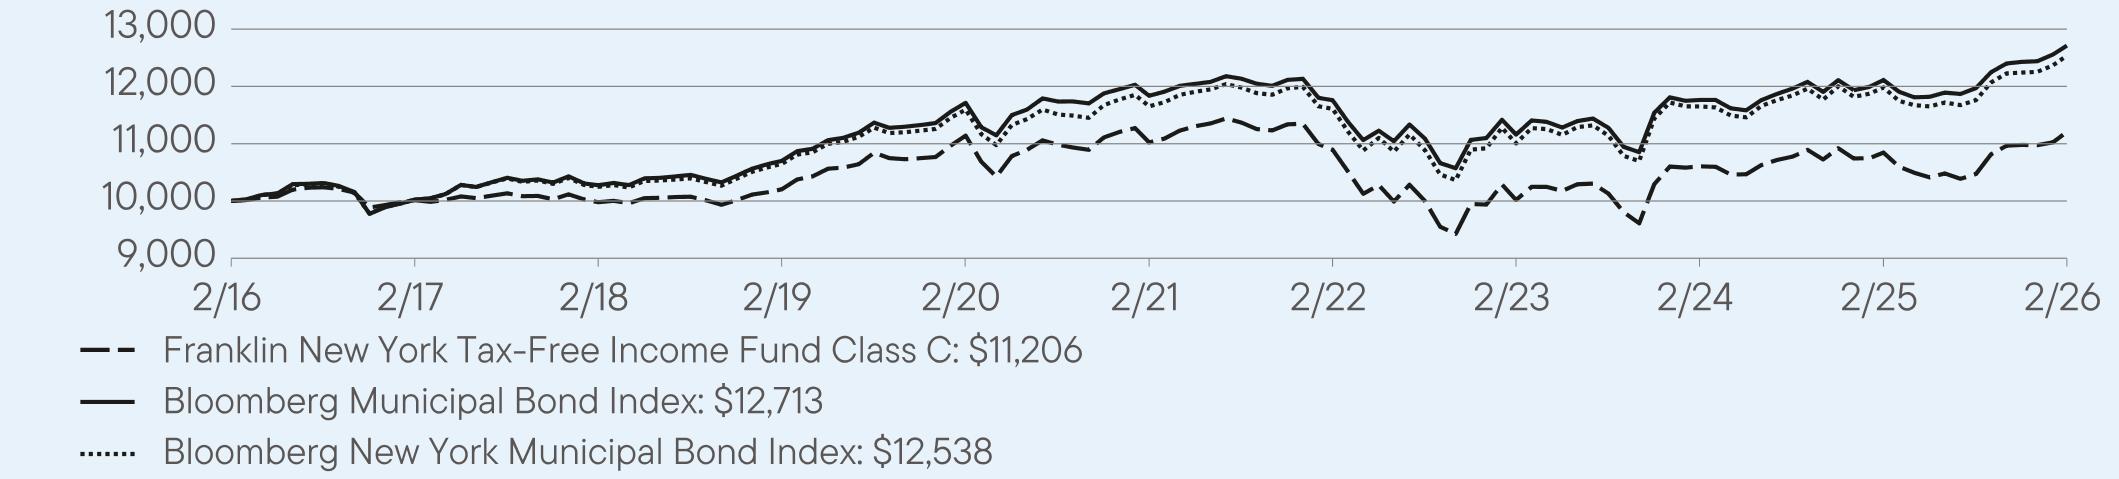
For the twelve months ended February
28, 2026, Class C shares of
Franklin New York Tax-Free Income Fund returned 3.33%.
The Fund compares its performance
to the Bloomberg New York Municipal Bond Index, which returned 4.65% for the same period.
PERFORMANCE
HIGHLIGHTS
|
Top
contributors to performance: | |
|
↑
|
Overweight
to bonds with no external credit rating |
|
↑
|
Overweight
to bonds with 20 years to maturity |
|
↑
|
Overweight
to A rated bonds |
|
Top
detractors from performance: | |
|
↓
|
Underweight
bonds with 10 years or less to maturity |
|
↓
|
Selection
in AA rated bonds |
|
↓
|
Selection
in A rated bonds |
AVERAGE
ANNUAL TOTAL RETURNS (%) Period
Ended February 28, 2026
|
|
1
Year |
5
Year |
10
Year |
|
Class
C |
3.33
|
0.33
|
1.15
|
|
Class
C (with sales charge) |
2.33
|
0.33
|
1.15
|
|
Bloomberg
Municipal Bond Index |
4.96
|
1.44
|
2.43
|
|
Bloomberg
New York Municipal Bond Index |
4.65
|
1.47
|
2.29
|
For current month-end performance,
please call Franklin Templeton at (800)
DIAL BEN/342-5236 or visit
https://www.franklintempleton.com/investments/options/mutual-funds.
https://www.franklintempleton.com/investments/options/mutual-funds.
Important data provider notices
and terms available at www.franklintempletondatasources.com.
KEY
FUND STATISTICS (as
of February 28, 2026)
|
Total
Net Assets |
$2,687,285,818
|
|
Total
Number of Portfolio Holdings |
450
|
|
Total
Management Fee Paid |
$12,319,831
|
|
Portfolio
Turnover Rate |
14.51%
|
WHAT
DID THE FUND INVEST IN? (as
of February 28, 2026)
Portfolio Composition* (%
of Total Investments)

WHAT
WERE THE FUND COSTS FOR THE LAST YEAR? (based
on a hypothetical $10,000 investment)
|
Class
Name |
Costs
of a $10,000 investment
|
Costs
paid as a percentage of a $10,000
investment |
|
Class
R6 |
$51
|
0.50%
|
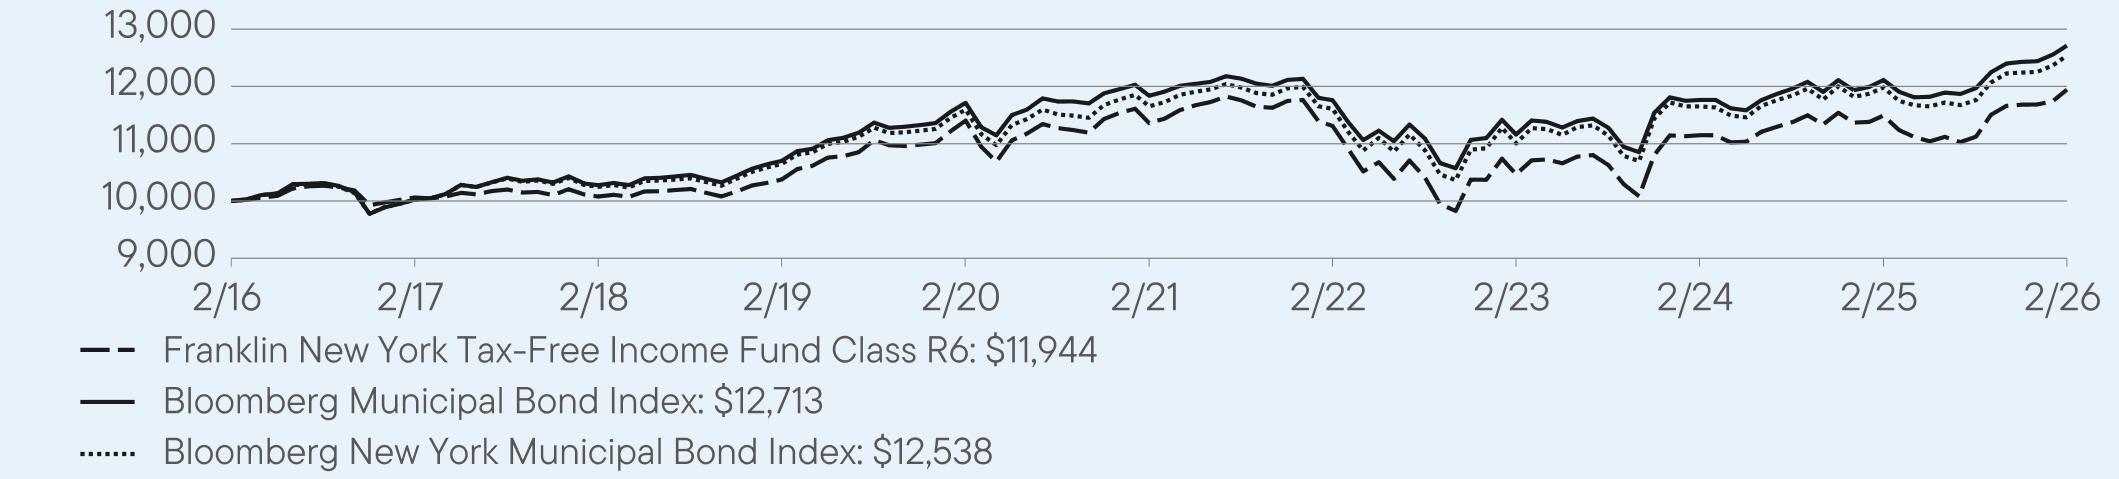
HOW
DID THE FUND PERFORM LAST YEAR AND WHAT AFFECTED ITS PERFORMANCE?
For the twelve months ended February
28, 2026, Class R6 shares of
Franklin New York Tax-Free Income Fund returned 3.94%.
The Fund compares its performance
to the Bloomberg New York Municipal Bond Index, which returned 4.65% for the same period.
PERFORMANCE
HIGHLIGHTS
|
Top
contributors to performance: | |
|
↑
|
Overweight
to bonds with no external credit rating |
|
↑
|
Overweight
to bonds with 20 years to maturity |
|
↑
|
Overweight
to A rated bonds |
|
Top
detractors from performance: | |
|
↓
|
Underweight
bonds with 10 years or less to maturity |
|
↓
|
Selection
in AA rated bonds |
|
↓
|
Selection
in A rated bonds |
AVERAGE
ANNUAL TOTAL RETURNS (%) Period
Ended February 28, 2026
|
|
1
Year |
5
Year |
10
Year |
|
Class
R6 |
3.94
|
1.01
|
1.81
|
|
Bloomberg
Municipal Bond Index |
4.96
|
1.44
|
2.43
|
|
Bloomberg
New York Municipal Bond Index |
4.65
|
1.47
|
2.29
|
For current month-end performance,
please call Franklin Templeton at (800)
DIAL BEN/342-5236 or visit
https://www.franklintempleton.com/investments/options/mutual-funds.
https://www.franklintempleton.com/investments/options/mutual-funds.
Important data provider notices
and terms available at www.franklintempletondatasources.com.
KEY
FUND STATISTICS (as
of February 28, 2026)
|
Total
Net Assets |
$2,687,285,818
|
|
Total
Number of Portfolio Holdings |
450
|
|
Total
Management Fee Paid |
$12,319,831
|
|
Portfolio
Turnover Rate |
14.51%
|
WHAT
DID THE FUND INVEST IN? (as
of February 28, 2026)
Portfolio Composition* (%
of Total Investments)

WHAT
WERE THE FUND COSTS FOR THE LAST YEAR? (based
on a hypothetical $10,000 investment)
|
Class
Name |
Costs
of a $10,000 investment
|
Costs
paid as a percentage of a $10,000
investment*
|
|
Advisor
Class |
$56
|
0.55%
|
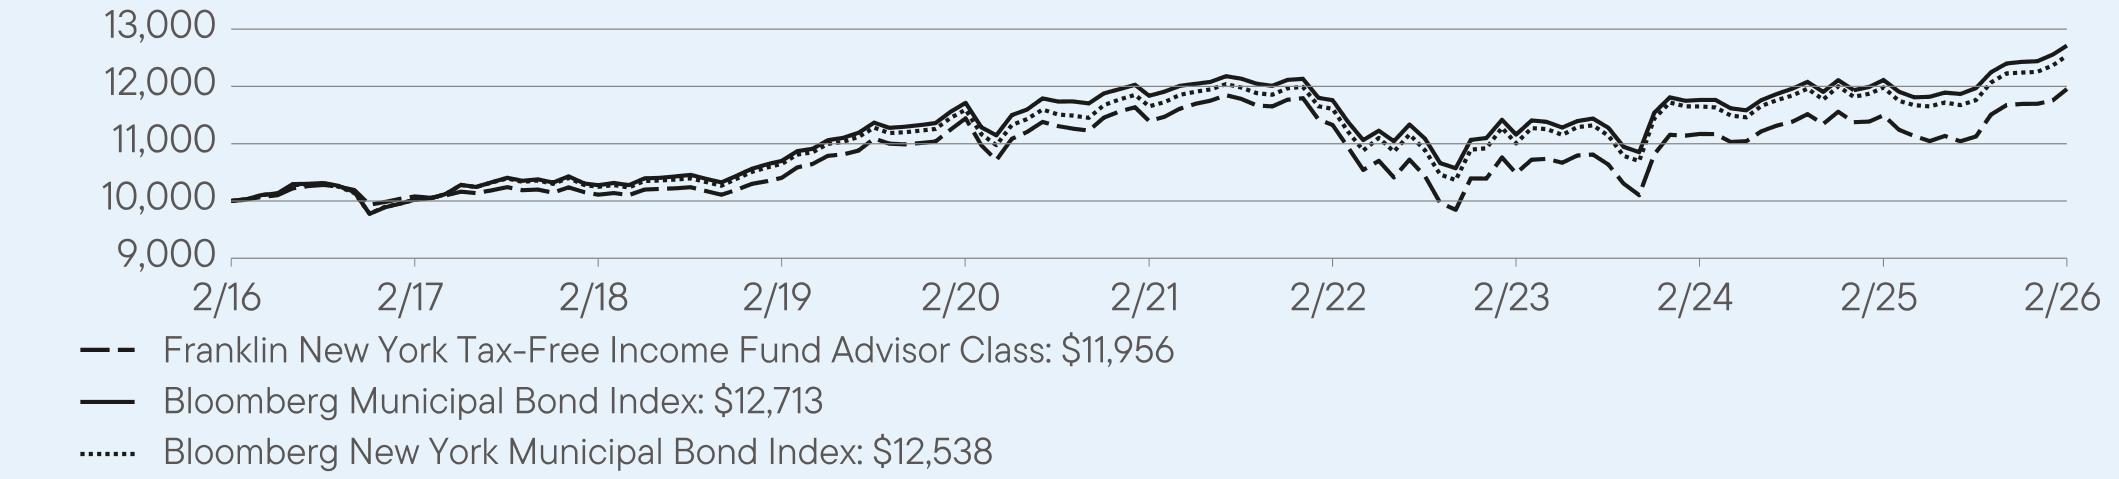
HOW
DID THE FUND PERFORM LAST YEAR AND WHAT AFFECTED ITS PERFORMANCE?
For the twelve months ended February
28, 2026, Advisor Class shares
of Franklin New York Tax-Free Income Fund returned 3.99%.
The Fund compares its performance
to the Bloomberg New York Municipal Bond Index, which returned 4.65% for the same period.
PERFORMANCE
HIGHLIGHTS
|
Top
contributors to performance: | |
|
↑
|
Overweight
to bonds with no external credit rating |
|
↑
|
Overweight
to bonds with 20 years to maturity |
|
↑
|
Overweight
to A rated bonds |
|
Top
detractors from performance: | |
|
↓
|
Underweight
bonds with 10 years or less to maturity |
|
↓
|
Selection
in AA rated bonds |
|
↓
|
Selection
in A rated bonds |
AVERAGE
ANNUAL TOTAL RETURNS (%) Period
Ended February 28, 2026
|
|
1
Year |
5
Year |
10
Year |
|
Advisor
Class |
3.99
|
0.96
|
1.80
|
|
Bloomberg
Municipal Bond Index |
4.96
|
1.44
|
2.43
|
|
Bloomberg
New York Municipal Bond Index |
4.65
|
1.47
|
2.29
|
For current month-end performance,
please call Franklin Templeton at (800)
DIAL BEN/342-5236 or visit
https://www.franklintempleton.com/investments/options/mutual-funds.
https://www.franklintempleton.com/investments/options/mutual-funds.
Important data provider notices
and terms available at www.franklintempletondatasources.com.
KEY
FUND STATISTICS (as
of February 28, 2026)
|
Total
Net Assets |
$2,687,285,818
|
|
Total
Number of Portfolio Holdings |
450
|
|
Total
Management Fee Paid |
$12,319,831
|
|
Portfolio
Turnover Rate |
14.51%
|
WHAT
DID THE FUND INVEST IN? (as
of February 28, 2026)
Portfolio Composition* (%
of Total Investments)

| [1] |
|
||
| [2] |
|
||
| [3] |
|
||
| [4] |
|
||
| [5] |
|
||
| [6] |
|
||
| [7] |
|
||
| [8] |
|