false
0000703112
N-1A
0000703112
tsr:C000199699Member
2025-03-01
2026-02-28
0000703112
tsr:C000199699Member
oef:WithoutSalesLoadMember
2025-03-01
2026-02-28
0000703112
tsr:bench202411154454_6708Member
2025-03-01
2026-02-28
0000703112
tsr:benchmarkBM3091_6708Member
2025-03-01
2026-02-28
0000703112
tsr:C000199699Member
2026-02-28
0000703112
tsr:C000199699Member
tsr:bench202409274049_6708Member
2026-02-28
0000703112
tsr:C000199699Member
tsr:bench202409274045_6708Member
2026-02-28
0000703112
tsr:C000199699Member
tsr:bench202409274048_6708Member
2026-02-28
0000703112
tsr:C000199699Member
tsr:bench202409274046_6708Member
2026-02-28
0000703112
tsr:C000199699Member
tsr:bench202409044002_6708Member
2026-02-28
0000703112
tsr:C000199699Member
tsr:bench202409274047_6708Member
2026-02-28
0000703112
tsr:C000199699Member
tsr:bench202409043993_6708Member
2026-02-28
0000703112
tsr:C000199699Member
tsr:bench202409274053_6708Member
2026-02-28
0000703112
tsr:C000199699Member
tsr:bench202409274054_6708Member
2026-02-28
0000703112
tsr:C000199699Member
tsr:bench202409274052_6708Member
2026-02-28
0000703112
tsr:C000199699Member
tsr:bench202409274051_6708Member
2026-02-28
0000703112
tsr:C000199699Member
oef:WithoutSalesLoadMember
2021-03-01
2026-02-28
0000703112
tsr:C000199699Member
2021-03-01
2026-02-28
0000703112
tsr:bench202411154454_6708Member
2021-03-01
2026-02-28
0000703112
tsr:benchmarkBM3091_6708Member
2021-03-01
2026-02-28
0000703112
tsr:C000199699Member
oef:WithoutSalesLoadMember
2016-02-29
2026-02-28
0000703112
tsr:C000199699Member
2016-02-29
2026-02-28
0000703112
tsr:bench202411154454_6708Member
2016-02-29
2026-02-28
0000703112
tsr:benchmarkBM3091_6708Member
2016-02-29
2026-02-28
0000703112
tsr:C000199699Member
2016-02-29
2016-02-29
0000703112
tsr:bench202411154454_6708Member
2016-02-29
2016-02-29
0000703112
tsr:benchmarkBM3091_6708Member
2016-02-29
2016-02-29
0000703112
tsr:C000199699Member
2017-02-28
2017-02-28
0000703112
tsr:bench202411154454_6708Member
2017-02-28
2017-02-28
0000703112
tsr:benchmarkBM3091_6708Member
2017-02-28
2017-02-28
0000703112
tsr:C000199699Member
2018-02-28
2018-02-28
0000703112
tsr:bench202411154454_6708Member
2018-02-28
2018-02-28
0000703112
tsr:benchmarkBM3091_6708Member
2018-02-28
2018-02-28
0000703112
tsr:C000199699Member
2019-02-28
2019-02-28
0000703112
tsr:bench202411154454_6708Member
2019-02-28
2019-02-28
0000703112
tsr:benchmarkBM3091_6708Member
2019-02-28
2019-02-28
0000703112
tsr:C000199699Member
2020-02-29
2020-02-29
0000703112
tsr:bench202411154454_6708Member
2020-02-29
2020-02-29
0000703112
tsr:benchmarkBM3091_6708Member
2020-02-29
2020-02-29
0000703112
tsr:C000199699Member
2021-02-28
2021-02-28
0000703112
tsr:bench202411154454_6708Member
2021-02-28
2021-02-28
0000703112
tsr:benchmarkBM3091_6708Member
2021-02-28
2021-02-28
0000703112
tsr:C000199699Member
2022-02-28
2022-02-28
0000703112
tsr:bench202411154454_6708Member
2022-02-28
2022-02-28
0000703112
tsr:benchmarkBM3091_6708Member
2022-02-28
2022-02-28
0000703112
tsr:C000199699Member
2023-02-28
2023-02-28
0000703112
tsr:bench202411154454_6708Member
2023-02-28
2023-02-28
0000703112
tsr:benchmarkBM3091_6708Member
2023-02-28
2023-02-28
0000703112
tsr:C000199699Member
2024-02-29
2024-02-29
0000703112
tsr:bench202411154454_6708Member
2024-02-29
2024-02-29
0000703112
tsr:benchmarkBM3091_6708Member
2024-02-29
2024-02-29
0000703112
tsr:C000199699Member
2025-02-28
2025-02-28
0000703112
tsr:bench202411154454_6708Member
2025-02-28
2025-02-28
0000703112
tsr:benchmarkBM3091_6708Member
2025-02-28
2025-02-28
0000703112
2025-03-01
2026-02-28
tsr:Years
iso4217:USD
xbrli:pure
xbrli:shares
iso4217:USD
xbrli:shares
0000703112
tsr:C000018541Member
2025-03-01
2026-02-28
0000703112
tsr:C000018541Member
oef:WithoutSalesLoadMember
2025-03-01
2026-02-28
0000703112
tsr:bench202411154454_6706Member
2025-03-01
2026-02-28
0000703112
tsr:benchmarkBM3091_6706Member
2025-03-01
2026-02-28
0000703112
tsr:C000018541Member
2026-02-28
0000703112
tsr:C000018541Member
tsr:bench202409274049_6706Member
2026-02-28
0000703112
tsr:C000018541Member
tsr:bench202409274045_6706Member
2026-02-28
0000703112
tsr:C000018541Member
tsr:bench202409274048_6706Member
2026-02-28
0000703112
tsr:C000018541Member
tsr:bench202409274046_6706Member
2026-02-28
0000703112
tsr:C000018541Member
tsr:bench202409044002_6706Member
2026-02-28
0000703112
tsr:C000018541Member
tsr:bench202409274047_6706Member
2026-02-28
0000703112
tsr:C000018541Member
tsr:bench202409043993_6706Member
2026-02-28
0000703112
tsr:C000018541Member
tsr:bench202409274053_6706Member
2026-02-28
0000703112
tsr:C000018541Member
tsr:bench202409274054_6706Member
2026-02-28
0000703112
tsr:C000018541Member
tsr:bench202409274052_6706Member
2026-02-28
0000703112
tsr:C000018541Member
tsr:bench202409274051_6706Member
2026-02-28
0000703112
tsr:C000018541Member
oef:WithoutSalesLoadMember
2021-03-01
2026-02-28
0000703112
tsr:C000018541Member
2021-03-01
2026-02-28
0000703112
tsr:bench202411154454_6706Member
2021-03-01
2026-02-28
0000703112
tsr:benchmarkBM3091_6706Member
2021-03-01
2026-02-28
0000703112
tsr:C000018541Member
oef:WithoutSalesLoadMember
2016-02-29
2026-02-28
0000703112
tsr:C000018541Member
2016-02-29
2026-02-28
0000703112
tsr:bench202411154454_6706Member
2016-02-29
2026-02-28
0000703112
tsr:benchmarkBM3091_6706Member
2016-02-29
2026-02-28
0000703112
tsr:C000018541Member
2016-02-29
2016-02-29
0000703112
tsr:bench202411154454_6706Member
2016-02-29
2016-02-29
0000703112
tsr:benchmarkBM3091_6706Member
2016-02-29
2016-02-29
0000703112
tsr:C000018541Member
2017-02-28
2017-02-28
0000703112
tsr:bench202411154454_6706Member
2017-02-28
2017-02-28
0000703112
tsr:benchmarkBM3091_6706Member
2017-02-28
2017-02-28
0000703112
tsr:C000018541Member
2018-02-28
2018-02-28
0000703112
tsr:bench202411154454_6706Member
2018-02-28
2018-02-28
0000703112
tsr:benchmarkBM3091_6706Member
2018-02-28
2018-02-28
0000703112
tsr:C000018541Member
2019-02-28
2019-02-28
0000703112
tsr:bench202411154454_6706Member
2019-02-28
2019-02-28
0000703112
tsr:benchmarkBM3091_6706Member
2019-02-28
2019-02-28
0000703112
tsr:C000018541Member
2020-02-29
2020-02-29
0000703112
tsr:bench202411154454_6706Member
2020-02-29
2020-02-29
0000703112
tsr:benchmarkBM3091_6706Member
2020-02-29
2020-02-29
0000703112
tsr:C000018541Member
2021-02-28
2021-02-28
0000703112
tsr:bench202411154454_6706Member
2021-02-28
2021-02-28
0000703112
tsr:benchmarkBM3091_6706Member
2021-02-28
2021-02-28
0000703112
tsr:C000018541Member
2022-02-28
2022-02-28
0000703112
tsr:bench202411154454_6706Member
2022-02-28
2022-02-28
0000703112
tsr:benchmarkBM3091_6706Member
2022-02-28
2022-02-28
0000703112
tsr:C000018541Member
2023-02-28
2023-02-28
0000703112
tsr:bench202411154454_6706Member
2023-02-28
2023-02-28
0000703112
tsr:benchmarkBM3091_6706Member
2023-02-28
2023-02-28
0000703112
tsr:C000018541Member
2024-02-29
2024-02-29
0000703112
tsr:bench202411154454_6706Member
2024-02-29
2024-02-29
0000703112
tsr:benchmarkBM3091_6706Member
2024-02-29
2024-02-29
0000703112
tsr:C000018541Member
2025-02-28
2025-02-28
0000703112
tsr:bench202411154454_6706Member
2025-02-28
2025-02-28
0000703112
tsr:benchmarkBM3091_6706Member
2025-02-28
2025-02-28
0000703112
tsr:C000018543Member
2025-03-01
2026-02-28
0000703112
tsr:C000018543Member
oef:WithoutSalesLoadMember
2025-03-01
2026-02-28
0000703112
tsr:bench202411154454_6710Member
2025-03-01
2026-02-28
0000703112
tsr:benchmarkBM3091_6710Member
2025-03-01
2026-02-28
0000703112
tsr:C000018543Member
2026-02-28
0000703112
tsr:C000018543Member
tsr:bench202409274049_6710Member
2026-02-28
0000703112
tsr:C000018543Member
tsr:bench202409274045_6710Member
2026-02-28
0000703112
tsr:C000018543Member
tsr:bench202409274048_6710Member
2026-02-28
0000703112
tsr:C000018543Member
tsr:bench202409274046_6710Member
2026-02-28
0000703112
tsr:C000018543Member
tsr:bench202409044002_6710Member
2026-02-28
0000703112
tsr:C000018543Member
tsr:bench202409274047_6710Member
2026-02-28
0000703112
tsr:C000018543Member
tsr:bench202409043993_6710Member
2026-02-28
0000703112
tsr:C000018543Member
tsr:bench202409274053_6710Member
2026-02-28
0000703112
tsr:C000018543Member
tsr:bench202409274054_6710Member
2026-02-28
0000703112
tsr:C000018543Member
tsr:bench202409274052_6710Member
2026-02-28
0000703112
tsr:C000018543Member
tsr:bench202409274051_6710Member
2026-02-28
0000703112
tsr:C000018543Member
oef:WithoutSalesLoadMember
2021-03-01
2026-02-28
0000703112
tsr:C000018543Member
2021-03-01
2026-02-28
0000703112
tsr:bench202411154454_6710Member
2021-03-01
2026-02-28
0000703112
tsr:benchmarkBM3091_6710Member
2021-03-01
2026-02-28
0000703112
tsr:C000018543Member
oef:WithoutSalesLoadMember
2016-02-29
2026-02-28
0000703112
tsr:C000018543Member
2016-02-29
2026-02-28
0000703112
tsr:bench202411154454_6710Member
2016-02-29
2026-02-28
0000703112
tsr:benchmarkBM3091_6710Member
2016-02-29
2026-02-28
0000703112
tsr:C000018543Member
2016-02-29
2016-02-29
0000703112
tsr:bench202411154454_6710Member
2016-02-29
2016-02-29
0000703112
tsr:benchmarkBM3091_6710Member
2016-02-29
2016-02-29
0000703112
tsr:C000018543Member
2017-02-28
2017-02-28
0000703112
tsr:bench202411154454_6710Member
2017-02-28
2017-02-28
0000703112
tsr:benchmarkBM3091_6710Member
2017-02-28
2017-02-28
0000703112
tsr:C000018543Member
2018-02-28
2018-02-28
0000703112
tsr:bench202411154454_6710Member
2018-02-28
2018-02-28
0000703112
tsr:benchmarkBM3091_6710Member
2018-02-28
2018-02-28
0000703112
tsr:C000018543Member
2019-02-28
2019-02-28
0000703112
tsr:bench202411154454_6710Member
2019-02-28
2019-02-28
0000703112
tsr:benchmarkBM3091_6710Member
2019-02-28
2019-02-28
0000703112
tsr:C000018543Member
2020-02-29
2020-02-29
0000703112
tsr:bench202411154454_6710Member
2020-02-29
2020-02-29
0000703112
tsr:benchmarkBM3091_6710Member
2020-02-29
2020-02-29
0000703112
tsr:C000018543Member
2021-02-28
2021-02-28
0000703112
tsr:bench202411154454_6710Member
2021-02-28
2021-02-28
0000703112
tsr:benchmarkBM3091_6710Member
2021-02-28
2021-02-28
0000703112
tsr:C000018543Member
2022-02-28
2022-02-28
0000703112
tsr:bench202411154454_6710Member
2022-02-28
2022-02-28
0000703112
tsr:benchmarkBM3091_6710Member
2022-02-28
2022-02-28
0000703112
tsr:C000018543Member
2023-02-28
2023-02-28
0000703112
tsr:bench202411154454_6710Member
2023-02-28
2023-02-28
0000703112
tsr:benchmarkBM3091_6710Member
2023-02-28
2023-02-28
0000703112
tsr:C000018543Member
2024-02-29
2024-02-29
0000703112
tsr:bench202411154454_6710Member
2024-02-29
2024-02-29
0000703112
tsr:benchmarkBM3091_6710Member
2024-02-29
2024-02-29
0000703112
tsr:C000018543Member
2025-02-28
2025-02-28
0000703112
tsr:bench202411154454_6710Member
2025-02-28
2025-02-28
0000703112
tsr:benchmarkBM3091_6710Member
2025-02-28
2025-02-28
0000703112
tsr:C000194381Member
2025-03-01
2026-02-28
0000703112
tsr:bench202411154454_6711Member
2025-03-01
2026-02-28
0000703112
tsr:benchmarkBM3091_6711Member
2025-03-01
2026-02-28
0000703112
tsr:C000194381Member
2026-02-28
0000703112
tsr:C000194381Member
tsr:bench202409274049_6711Member
2026-02-28
0000703112
tsr:C000194381Member
tsr:bench202409274045_6711Member
2026-02-28
0000703112
tsr:C000194381Member
tsr:bench202409274048_6711Member
2026-02-28
0000703112
tsr:C000194381Member
tsr:bench202409274046_6711Member
2026-02-28
0000703112
tsr:C000194381Member
tsr:bench202409044002_6711Member
2026-02-28
0000703112
tsr:C000194381Member
tsr:bench202409274047_6711Member
2026-02-28
0000703112
tsr:C000194381Member
tsr:bench202409043993_6711Member
2026-02-28
0000703112
tsr:C000194381Member
tsr:bench202409274053_6711Member
2026-02-28
0000703112
tsr:C000194381Member
tsr:bench202409274054_6711Member
2026-02-28
0000703112
tsr:C000194381Member
tsr:bench202409274052_6711Member
2026-02-28
0000703112
tsr:C000194381Member
tsr:bench202409274051_6711Member
2026-02-28
0000703112
tsr:C000194381Member
2021-03-01
2026-02-28
0000703112
tsr:bench202411154454_6711Member
2021-03-01
2026-02-28
0000703112
tsr:benchmarkBM3091_6711Member
2021-03-01
2026-02-28
0000703112
tsr:C000194381Member
2016-02-29
2026-02-28
0000703112
tsr:bench202411154454_6711Member
2016-02-29
2026-02-28
0000703112
tsr:benchmarkBM3091_6711Member
2016-02-29
2026-02-28
0000703112
tsr:C000194381Member
2016-02-29
2016-02-29
0000703112
tsr:bench202411154454_6711Member
2016-02-29
2016-02-29
0000703112
tsr:benchmarkBM3091_6711Member
2016-02-29
2016-02-29
0000703112
tsr:C000194381Member
2017-02-28
2017-02-28
0000703112
tsr:bench202411154454_6711Member
2017-02-28
2017-02-28
0000703112
tsr:benchmarkBM3091_6711Member
2017-02-28
2017-02-28
0000703112
tsr:C000194381Member
2018-02-28
2018-02-28
0000703112
tsr:bench202411154454_6711Member
2018-02-28
2018-02-28
0000703112
tsr:benchmarkBM3091_6711Member
2018-02-28
2018-02-28
0000703112
tsr:C000194381Member
2019-02-28
2019-02-28
0000703112
tsr:bench202411154454_6711Member
2019-02-28
2019-02-28
0000703112
tsr:benchmarkBM3091_6711Member
2019-02-28
2019-02-28
0000703112
tsr:C000194381Member
2020-02-29
2020-02-29
0000703112
tsr:bench202411154454_6711Member
2020-02-29
2020-02-29
0000703112
tsr:benchmarkBM3091_6711Member
2020-02-29
2020-02-29
0000703112
tsr:C000194381Member
2021-02-28
2021-02-28
0000703112
tsr:bench202411154454_6711Member
2021-02-28
2021-02-28
0000703112
tsr:benchmarkBM3091_6711Member
2021-02-28
2021-02-28
0000703112
tsr:C000194381Member
2022-02-28
2022-02-28
0000703112
tsr:bench202411154454_6711Member
2022-02-28
2022-02-28
0000703112
tsr:benchmarkBM3091_6711Member
2022-02-28
2022-02-28
0000703112
tsr:C000194381Member
2023-02-28
2023-02-28
0000703112
tsr:bench202411154454_6711Member
2023-02-28
2023-02-28
0000703112
tsr:benchmarkBM3091_6711Member
2023-02-28
2023-02-28
0000703112
tsr:C000194381Member
2024-02-29
2024-02-29
0000703112
tsr:bench202411154454_6711Member
2024-02-29
2024-02-29
0000703112
tsr:benchmarkBM3091_6711Member
2024-02-29
2024-02-29
0000703112
tsr:C000194381Member
2025-02-28
2025-02-28
0000703112
tsr:bench202411154454_6711Member
2025-02-28
2025-02-28
0000703112
tsr:benchmarkBM3091_6711Member
2025-02-28
2025-02-28
0000703112
tsr:C000018544Member
2025-03-01
2026-02-28
0000703112
tsr:bench202411154454_6704Member
2025-03-01
2026-02-28
0000703112
tsr:benchmarkBM3091_6704Member
2025-03-01
2026-02-28
0000703112
tsr:C000018544Member
2026-02-28
0000703112
tsr:C000018544Member
tsr:bench202409274049_6704Member
2026-02-28
0000703112
tsr:C000018544Member
tsr:bench202409274045_6704Member
2026-02-28
0000703112
tsr:C000018544Member
tsr:bench202409274048_6704Member
2026-02-28
0000703112
tsr:C000018544Member
tsr:bench202409274046_6704Member
2026-02-28
0000703112
tsr:C000018544Member
tsr:bench202409044002_6704Member
2026-02-28
0000703112
tsr:C000018544Member
tsr:bench202409274047_6704Member
2026-02-28
0000703112
tsr:C000018544Member
tsr:bench202409043993_6704Member
2026-02-28
0000703112
tsr:C000018544Member
tsr:bench202409274053_6704Member
2026-02-28
0000703112
tsr:C000018544Member
tsr:bench202409274054_6704Member
2026-02-28
0000703112
tsr:C000018544Member
tsr:bench202409274052_6704Member
2026-02-28
0000703112
tsr:C000018544Member
tsr:bench202409274051_6704Member
2026-02-28
0000703112
tsr:C000018544Member
2021-03-01
2026-02-28
0000703112
tsr:bench202411154454_6704Member
2021-03-01
2026-02-28
0000703112
tsr:benchmarkBM3091_6704Member
2021-03-01
2026-02-28
0000703112
tsr:C000018544Member
2016-02-29
2026-02-28
0000703112
tsr:bench202411154454_6704Member
2016-02-29
2026-02-28
0000703112
tsr:benchmarkBM3091_6704Member
2016-02-29
2026-02-28
0000703112
tsr:C000018544Member
2016-02-29
2016-02-29
0000703112
tsr:bench202411154454_6704Member
2016-02-29
2016-02-29
0000703112
tsr:benchmarkBM3091_6704Member
2016-02-29
2016-02-29
0000703112
tsr:C000018544Member
2017-02-28
2017-02-28
0000703112
tsr:bench202411154454_6704Member
2017-02-28
2017-02-28
0000703112
tsr:benchmarkBM3091_6704Member
2017-02-28
2017-02-28
0000703112
tsr:C000018544Member
2018-02-28
2018-02-28
0000703112
tsr:bench202411154454_6704Member
2018-02-28
2018-02-28
0000703112
tsr:benchmarkBM3091_6704Member
2018-02-28
2018-02-28
0000703112
tsr:C000018544Member
2019-02-28
2019-02-28
0000703112
tsr:bench202411154454_6704Member
2019-02-28
2019-02-28
0000703112
tsr:benchmarkBM3091_6704Member
2019-02-28
2019-02-28
0000703112
tsr:C000018544Member
2020-02-29
2020-02-29
0000703112
tsr:bench202411154454_6704Member
2020-02-29
2020-02-29
0000703112
tsr:benchmarkBM3091_6704Member
2020-02-29
2020-02-29
0000703112
tsr:C000018544Member
2021-02-28
2021-02-28
0000703112
tsr:bench202411154454_6704Member
2021-02-28
2021-02-28
0000703112
tsr:benchmarkBM3091_6704Member
2021-02-28
2021-02-28
0000703112
tsr:C000018544Member
2022-02-28
2022-02-28
0000703112
tsr:bench202411154454_6704Member
2022-02-28
2022-02-28
0000703112
tsr:benchmarkBM3091_6704Member
2022-02-28
2022-02-28
0000703112
tsr:C000018544Member
2023-02-28
2023-02-28
0000703112
tsr:bench202411154454_6704Member
2023-02-28
2023-02-28
0000703112
tsr:benchmarkBM3091_6704Member
2023-02-28
2023-02-28
0000703112
tsr:C000018544Member
2024-02-29
2024-02-29
0000703112
tsr:bench202411154454_6704Member
2024-02-29
2024-02-29
0000703112
tsr:benchmarkBM3091_6704Member
2024-02-29
2024-02-29
0000703112
tsr:C000018544Member
2025-02-28
2025-02-28
0000703112
tsr:bench202411154454_6704Member
2025-02-28
2025-02-28
0000703112
tsr:benchmarkBM3091_6704Member
2025-02-28
2025-02-28
UNITED STATES
SECURITIES AND EXCHANGE COMMISSION
Washington, D.C. 20549
FORM N-CSR
CERTIFIED SHAREHOLDER REPORT OF REGISTERED
MANAGEMENT INVESTMENT COMPANIES
Investment Company Act file number 811-03479
Franklin
New York Tax-Free Income Fund
(Exact name of registrant as specified in charter)
One Franklin Parkway, San Mateo, CA 94403-1906
(Address of principal executive offices) (Zip code)
Alison Baur
Franklin Templeton
One Franklin Parkway
San Mateo, CA 94403-1906
(Name and address of agent for service)
Registrant’s telephone number, including area
code: (650) 312-2000
Date of fiscal year end: February 28
Date of reporting period: February
28, 2026
| ITEM 1. |
REPORT TO STOCKHOLDERS |
(a) The Report to Shareholders is filed herewith
|
|
|
|
Franklin
New York Tax-Free Income Fund |
|
|
Class
A [FNYQX]
|
|
Annual
Shareholder Report | February
28, 2026 |
|
|
This
annual
shareholder report
contains important information about Franklin
New York Tax-Free Income Fund for the period March
1, 2025, to February
28, 2026.
You
can find additional information about the Fund at https://www.franklintempleton.com/regulatory-fund-documents.
You can also request this information
by contacting us at (800)
DIAL BEN/342-5236.
|
|
|
|
Class
Name |
Costs
of a $10,000 investment
|
Costs
paid as a percentage of a $10,000
investment |
|
Class
A |
$81
|
%
|
HOW
DID THE FUND PERFORM LAST YEAR AND WHAT AFFECTED ITS PERFORMANCE?
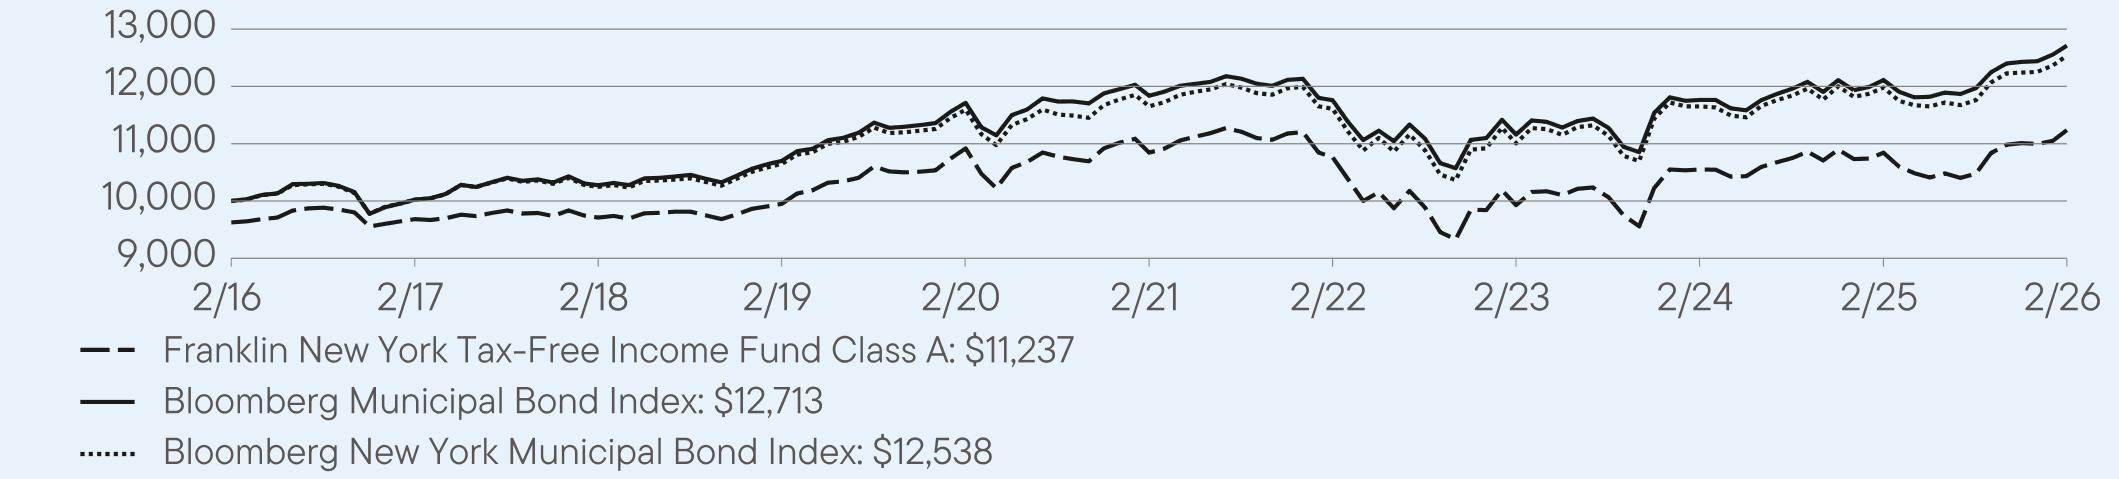
For the twelve months ended February
28, 2026, Class A shares of
Franklin New York Tax-Free Income Fund returned 3.63%.
The Fund compares its performance
to the Bloomberg New York Municipal Bond Index, which returned 4.65% for the same period.
|
|
|
Top
contributors to performance: |
|
↑
|
Overweight
to bonds with no external credit rating |
|
↑
|
Overweight
to bonds with 20 years to maturity |
|
↑
|
Overweight
to A rated bonds |
|
|
|
Top
detractors from performance: |
|
↓
|
Underweight
bonds with 10 years or less to maturity |
|
↓
|
Selection
in AA rated bonds |
|
↓
|
Selection
in A rated bonds |
| Franklin
New York Tax-Free Income Fund |
PAGE
1 |
1115-ATSR-0426 |
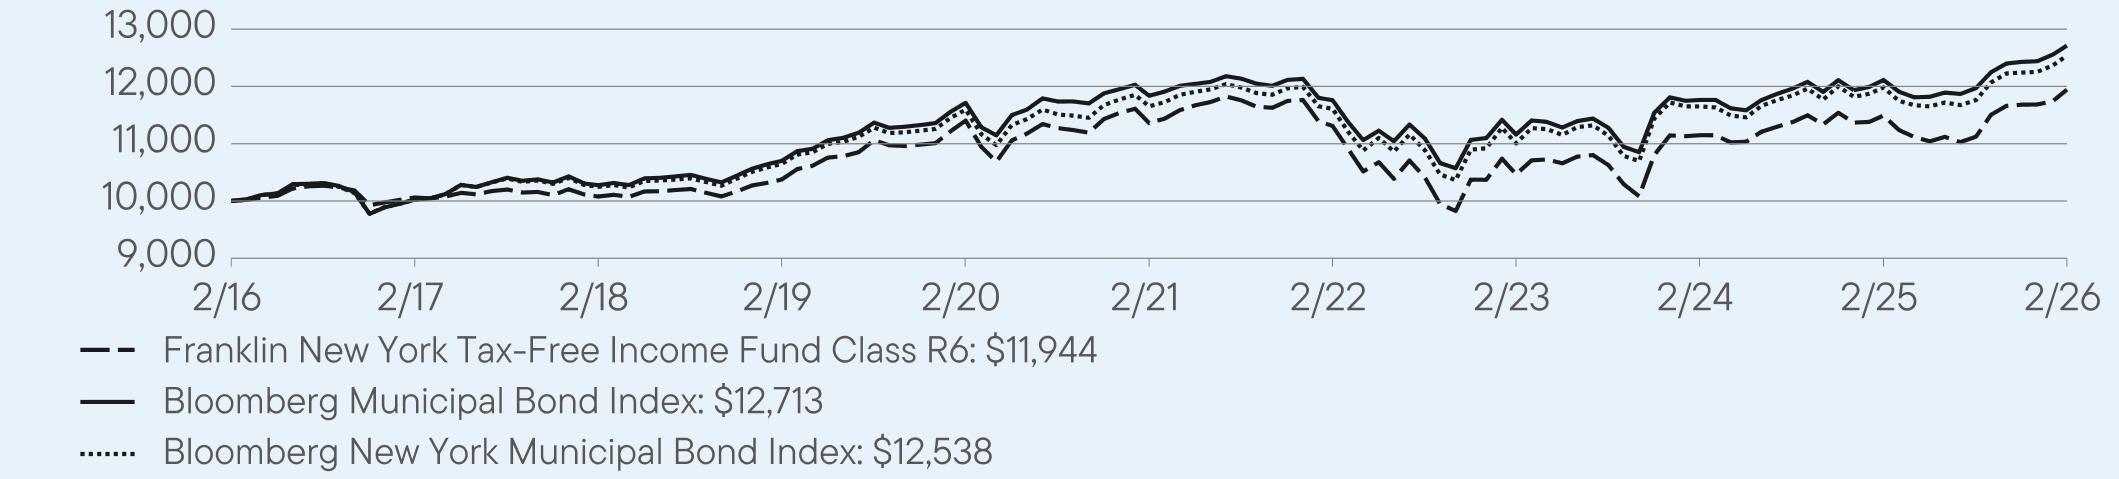
HOW
DID THE FUND PERFORM OVER THE LAST 10 YEARS?
The
Fund’s past performance is not necessarily an indication of how the Fund will perform in the future. The
graph and table do not reflect
the deduction of taxes that a shareholder would pay on Fund distributions or redemption of Fund shares.
VALUE
OF A $10,000
INVESTMENT ($9,625
AFTER MAXIMUM APPLICABLE SALES CHARGE) –
Class
A 2/29/2016 —
2/28/2026
AVERAGE
ANNUAL TOTAL RETURNS (%) Period
Ended February 28, 2026
|
|
|
|
|
|
1
Year |
5
Year |
10
Year |
|
Class
A |
3.63
|
0.71
|
1.57
|
|
Class
A (with sales charge) |
-0.25
|
-0.05
|
1.18
|
|
Bloomberg
Municipal Bond Index |
4.96
|
1.44
|
2.43
|
|
Bloomberg
New York Municipal Bond Index |
4.65
|
1.47
|
2.29
|
Fund
performance figures may reflect fee waivers and/or expense reimbursements, without which the performance would have been lower.
The
Fund began offering Class A shares on 9/10/2018. Returns for periods before 9/10/2018, are based on the Fund’s Class A1 performance,
which has been adjusted to take into account differences in class-specific operating expenses and maximum sales charges.
For periods after the share class offering, performance for the specific share class is used, reflecting the applicable expenses and
maximum sales charges.
Performance
for periods prior to March 1, 2019, has been restated to reflect the current maximum sales charge, which is lower than the maximum
sales charge prior to that date.
For current month-end performance,
please call Franklin Templeton at (800)
DIAL BEN/342-5236 or visit
https://www.franklintempleton.com/investments/options/mutual-funds.
Important data provider notices
and terms available at www.franklintempletondatasources.com.
KEY
FUND STATISTICS (as
of February 28, 2026)
|
|
|
Total
Net Assets |
$2,687,285,818
|
|
Total
Number of Portfolio Holdings |
450
|
|
Total
Management Fee Paid |
$12,319,831
|
|
Portfolio
Turnover Rate |
14.51%
|
| Franklin
New York Tax-Free Income Fund |
PAGE
2 |
1115-ATSR-0426 |
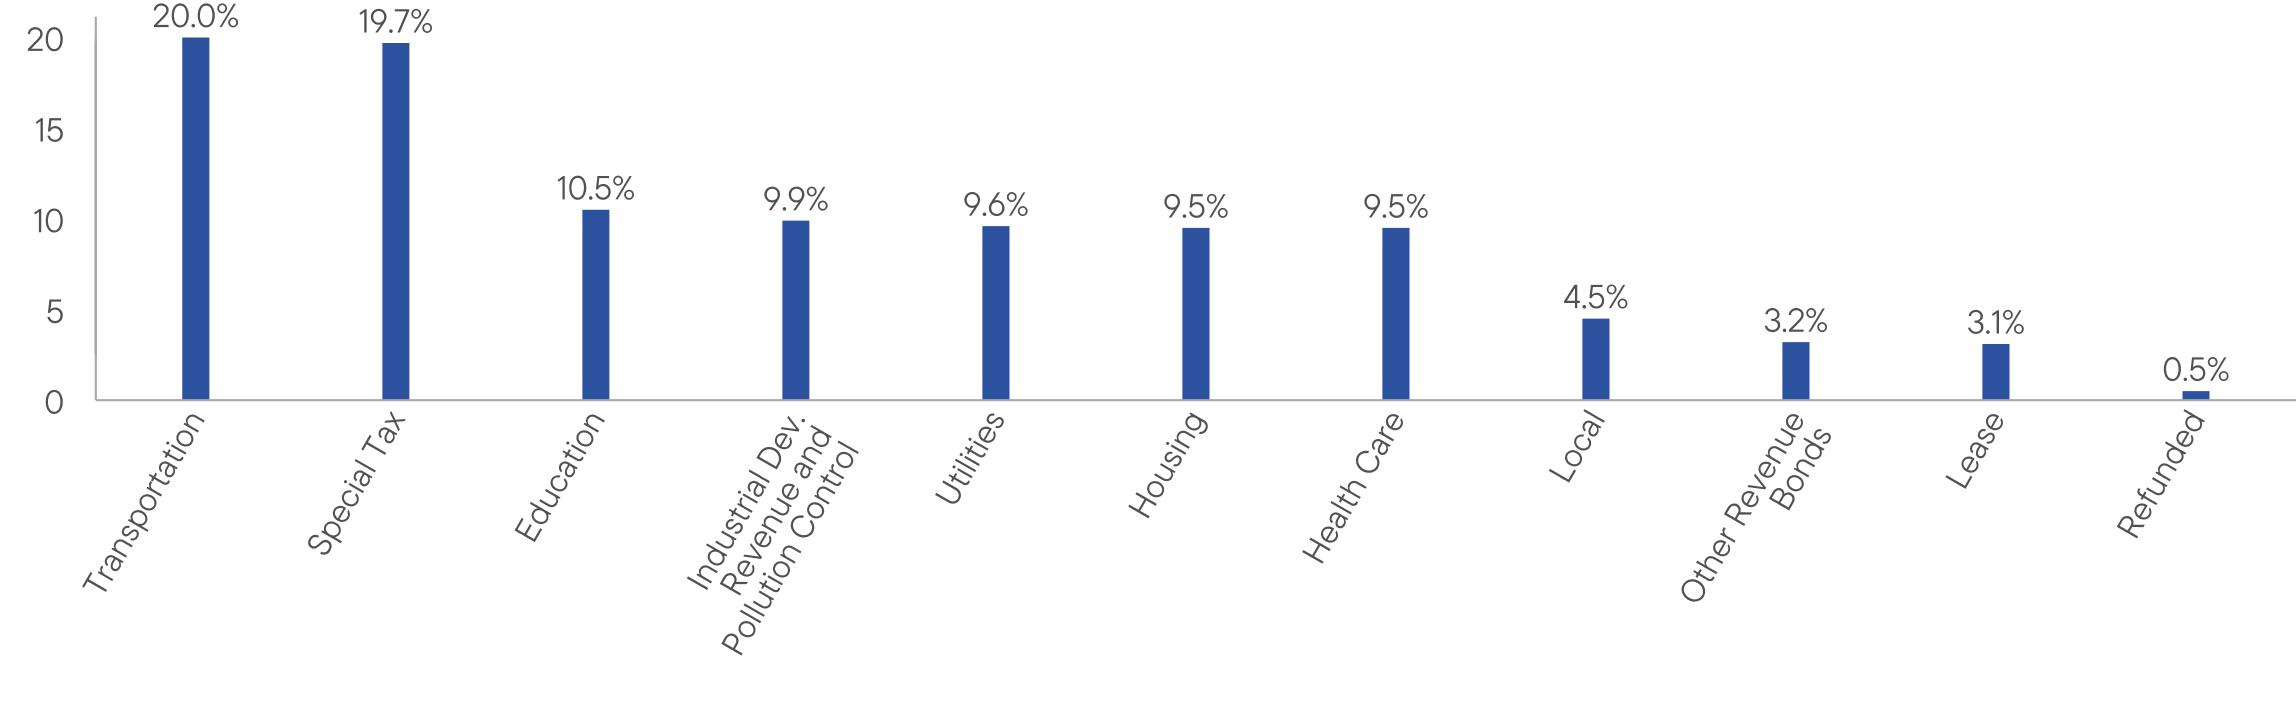
Portfolio Composition* (%
of Total Investments)
| * |
Does
not include derivatives, except purchased options, if any. |
|
|
|
|
WHERE
CAN I FIND ADDITIONAL INFORMATION ABOUT THE FUND? |
|
Additional
information is available on https://www.franklintempleton.com/regulatory-fund-documents,
including its: |
|
•
prospectus • proxy voting information • financial information • holdings • tax information |
HOUSEHOLDING
You
will receive the Fund’s shareholder reports every six months. In addition, you will receive an annual updated summary prospectus
(detail prospectus available
upon request). To reduce Fund expenses, we try to identify related shareholders in a household and send only
one copy of the shareholder reports and summary prospectus. This process, called “householding,” will continue indefinitely
unless you instruct us otherwise.
If you prefer not to have these documents householded, please call us at (800)
DIAL BEN/342-5236. At any time,
you may view current prospectuses/summary prospectuses and shareholder reports on our website. If you choose, you may
receive these documents through electronic delivery.
| Franklin
New York Tax-Free Income Fund |
PAGE
3 |
1115-ATSR-0426 |
962596839711995010918108451076399261055010843112371000010025102761070011713118371175911159117641211212713100001002110247106461159511653116091100611651119811253820.019.710.59.99.69.59.54.53.23.10.5
|
|
|
|
Franklin
New York Tax-Free Income Fund |
|
|
Class
A1 [FNYTX]
|
|
Annual
Shareholder Report | February
28, 2026 |
|
|
This
annual
shareholder report
contains important information about Franklin
New York Tax-Free Income Fund for the period March
1, 2025, to February
28, 2026.
You
can find additional information about the Fund at https://www.franklintempleton.com/regulatory-fund-documents.
You can also request this information
by contacting us at (800)
DIAL BEN/342-5236.
|
|
|
|
Class
Name |
Costs
of a $10,000 investment
|
Costs
paid as a percentage of a $10,000
investment*
|
|
Class
A1 |
$66
|
%
|
| * |
Reflects
fee waivers and/or expense reimbursements, without which expenses would have been higher. |
HOW
DID THE FUND PERFORM LAST YEAR AND WHAT AFFECTED ITS PERFORMANCE?
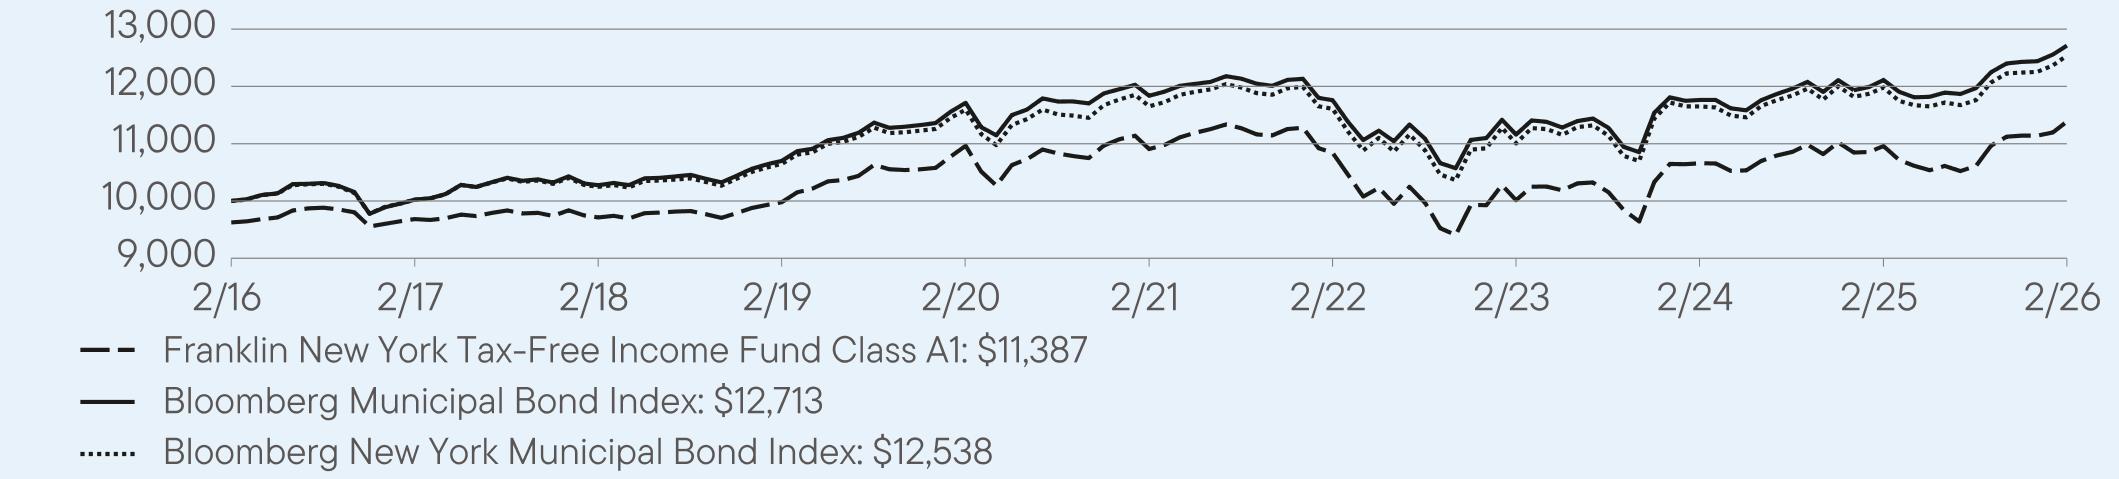
For the twelve months ended February
28, 2026, Class A1 shares of
Franklin New York Tax-Free Income Fund returned 3.89%.
The Fund compares its performance
to the Bloomberg New York Municipal Bond Index, which returned 4.65% for the same period.
|
|
|
Top
contributors to performance: |
|
↑
|
Overweight
to bonds with no external credit rating |
|
↑
|
Overweight
to bonds with 20 years to maturity |
|
↑
|
Overweight
to A rated bonds |
|
|
|
Top
detractors from performance: |
|
↓
|
Underweight
bonds with 10 years or less to maturity |
|
↓
|
Selection
in AA rated bonds |
|
↓
|
Selection
in A rated bonds |
| Franklin
New York Tax-Free Income Fund |
PAGE
1 |
115-ATSR-0426 |
HOW
DID THE FUND PERFORM OVER THE LAST 10 YEARS?
The
Fund’s past performance is not necessarily an indication of how the Fund will perform in the future. The
graph and table do not reflect
the deduction of taxes that a shareholder would pay on Fund distributions or redemption of Fund shares.
VALUE
OF A $10,000
INVESTMENT ($9,625
AFTER MAXIMUM APPLICABLE SALES CHARGE) –
Class
A1 2/29/2016 —
2/28/2026
AVERAGE
ANNUAL TOTAL RETURNS (%) Period
Ended February 28, 2026
|
|
|
|
|
|
1
Year |
5
Year |
10
Year |
|
Class
A1 |
3.89
|
0.86
|
1.70
|
|
Class
A1 (with sales charge) |
-0.02
|
0.09
|
1.31
|
|
Bloomberg
Municipal Bond Index |
4.96
|
1.44
|
2.43
|
|
Bloomberg
New York Municipal Bond Index |
4.65
|
1.47
|
2.29
|
Fund
performance figures may reflect fee waivers and/or expense reimbursements, without which the performance would have been lower.
Effective
9/10/18, Class A shares closed to new investors, were renamed Class A1 shares, and a new Class A share with a different expense
structure became available.
Performance
for periods prior to March 1, 2019, has been restated to reflect the current maximum sales charge, which is lower than the maximum
sales charge prior to that date.
For current month-end performance,
please call Franklin Templeton at (800)
DIAL BEN/342-5236 or visit
https://www.franklintempleton.com/investments/options/mutual-funds.
Important data provider notices
and terms available at www.franklintempletondatasources.com.
KEY
FUND STATISTICS (as
of February 28, 2026)
|
|
|
Total
Net Assets |
$2,687,285,818
|
|
Total
Number of Portfolio Holdings |
450
|
|
Total
Management Fee Paid |
$12,319,831
|
|
Portfolio
Turnover Rate |
14.51%
|
| Franklin
New York Tax-Free Income Fund |
PAGE
2 |
115-ATSR-0426 |
Portfolio Composition* (%
of Total Investments)
| * |
Does
not include derivatives, except purchased options, if any. |
|
|
|
|
WHERE
CAN I FIND ADDITIONAL INFORMATION ABOUT THE FUND? |
|
Additional
information is available on https://www.franklintempleton.com/regulatory-fund-documents,
including its: |
|
•
prospectus • proxy voting information • financial information • holdings • tax information |
HOUSEHOLDING
You
will receive the Fund’s shareholder reports every six months. In addition, you will receive an annual updated summary prospectus
(detail prospectus available
upon request). To reduce Fund expenses, we try to identify related shareholders in a household and send only
one copy of the shareholder reports and summary prospectus. This process, called “householding,” will continue indefinitely
unless you instruct us otherwise.
If you prefer not to have these documents householded, please call us at (800)
DIAL BEN/342-5236. At any time,
you may view current prospectuses/summary prospectuses and shareholder reports on our website. If you choose, you may
receive these documents through electronic delivery.
| Franklin
New York Tax-Free Income Fund |
PAGE
3 |
115-ATSR-0426 |
9625968497139978109641090710841100141065910960113871000010025102761070011713118371175911159117641211212713100001002110247106461159511653116091100611651119811253820.019.710.59.99.69.59.54.53.23.10.5
|
|
|
|
Franklin
New York Tax-Free Income Fund |
|
|
Class
C [FNYIX]
|
|
Annual
Shareholder Report | February
28, 2026 |
|
|
This
annual
shareholder report
contains important information about Franklin
New York Tax-Free Income Fund for the period March
1, 2025, to February
28, 2026.
You
can find additional information about the Fund at https://www.franklintempleton.com/regulatory-fund-documents.
You can also request this information
by contacting us at (800)
DIAL BEN/342-5236.
|
|
|
|
Class
Name |
Costs
of a $10,000 investment
|
Costs
paid as a percentage of a $10,000
investment*
|
|
Class
C |
$122
|
%
|
| * |
Reflects
fee waivers and/or expense reimbursements, without which expenses would have been higher. |
HOW
DID THE FUND PERFORM LAST YEAR AND WHAT AFFECTED ITS PERFORMANCE?
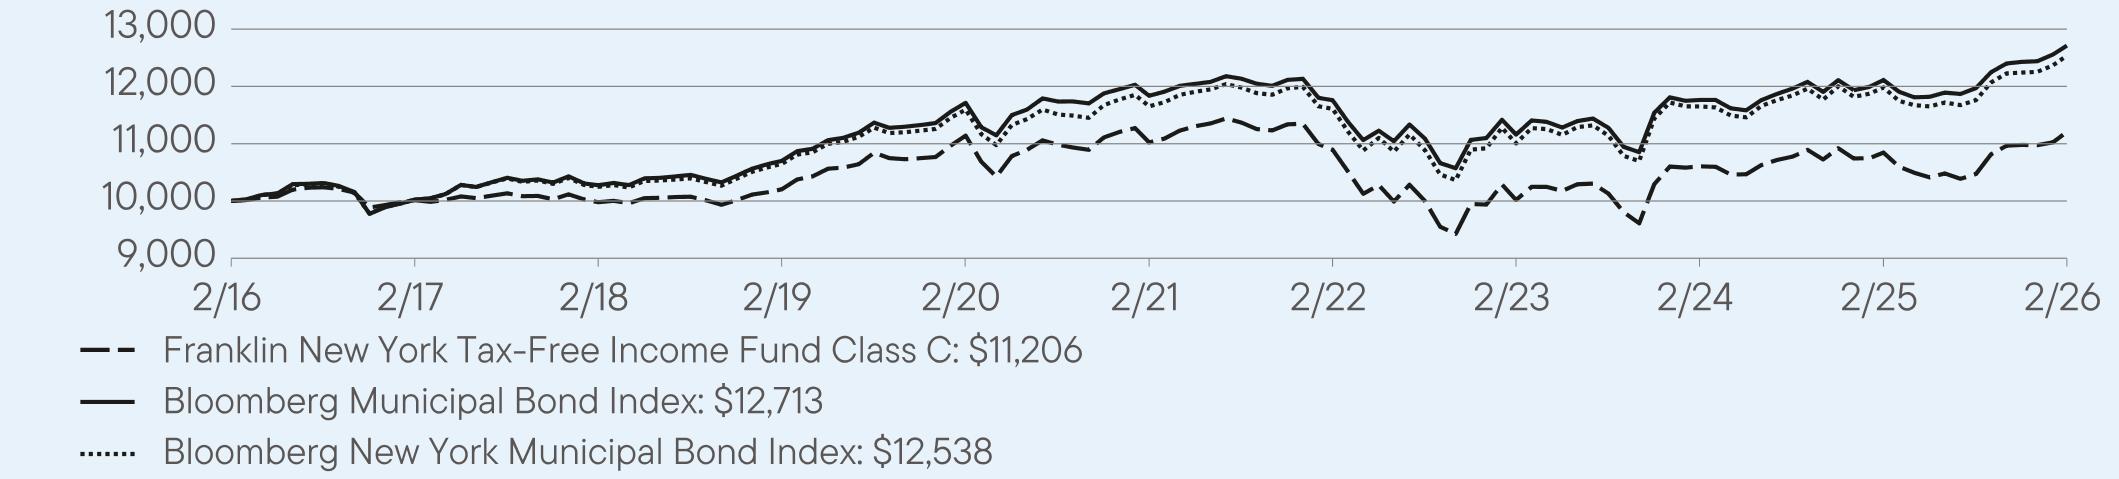
For the twelve months ended February
28, 2026, Class C shares of
Franklin New York Tax-Free Income Fund returned 3.33%.
The Fund compares its performance
to the Bloomberg New York Municipal Bond Index, which returned 4.65% for the same period.
|
|
|
Top
contributors to performance: |
|
↑
|
Overweight
to bonds with no external credit rating |
|
↑
|
Overweight
to bonds with 20 years to maturity |
|
↑
|
Overweight
to A rated bonds |
|
|
|
Top
detractors from performance: |
|
↓
|
Underweight
bonds with 10 years or less to maturity |
|
↓
|
Selection
in AA rated bonds |
|
↓
|
Selection
in A rated bonds |
| Franklin
New York Tax-Free Income Fund |
PAGE
1 |
215-ATSR-0426 |
HOW
DID THE FUND PERFORM OVER THE LAST 10 YEARS?
The
Fund’s past performance is not necessarily an indication of how the Fund will perform in the future. The
graph and table do not reflect
the deduction of taxes that a shareholder would pay on Fund distributions or redemption of Fund shares.
VALUE
OF A $10,000
INVESTMENT – Class
C 2/29/2016 —
2/28/2026
AVERAGE
ANNUAL TOTAL RETURNS (%) Period
Ended February 28, 2026
|
|
|
|
|
|
1
Year |
5
Year |
10
Year |
|
Class
C |
3.33
|
0.33
|
1.15
|
|
Class
C (with sales charge) |
2.33
|
0.33
|
1.15
|
|
Bloomberg
Municipal Bond Index |
4.96
|
1.44
|
2.43
|
|
Bloomberg
New York Municipal Bond Index |
4.65
|
1.47
|
2.29
|
Fund
performance figures may reflect fee waivers and/or expense reimbursements, without which the performance would have been lower.
For current month-end performance,
please call Franklin Templeton at (800)
DIAL BEN/342-5236 or visit
https://www.franklintempleton.com/investments/options/mutual-funds.
Important data provider notices
and terms available at www.franklintempletondatasources.com.
KEY
FUND STATISTICS (as
of February 28, 2026)
|
|
|
Total
Net Assets |
$2,687,285,818
|
|
Total
Number of Portfolio Holdings |
450
|
|
Total
Management Fee Paid |
$12,319,831
|
|
Portfolio
Turnover Rate |
14.51%
|
Portfolio Composition* (%
of Total Investments)
| * |
Does
not include derivatives, except purchased options, if any. |
| Franklin
New York Tax-Free Income Fund |
PAGE
2 |
215-ATSR-0426 |
|
|
|
|
WHERE
CAN I FIND ADDITIONAL INFORMATION ABOUT THE FUND? |
|
Additional
information is available on https://www.franklintempleton.com/regulatory-fund-documents,
including its: |
|
•
prospectus • proxy voting information • financial information • holdings • tax information |
HOUSEHOLDING
You
will receive the Fund’s shareholder reports every six months. In addition, you will receive an annual updated summary prospectus
(detail prospectus available
upon request). To reduce Fund expenses, we try to identify related shareholders in a household and send only
one copy of the shareholder reports and summary prospectus. This process, called “householding,” will continue indefinitely
unless you instruct us otherwise.
If you prefer not to have these documents householded, please call us at (800)
DIAL BEN/342-5236. At any time,
you may view current prospectuses/summary prospectuses and shareholder reports on our website. If you choose, you may
receive these documents through electronic delivery.
| Franklin
New York Tax-Free Income Fund |
PAGE
3 |
215-ATSR-0426 |
1000010014997810203111411102310896100181060510845112061000010025102761070011713118371175911159117641211212713100001002110247106461159511653116091100611651119811253820.019.710.59.99.69.59.54.53.23.10.5
|
|
|
|
Franklin
New York Tax-Free Income Fund |
|
|
Class
R6 [FKTJX]
|
|
Annual
Shareholder Report | February
28, 2026 |
|
|
This
annual
shareholder report
contains important information about Franklin
New York Tax-Free Income Fund for the period March
1, 2025, to February
28, 2026.
You
can find additional information about the Fund at https://www.franklintempleton.com/regulatory-fund-documents.
You can also request this information
by contacting us at (800)
DIAL BEN/342-5236.
|
|
|
|
Class
Name |
Costs
of a $10,000 investment
|
Costs
paid as a percentage of a $10,000
investment |
|
Class
R6 |
$51
|
%
|
HOW
DID THE FUND PERFORM LAST YEAR AND WHAT AFFECTED ITS PERFORMANCE?
For the twelve months ended February
28, 2026, Class R6 shares of
Franklin New York Tax-Free Income Fund returned 3.94%.
The Fund compares its performance
to the Bloomberg New York Municipal Bond Index, which returned 4.65% for the same period.
|
|
|
Top
contributors to performance: |
|
↑
|
Overweight
to bonds with no external credit rating |
|
↑
|
Overweight
to bonds with 20 years to maturity |
|
↑
|
Overweight
to A rated bonds |
|
|
|
Top
detractors from performance: |
|
↓
|
Underweight
bonds with 10 years or less to maturity |
|
↓
|
Selection
in AA rated bonds |
|
↓
|
Selection
in A rated bonds |
| Franklin
New York Tax-Free Income Fund |
PAGE
1 |
8115-ATSR-0426 |
HOW
DID THE FUND PERFORM OVER THE LAST 10 YEARS?
The
Fund’s past performance is not necessarily an indication of how the Fund will perform in the future. The
graph and table do not reflect
the deduction of taxes that a shareholder would pay on Fund distributions or redemption of Fund shares.
VALUE
OF A $10,000
INVESTMENT – Class
R6 2/29/2016 —
2/28/2026
AVERAGE
ANNUAL TOTAL RETURNS (%) Period
Ended February 28, 2026
|
|
|
|
|
|
1
Year |
5
Year |
10
Year |
|
Class
R6 |
3.94
|
1.01
|
1.81
|
|
Bloomberg
Municipal Bond Index |
4.96
|
1.44
|
2.43
|
|
Bloomberg
New York Municipal Bond Index |
4.65
|
1.47
|
2.29
|
Fund
performance figures may reflect fee waivers and/or expense reimbursements, without which the performance would have been lower.
The
Fund began offering Class R6 shares on 8/1/2017. Returns for periods before 8/1/2017, are based on the Fund’s Advisor Class performance,
which has been adjusted to take into account differences in class-specific operating expenses and maximum sales charges.
For periods after the share class offering, performance for the specific share class is used, reflecting the applicable expenses and
maximum sales charges.
For current month-end performance,
please call Franklin Templeton at (800)
DIAL BEN/342-5236 or visit
https://www.franklintempleton.com/investments/options/mutual-funds.
Important data provider notices
and terms available at www.franklintempletondatasources.com.
KEY
FUND STATISTICS (as
of February 28, 2026)
|
|
|
Total
Net Assets |
$2,687,285,818
|
|
Total
Number of Portfolio Holdings |
450
|
|
Total
Management Fee Paid |
$12,319,831
|
|
Portfolio
Turnover Rate |
14.51%
|
| Franklin
New York Tax-Free Income Fund |
PAGE
2 |
8115-ATSR-0426 |
Portfolio Composition* (%
of Total Investments)
| * |
Does
not include derivatives, except purchased options, if any. |
|
|
|
|
WHERE
CAN I FIND ADDITIONAL INFORMATION ABOUT THE FUND? |
|
Additional
information is available on https://www.franklintempleton.com/regulatory-fund-documents,
including its: |
|
•
prospectus • proxy voting information • financial information • holdings • tax information |
HOUSEHOLDING
You
will receive the Fund’s shareholder reports every six months. In addition, you will receive an annual updated summary prospectus
(detail prospectus available
upon request). To reduce Fund expenses, we try to identify related shareholders in a household and send only
one copy of the shareholder reports and summary prospectus. This process, called “householding,” will continue indefinitely
unless you instruct us otherwise.
If you prefer not to have these documents householded, please call us at (800)
DIAL BEN/342-5236. At any time,
you may view current prospectuses/summary prospectuses and shareholder reports on our website. If you choose, you may
receive these documents through electronic delivery.
| Franklin
New York Tax-Free Income Fund |
PAGE
3 |
8115-ATSR-0426 |
10000100611007810375114041136111310104641114911491119441000010025102761070011713118371175911159117641211212713100001002110247106461159511653116091100611651119811253820.019.710.59.99.69.59.54.53.23.10.5
|
|
|
|
Franklin
New York Tax-Free Income Fund |
|
|
Advisor
Class [FNYAX]
|
|
Annual
Shareholder Report | February
28, 2026 |
|
|
This
annual
shareholder report
contains important information about Franklin
New York Tax-Free Income Fund for the period March
1, 2025, to February
28, 2026.
You
can find additional information about the Fund at https://www.franklintempleton.com/regulatory-fund-documents.
You can also request this information
by contacting us at (800)
DIAL BEN/342-5236.
|
|
|
|
Class
Name |
Costs
of a $10,000 investment
|
Costs
paid as a percentage of a $10,000
investment*
|
|
Advisor
Class |
$56
|
%
|
| * |
Reflects
fee waivers and/or expense reimbursements, without which expenses would have been higher. |
HOW
DID THE FUND PERFORM LAST YEAR AND WHAT AFFECTED ITS PERFORMANCE?
For the twelve months ended February
28, 2026, Advisor Class shares
of Franklin New York Tax-Free Income Fund returned 3.99%.
The Fund compares its performance
to the Bloomberg New York Municipal Bond Index, which returned 4.65% for the same period.
|
|
|
Top
contributors to performance: |
|
↑
|
Overweight
to bonds with no external credit rating |
|
↑
|
Overweight
to bonds with 20 years to maturity |
|
↑
|
Overweight
to A rated bonds |
|
|
|
Top
detractors from performance: |
|
↓
|
Underweight
bonds with 10 years or less to maturity |
|
↓
|
Selection
in AA rated bonds |
|
↓
|
Selection
in A rated bonds |
| Franklin
New York Tax-Free Income Fund |
PAGE
1 |
615-ATSR-0426 |
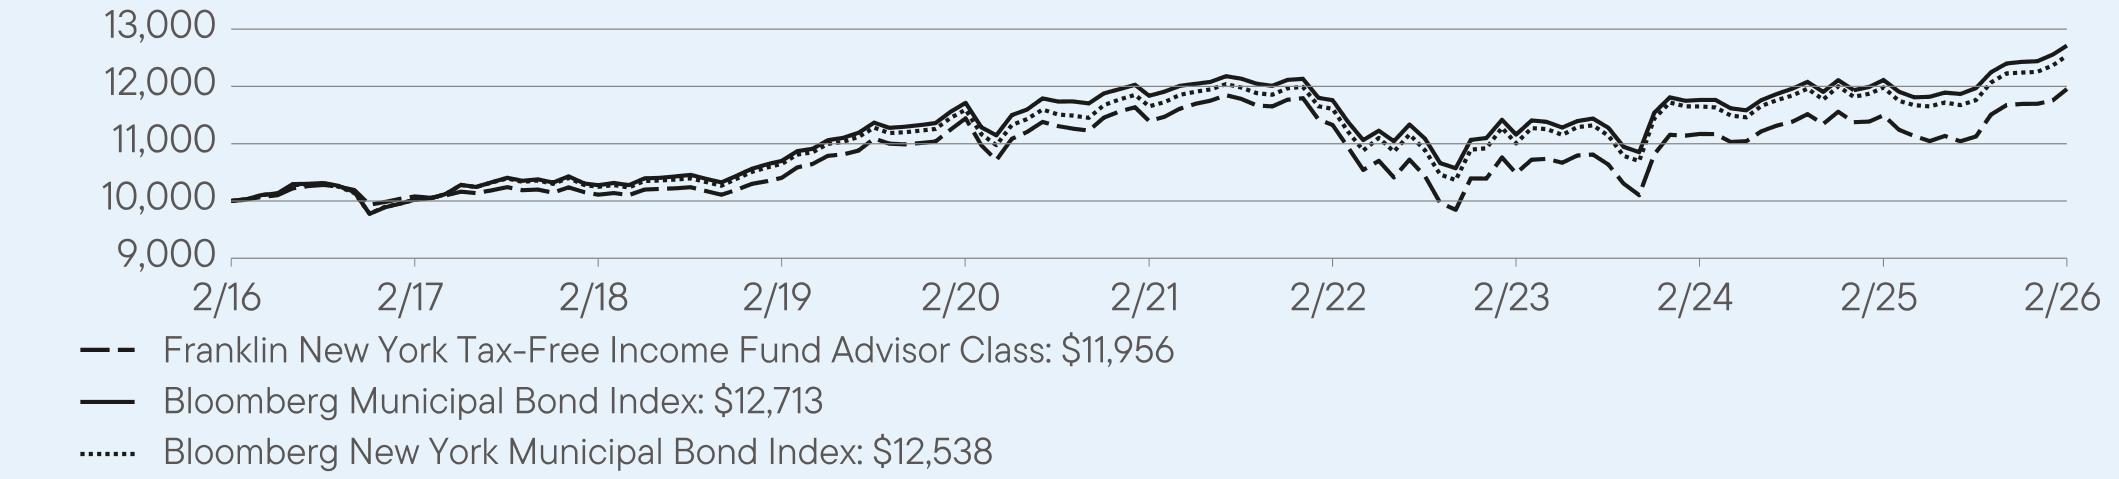
HOW
DID THE FUND PERFORM OVER THE LAST 10 YEARS?
The
Fund’s past performance is not necessarily an indication of how the Fund will perform in the future. The
graph and table do not reflect
the deduction of taxes that a shareholder would pay on Fund distributions or redemption of Fund shares.
VALUE
OF A $10,000
INVESTMENT – Advisor
Class 2/29/2016
— 2/28/2026
AVERAGE
ANNUAL TOTAL RETURNS (%) Period
Ended February 28, 2026
|
|
|
|
|
|
1
Year |
5
Year |
10
Year |
|
Advisor
Class |
3.99
|
0.96
|
1.80
|
|
Bloomberg
Municipal Bond Index |
4.96
|
1.44
|
2.43
|
|
Bloomberg
New York Municipal Bond Index |
4.65
|
1.47
|
2.29
|
Fund
performance figures may reflect fee waivers and/or expense reimbursements, without which the performance would have been lower.
For current month-end performance,
please call Franklin Templeton at (800)
DIAL BEN/342-5236 or visit
https://www.franklintempleton.com/investments/options/mutual-funds.
Important data provider notices
and terms available at www.franklintempletondatasources.com.
KEY
FUND STATISTICS (as
of February 28, 2026)
|
|
|
Total
Net Assets |
$2,687,285,818
|
|
Total
Number of Portfolio Holdings |
450
|
|
Total
Management Fee Paid |
$12,319,831
|
|
Portfolio
Turnover Rate |
14.51%
|
Portfolio Composition* (%
of Total Investments)
| * |
Does
not include derivatives, except purchased options, if any. |
| Franklin
New York Tax-Free Income Fund |
PAGE
2 |
615-ATSR-0426 |
|
|
|
|
WHERE
CAN I FIND ADDITIONAL INFORMATION ABOUT THE FUND? |
|
Additional
information is available on https://www.franklintempleton.com/regulatory-fund-documents,
including its: |
|
•
prospectus • proxy voting information • financial information • holdings • tax information |
HOUSEHOLDING
You
will receive the Fund’s shareholder reports every six months. In addition, you will receive an annual updated summary prospectus
(detail prospectus available
upon request). To reduce Fund expenses, we try to identify related shareholders in a household and send only
one copy of the shareholder reports and summary prospectus. This process, called “householding,” will continue indefinitely
unless you instruct us otherwise.
If you prefer not to have these documents householded, please call us at (800)
DIAL BEN/342-5236. At any time,
you may view current prospectuses/summary prospectuses and shareholder reports on our website. If you choose, you may
receive these documents through electronic delivery.
| Franklin
New York Tax-Free Income Fund |
PAGE
3 |
615-ATSR-0426 |
10000100801011010404114431139611328104841117011497119561000010025102761070011713118371175911159117641211212713100001002110247106461159511653116091100611651119811253820.019.710.59.99.69.59.54.53.23.10.5
(b) Not applicable
(a) The Registrant has adopted a code of ethics that applies
to its principal executive officers and principal financial and accounting officer.
(c) N/A
(d) N/A
(f) Pursuant to Item 19(a) (1), the Registrant is
attaching as an exhibit a copy of its code of ethics that applies to its principal executive officers and principal financial and
accounting officer.
| ITEM 3. |
AUDIT COMMITTEE FINANCIAL EXPERT. |
The Board of Trustees of the Registrant
has determined that Mary C. Choksi, possesses the technical attributes identified in Item 3 to Form N-CSR to qualify as an “audit
committee financial expert,” and has designated Mary C. Choksi as the Audit Committee’s financial expert. Mary C. Choksi is
an “independent” Trustee pursuant to paragraph (a)(2) of Item 3 to Form N-CSR.
Under applicable securities laws, a person
determined to be an audit committee financial expert will not be deemed an “expert” for any purpose, including without limitation
for the purposes of Section 11 of the Securities Act of 1933, as a result of being designated or identified as an audit committee financial
expert. The designation or identification of a person as an audit committee financial expert does not impose on such person any duties,
obligations, or liabilities greater than the duties, obligations, and liabilities imposed on such person as a member of the audit committee
and board of directors in the absence of such designation or identification. The designation or identification of a person as an audit
committee financial expert does not affect the duties, obligations, or liability of any other member of the audit committee or board of
directors.
|
ITEM 4. |
PRINCIPAL ACCOUNTANT FEES AND SERVICES. |
a) Audit Fees.
The aggregate fees billed in the last two fiscal years ending February 28, 2025 and February 28, 2026 (the “Reporting Periods”)
for professional services rendered by the Registrant’s principal accountant (the “Auditor”) for the audit of the Registrant’s
annual financial statements, or services that are normally provided by the Auditor in connection with the statutory and regulatory filings
or engagements for the Reporting Periods, were $47,132 in February 28, 2025 and $42,511 in February 28, 2026.
b) Audit-Related
Fees. The aggregate fees billed in the Reporting Periods for assurance and related services by the Auditor that are reasonably
related to the performance of the Registrant’s financial statements were $0 in February 28, 2025 and $0 in February 28, 2026.
(c) Tax Fees.
The aggregate fees billed in the Reporting Periods for professional services rendered by the Auditor for tax compliance, tax advice and
tax planning (“Tax Services”) were $9,750 in February 28, 2025 and $9,750 in February 28, 2026. These services consisted of
(i) review or preparation of U.S. federal, state, local and excise tax returns; (ii) U.S. federal, state and local tax planning, advice
and assistance regarding statutory, regulatory or administrative developments, and (iii) tax advice regarding tax qualification matters
and/or treatment of various financial instruments held or proposed to be acquired or held.
There were no fees billed for tax services by the Registrant’s
investment adviser and any entity controlling, controlled by, or under common control with the investment adviser that provides ongoing
services to the Registrant (“Service Affiliates”) during the Reporting Periods that required pre-approval by the Audit Committee.
(d) All Other Fees.
The aggregate fees billed in the Reporting Periods for products and services provided by the Auditor to the Registrant, other than the
services reported in paragraphs (a) through (c) of this item, were $0 in February 28, 2025 and $0
in February 28, 2026.
There were no other non-audit services rendered by the Auditor
to the Service Affiliates requiring pre-approval by the Audit Committee in the Reporting Periods.
(e) Audit Committee’s pre–approval policies and
procedures described in paragraph (c) (7) of Rule 2-01 of Regulation S-X.
(1) The Registrant’s Audit Committee is directly responsible
for approving the services to be provided by the Auditors, including:
(i) pre-approval of all audit and audit
related services;
(ii) pre-approval of all non-audit related
services to be provided to the Registrant by the Auditors;
(iii) pre-approval of all non-audit related
services to be provided by the Auditors to the Registrant and the Service Affiliates where the non-audit services relate directly to the
operations or financial reporting of the Registrant; and
(iv) establishment by the Audit Committee,
if deemed necessary or appropriate, as an alternative to committee pre-approval of services to be provided by the Auditors, as required
by paragraphs (ii) and (iii) above, of policies and procedures to permit such services to be pre-approved by other means, such as through
establishment of guidelines or by action of a designated member or members of the committee; provided the policies and procedures are
detailed as to the particular service and the committee is informed of each service and such policies and procedures do not include delegation
of Audit Committee responsibilities, as contemplated under the Securities Exchange Act of 1934, to management; subject, in the case of
(ii) through (iv), to any waivers, exceptions or exemptions that may be available under applicable law or rules.
(2) None of the services described in paragraphs (b) through
(d) of this Item were performed in reliance on paragraph (c)(7)(i)(C) of Rule 2-01 of Regulation S-X.
(f) Not applicable.
(g) Non-audit fees billed by the Auditor for services rendered
to the Registrant and the Service Affiliates during the reporting period were $489,326 in February 28, 2025 and $1,690,011 in February
28, 2026.
(h) Yes. The Registrant’s Audit Committee has considered
whether the provision of non-audit services that were rendered to Service Affiliates, which were not pre-approved (not requiring pre-approval),
is compatible with maintaining the Auditor’s independence. All services provided by the Auditor to the Registrant or to the Service
Affiliates, which were required to be pre-approved, were pre-approved as required.
(i) Not applicable.
(j) Not applicable.
| ITEM 5. |
AUDIT COMMITTEE OF LISTED REGISTRANTS. |
Not applicable.
| ITEM 6. |
SCHEDULE OF INVESTMENTS. |
|
(a) |
Please see schedule of investments contained in the Financial Statements and Financial
Highlights included under Item 7 of this Form N-CSR. |
|
ITEM 7. |
FINANCIAL STATEMENTS AND FINANCIAL HIGHLIGHTS FOR OPEN-END MANAGEMENT INVESTMENT COMPANIES. |
Franklin
New
York
Tax-Free
Income
Fund
Financial
Statements
and
Other
Important
Information
Annual
|
February
28,
2026
If
you
need
assistance
accessing
this
content,
please
reach
out
to
your
sales
representative
or
send
an
email
to
accessibility@franklintempleton.com
.
Financial
Statements
and
Other
Important
Information—Annual
Financial
Highlights
and
Schedule
of
Investments
2
Financial
Statements
19
Notes
to
Financial
Statements
23
Report
of
Independent
Registered
Public
Accounting
Firm
31
Tax
Information
32
Changes
In
and
Disagreements
with
Accountants
33
Results
of
Meeting(s)
of
Shareholders
33
Remuneration
Paid
to
Directors,
Officers
and
Others
33
Board
Approval
of
Management
and
Subadvisory
Agreements
33
Franklin
New
York
Tax-Free
Income
Fund
Annual
Report
The
accompanying
notes
are
an
integral
part
of
these
financial
statements.
a
Year
Ended
February
28,
Year
Ended
February
28,
2022
b
Year
Ended
May
31,
2021
2026
2025
2024
a
2023
Class
A
Per
share
operating
performance
(for
a
share
outstanding
throughout
the
year)
Net
asset
value,
beginning
of
year
.......
$9.98
$10.02
$9.72
$10.83
$11.38
$11.09
Income
from
investment
operations
c
:
Net
investment
income
d
.............
0.33
0.31
0.30
0.27
0.19
0.28
Net
realized
and
unrealized
gains
(losses)
0.02
(0.04)
0.30
(1.11)
(0.55)
0.29
Total
from
investment
operations
........
0.35
0.27
0.60
(0.84)
(0.36)
0.57
Less
distributions
from:
Net
investment
income
..............
(0.33)
(0.31)
(0.30)
(0.27)
(0.19)
(0.28)
Net
asset
value,
end
of
year
...........
$10.00
$9.98
$10.02
$9.72
$10.83
$11.38
Total
return
e
.......................
3.63%
2.78%
6.29%
(7.77)%
(3.25)%
5.15%
Ratios
to
average
net
assets
f
Expenses
.........................
0.80%
0.78%
g
0.75%
g
0.81%
g
0.82%
g
0.78%
g
Net
investment
income
...............
3.44%
3.13%
3.08%
2.74%
2.21%
2.48%
Supplemental
data
Net
assets,
end
of
year
(000’s)
.........
$338,951
$351,699
$361,554
$351,002
$409,409
$367,358
Portfolio
turnover
rate
................
14.51%
19.14%
15.99%
22.81%
11.94%
12.15%
a
For
the
year
ended
February
29.
b
For
the
period
June
1,
2021
to
February
28,
2022.
c
The
amount
shown
for
a
share
outstanding
throughout
the
period
may
not
correlate
with
the
Statement
of
Operations
for
the
period
due
to
the
timing
of
sales
and
repurchas-
es
of
the
Fund’s
shares
in
relation
to
income
earned
and/or
fluctuating
fair
value
of
the
investments
of
the
Fund.
d
Based
on
average
daily
shares
outstanding.
e
Total
return
does
not
reflect
sales
commissions
or
contingent
deferred
sales
charges,
if
applicable,
and
is
not
annualized
for
periods
less
than
one
year.
f
Ratios
are
annualized
for
periods
less
than
one
year.
g
Benefit
of
expense
reduction
rounds
to
less
than
0.01%.
Franklin
New
York
Tax-Free
Income
Fund
Financial
Highlights
The
accompanying
notes
are
an
integral
part
of
these
financial
statements.
Annual
Report
a
Year
Ended
February
28,
Year
Ended
February
28,
2022
b
Year
Ended
May
31,
2021
2026
2025
2024
a
2023
Class
A1
Per
share
operating
performance
(for
a
share
outstanding
throughout
the
year)
Net
asset
value,
beginning
of
year
.......
$9.98
$10.03
$9.73
$10.84
$11.39
$11.10
Income
from
investment
operations
c
:
Net
investment
income
d
.............
0.35
0.33
0.32
0.29
0.20
0.30
Net
realized
and
unrealized
gains
(losses)
0.02
(0.05)
0.29
(1.12)
(0.55)
0.28
Total
from
investment
operations
........
0.37
0.28
0.61
(0.83)
(0.35)
0.58
Less
distributions
from:
Net
investment
income
..............
(0.34)
(0.33)
(0.31)
(0.28)
(0.20)
(0.29)
Net
asset
value,
end
of
year
...........
$10.01
$9.98
$10.03
$9.73
$10.84
$11.39
Total
return
e
.......................
3.89%
2.83%
6.44%
(7.63)%
(3.13)%
5.31%
Ratios
to
average
net
assets
f
Expenses
.........................
0.65%
0.63%
g
0.60%
g
0.66%
g
0.67%
g
0.63%
g
Net
investment
income
...............
3.59%
3.28%
3.23%
2.89%
2.36%
2.63%
Supplemental
data
Net
assets,
end
of
year
(000’s)
.........
$1,539,847
$1,690,956
$1,891,646
$2,010,712
$2,514,275
$2,775,454
Portfolio
turnover
rate
................
14.51%
19.14%
15.99%
22.81%
11.94%
12.15%
a
For
the
year
ended
February
29.
b
For
the
period
June
1,
2021
to
February
28,
2022.
c
The
amount
shown
for
a
share
outstanding
throughout
the
period
may
not
correlate
with
the
Statement
of
Operations
for
the
period
due
to
the
timing
of
sales
and
repurchas-
es
of
the
Fund’s
shares
in
relation
to
income
earned
and/or
fluctuating
fair
value
of
the
investments
of
the
Fund.
d
Based
on
average
daily
shares
outstanding.
e
Total
return
does
not
reflect
sales
commissions
or
contingent
deferred
sales
charges,
if
applicable,
and
is
not
annualized
for
periods
less
than
one
year.
f
Ratios
are
annualized
for
periods
less
than
one
year.
g
Benefit
of
expense
reduction
rounds
to
less
than
0.01%.
Franklin
New
York
Tax-Free
Income
Fund
Financial
Highlights
Annual
Report
The
accompanying
notes
are
an
integral
part
of
these
financial
statements.
a
Year
Ended
February
28,
Year
Ended
February
28,
2022
b
Year
Ended
May
31,
2021
2026
2025
2024
a
2023
Class
C
Per
share
operating
performance
(for
a
share
outstanding
throughout
the
year)
Net
asset
value,
beginning
of
year
.......
$9.97
$10.02
$9.72
$10.82
$11.38
$11.08
Income
from
investment
operations
c
:
Net
investment
income
d
.............
0.29
0.27
0.26
0.23
0.15
0.24
Net
realized
and
unrealized
gains
(losses)
0.03
(0.05)
0.30
(1.10)
(0.56)
0.29
Total
from
investment
operations
........
0.32
0.22
0.56
(0.87)
(0.41)
0.53
Less
distributions
from:
Net
investment
income
..............
(0.29)
(0.27)
(0.26)
(0.23)
(0.15)
(0.23)
Net
asset
value,
end
of
year
...........
$10.00
$9.97
$10.02
$9.72
$10.82
$11.38
Total
return
e
.......................
3.33%
2.26%
5.86%
(8.06)%
(3.62)%
4.83%
Ratios
to
average
net
assets
f
Expenses
.........................
1.20%
1.18%
g
1.15%
g
1.21%
g
1.22%
g
1.18%
g
Net
investment
income
...............
3.04%
2.73%
2.67%
2.33%
1.82%
2.10%
Supplemental
data
Net
assets,
end
of
year
(000’s)
.........
$28,569
$47,875
$64,099
$89,134
$129,772
$202,215
Portfolio
turnover
rate
................
14.51%
19.14%
15.99%
22.81%
11.94%
12.15%
a
For
the
year
ended
February
29.
b
For
the
period
June
1,
2021
to
February
28,
2022.
c
The
amount
shown
for
a
share
outstanding
throughout
the
period
may
not
correlate
with
the
Statement
of
Operations
for
the
period
due
to
the
timing
of
sales
and
repurchas-
es
of
the
Fund’s
shares
in
relation
to
income
earned
and/or
fluctuating
fair
value
of
the
investments
of
the
Fund.
d
Based
on
average
daily
shares
outstanding.
e
Total
return
does
not
reflect
sales
commissions
or
contingent
deferred
sales
charges,
if
applicable,
and
is
not
annualized
for
periods
less
than
one
year.
f
Ratios
are
annualized
for
periods
less
than
one
year.
g
Benefit
of
expense
reduction
rounds
to
less
than
0.01%.
Franklin
New
York
Tax-Free
Income
Fund
Financial
Highlights
The
accompanying
notes
are
an
integral
part
of
these
financial
statements.
Annual
Report
a
Year
Ended
February
28,
Year
Ended
February
28,
2022
b
Year
Ended
May
31,
2021
2026
2025
2024
a
2023
Class
R6
Per
share
operating
performance
(for
a
share
outstanding
throughout
the
year)
Net
asset
value,
beginning
of
year
.......
$10.00
$10.04
$9.74
$10.85
$11.41
$11.11
Income
from
investment
operations
c
:
Net
investment
income
d
.............
0.36
0.34
0.33
0.30
0.21
0.31
Net
realized
and
unrealized
gains
(losses)
0.02
(0.04)
0.30
(1.11)
(0.55)
0.30
Total
from
investment
operations
........
0.38
0.30
0.63
(0.81)
(0.34)
0.61
Less
distributions
from:
Net
investment
income
..............
(0.36)
(0.34)
(0.33)
(0.30)
(0.22)
(0.31)
Net
asset
value,
end
of
year
...........
$10.02
$10.00
$10.04
$9.74
$10.85
$11.41
Total
return
e
.......................
3.94%
3.07%
6.55%
(7.48)%
(3.10)%
5.54%
Ratios
to
average
net
assets
f
Expenses
.........................
0.50%
0.49%
g
0.49%
g
0.51%
g
0.50%
g
0.50%
g
Net
investment
income
...............
3.74%
3.42%
3.34%
3.04%
2.52%
2.76%
Supplemental
data
Net
assets,
end
of
year
(000’s)
.........
$145,803
$124,350
$98,748
$86,891
$97,268
$89,785
Portfolio
turnover
rate
................
14.51%
19.14%
15.99%
22.81%
11.94%
12.15%
a
For
the
year
ended
February
29.
b
For
the
period
June
1,
2021
to
February
28,
2022.
c
The
amount
shown
for
a
share
outstanding
throughout
the
period
may
not
correlate
with
the
Statement
of
Operations
for
the
period
due
to
the
timing
of
sales
and
repurchas-
es
of
the
Fund’s
shares
in
relation
to
income
earned
and/or
fluctuating
fair
value
of
the
investments
of
the
Fund.
d
Based
on
average
daily
shares
outstanding.
e
Total
return
is
not
annualized
for
periods
less
than
one
year.
f
Ratios
are
annualized
for
periods
less
than
one
year.
g
Benefit
of
expense
reduction
rounds
to
less
than
0.01%.
Franklin
New
York
Tax-Free
Income
Fund
Financial
Highlights
Annual
Report
The
accompanying
notes
are
an
integral
part
of
these
financial
statements.
a
Year
Ended
February
28,
Year
Ended
February
28,
2022
b
Year
Ended
May
31,
2021
2026
2025
2024
a
2023
Advisor
Class
Per
share
operating
performance
(for
a
share
outstanding
throughout
the
year)
Net
asset
value,
beginning
of
year
.......
$9.99
$10.04
$9.74
$10.84
$11.40
$11.10
Income
from
investment
operations
c
:
Net
investment
income
d
.............
0.36
0.34
0.33
0.30
0.21
0.31
Net
realized
and
unrealized
gains
(losses)
0.02
(0.05)
0.29
(1.11)
(0.56)
0.29
Total
from
investment
operations
........
0.38
0.29
0.62
(0.81)
(0.35)
0.60
Less
distributions
from:
Net
investment
income
..............
(0.35)
(0.34)
(0.32)
(0.29)
(0.21)
(0.30)
Net
asset
value,
end
of
year
...........
$10.02
$9.99
$10.04
$9.74
$10.84
$11.40
Total
return
e
.......................
3.99%
2.93%
6.54%
(7.44)%
(3.15)%
5.50%
Ratios
to
average
net
assets
f
Expenses
.........................
0.55%
0.53%
g
0.50%
g
0.57%
g
0.57%
g
0.53%
g
Net
investment
income
...............
3.69%
3.38%
3.35%
3.01%
2.46%
2.73%
Supplemental
data
Net
assets,
end
of
year
(000’s)
.........
$634,117
$638,348
$489,421
$328,181
$277,600
$287,411
Portfolio
turnover
rate
................
14.51%
19.14%
15.99%
22.81%
11.94%
12.15%
a
For
the
year
ended
February
29.
b
For
the
period
June
1,
2021
to
February
28,
2022.
c
The
amount
shown
for
a
share
outstanding
throughout
the
period
may
not
correlate
with
the
Statement
of
Operations
for
the
period
due
to
the
timing
of
sales
and
repurchas-
es
of
the
Fund’s
shares
in
relation
to
income
earned
and/or
fluctuating
fair
value
of
the
investments
of
the
Fund.
d
Based
on
average
daily
shares
outstanding.
e
Total
return
is
not
annualized
for
periods
less
than
one
year.
f
Ratios
are
annualized
for
periods
less
than
one
year.
g
Benefit
of
expense
reduction
rounds
to
less
than
0.01%.
Franklin
New
York
Tax-Free
Income
Fund
Schedule
of
Investments,
February
28,
2026
The
accompanying
notes
are
an
integral
part
of
these
financial
statements.
Annual
Report
a
a
Principal
Amount
a
Value
a
a
a
a
a
Corporate
Bonds
0.3%
Software
0.3%
a
Haven
at
Elgin
LLC
,
5.25
%
,
12/31/53
....................................
$
6,700,000
$
7,090,824
Total
Corporate
Bonds
(Cost
$
6,700,000
)
.......................................
7,090,824
Municipal
Bonds
97.7%
California
0.2%
California
Municipal
Finance
Authority
,
Integrity
Housing
Obligated
Group
,
Revenue
,
2022
A-1
,
4.25
%
,
12/01/37
...........................................
5,800,000
4,887,245
Florida
1.6%
Capital
Trust
Agency,
Inc.
,
Kingdom
Development
West
Palm
Beach
Portfolio
Obligated
Group
,
Revenue
,
2021
A-1
,
3.75
%
,
12/01/36
.............................................
18,760,000
17,278,664
Kingdom
Development
West
Palm
Beach
Portfolio
Obligated
Group
,
Revenue
,
2021
A-2
,
5.5
%
,
12/01/30
..............................................
2,770,000
2,623,951
b
SHI
-
Lake
Osborne
LLC
,
Revenue
,
144A,
2021
A-1
,
3.68
%
,
1/01/57
...........
3,990,000
2,834,494
b
,c
Capital
Trust
Authority
,
Gulf
Coast
Portfolio
Obligated
Group
,
Revenue
,
144A,
2024
,
Refunding
,
5.29
%,
3/01/29
...........................................
22,800,000
19,530,653
42,267,762
Georgia
0.4%
Development
Authority
of
Rockdale
County
,
Revenue
,
2025
A-1
,
Refunding
,
5.375
%
,
12/01/36
.........................
1,935,000
2,070,507
c
Revenue,
Sub.
Lien
,
2025
A-1
,
Refunding
,
3.56
%,
12/01/45
..................
15,875,000
7,957,058
10,027,565
Illinois
0.6%
Metropolitan
Pier
&
Exposition
Authority
,
State
of
Illinois
McCormick
Place
Expansion
Project
Fund
,
Revenue
,
2022
A
,
Refunding
,
4
%
,
12/15/42
...........................................
6,970,000
6,887,316
State
of
Illinois
McCormick
Place
Expansion
Project
Fund
,
Revenue
,
2022
A
,
Refunding
,
4
%
,
6/15/52
............................................
10,310,000
8,900,928
15,788,244
New
Jersey
0.2%
New
Jersey
Transportation
Trust
Fund
Authority
,
State
of
New
Jersey
,
Revenue
,
2020
AA
,
5
%
,
6/15/50
......................
3,725,000
3,821,431
State
of
New
Jersey
,
Revenue
,
2020
AA
,
Pre-Refunded
,
5
%
,
6/15/50
...........
1,025,000
1,162,049
4,983,480
New
York
89.3%
Albany
Capital
Resource
Corp.
,
Revenue
,
2025
A
,
5.25
%
,
5/01/50
.....................................
4,000,000
4,272,008
Albany
College
of
Pharmacy
and
Health
Sciences
,
Revenue
,
2022
A
,
Refunding
,
5.25
%
,
12/01/38
.................................................
6,505,000
6,879,882
Equitable
School
Revolving
Fund
LLC
Obligated
Group
,
Revenue
,
2021
D
,
4
%
,
11/01/51
.......................................................
2,000,000
1,803,429
KIPP
Capital
Region
Public
Charter
Schools
,
Revenue
,
2024
,
4.75
%
,
6/01/54
....
1,200,000
1,145,208
KIPP
Capital
Region
Public
Charter
Schools
,
Revenue
,
2024
,
5
%
,
6/01/64
.......
2,250,000
2,189,809
Allegany
County
Capital
Resource
Corp.
,
Alfred
University
,
Revenue
,
2024
,
5.25
%
,
4/01/49
..........................
1,700,000
1,724,639
Alfred
University
,
Revenue
,
2024
,
5.25
%
,
4/01/54
..........................
3,000,000
3,020,507
Battery
Park
City
Authority
,
Revenue,
Senior
Lien
,
2023
A
,
5
%
,
11/01/48
.............................
20,000,000
21,233,116
d
Revenue,
Senior
Lien
,
2025
,
Refunding
,
5.25
%
,
11/01/55
....................
6,000,000
6,481,879
Brookhaven
Local
Development
Corp.
,
Active
Retirement
Community,
Inc.
Obligated
Group
,
Revenue
,
2020
A
,
4
%
,
11/01/45
1,500,000
1,396,217
Active
Retirement
Community,
Inc.
Obligated
Group
,
Revenue
,
2020
A
,
4
%
,
11/01/55
8,000,000
6,850,157
Franklin
New
York
Tax-Free
Income
Fund
Schedule
of
Investments
Annual
Report
The
accompanying
notes
are
an
integral
part
of
these
financial
statements.
a
a
Principal
Amount
a
Value
a
a
a
a
a
Municipal
Bonds
(continued)
New
York
(continued)
Broome
County
Local
Development
Corp.
,
Good
Shepherd
Village
at
Endwell
Obligated
Group
,
Revenue
,
2021
,
Refunding
,
4
%
,
7/01/36
........................................................
$
1,600,000
$
1,617,253
Good
Shepherd
Village
at
Endwell
Obligated
Group
,
Revenue
,
2021
,
Refunding
,
4
%
,
7/01/41
........................................................
1,530,000
1,485,893
Good
Shepherd
Village
at
Endwell
Obligated
Group
,
Revenue
,
2021
,
Refunding
,
4
%
,
7/01/47
........................................................
1,160,000
1,017,142
United
Health
Services
Hospitals
Obligated
Group
,
Revenue
,
2020
,
Refunding
,
AG
Insured
,
3
%
,
4/01/45
..............................................
7,045,000
5,748,627
Buffalo
&
Erie
County
Industrial
Land
Development
Corp.
,
Catholic
Health
System
Obligated
Group
,
Revenue
,
2015
,
5.25
%
,
7/01/35
.......
1,000,000
999,997
Catholic
Health
System
Obligated
Group
,
Revenue
,
2015
,
5
%
,
7/01/40
.........
1,000,000
967,818
D'Youville
University
,
Revenue
,
2020
A
,
Refunding
,
4
%
,
11/01/50
..............
2,500,000
1,892,181
Build
NYC
Resource
Corp.
,
487
West
129th
street
Transitional
Housing
Development
Fund
Corp.
Obligated
Group
,
Revenue
,
2025
A
,
5.5
%
,
12/01/51
..............................
1,000,000
1,066,547
487
West
129th
street
Transitional
Housing
Development
Fund
Corp.
Obligated
Group
,
Revenue
,
2025
A
,
5.5
%
,
12/01/56
..............................
1,000,000
1,061,866
Academic
Leadership
Charter
School
,
Revenue
,
2021
,
4
%
,
6/15/36
............
400,000
395,052
Classical
Charter
School,
Inc.
,
Revenue
,
2023
A
,
4.5
%
,
6/15/43
...............
700,000
669,943
Classical
Charter
School,
Inc.
,
Revenue
,
2023
A
,
4.75
%
,
6/15/53
..............
850,000
769,101
Classical
Charter
School,
Inc.
,
Revenue
,
2023
A
,
4.75
%
,
6/15/58
..............
725,000
647,177
Grand
Concourse
Academy
Charter
School
,
Revenue
,
2022
A
,
5
%
,
7/01/42
......
1,200,000
1,222,345
Grand
Concourse
Academy
Charter
School
,
Revenue
,
2022
A
,
5
%
,
7/01/52
......
725,000
704,341
Grand
Concourse
Academy
Charter
School
,
Revenue
,
2022
A
,
5
%
,
7/01/56
......
570,000
548,410
KIPP
NYC
Public
Charter
Schools
,
Revenue
,
2022
,
5.25
%
,
7/01/52
............
4,000,000
4,053,538
KIPP
NYC
Public
Charter
Schools
,
Revenue
,
2022
,
5.25
%
,
7/01/57
............
1,000,000
1,009,543
KIPP
NYC
Public
Charter
Schools
,
Revenue
,
2022
,
5.25
%
,
7/01/62
............
1,500,000
1,510,279
TrIPs
Obligated
Group
,
Revenue
,
2025
,
5.5
%
,
7/01/50
......................
4,500,000
4,760,156
TrIPs
Obligated
Group
,
Revenue
,
2025
,
5.5
%
,
7/01/55
......................
4,925,000
5,163,287
e
Chautauqua
County
Capital
Resource
Corp.
,
NRG
Energy,
Inc.
,
Revenue
,
2020
,
Refunding
,
Mandatory
Put
,
4.25
%
,
4/03/28
...............................
2,000,000
2,050,683
City
of
Long
Beach
,
GO
,
2022
B
,
BAM
Insured
,
5.25
%
,
7/15/42
.................
1,010,000
1,079,827
City
of
New
York
,
GO
,
2018
E-1
,
5
%
,
3/01/40
..........................................
14,330,000
14,884,057
GO
,
2018
E-1
,
5
%
,
3/01/44
..........................................
12,500,000
12,846,625
GO
,
2018
F-1
,
5
%
,
4/01/40
..........................................
16,210,000
16,858,552
GO
,
2018
F-1
,
5
%
,
4/01/45
..........................................
10,000,000
10,266,397
GO
,
2019
D-1
,
4
%
,
12/01/43
.........................................
10,000,000
9,887,067
GO
,
2022
D-1
,
5.25
%
,
5/01/41
........................................
1,500,000
1,661,545
GO
,
2023
A-1
,
4
%
,
9/01/46
..........................................
5,000,000
4,828,948
GO
,
2023
E-1
,
4
%
,
4/01/45
..........................................
3,000,000
2,946,032
GO
,
2024
D
,
5.5
%
,
4/01/49
..........................................
10,000,000
10,819,375
GO
,
2024
D
,
5.25
%
,
4/01/54
.........................................
10,500,000
11,053,705
GO
,
2025
E
,
5.25
%
,
8/01/50
.........................................
4,500,000
4,791,085
GO
,
2025
E
,
5
%
,
8/01/54
............................................
4,500,000
4,661,926
GO
,
2025
G-1
,
5.25
%
,
2/01/53
........................................
1,150,000
1,219,936
GO
,
2026
D
,
5.25
%
,
10/01/55
........................................
8,000,000
8,476,422
b
Clinton
County
Capital
Resource
Corp.
,
Clinton-Essex-Warren-Washington
Board
of
Cooperative
Educational
Services
,
Revenue
,
144A,
2025
,
4.5
%
,
7/01/40
.................................
600,000
628,602
Clinton-Essex-Warren-Washington
Board
of
Cooperative
Educational
Services
,
Revenue
,
144A,
2025
,
5
%
,
7/01/46
...................................
900,000
937,005
Dutchess
County
Local
Development
Corp.
,
Culinary
Institute
of
America
(The)
,
Revenue
,
2021
,
Refunding
,
5
%
,
7/01/32
......
175,000
192,846
Culinary
Institute
of
America
(The)
,
Revenue
,
2021
,
Refunding
,
5
%
,
7/01/33
......
185,000
203,215
Culinary
Institute
of
America
(The)
,
Revenue
,
2021
,
Refunding
,
5
%
,
7/01/34
......
500,000
546,463
Franklin
New
York
Tax-Free
Income
Fund
Schedule
of
Investments
The
accompanying
notes
are
an
integral
part
of
these
financial
statements.
Annual
Report
a
a
Principal
Amount
a
Value
a
a
a
a
a
Municipal
Bonds
(continued)
New
York
(continued)
Dutchess
County
Local
Development
Corp.,
(continued)
Culinary
Institute
of
America
(The)
,
Revenue
,
2021
,
Refunding
,
4
%
,
7/01/35
......
$
200,000
$
206,745
Culinary
Institute
of
America
(The)
,
Revenue
,
2021
,
Refunding
,
4
%
,
7/01/36
......
200,000
205,272
Culinary
Institute
of
America
(The)
,
Revenue
,
2021
,
Refunding
,
4
%
,
7/01/37
......
250,000
255,002
Culinary
Institute
of
America
(The)
,
Revenue
,
2021
,
Refunding
,
4
%
,
7/01/38
......
250,000
253,370
Culinary
Institute
of
America
(The)
,
Revenue
,
2021
,
Refunding
,
4
%
,
7/01/39
......
100,000
100,997
Culinary
Institute
of
America
(The)
,
Revenue
,
2021
,
Refunding
,
4
%
,
7/01/40
......
100,000
100,286
Nuvance
Health
Obligated
Group
,
Revenue
,
2016
B
,
5
%
,
7/01/31
.............
10,550,000
10,609,432
Nuvance
Health
Obligated
Group
,
Revenue
,
2019
B
,
Refunding
,
4
%
,
7/01/44
.....
1,900,000
1,800,504
Nuvance
Health
Obligated
Group
,
Revenue
,
2019
B
,
Refunding
,
4
%
,
7/01/49
.....
4,425,000
3,983,541
Vassar
College
,
Revenue
,
2017
,
Refunding
,
5
%
,
7/01/42
....................
5,000,000
5,083,276
Vassar
College
,
Revenue
,
2017
,
Refunding
,
4
%
,
7/01/46
....................
5,715,000
5,546,358
Empire
State
Development
Corp.
,
State
of
New
York
Personal
Income
Tax
,
Revenue
,
2017
C
,
Refunding
,
5
%
,
3/15/40
8,400,000
8,652,024
State
of
New
York
Personal
Income
Tax
,
Revenue
,
2019
A
,
5
%
,
3/15/42
.........
10,000,000
10,507,709
State
of
New
York
Personal
Income
Tax
,
Revenue
,
2020
A
,
5
%
,
3/15/41
.........
5,000,000
5,436,547
State
of
New
York
Sales
Tax
,
Revenue
,
2024
A
,
5
%
,
3/15/54
.................
5,000,000
5,205,874
Genesee
County
Funding
Corp.
(The)
,
Monroe
Sustainable
Energy
Partners
LLC
,
Revenue
,
2025
A
,
5.5
%
,
12/01/55
.....
2,500,000
2,613,323
Rochester
Regional
Health
Obligated
Group
,
Revenue
,
2022
A
,
Refunding
,
5.25
%
,
12/01/52
.......................................................
6,250,000
6,323,994
Hempstead
Town
Local
Development
Corp.
,
Hofstra
University
,
Revenue
,
2017
,
Refunding
,
5
%
,
7/01/42
..................
1,250,000
1,273,812
Hofstra
University
,
Revenue
,
2017
,
Refunding
,
5
%
,
7/01/47
..................
5,250,000
5,301,903
Hofstra
University
,
Revenue
,
2021
A
,
Refunding
,
4
%
,
7/01/39
.................
575,000
585,646
Hofstra
University
,
Revenue
,
2021
A
,
Refunding
,
4
%
,
7/01/40
.................
715,000
722,757
Hofstra
University
,
Revenue
,
2021
A
,
Refunding
,
4
%
,
7/01/41
.................
625,000
628,730
Hofstra
University
,
Revenue
,
2021
A
,
Refunding
,
3
%
,
7/01/51
.................
3,000,000
2,206,549
Hudson
Yards
Infrastructure
Corp.
,
Revenue
,
2017
A
,
Refunding
,
5
%
,
2/15/42
...............................
15,000,000
15,262,450
Revenue
,
2017
A
,
Refunding
,
AG
Insured
,
4
%
,
2/15/47
.....................
13,680,000
13,037,824
Long
Island
Power
Authority
,
Revenue
,
2018
,
5
%
,
9/01/39
.........................................
5,000,000
5,267,103
Revenue
,
2021
A
,
Refunding
,
4
%
,
9/01/42
...............................
1,500,000
1,528,072
Revenue
,
2022
A
,
Refunding
,
5
%
,
9/01/43
...............................
3,170,000
3,420,962
Revenue
,
2023
E
,
5
%
,
9/01/53
........................................
3,500,000
3,667,394
Revenue
,
2024
A
,
Refunding
,
5
%
,
9/01/49
...............................
3,500,000
3,724,756
Revenue
,
2024
A
,
Refunding
,
5
%
,
9/01/54
...............................
8,000,000
8,411,552
Revenue
,
2024
A
,
Refunding
,
5.25
%
,
9/01/54
.............................
2,500,000
2,662,692
d
Revenue
,
2025
,
Refunding
,
5.25
%
,
9/01/50
..............................
7,000,000
7,631,844
Metropolitan
Transportation
Authority
,
Revenue
,
2016
B
,
Refunding
,
5
%
,
11/15/33
..............................
6,000,000
6,090,397
Revenue
,
2016
B
,
Refunding
,
5
%
,
11/15/35
..............................
4,000,000
4,054,827
Revenue
,
2016
B
,
Refunding
,
5
%
,
11/15/37
..............................
13,500,000
13,657,973
Revenue
,
2016
D
,
Refunding
,
5
%
,
11/15/30
..............................
10,305,000
10,480,084
Revenue
,
2017
C-1
,
Refunding
,
5
%
,
11/15/30
............................
6,215,000
6,555,358
Revenue
,
2017
D
,
Refunding
,
4
%
,
11/15/42
..............................
20,000,000
19,878,208
Revenue
,
2017
D
,
Refunding
,
4
%
,
11/15/46
..............................
5,000,000
4,573,598
Revenue
,
2019
C
,
AG
Insured
,
4
%
,
11/15/45
.............................
8,000,000
7,675,581
Revenue
,
2020
A-1
,
5
%
,
11/15/48
.....................................
17,000,000
17,401,967
Revenue
,
2020
C-1
,
4.75
%
,
11/15/45
...................................
2,950,000
2,985,988
Revenue
,
2020
C-1
,
5
%
,
11/15/50
.....................................
9,150,000
9,334,869
Revenue
,
2020
D
,
5
%
,
11/15/44
.......................................
15,000,000
15,682,551
Revenue
,
2020
D
,
4
%
,
11/15/50
.......................................
10,000,000
8,988,672
Revenue
,
2021
A-2
,
4
%
,
11/15/42
.....................................
5,000,000
4,957,562
Revenue
,
2024
A
,
Refunding
,
4
%
,
11/15/43
..............................
6,220,000
6,088,459
Revenue
,
2024
A
,
Refunding
,
5.5
%
,
11/15/47
.............................
6,000,000
6,494,646
Franklin
New
York
Tax-Free
Income
Fund
Schedule
of
Investments
Annual
Report
The
accompanying
notes
are
an
integral
part
of
these
financial
statements.
a
a
Principal
Amount
a
Value
a
a
a
a
a
Municipal
Bonds
(continued)
New
York
(continued)
Metropolitan
Transportation
Authority,
(continued)
d
Revenue
,
2025
A
,
Refunding
,
5.25
%
,
11/15/55
............................
$
1,250,000
$
1,310,487
Revenue
,
2025
B
,
Refunding
,
5
%
,
11/15/43
..............................
1,335,000
1,461,679
c
Dedicated
Tax
Fund
,
Revenue
,
2012
A
,
Refunding
,
2.67
%,
11/15/32
............
20,000,000
16,753,398
Dedicated
Tax
Fund
,
Revenue
,
2024
B-1
,
Refunding
,
5
%
,
11/15/49
............
29,545,000
31,099,720
Dedicated
Tax
Fund
,
Revenue
,
2024
B-1
,
Refunding
,
5
%
,
11/15/50
............
10,830,000
11,362,301
Dedicated
Tax
Fund
,
Revenue
,
2024
B-1
,
Refunding
,
5
%
,
11/15/52
............
5,000,000
5,218,547
Dedicated
Tax
Fund
,
Revenue
,
2024
B-2
,
Refunding
,
5
%
,
11/15/48
............
3,000,000
3,167,382
Dedicated
Tax
Fund
,
Special
Tax
,
2024
A
,
5
%
,
11/15/49
.....................
2,500,000
2,631,555
Dedicated
Tax
Fund
,
Special
Tax
,
2024
A
,
5.25
%
,
11/15/54
...................
7,500,000
7,970,329
Monroe
County
Industrial
Development
Corp.
,
Rochester
Regional
Health
Obligated
Group
,
Revenue
,
2017
,
5
%
,
12/01/46
......
17,000,000
17,005,885
Rochester
Regional
Health
Obligated
Group
,
Revenue
,
2020
A
,
Refunding
,
5
%
,
12/01/31
.......................................................
1,500,000
1,631,766
Rochester
Regional
Health
Obligated
Group
,
Revenue
,
2020
A
,
Refunding
,
5
%
,
12/01/32
.......................................................
4,200,000
4,548,865
Rochester
Regional
Health
Obligated
Group
,
Revenue
,
2020
A
,
Refunding
,
5
%
,
12/01/33
.......................................................
1,815,000
1,957,182
Rochester
Regional
Health
Obligated
Group
,
Revenue
,
2020
A
,
Refunding
,
5
%
,
12/01/34
.......................................................
2,510,000
2,693,403
Rochester
Regional
Health
Obligated
Group
,
Revenue
,
2020
A
,
Refunding
,
4
%
,
12/01/35
.......................................................
1,100,000
1,119,829
Rochester
Regional
Health
Obligated
Group
,
Revenue
,
2020
A
,
Refunding
,
4
%
,
12/01/46
.......................................................
8,560,000
7,592,056
St.
John
Fisher
University
,
Revenue
,
2024
,
Refunding
,
5.25
%
,
6/01/49
..........
635,000
674,276
St.
John
Fisher
University
,
Revenue
,
2024
,
Refunding
,
5.25
%
,
6/01/54
..........
1,670,000
1,750,020
b
True
North
Rochester
Prep
Charter
School
,
Revenue
,
144A,
2020
A
,
5
%
,
6/01/50
.
2,360,000
2,318,918
b
True
North
Rochester
Prep
Charter
School
,
Revenue
,
144A,
2020
A
,
5
%
,
6/01/59
.
2,345,000
2,267,205
University
of
Rochester
,
Revenue
,
2017
C
,
Refunding
,
4
%
,
7/01/43
............
12,570,000
12,577,868
University
of
Rochester
,
Revenue
,
2017
D
,
Refunding
,
4
%
,
7/01/43
............
21,550,000
21,563,488
University
of
Rochester
,
Revenue
,
2023
A
,
5
%
,
7/01/53
.....................
10,000,000
10,408,298
Nassau
County
Local
Economic
Assistance
Corp.
,
Roosevelt
Children's
Academy
Charter
School
,
Revenue
,
2023
A
,
5
%
,
7/01/43
....
1,440,000
1,417,248
Roosevelt
Children's
Academy
Charter
School
,
Revenue
,
2023
A
,
5
%
,
7/01/55
....
2,605,000
2,394,087
New
York
City
Health
and
Hospitals
Corp.
,
Revenue
,
2020
A
,
Refunding
,
3
%
,
2/15/45
...............................
1,250,000
1,030,360
Revenue
,
2020
A
,
Refunding
,
4
%
,
2/15/45
...............................
1,800,000
1,782,612
Revenue
,
2020
A
,
Refunding
,
4
%
,
2/15/48
...............................
880,000
836,157
New
York
City
Housing
Development
Corp.
,
Revenue
,
2016
C-1-A
,
3.45
%
,
5/01/50
..................................
750,000
610,523
Revenue
,
2016
F-1A
,
Refunding
,
3.3
%
,
11/01/46
..........................
485,000
412,441
Revenue
,
2018
K
,
4
%
,
11/01/48
.......................................
36,505,000
33,613,808
Revenue
,
2019
G-1-B
,
Refunding
,
3
%
,
11/01/44
...........................
9,405,000
8,110,945
Revenue
,
2019
J
,
3
%
,
11/01/44
.......................................
4,935,000
4,255,983
Revenue
,
2020
C
,
FNMA
Insured
,
2.75
%
,
2/01/51
.........................
10,000,000
6,989,679
8
Spruce
NY
Owner
LLC
,
Revenue
,
2024
,
F
,
Refunding
,
5.25
%
,
12/15/31
........
4,550,000
4,736,611
New
York
City
Industrial
Development
Agency
,
Queens
Ballpark
Co.
LLC
,
Revenue
,
2021
A
,
Refunding
,
AG
Insured
,
3
%
,
1/01/46
.
5,000,000
3,986,152
Yankee
Stadium
LLC
,
Revenue
,
2020
A
,
Refunding
,
AG
Insured
,
4
%
,
3/01/45
....
6,000,000
5,899,217
Yankee
Stadium
LLC
,
Revenue
,
2020
A
,
Refunding
,
AG
Insured
,
3
%
,
3/01/49
....
10,000,000
7,518,865
New
York
City
Municipal
Water
Finance
Authority
,
Water
&
Sewer
System
,
Revenue
,
2017
AA
,
4
%
,
6/15/46
....................
10,000,000
9,652,405
Water
&
Sewer
System
,
Revenue
,
2020
AA
,
Refunding
,
5
%
,
6/15/40
...........
10,000,000
10,793,131
Water
&
Sewer
System
,
Revenue
,
2022
AA-1
,
5
%
,
6/15/48
..................
8,825,000
9,211,658
Water
&
Sewer
System
,
Revenue
,
2023
AA-1
,
5.25
%
,
6/15/52
................
5,000,000
5,281,766
Water
&
Sewer
System
,
Revenue
,
2024
AA-1
,
5.25
%
,
6/15/53
................
9,000,000
9,521,853
Water
&
Sewer
System
,
Revenue
,
2024
BB-1
,
5.25
%
,
6/15/54
................
10,745,000
11,356,190
Franklin
New
York
Tax-Free
Income
Fund
Schedule
of
Investments
The
accompanying
notes
are
an
integral
part
of
these
financial
statements.
Annual
Report
a
a
Principal
Amount
a
Value
a
a
a
a
a
Municipal
Bonds
(continued)
New
York
(continued)
New
York
City
Municipal
Water
Finance
Authority,
(continued)
Water
&
Sewer
System
,
Revenue
,
2024
CC-1
,
4.25
%
,
6/15/54
................
$
2,500,000
$
2,409,768
Water
&
Sewer
System
,
Revenue
,
2025
AA-1
,
5
%
,
6/15/51
..................
7,155,000
7,509,253
Water
&
Sewer
System
,
Revenue
,
2025
AA-1
,
5.25
%
,
6/15/53
................
1,000,000
1,064,124
d
Water
&
Sewer
System
,
Revenue
,
2025
BB
,
5.25
%
,
6/15/55
..................
25,000,000
26,646,675
d
Water
&
Sewer
System
,
Revenue
,
2026
AA-1
,
5
%
,
6/15/55
..................
11,500,000
12,044,799
Water
&
Sewer
System
,
Revenue,
Sub.
Lien
,
2018
BB-1
,
5
%
,
6/15/46
..........
15,500,000
15,737,017
New
York
City
Transitional
Finance
Authority
,
Future
Tax
Secured
,
Revenue
,
2018
C-3
,
4
%
,
5/01/42
......................
7,410,000
7,415,016
Future
Tax
Secured
,
Revenue
,
2021
C-1
,
4
%
,
5/01/43
......................
5,000,000
4,977,441
Future
Tax
Secured
,
Revenue
,
2024
A-1
,
5
%
,
5/01/41
......................
6,775,000
7,482,401
Future
Tax
Secured
,
Revenue
,
2024
A-1
,
4
%
,
5/01/53
......................
3,000,000
2,685,911
Future
Tax
Secured
,
Revenue
,
2024
G-1
,
4.125
%
,
5/01/52
...................
6,500,000
6,098,746
Future
Tax
Secured
,
Revenue
,
2025
C-1
,
5
%
,
5/01/50
......................
4,000,000
4,191,140
Future
Tax
Secured
,
Revenue
,
2025
H-1
,
5
%
,
11/01/50
.....................
4,000,000
4,198,972
Future
Tax
Secured
,
Revenue
,
2025
H-1
,
5.5
%
,
11/01/51
....................
3,000,000
3,270,057
Future
Tax
Secured
,
Revenue
,
2026
F-1
,
5
%
,
2/01/50
......................
5,000,000
5,265,191
Future
Tax
Secured
,
Revenue,
Sub.
Lien
,
2017
E-1
,
5
%
,
2/01/33
..............
6,500,000
6,651,934
Future
Tax
Secured
,
Revenue,
Sub.
Lien
,
2017
F-1
,
5
%
,
5/01/42
..............
17,500,000
17,862,670
Future
Tax
Secured
,
Revenue,
Sub.
Lien
,
2019
A-1
,
5
%
,
8/01/40
..............
9,340,000
9,794,173
Future
Tax
Secured
,
Revenue,
Sub.
Lien
,
2020
B-1
,
4
%
,
11/01/41
.............
7,205,000
7,265,116
Future
Tax
Secured
,
Revenue,
Sub.
Lien
,
2023
D-1
,
5
%
,
11/01/46
.............
10,000,000
10,546,158
Future
Tax
Secured
,
Revenue,
Sub.
Lien
,
2025
D
,
5.25
%
,
5/01/48
.............
5,000,000
5,361,257
Future
Tax
Secured
,
Revenue,
Sub.
Lien
,
2025
D
,
5
%
,
5/01/50
...............
2,375,000
2,486,741
Future
Tax
Secured
,
Revenue,
Sub.
Lien
,
2026
B
,
5.25
%
,
5/01/55
.............
7,500,000
7,998,081
State
of
New
York
,
Revenue
,
2018
S-3
,
5
%
,
7/15/43
........................
10,000,000
10,359,737
State
of
New
York
,
Revenue
,
2019
S-1
,
5
%
,
7/15/43
........................
17,000,000
17,611,553
State
of
New
York
,
Revenue
,
2020
S-1
,
4
%
,
7/15/41
........................
8,465,000
8,538,272
State
of
New
York
,
Revenue
,
2020
S-1B
,
4
%
,
7/15/41
......................
2,465,000
2,479,307
State
of
New
York
Building
Aid
,
Revenue
,
2026
S-2
,
Refunding
,
5
%
,
7/15/43
.....
2,975,000
3,343,987
New
York
Convention
Center
Development
Corp.
,
New
York
City
Hotel
Unit
Fee
,
Revenue,
Senior
Lien
,
2016
A
,
5
%
,
11/15/46
.............................
5,000,000
5,021,263
e
New
York
Energy
Finance
Development
Corp.
,
Revenue
,
2025
,
Mandatory
Put
,
5
%
,
12/01/33
........................................................
5,600,000
6,013,079
New
York
Liberty
Development
Corp.
,
Revenue
,
2021
A
,
Refunding
,
3
%
,
11/15/51
..............................
18,000,000
13,315,075
Goldman
Sachs
Headquarters
LLC
,
Revenue
,
2005
,
Refunding
,
5.25
%
,
10/01/35
..
91,360,000
109,600,344
Goldman
Sachs
Headquarters
LLC
,
Revenue
,
2007
,
5.5
%
,
10/01/37
...........
27,000,000
33,290,544
Port
Authority
of
New
York
&
New
Jersey
,
Revenue
,
1WTC
2021
,
Refunding
,
3
%
,
2/15/42
........................................................
5,000,000
4,454,344
Port
Authority
of
New
York
&
New
Jersey
,
Revenue
,
1WTC
2021
,
Refunding
,
4
%
,
2/15/43
........................................................
5,000,000
5,004,229
New
York
Power
Authority
,
Revenue
,
2020
A
,
Refunding
,
4
%
,
11/15/60
..............................
11,455,000
10,584,594
SFP
Transmission
Project
,
Revenue
,
2023
A
,
AG
Insured
,
5
%
,
11/15/53
.........
3,000,000
3,160,176
New
York
State
Dormitory
Authority
,
Revenue
,
2008
A-1
,
5
%
,
6/01/38
......................................
3,970,000
3,977,253
Revenue
,
2009
A
,
AG
Insured
,
5.625
%
,
10/01/29
..........................
245,000
245,673
Revenue
,
2009
C
,
AG
Insured
,
5
%
,
10/01/31
.............................
45,000
45,093
Revenue
,
2009
C
,
AG
Insured
,
5.125
%
,
10/01/36
..........................
60,000
60,118
Barnard
College
,
Revenue
,
2025
A
,
Refunding
,
5
%
,
7/01/50
..................
1,750,000
1,825,787
Barnard
College
,
Revenue
,
2025
A
,
Refunding
,
5
%
,
7/01/55
..................
3,000,000
3,098,656
Catholic
Health
System
Obligated
Group
,
Revenue
,
2019
A
,
Refunding
,
4
%
,
7/01/37
1,705,000
1,515,394
Catholic
Health
System
Obligated
Group
,
Revenue
,
2019
A
,
Refunding
,
4
%
,
7/01/38
2,200,000
1,930,874
Catholic
Health
System
Obligated
Group
,
Revenue
,
2019
A
,
Refunding
,
4
%
,
7/01/39
1,305,000
1,131,537
Catholic
Health
System
Obligated
Group
,
Revenue
,
2019
A
,
Refunding
,
4
%
,
7/01/40
1,300,000
1,117,238
Catholic
Health
System
Obligated
Group
,
Revenue
,
2019
A
,
Refunding
,
5
%
,
7/01/41
2,100,000
2,014,877
Franklin
New
York
Tax-Free
Income
Fund
Schedule
of
Investments
Annual
Report
The
accompanying
notes
are
an
integral
part
of
these
financial
statements.
a
a
Principal
Amount
a
Value
a
a
a
a
a
Municipal
Bonds
(continued)
New
York
(continued)
New
York
State
Dormitory
Authority,
(continued)
Catholic
Health
System
Obligated
Group
,
Revenue
,
2019
A
,
Refunding
,
4
%
,
7/01/45
$
5,835,000
$
4,809,196
Cornell
University
,
Revenue
,
2024
A
,
Refunding
,
5.5
%
,
7/01/54
...............
12,350,000
13,486,627
Educational
Housing
Services,
Inc.
,
Revenue
,
2005
,
AMBAC
Insured
,
5.25
%
,
7/01/30
5,150,000
5,423,891
Fashion
Institute
of
Technology
,
Revenue
,
2007
,
NATL
Insured
,
5.25
%
,
7/01/26
...
6,105,000
6,134,783
Fashion
Institute
of
Technology
,
Revenue
,
2007
,
NATL
Insured
,
5.25
%
,
7/01/34
...
13,290,000
14,558,012
Fordham
University
,
Revenue
,
2020
,
4
%
,
7/01/50
..........................
4,500,000
4,034,634
b
Garnet
Health
Medical
Center
Obligated
Group
,
Revenue
,
144A,
2015
,
Refunding
,
5
%
,
12/01/45
...................................................
1,000,000
920,135
b
Garnet
Health
Medical
Center
Obligated
Group
,
Revenue
,
144A,
2017
,
Refunding
,
5
%
,
12/01/32
...................................................
500,000
501,138
b
Garnet
Health
Medical
Center
Obligated
Group
,
Revenue
,
144A,
2017
,
Refunding
,
5
%
,
12/01/33
...................................................
4,000,000
4,005,596
b
Garnet
Health
Medical
Center
Obligated
Group
,
Revenue
,
144A,
2017
,
Refunding
,
5
%
,
12/01/35
...................................................
1,100,000
1,093,827
b
Garnet
Health
Medical
Center
Obligated
Group
,
Revenue
,
144A,
2017
,
Refunding
,
5
%
,
12/01/36
...................................................
2,100,000
2,066,315
b
Garnet
Health
Medical
Center
Obligated
Group
,
Revenue
,
144A,
2017
,
Refunding
,
5
%
,
12/01/37
...................................................
2,000,000
1,946,271
Iona
College
,
Revenue
,
2021
A
,
5
%
,
7/01/46
.............................
925,000
939,124
Iona
College
,
Revenue
,
2021
A
,
5
%
,
7/01/51
.............................
2,350,000
2,361,821
Iona
College
,
Revenue
,
2022
,
Refunding
,
5
%
,
7/01/31
......................
325,000
357,461
Iona
College
,
Revenue
,
2022
,
Refunding
,
5
%
,
7/01/32
......................
300,000
333,627
Iona
College
,
Revenue
,
2022
,
Refunding
,
5
%
,
7/01/42
......................
275,000
287,256
Memorial
Sloan-Kettering
Cancer
Center
,
Revenue
,
2017-1
,
Refunding
,
4
%
,
7/01/47
5,000,000
4,762,669
Montefiore
Obligated
Group
,
Revenue
,
2018
A
,
Refunding
,
5
%
,
8/01/31
.........
525,000
547,841
Montefiore
Obligated
Group
,
Revenue
,
2018
A
,
Refunding
,
5
%
,
8/01/33
.........
1,150,000
1,193,528
Montefiore
Obligated
Group
,
Revenue
,
2020
A
,
Refunding
,
5
%
,
9/01/30
.........
1,800,000
1,933,258
Montefiore
Obligated
Group
,
Revenue
,
2020
A
,
Refunding
,
4
%
,
9/01/45
.........
10,900,000
9,693,298
Montefiore
Obligated
Group
,
Revenue
,
2020
A
,
Refunding
,
4
%
,
9/01/50
.........
1,370,000
1,183,696
Montefiore
Obligated
Group
,
Revenue
,
2024
,
5.5
%
,
11/01/47
.................
1,000,000
1,051,545
Mount
Sinai
Hospital
Obligated
Group
,
Revenue
,
2025
,
5
%
,
7/01/45
............
1,420,000
1,457,506
Mount
Sinai
Hospital
Obligated
Group
,
Revenue
,
2025
,
5.25
%
,
7/01/50
.........
11,000,000
11,099,625
New
School
(The)
,
Revenue
,
2022
A
,
Refunding
,
4
%
,
7/01/47
................
4,000,000
3,647,572
New
York
Institute
of
Technology
,
Revenue
,
2024
,
5.25
%
,
7/01/49
.............
2,590,000
2,672,876
New
York
Institute
of
Technology
,
Revenue
,
2024
,
5.25
%
,
7/01/54
.............
4,100,000
4,192,720
New
York
University
,
Revenue
,
2018
A
,
5
%
,
7/01/48
........................
5,000,000
5,121,028
New
York
University
,
Revenue
,
2019
A
,
4
%
,
7/01/45
........................
3,415,000
3,387,588
New
York
University
,
Revenue
,
2019
A
,
5
%
,
7/01/49
........................
25,000,000
25,774,938
New
York
University
,
Revenue
,
2025
A
,
Refunding
,
5.25
%
,
7/01/55
.............
4,000,000
4,248,766
Northwell
Health
Obligated
Group
,
Revenue
,
2022
A
,
Refunding
,
5
%
,
5/01/52
....
13,490,000
13,747,068
Northwell
Health
Obligated
Group
,
Revenue
,
2024
A
,
Refunding
,
4
%
,
5/01/54
....
6,500,000
5,833,231
Northwell
Health
Obligated
Group
,
Revenue
,
2024
A
,
Refunding
,
5.25
%
,
5/01/54
..
11,000,000
11,454,423
NYU
Langone
Hospitals
Obligated
Group
,
Revenue
,
2020
A
,
3
%
,
7/01/48
.......
4,000,000
3,082,453
NYU
Langone
Hospitals
Obligated
Group
,
Revenue
,
2020
A
,
4
%
,
7/01/50
.......
20,420,000
18,606,555
NYU
Langone
Hospitals
Obligated
Group
,
Revenue
,
2020
A
,
4
%
,
7/01/53
.......
25,280,000
22,454,730
Orchard
Park
CCRC,
Inc.
Obligated
Group
,
Revenue
,
2025
A
,
5.125
%
,
11/15/55
..
1,600,000
1,625,310
Pace
University
,
Revenue
,
2024
A
,
5.25
%
,
5/01/44
.........................
590,000
624,901
Pace
University
,
Revenue
,
2024
A
,
5.5
%
,
5/01/49
..........................
1,775,000
1,860,567
Pace
University
,
Revenue
,
2024
A
,
5.5
%
,
5/01/56
..........................
1,000,000
1,038,503
Rochester
Institute
of
Technology
,
Revenue
,
2022
A
,
5
%
,
7/01/41
..............
1,000,000
1,095,313
Rochester
Institute
of
Technology
,
Revenue
,
2022
A
,
5
%
,
7/01/42
..............
1,000,000
1,086,920
Rockefeller
University
(The)
,
Revenue
,
2020
A
,
Refunding
,
5
%
,
7/01/53
.........
6,500,000
6,724,490
Roswell
Park
Cancer
Institute
Corp.
Obligated
Group
,
Revenue
,
2025
A
,
AG
Insured
,
5.5
%
,
7/01/50
...................................................
1,000,000
1,089,960
St.
John's
University
,
Revenue
,
2021
A
,
Refunding
,
4
%
,
7/01/48
...............
6,250,000
5,586,884
St.
Joseph's
College
,
Revenue
,
2021
,
4
%
,
7/01/40
.........................
225,000
198,517
Franklin
New
York
Tax-Free
Income
Fund
Schedule
of
Investments
The
accompanying
notes
are
an
integral
part
of
these
financial
statements.
Annual
Report
a
a
Principal
Amount
a
Value
a
a
a
a
a
Municipal
Bonds
(continued)
New
York
(continued)
New
York
State
Dormitory
Authority,
(continued)
St.
Joseph's
College
,
Revenue
,
2021
,
5
%
,
7/01/51
.........................
$
725,000
$
624,381
State
of
New
York
Personal
Income
Tax
,
Revenue
,
2017
A
,
Pre-Refunded
,
5
%
,
2/15/39
........................................................
15,000
15,396
State
of
New
York
Personal
Income
Tax
,
Revenue
,
2017
B
,
Pre-Refunded
,
5
%
,
2/15/40
........................................................
10,000
10,401
State
of
New
York
Personal
Income
Tax
,
Revenue
,
2017
B
,
Pre-Refunded
,
5
%
,
2/15/41
........................................................
30,000
31,203
State
of
New
York
Personal
Income
Tax
,
Revenue
,
2017
B
,
5
%
,
2/15/43
.........
12,050,000
12,308,864
State
of
New
York
Personal
Income
Tax
,
Revenue
,
2017
B
,
Pre-Refunded
,
5
%
,
2/15/43
........................................................
30,000
31,203
State
of
New
York
Personal
Income
Tax
,
Revenue
,
2017
B
,
4
%
,
2/15/46
.........
19,985,000
19,166,157
State
of
New
York
Personal
Income
Tax
,
Revenue
,
2017
B
,
Pre-Refunded
,
4
%
,
2/15/46
........................................................
15,000
15,388
State
of
New
York
Personal
Income
Tax
,
Revenue
,
2017
B-3
,
5
%
,
2/15/41
.......
9,895,000
10,159,960
State
of
New
York
Personal
Income
Tax
,
Revenue
,
2024
A
,
5.25
%
,
3/15/52
......
18,850,000
19,989,827
State
of
New
York
Personal
Income
Tax
,
Revenue
,
2025
A
,
Refunding
,
5
%
,
3/15/52
10,000,000
10,443,677
State
of
New
York
Personal
Income
Tax
,
Revenue
,
2025
A
,
Refunding
,
5
%
,
3/15/55
5,250,000
5,467,499
State
of
New
York
Sales
Tax
,
Revenue
,
2018
A
,
4
%
,
3/15/46
.................
25,000,000
24,142,490
State
of
New
York
Sales
Tax
,
Revenue
,
2018
C
,
Refunding
,
4
%
,
3/15/44
........
5,310,000
5,272,152
State
of
New
York
Sales
Tax
,
Revenue
,
2018
E
,
Refunding
,
5
%
,
3/15/45
........
6,235,000
6,483,750
State
of
New
York
Sales
Tax
,
Revenue
,
2024
B
,
Refunding
,
5
%
,
3/15/51
........
6,000,000
6,302,371
State
of
New
York
Sales
Tax
,
Revenue
,
2025
A
,
Refunding
,
5
%
,
3/15/55
.........
7,500,000
7,854,288
State
University
of
New
York
Dormitory
Facilities
,
Revenue
,
2017
A
,
Pre-Refunded
,
5
%
,
7/01/42
....................................................
780,000
809,190
State
University
of
New
York
Dormitory
Facilities
,
Revenue
,
2017
A
,
Pre-Refunded
,
5
%
,
7/01/46
....................................................
4,000,000
4,152,373
State
University
of
New
York
Dormitory
Facilities
,
Revenue
,
2018
A
,
5
%
,
7/01/43
..
4,300,000
4,480,356
State
University
of
New
York
Dormitory
Facilities
,
Revenue
,
2018
A
,
5
%
,
7/01/48
..
7,950,000
8,149,568
State
University
of
New
York
Dormitory
Facilities
,
Revenue
,
2018
A
,
Pre-Refunded
,
5
%
,
7/01/48
....................................................
5,975,000
6,363,278
State
University
of
New
York
Dormitory
Facilities
,
Revenue
,
2019
A
,
3
%
,
7/01/42
..
4,165,000
3,699,615
State
University
of
New
York
Dormitory
Facilities
,
Revenue
,
2019
A
,
4
%
,
7/01/43
..
1,200,000
1,202,255
Teachers
College
,
Revenue
,
2022
,
Refunding
,
4
%
,
7/01/46
..................
6,175,000
5,927,529
White
Plains
Hospital
Obligated
Group
,
Revenue
,
2024
,
5.25
%
,
10/01/49
........
10,345,000
10,538,502
New
York
State
Environmental
Facilities
Corp.
,
New
York
City
Water
&
Sewer
System
,
Revenue
,
2017
E
,
5
%
,
6/15/47
..........
6,090,000
6,170,576
New
York
City
Water
&
Sewer
System
,
Revenue
,
2018
B
,
5
%
,
6/15/43
..........
8,000,000
8,284,009
New
York
City
Water
&
Sewer
System
,
Revenue
,
2018
B
,
5
%
,
6/15/48
..........
18,610,000
19,118,537
New
York
City
Water
&
Sewer
System
,
Revenue,
Sub.
Lien
,
2017
A
,
Refunding
,
5
%
,
6/15/46
........................................................
11,150,000
11,312,081
State
of
New
York
State
Revolving
Fund
,
Revenue
,
2022
B
,
5.25
%
,
9/15/52
......
5,000,000
5,339,635
New
York
State
Housing
Finance
Agency
,
Revenue
,
2020
E
,
2.45
%
,
11/01/50
......
3,000,000
2,000,036
New
York
State
Thruway
Authority
,
Revenue
,
2019
B
,
4
%
,
1/01/41
........................................
12,000,000
12,142,223
Revenue
,
2019
B
,
3
%
,
1/01/46
........................................
4,200,000
3,308,264
Revenue
,
2019
B
,
BAM
Insured
,
4
%
,
1/01/50
.............................
20,000,000
18,559,468
Revenue
,
2019
B
,
4
%
,
1/01/53
........................................
15,000,000
13,481,800
Revenue
,
2026
A
,
Refunding
,
5
%
,
1/01/51
...............................
1,000,000
1,053,544
Revenue
,
N
,
4
%
,
1/01/46
............................................
10,000,000
9,635,744
Revenue
,
P
,
Refunding
,
5.25
%
,
1/01/54
.................................
1,000,000
1,067,139
State
of
New
York
Personal
Income
Tax
,
Revenue
,
2022
A
,
Refunding
,
5
%
,
3/15/46
4,125,000
4,363,400
State
of
New
York
Personal
Income
Tax
,
Revenue
,
2022
A
,
Refunding
,
5
%
,
3/15/48
25,000,000
26,192,918
New
York
Transportation
Development
Corp.
,
Delta
Air
Lines,
Inc.
,
Revenue
,
2018
,
5
%
,
1/01/32
..........................
5,500,000
5,692,337
Delta
Air
Lines,
Inc.
,
Revenue
,
2020
,
4
%
,
10/01/30
.........................
12,400,000
12,730,899
Delta
Air
Lines,
Inc.
,
Revenue
,
2020
,
5
%
,
10/01/35
.........................
6,305,000
6,692,331
Franklin
New
York
Tax-Free
Income
Fund
Schedule
of
Investments
Annual
Report
The
accompanying
notes
are
an
integral
part
of
these
financial
statements.
a
a
Principal
Amount
a
Value
a
a
a
a
a
Municipal
Bonds
(continued)
New
York
(continued)
New
York
Transportation
Development
Corp.,
(continued)
Delta
Air
Lines,
Inc.
,
Revenue
,
2020
,
5
%
,
10/01/40
.........................
$
11,000,000
$
11,389,521
Delta
Air
Lines,
Inc.
,
Revenue
,
2020
,
4.375
%
,
10/01/45
.....................
26,500,000
25,572,328
Delta
Air
Lines,
Inc.
,
Revenue
,
2023
,
5.625
%
,
4/01/40
......................
9,150,000
9,797,598
Empire
State
Thruway
Partners
LLC
,
Revenue
,
2021
,
4
%
,
10/31/41
............
2,130,000
2,104,584
Empire
State
Thruway
Partners
LLC
,
Revenue
,
2021
,
4
%
,
10/31/46
............
6,000,000
5,454,427
Empire
State
Thruway
Partners
LLC
,
Revenue
,
2021
,
4
%
,
4/30/53
.............
19,875,000
17,119,156
JFK
International
Air
Terminal
LLC
,
Revenue
,
2020
A
,
Refunding
,
5
%
,
12/01/34
...
450,000
485,137
JFK
International
Air
Terminal
LLC
,
Revenue
,
2020
A
,
Refunding
,
5
%
,
12/01/35
...
400,000
429,222
JFK
International
Air
Terminal
LLC
,
Revenue
,
2020
A
,
Refunding
,
5
%
,
12/01/36
...
400,000
426,992
JFK
International
Air
Terminal
LLC
,
Revenue
,
2020
A
,
Refunding
,
5
%
,
12/01/37
...
350,000
371,826
JFK
International
Air
Terminal
LLC
,
Revenue
,
2020
A
,
Refunding
,
4
%
,
12/01/38
...
300,000
301,182
JFK
International
Air
Terminal
LLC
,
Revenue
,
2020
A
,
Refunding
,
4
%
,
12/01/39
...
400,000
400,008
JFK
International
Air
Terminal
LLC
,
Revenue
,
2020
A
,
Refunding
,
4
%
,
12/01/40
...
2,555,000
2,544,588
JFK
International
Air
Terminal
LLC
,
Revenue
,
2020
A
,
Refunding
,
4
%
,
12/01/42
...
910,000
882,877
JFK
International
Air
Terminal
LLC
,
Revenue
,
2020
C
,
Refunding
,
5
%
,
12/01/33
...
1,200,000
1,321,774
JFK
International
Air
Terminal
LLC
,
Revenue
,
2020
C
,
Refunding
,
5
%
,
12/01/34
...
2,000,000
2,194,950
JFK
International
Air
Terminal
LLC
,
Revenue
,
2020
C
,
Refunding
,
5
%
,
12/01/36
...
2,000,000
2,172,378
JFK
International
Air
Terminal
LLC
,
Revenue
,
2020
C
,
Refunding
,
4
%
,
12/01/39
...
4,545,000
4,576,390
JFK
International
Air
Terminal
LLC
,
Revenue
,
2020
C
,
Refunding
,
4
%
,
12/01/41
...
10,300,000
10,306,712
JFK
International
Air
Terminal
LLC
,
Revenue
,
2020
C
,
Refunding
,
4
%
,
12/01/42
...
9,690,000
9,607,586
JFK
International
Air
Terminal
LLC
,
Revenue
,
2022
,
5
%
,
12/01/42
.............
10,000,000
10,573,436
JFK
Millennium
Partners
LLC
,
Revenue
,
2024
A
,
Refunding
,
AG
Insured
,
5.25
%
,
12/31/54
.......................................................
12,500,000
12,841,310
JFK
Millennium
Partners
LLC
,
Revenue
,
2024
A
,
Refunding
,
5.5
%
,
12/31/60
.....
9,250,000
9,489,485
c
JFK
Millennium
Partners
LLC
,
Revenue
,
2024
B
,
Refunding
,
AG
Insured
,
1.642
%,
12/31/54
.......................................................
9,000,000
6,078,917
JFK
NTO
LLC
,
Revenue
,
2023
,
6
%
,
6/30/54
..............................
6,500,000
6,823,481
JFK
NTO
LLC
,
Revenue
,
2023
,
AG
Insured
,
5.125
%
,
6/30/60
.................
10,000,000
10,098,787
JFK
NTO
LLC
,
Revenue
,
2023
,
5.375
%
,
6/30/60
..........................
15,160,000
15,224,580
JFK
NTO
LLC
,
Revenue
,
2024
,
5
%
,
6/30/60
..............................
13,000,000
12,726,490
JFK
NTO
LLC
,
Revenue
,
2024
,
5.5
%
,
6/30/60
............................
5,750,000
5,877,964
JFK
NTO
LLC
,
Revenue
,
2025
,
6
%
,
6/30/50
..............................
3,250,000
3,513,571
Oneida
County
Local
Development
Corp.
,
Mohawk
Valley
Health
System
Obligated
Group
,
Revenue
,
2021
A
,
AG
Insured
,
4
%
,
12/01/51
........................
4,000,000
3,617,295
b
Oneida
Indian
Nation
of
New
York
,
Revenue
,
144A,
2024
A
,
8
%
,
9/01/40
...................................
3,000,000
3,102,890
Revenue
,
144A,
2024
B
,
6
%
,
9/01/43
...................................
2,150,000
2,350,598
Onondaga
Civic
Development
Corp.
,
Le
Moyne
College
,
Revenue
,
2021
,
4
%
,
7/01/38
...........................
200,000
200,773
Le
Moyne
College
,
Revenue
,
2021
,
4
%
,
7/01/41
...........................
245,000
236,434
Le
Moyne
College
,
Revenue
,
2021
,
5
%
,
7/01/46
...........................
460,000
463,999
Le
Moyne
College
,
Revenue
,
2021
,
5
%
,
7/01/51
...........................
820,000
814,096
Le
Moyne
College
,
Revenue
,
2022
,
Refunding
,
5
%
,
7/01/32
..................
725,000
787,367
Le
Moyne
College
,
Revenue
,
2022
,
Refunding
,
4
%
,
7/01/34
..................
315,000
323,750
Le
Moyne
College
,
Revenue
,
2022
,
Refunding
,
4
%
,
7/01/36
..................
350,000
355,302
Le
Moyne
College
,
Revenue
,
2022
,
Refunding
,
4
%
,
7/01/39
..................
475,000
474,944
Le
Moyne
College
,
Revenue
,
2022
,
Refunding
,
4
%
,
7/01/42
..................
530,000
503,083
Syracuse
University
,
Revenue
,
2025
,
5.5
%
,
12/01/56
.......................
4,000,000
4,401,086
Onondaga
County
Trust
for
Cultural
Resources
,
Syracuse
University
,
Revenue
,
2019
,
Refunding
,
5
%
,
12/01/43
................
5,000,000
5,287,779
Syracuse
University
,
Revenue
,
2019
,
Refunding
,
4
%
,
12/01/47
................
17,000,000
16,296,724
Port
Authority
of
New
York
&
New
Jersey
,
Revenue
,
200
,
Refunding
,
5
%
,
4/15/57
.................................
11,040,000
11,153,099
Revenue
,
205th
,
Refunding
,
5
%
,
5/15/57
................................
13,000,000
13,200,350
Revenue
,
211th
,
Refunding
,
5
%
,
9/01/48
................................
16,730,000
17,204,787
Revenue
,
214th
,
5
%
,
9/01/34
.........................................
2,500,000
2,673,429
Franklin
New
York
Tax-Free
Income
Fund
Schedule
of
Investments
The
accompanying
notes
are
an
integral
part
of
these
financial
statements.
Annual
Report
a
a
Principal
Amount
a
Value
a
a
a
a
a
Municipal
Bonds
(continued)
New
York
(continued)
Port
Authority
of
New
York
&
New
Jersey,
(continued)
Revenue
,
214th
,
4
%
,
9/01/38
.........................................
$
5,000,000
$
5,051,415
Revenue
,
221
,
4
%
,
7/15/45
..........................................
7,610,000
7,384,727
Revenue
,
221
,
4
%
,
7/15/50
..........................................
15,250,000
14,069,691
Revenue
,
234
,
Refunding
,
5.5
%
,
8/01/52
................................
4,000,000
4,230,899
Revenue
,
238
,
Refunding
,
5
%
,
7/15/37
.................................
4,000,000
4,464,221
Revenue
,
244
,
Refunding
,
5
%
,
7/15/54
.................................
2,500,000
2,628,975
Revenue
,
246
,
Refunding
,
5
%
,
9/01/39
.................................
5,000,000
5,558,460
Revenue
,
246
,
Refunding
,
5
%
,
9/01/40
.................................
2,000,000
2,209,876
Revenue
,
250
,
Refunding
,
5.25
%
,
10/15/51
..............................
5,000,000
5,419,867
d
Revenue
,
251st
,
Refunding
,
5
%
,
8/15/51
................................
1,500,000
1,594,229
Riverhead
Industrial
Development
Agency
,
Riverhead
Charter
School
Obligated
Group
,
Revenue
,
2025
,
Refunding
,
5
%
,
8/01/40
1,390,000
1,480,292
Riverhead
Charter
School
Obligated
Group
,
Revenue
,
2025
,
Refunding
,
5.25
%
,
8/01/44
........................................................
1,855,000
1,939,079
Riverhead
Charter
School
Obligated
Group
,
Revenue
,
2025
,
Refunding
,
5.375
%
,
8/01/48
........................................................
2,100,000
2,159,058
Saratoga
County
Capital
Resource
Corp.
,
Skidmore
College
,
Revenue
,
2020
A
,
4
%
,
7/01/50
......................................................
2,250,000
2,062,075
Schenectady
County
Capital
Resource
Corp.
,
Trustees
of
Union
College
,
Revenue
,
2017
,
Refunding
,
5
%
,
1/01/47
............
6,590,000
6,628,396
Trustees
of
Union
College
,
Revenue
,
2022
,
Refunding
,
5.25
%
,
7/01/52
.........
700,000
728,200
St.
Lawrence
County
Industrial
Development
Agency
,
Clarkson
University
,
Revenue
,
2021
B
,
Refunding
,
5
%
,
9/01/34
...............
465,000
487,984
Clarkson
University
,
Revenue
,
2021
B
,
Refunding
,
5
%
,
9/01/39
...............
400,000
409,140
Clarkson
University
,
Revenue
,
2021
B
,
Refunding
,
5
%
,
9/01/40
...............
475,000
481,418
Clarkson
University
,
Revenue
,
2021
B
,
Refunding
,
5
%
,
9/01/41
...............
525,000
527,160
St.
Lawrence
University
,
Revenue
,
2022
,
Refunding
,
5.25
%
,
7/01/47
...........
1,820,000
1,866,120
St.
Lawrence
University
,
Revenue
,
2022
,
Refunding
,
5.25
%
,
7/01/52
...........
2,500,000
2,538,778
Suffolk
Tobacco
Asset
Securitization
Corp.
,
Revenue
,
2021
A-2
,
Refunding
,
4
%
,
6/01/50
.............................
4,500,000
3,817,026
Revenue
,
2021
B-1
,
Refunding
,
4
%
,
6/01/50
.............................
3,950,000
3,623,993
Syracuse
Regional
Airport
Authority
,
Revenue
,
2021
,
Refunding
,
4
%
,
7/01/35
.................................
735,000
751,836
Revenue
,
2021
,
Refunding
,
4
%
,
7/01/36
.................................
750,000
759,185
Tompkins
County
Development
Corp.
,
Kendal
at
Ithaca,
Inc.
,
Revenue
,
2022
A
,
Refunding
,
4
%
,
7/01/42
.............................................
3,440,000
3,413,311
Triborough
Bridge
&
Tunnel
Authority
,
Revenue
,
2017
A
,
Refunding
,
5
%
,
11/15/47
..............................
7,370,000
7,474,025
Revenue
,
2017
B
,
Refunding
,
5
%
,
11/15/37
..............................
8,055,000
8,294,293
Revenue
,
2017
C-2
,
5
%
,
11/15/42
.....................................
18,190,000
18,802,545
Revenue
,
2020
A
,
5
%
,
11/15/49
.......................................
10,000,000
10,431,864
Revenue
,
2020
A
,
5
%
,
11/15/54
.......................................
10,000,000
10,357,231
Revenue
,
2023
B-1
,
5.25
%
,
11/15/53
...................................
4,500,000
4,776,306
c
Revenue,
Sub.
Lien
,
2013
A
,
Refunding
,
2.8
%,
11/15/31
.....................
5,000,000
4,269,739
Metropolitan
Transportation
Authority
Payroll
Mobility
Tax
,
Revenue,
Senior
Lien
,
2021
A-1
,
Refunding
,
5
%
,
5/15/51
....................................
20,000,000
20,761,772
c
Metropolitan
Transportation
Authority
Payroll
Mobility
Tax
,
Revenue,
Senior
Lien
,
2022
D-1B
,
Refunding
,
3.32
%,
11/15/36
...............................
6,250,000
4,402,719
c
Metropolitan
Transportation
Authority
Payroll
Mobility
Tax
,
Revenue,
Senior
Lien
,
2022
D-1B
,
Refunding
,
3.71
%,
11/15/39
...............................
1,115,000
676,990
Metropolitan
Transportation
Authority
Payroll
Mobility
Tax
,
Revenue,
Senior
Lien
,
2024
B-1
,
Refunding
,
4.125
%
,
5/15/54
................................
5,000,000
4,607,611
Metropolitan
Transportation
Authority
Payroll
Mobility
Tax
,
Revenue,
Senior
Lien
,
2024
B-1
,
Refunding
,
5.25
%
,
5/15/54
.................................
19,000,000
20,157,427
Real
Estate
Transfer
Tax
,
Revenue
,
2025
A
,
5.25
%
,
12/01/54
.................
8,500,000
9,073,405
Sales
Tax
,
Revenue
,
2023
A
,
4
%
,
5/15/48
...............................
9,175,000
8,681,238
Franklin
New
York
Tax-Free
Income
Fund
Schedule
of
Investments
Annual
Report
The
accompanying
notes
are
an
integral
part
of
these
financial
statements.
a
a
Principal
Amount
a
Value
a
a
a
a
a
Municipal
Bonds
(continued)
New
York
(continued)
Triborough
Bridge
&
Tunnel
Authority,
(continued)
Sales
Tax
,
Revenue
,
2024
A-1
,
5.25
%
,
5/15/59
...........................
$
6,545,000
$
6,896,273
Sales
Tax
,
Revenue
,
2024
A-1
,
5.25
%
,
5/15/64
...........................
10,000,000
10,508,653
Troy
Capital
Resource
Corp.
,
Revenue
,
2021
,
Refunding
,
4
%
,
9/01/35
.................................
180,000
185,730
Revenue
,
2021
,
Refunding
,
4
%
,
9/01/36
.................................
280,000
287,781
Rensselaer
Polytechnic
Institute
,
Revenue
,
2020
A
,
Refunding
,
5
%
,
9/01/36
......
3,200,000
3,452,751
Rensselaer
Polytechnic
Institute
,
Revenue
,
2020
A
,
Refunding
,
5
%
,
9/01/38
......
3,800,000
4,057,512
Rensselaer
Polytechnic
Institute
,
Revenue
,
2020
A
,
Refunding
,
5
%
,
9/01/39
......
5,000,000
5,313,721
Rensselaer
Polytechnic
Institute
,
Revenue
,
2020
A
,
Refunding
,
4
%
,
9/01/40
......
1,500,000
1,509,629
Utility
Debt
Securitization
Authority
,
Revenue
,
2017
,
5
%
,
12/15/39
........................................
5,750,000
5,981,933
Revenue
,
2017
,
5
%
,
12/15/40
........................................
10,000,000
10,372,977
Revenue
,
2017
,
5
%
,
12/15/41
........................................
8,500,000
8,790,262
Westchester
County
Local
Development
Corp.
,
Kendal
on
Hudson
Obligated
Group
,
Revenue
,
2022
B
,
Refunding
,
4.25
%
,
1/01/45
2,925,000
2,864,472
Kendal
on
Hudson
Obligated
Group
,
Revenue
,
2022
B
,
Refunding
,
5
%
,
1/01/51
...
2,500,000
2,520,647
New
York
Blood
Center,
Inc.
,
Revenue
,
2024
,
5
%
,
7/01/35
...................
2,250,000
2,519,841
New
York
Blood
Center,
Inc.
,
Revenue
,
2024
,
5
%
,
7/01/38
...................
2,475,000
2,715,106
Westchester
County
Health
Care
Corp.
Obligated
Group
,
Revenue
,
2023
,
AG
Insured
,
5.75
%
,
11/01/49
..........................................
1,000,000
1,088,388
Westchester
County
Health
Care
Corp.
Obligated
Group
,
Revenue
,
2023
,
AG
Insured
,
5
%
,
11/01/51
.............................................
1,200,000
1,227,504
Westchester
County
Health
Care
Corp.
Obligated
Group
,
Revenue
,
2023
,
6.25
%
,
11/01/52
.......................................................
1,000,000
1,030,582
Westchester
County
Health
Care
Corp.
Obligated
Group
,
Revenue
,
2023
,
AG
Insured
,
5.75
%
,
11/01/53
..........................................
1,000,000
1,079,421
Yonkers
Industrial
Development
Agency
,
Revenue
,
2022
,
5.25
%
,
5/01/51
.........
1,600,000
1,685,548
2,398,885,449
South
Carolina
0.2%
b
South
Carolina
State
Housing
Finance
&
Development
Authority
,
Garden
Oaks
LP
,
Revenue
,
144A,
2021
A
,
4.2
%
,
12/01/39
................................
5,900,000
5,442,143
Texas
0.4%
City
of
Dallas
,
DHFC
-
Briscoe
Apartments
LLC
(The)
,
Revenue,
Senior
Lien
,
2022
A
,
6
%
,
12/01/62
.....................................................
4,390,000
4,207,571
b
Pecan
Public
Facility
Corp.
,
Revenue
,
144A,
2022
A-2
,
5
%
,
12/01/52
............
10,000,000
7,705,230
11,912,801
Washington
0.2%
b
Washington
State
Housing
Finance
Commission
,
Madison
at
Rivers
Edge
Apartments
LLC
,
Revenue
,
144A,
2021
A
,
3.65
%
,
1/01/37
............................
6,700,000
5,973,842
Wisconsin
2.2%
Public
Finance
Authority
,
Revenue
,
2025
A-1
,
Refunding
,
5.375
%
,
12/01/36
.........................
9,025,000
9,649,090
b
Revenue
,
144A,
2022
,
B-1
,
4
%
,
12/28/44
................................
6,500,000
5,459,471
c
Revenue,
Sub.
Lien
,
2025
A-2
,
Refunding
,
4.075
%,
12/01/45
.................
72,055,000
36,236,683
b,c
Patriot
Services
Group
Obligated
Group
,
Revenue
,
144A,
2024
A-2
,
Refunding
,
2.34
%,
12/01/44
.................................................
10,875,000
7,308,691
b
Pine
Forest
2022
Obligated
Group
,
Revenue
,
144A,
2022
A
,
6.5
%
,
12/01/52
.....
1,500,000
1,514,564
60,168,499
U.S.
Territories
2.4%
Guam
0.4%
Antonio
B
Won
Pat
International
Airport
Authority
,
Revenue
,
2023
A
,
Refunding
,
5
%
,
10/01/28
..............................
480,000
498,960
Franklin
New
York
Tax-Free
Income
Fund
Schedule
of
Investments
The
accompanying
notes
are
an
integral
part
of
these
financial
statements.
Annual
Report
a
a
Principal
Amount
a
Value
a
a
a
a
a
Municipal
Bonds
(continued)
U.S.
Territories
(continued)
Guam
(continued)
Antonio
B
Won
Pat
International
Airport
Authority,
(continued)
Revenue
,
2023
A
,
Refunding
,
5.25
%
,
10/01/29
............................
$
700,000
$
747,524
Revenue
,
2023
A
,
Refunding
,
5.25
%
,
10/01/31
............................
775,000
851,690
Revenue
,
2023
A
,
Refunding
,
5.375
%
,
10/01/33
...........................
525,000
593,601
Revenue
,
2023
A
,
Refunding
,
5.25
%
,
10/01/36
............................
685,000
761,744
Revenue
,
2023
A
,
Refunding
,
5.375
%
,
10/01/40
...........................
525,000
573,814
Revenue
,
2023
A
,
Refunding
,
5.375
%
,
10/01/43
...........................
1,250,000
1,329,398
Revenue
,
2024
A
,
5
%
,
10/01/34
.......................................
670,000
747,430
Revenue
,
2024
A
,
5.25
%
,
10/01/41
....................................
1,400,000
1,512,623
Guam
Power
Authority
,
Revenue
,
2024
A
,
Refunding
,
5
%
,
10/01/34
..............................
710,000
803,323
Revenue
,
2024
A
,
Refunding
,
5
%
,
10/01/35
..............................
500,000
565,482
Revenue
,
2024
A
,
Refunding
,
5
%
,
10/01/36
..............................
450,000
506,722
Revenue
,
2024
A
,
Refunding
,
5
%
,
10/01/37
..............................
455,000
506,734
Revenue
,
2024
A
,
Refunding
,
5
%
,
10/01/38
..............................
575,000
637,652
Revenue
,
2024
A
,
Refunding
,
5
%
,
10/01/40
..............................
520,000
568,757
Revenue
,
2024
A
,
Refunding
,
5
%
,
10/01/42
..............................
250,000
269,033
11,474,487
Puerto
Rico
2.0%
Puerto
Rico
Electric
Power
Authority
,
Revenue
,
VV
,
Refunding
,
NATL
Insured
,
5.25
%
,
7/01/32
.........................................................
1,050,000
1,077,599
Puerto
Rico
Sales
Tax
Financing
Corp.
,
Sales
Tax
,
Revenue
,
A-1
,
4.75
%
,
7/01/53
................................
22,313,000
21,757,915
Sales
Tax
,
Revenue
,
A-1
,
5
%
,
7/01/58
..................................
19,095,000
18,742,287
c
Sales
Tax
,
Revenue
,
A-1
,
5.41
%,
7/01/51
................................
20,000,000
5,262,148
Sales
Tax
,
Revenue
,
A-2
,
4.784
%
,
7/01/58
...............................
7,150,000
6,927,723
53,767,672
Total
U.S.
Territories
....................................................................
65,242,159
Total
Municipal
Bonds
(Cost
$
2,642,344,520
)
...................................
2,625,579,189
Total
Long
Term
Investments
(Cost
$
2,649,044,520
)
.............................
2,632,670,013
a
a
a
a
a
Short
Term
Investments
1.0%
Municipal
Bonds
1.0%
New
York
1.0%
f
City
of
New
York
,
GO
,
2014
I-3
,
SPA
US
Bank
NA
,
Daily
VRDN
and
Put
,
1.95
%
,
3/01/44
..........
8,000,000
8,000,000
GO
,
2015
F-6
,
SPA
JPMorgan
Chase
Bank
NA
,
Daily
VRDN
and
Put
,
1.9
%
,
6/01/44
2,400,000
2,400,000
GO
,
2020
B-3
,
Daily
VRDN
and
Put
,
2
%
,
10/01/46
.........................
1,700,000
1,700,000
f
Metropolitan
Transportation
Authority
,
Dedicated
Tax
Fund
,
Revenue
,
2008
A-1
,
Refunding
,
LOC
TD
Bank
NA
,
Daily
VRDN
and
Put
,
1.9
%
,
11/01/31
............
3,450,000
3,450,000
f
Nassau
County
Industrial
Development
Agency
,
Cold
Spring
Harbor
Laboratory
,
Revenue
,
1999
,
Refunding
,
SPA
TD
Bank
NA
,
Daily
VRDN
and
Put
,
1.9
%
,
1/01/34
500,000
500,000
f
New
York
City
Municipal
Water
Finance
Authority
,
Water
&
Sewer
System
,
Revenue,
Sub.
Lien
,
2022
DD
,
Refunding
,
Daily
VRDN
and
Put
,
2
%
,
6/15/33
.............
6,700,000
6,700,000
Franklin
New
York
Tax-Free
Income
Fund
Schedule
of
Investments
Annual
Report
The
accompanying
notes
are
an
integral
part
of
these
financial
statements.
Short
Term
Investments
(continued)
a
a
Principal
Amount
a
Value
Municipal
Bonds
(continued)
New
York
(continued)
f
New
York
City
Transitional
Finance
Authority
,
Future
Tax
Secured
,
Revenue,
Sub.
Lien
,
2014
D-3
,
SPA
Mizuho
Bank
Ltd.
,
Daily
VRDN
and
Put
,
1.9
%
,
2/01/44
..........
$
4,200,000
$
4,200,000
26,950,000
Total
Municipal
Bonds
(Cost
$
26,950,000
)
......................................
26,950,000
Total
Short
Term
Investments
(Cost
$
26,950,000
)
................................
26,950,000
a
Total
Investments
(Cost
$
2,675,994,520
)
99.0
%
..................................
$2,659,620,013
Other
Assets,
less
Liabilities
1.0
%
.............................................
27,665,805
Net
Assets
100.0%
...........................................................
$2,687,285,818
See
Abbreviations
on
page
30
.
a
Fair
valued
using
significant
unobservable
inputs.
See
Note
8
regarding
fair
value
measurements.
b
Security
was
purchased
pursuant
to
Rule
144A
or
Regulation
S
under
the
Securities
Act
of
1933.
144A
securities
may
be
sold
in
transactions
exempt
from
registration
only
to
qualified
institutional
buyers
or
in
a
public
offering
registered
under
the
Securities
Act
of
1933.
Regulation
S
securities
cannot
be
sold
in
the
United
States
without
either
an
effective
registration
statement
filed
pursuant
to
the
Securities
Act
of
1933,
or
pursuant
to
an
exemption
from
registration.
At
February
28,
2026,
the
aggregate
value
of
these
securities
was
$77,907,588,
representing
2.9%
of
net
assets.
c
The
rate
shown
represents
the
yield
at
period
end.
d
Security
purchased
on
a
when-issued
basis.
See
Note
1(b).
e
The
maturity
date
shown
represents
the
mandatory
put
date.
f
Variable
rate
demand
notes
(VRDN)
are
obligations
which
contain
a
floating
or
variable
interest
rate
adjustment
formula
and
an
unconditional
right
of
demand
to
receive
pay-
ment
of
the
principal
balance
plus
accrued
interest
at
specified
dates.
Unless
otherwise
noted,
the
coupon
rate
is
determined
based
on
factors
including
supply
and
demand,
underlying
credit,
tax
treatment,
and
current
short
term
rates.
The
coupon
rate
shown
represents
the
rate
at
period
end.
Franklin
New
York
Tax-Free
Income
Fund
Financial
Statements
Statement
of
Assets
and
Liabilities
February
28,
2026
The
accompanying
notes
are
an
integral
part
of
these
financial
statements.
Annual
Report
Franklin
New
York
Tax-Free
Income
Fund
Assets:
Investments
in
securities:
Cost
-
Unaffiliated
issuers
...................................................................
$2,675,994,520
Value
-
Unaffiliated
issuers
..................................................................
$2,659,620,013
Cash
....................................................................................
387,942
Receivables:
Capital
shares
sold
........................................................................
1,065,968
Interest
.................................................................................
32,297,057
Total
assets
..........................................................................
2,693,370,980
Liabilities:
Payables:
Investment
securities
purchased
..............................................................
48,783
Capital
shares
redeemed
...................................................................
3,612,699
Management
fees
.........................................................................
1,022,479
Distribution
fees
..........................................................................
196,128
Transfer
agent
fees
........................................................................
410,832
Trustees'
fees
and
expenses
.................................................................
561
Distributions
to
shareholders
.................................................................
614,530
Accrued
expenses
and
other
liabilities
...........................................................
179,150
Total
liabilities
.........................................................................
6,085,162
Net
assets,
at
value
.................................................................
$2,687,285,818
Net
assets
consist
of:
Paid-in
capital
.............................................................................
$3,134,013,330
Total
distributable
earnings
(losses)
.............................................................
(446,727,512)
Net
assets,
at
value
.................................................................
$2,687,285,818
Franklin
New
York
Tax-Free
Income
Fund
Financial
Statements
Statement
of
Assets
and
Liabilities
(continued)
February
28,
2026
Annual
Report
The
accompanying
notes
are
an
integral
part
of
these
financial
statements.
Franklin
New
York
Tax-Free
Income
Fund
Class
A:
Net
assets,
at
value
.......................................................................
$338,950,661
Shares
outstanding
........................................................................
33,880,118
Net
asset
value
per
share
a
,b
..................................................................
$10.00
Maximum
offering
price
per
share
(net
asset
value
per
share
÷
96
.25
%
)
b
................................
$10.39
Class
A1:
Net
assets,
at
value
.......................................................................
$1,539,846,507
Shares
outstanding
........................................................................
153,814,856
Net
asset
value
per
share
a
,b
..................................................................
$10.01
Maximum
offering
price
per
share
(net
asset
value
per
share
÷
96
.25
%
)
b
................................
$10.40
Class
C:
Net
assets,
at
value
.......................................................................
$28,568,982
Shares
outstanding
........................................................................
2,856,928
Net
asset
value
and
maximum
offering
price
per
share
a
,b
............................................
$10.00
Class
R6:
Net
assets,
at
value
.......................................................................
$145,802,725
Shares
outstanding
........................................................................
14,545,720
Net
asset
value
and
maximum
offering
price
per
share
b
.............................................
$10.02
Advisor
Class:
Net
assets,
at
value
.......................................................................
$634,116,943
Shares
outstanding
........................................................................
63,296,314
Net
asset
value
and
maximum
offering
price
per
share
b
.............................................
$10.02
a
Redemption
price
is
equal
to
net
asset
value
less
contingent
deferred
sales
charges,
if
applicable.
b
Net
asset
value
per
share
may
not
recalculate
due
to
rounding.
Franklin
New
York
Tax-Free
Income
Fund
Financial
Statements
Statement
of
Operations
for
the
year
ended
February
28,
2026
The
accompanying
notes
are
an
integral
part
of
these
financial
statements.
Annual
Report
Franklin
New
York
Tax-Free
Income
Fund
Investment
income:
Interest:
Unaffiliated
issuers
........................................................................
$113,657,835
Expenses:
Management
fees
(Note
3
a
)
...................................................................
12,319,831
Distribution
fees:
(Note
3c
)
Class
A
................................................................................
824,947
Class
A1
...............................................................................
1,570,450
Class
C
................................................................................
240,945
Transfer
agent
fees:
(Note
3e
)
Class
A
................................................................................
236,262
Class
A1
...............................................................................
1,122,385
Class
C
................................................................................
26,029
Class
R6
...............................................................................
24,439
Advisor
Class
............................................................................
440,193
Custodian
fees
.............................................................................
14,934
Reports
to
shareholders
fees
..................................................................
73,103
Registration
and
filing
fees
....................................................................
34,592
Professional
fees
...........................................................................
80,442
Trustees'
fees
and
expenses
..................................................................
27,988
Other
....................................................................................
265,139
Total
expenses
.........................................................................
17,301,679
Net
investment
income
................................................................
96,356,156
Realized
and
unrealized
gains
(losses):
Net
realized
gain
(loss)
from:
Investments:
Unaffiliated
issuers
......................................................................
(19,679,511)
Net
change
in
unrealized
appreciation
(depreciation)
on:
Investments:
Unaffiliated
issuers
......................................................................
20,701,571
Net
realized
and
unrealized
gain
(loss)
............................................................
1,022,060
Net
increase
(decrease)
in
net
assets
resulting
from
operations
..........................................
$97,378,216
Franklin
New
York
Tax-Free
Income
Fund
Financial
Statements
Statements
of
Changes
in
Net
Assets
Annual
Report
The
accompanying
notes
are
an
integral
part
of
these
financial
statements.
Franklin
New
York
Tax-Free
Income
Fund
Year
Ended
February
28,
2026
Year
Ended
February
28,
2025
Increase
(decrease)
in
net
assets:
Operations:
Net
investment
income
.................................................
$96,356,156
$91,512,848
Net
realized
gain
(loss)
.................................................
(19,679,511)
(10,118,852)
Net
change
in
unrealized
appreciation
(depreciation)
...........................
20,701,571
(2,644,926)
Net
increase
(decrease)
in
net
assets
resulting
from
operations
................
97,378,216
78,749,070
Distributions
to
shareholders:
Class
A
.............................................................
(11,159,778)
(11,024,310)
Class
A1
............................................................
(55,422,062)
(58,481,094)
Class
C
.............................................................
(1,104,121)
(1,509,318)
Class
R6
............................................................
(4,838,683)
(3,644,004)
Advisor
Class
........................................................
(22,249,284)
(16,509,620)
Total
distributions
to
shareholders
..........................................
(94,773,928)
(91,168,346)
Capital
share
transactions:
(Note
2
)
Class
A
.............................................................
(12,925,180)
(8,145,236)
Class
A1
............................................................
(150,916,437)
(192,084,274)
Class
C
.............................................................
(18,850,456)
(15,949,490)
Class
R6
............................................................
20,123,905
25,945,467
Advisor
Class
........................................................
(5,977,512)
150,412,039
Total
capital
share
transactions
............................................
(168,545,680)
(39,821,494)
Net
increase
(decrease)
in
net
assets
...................................
(165,941,392)
(52,240,770)
Net
assets:
Beginning
of
year
.......................................................
2,853,227,210
2,905,467,980
End
of
year
...........................................................
$2,687,285,818
$2,853,227,210
Franklin
New
York
Tax-Free
Income
Fund
Notes
to
Financial
Statements
1.
Organization
and
Significant
Accounting
Policies
Franklin
New
York
Tax-Free
Income
Fund (Fund)
is
registered
under
the
Investment
Company
Act
of
1940
(1940
Act)
as
an
open-end
management
investment
company.
The Fund
follows
the
accounting
and
reporting
guidance
in
Financial
Accounting
Standards
Board
(FASB)
Accounting
Standards
Codification
Topic
946,
Financial
Services
–
Investment
Companies
(ASC
946)
and
applies
the
specialized
accounting
and
reporting
guidance
in
U.S.
Generally
Accepted
Accounting
Principles
(U.S.
GAAP),
including,
but
not
limited
to,
ASC
946.
The
Fund
offers five
classes
of
shares:
Class
A,
Class
A1,
Class
C,
Class
R6
and
Advisor
Class.
Class
C
shares
automatically
convert
to
Class
A
shares
on
a
monthly
basis,
after
they
have
been
held
for
8
years.
Each
class
of
shares
may
differ
by
its
initial
sales
load,
contingent
deferred
sales
charges,
voting
rights
on
matters
affecting
a
single
class,
its
exchange
privilege
and
fees
due
to
differing
arrangements
for
distribution
and
transfer
agent
fees.
The
following
summarizes
the Fund's
significant
accounting
policies.
a.
Financial
Instrument
Valuation
The
Fund's
investments
in
financial
instruments
are
carried
at
fair
value
daily.
Fair
value
is
the
price
that
would
be
received
to
sell
an
asset
or
paid
to
transfer
a
liability
in
an
orderly
transaction
between
market
participants
on
the
measurement
date.
The
Fund
calculates
the
net
asset
value
(NAV)
per
share
each business
day as
of
4
p.m.
Eastern
time
or
the
regularly
scheduled
close
of
the
New
York
Stock
Exchange
(NYSE),
whichever
is
earlier.
Under
compliance
policies
and
procedures
approved
by
the Fund's
Board
of
Trustees
(the
Board),
the
Board
has
designated
the
Fund’s
investment
manager
as
the
valuation
designee
and
has
responsibility
for
oversight
of
valuation.
The
investment
manager
is
assisted
by
the
Fund’s
administrator
in
performing
this
responsibility,
including
leading
the
cross-
functional
Valuation
Committee
(VC).
The
Fund
may
utilize
independent
pricing
services,
quotations
from
securities
and
financial
instrument
dealers,
and
other
market
sources
to
determine
fair
value.
Debt
securities
generally
trade
in
the over-the-counter
(OTC)
market
rather
than
on
a
securities
exchange.
The
Fund's
pricing
services
use
multiple
valuation
techniques
to
determine
fair
value.
In
instances
where
sufficient
market
activity
exists,
the
pricing
services
may
utilize
a
market-based
approach
through
which
quotes
from
market
makers
are
used
to
determine
fair
value.
In
instances
where
sufficient
market
activity
may
not
exist
or
is
limited,
the
pricing
services
also
utilize
proprietary
valuation
models
which
may
consider
market
characteristics
such
as
benchmark
yield
curves,
credit
spreads,
estimated
default
rates,
anticipated
market
interest
rate
volatility,
coupon
rates,
anticipated
timing
of
principal
repayments,
underlying
collateral,
and
other
unique
security
features
in
order
to
estimate
the
relevant
cash
flows,
which
are
then
discounted
to
calculate
the
fair
value.
The
Fund
has
procedures
to
determine
the
fair
value
of
financial
instruments
for
which
market
prices
are
not
reliable
or
readily
available.
Under
these
procedures,
the Fund
primarily
employs
a
market-based
approach
which
may
use
related
or
comparable
assets
or
liabilities,
recent
transactions,
market
multiples,
and
other
relevant
information
for
the
investment
to
determine
the
fair
value
of
the
investment.
An
income-based
valuation
approach
may
also
be
used
in
which
the
anticipated
future
cash
flows
of
the
investment
are
discounted
to
calculate
fair
value.
Discounts
may
also
be
applied
due
to
the
nature
or
duration
of
any
restrictions
on
the
disposition
of
the
investments.
Due
to
the
inherent
uncertainty
of
valuations
of
such
investments,
the
fair
values
may
differ
significantly
from
the
values
that
would
have
been
used
had
an
active
market
existed.
b.
Securities
Purchased
on
a
When-Issued,
Forward
Commitment or
Delayed
Delivery
Basis
The
Fund
may
purchase
securities
on
a when-issued,
forward
commitment
or
delayed
delivery basis,
with
payment
and
delivery
scheduled
for
a
future
date.
These
transactions
are
subject
to
market
fluctuations
and
are
subject
to
the
risk
that
the
value
at
delivery
may
be
more
or
less
than
the
trade
date
purchase
price.
Although
the
Fund
will
generally
purchase
these
securities
with
the
intention
of
holding
the
securities, it
may
sell
the
securities
before
the
settlement
date.
c.
Income
Taxes
It
is the Fund's
policy
to
qualify
as
a
regulated
investment
company
under
the
Internal
Revenue
Code. The Fund
intends
to
distribute
to
shareholders
substantially
all
of
its
taxable
income
and
net
realized
gains
to
relieve
it
from
federal
income
and
excise
taxes.
As
a
result,
no
provision
for
U.S.
federal
income
taxes
is
required.
Franklin
New
York
Tax-Free
Income
Fund
Notes
to
Financial
Statements
The Fund
may
recognize
an
income
tax
liability
related
to
its
uncertain
tax
positions
under
U.S.
GAAP
when
the
uncertain
tax
position
has
a
less
than
50%
probability
that
it
will
be
sustained
upon
examination
by
the
tax
authorities
based
on
its
technical
merits.
As
of
February
28,
2026, the Fund
has
determined
that
no
tax
liability
is
required
in
its
financial
statements
related
to
uncertain
tax
positions
for
any
open
tax
years
(or
expected
to
be
taken
in
future
tax
years).
The
Fund’s
federal
and
state
income
and
federal
excise
tax
returns
for
the
prior
three
fiscal
years
are
subject
to
examination
by
the
Internal
Revenue
Service
and
state
departments
of
revenue.
d.
Security
Transactions,
Investment
Income,
Expenses
and
Distributions
Security
transactions
are
accounted
for
on
trade
date.
Realized
gains
and
losses
on
security
transactions
are
determined
on
a
specific
identification
basis.
Interest
income
(including
interest
income
from
payment-in-kind
securities,
if
any)
and
estimated
expenses
are
accrued
daily.
Amortization
of
premium
and
accretion
of
discount
on
debt
securities
are
included
in
interest
income.
Paydown
gains
and
losses
are
recorded
as
an
adjustment
to
interest
income.
Dividends
from
net
investment
income
are
normally
declared
daily;
these
dividends
may
be
reinvested
or
paid
monthly
to
shareholders.
Distributions
from
realized
capital
gains
and
other
distributions,
if
any,
are
recorded
on
the
ex-dividend
date.
Distributable
earnings
are
determined
according
to
income
tax
regulations
(tax
basis)
and
may
differ
from
earnings
recorded
in
accordance
with
U.S.
GAAP.
These
differences
may
be
permanent
or
temporary.
Permanent
differences
are
reclassified
among
capital
accounts
to
reflect
their
tax
character.
These
reclassifications
have
no
impact
on
net
assets
or
the
results
of
operations.
Temporary
differences
are
not
reclassified,
as
they
may
reverse
in
subsequent
periods.
Realized
and
unrealized
gains
and
losses
and
net
investment
income,
excluding
class
specific
expenses,
are
allocated
daily
to
each
class
of
shares
based
upon
the
relative
proportion
of
net
assets
of
each
class.
Differences
in
per
share
distributions
by
class
are
generally
due
to
differences
in
class
specific
expenses.
e.
Insurance
The
scheduled
payments
of
interest
and
principal
for
each
insured
municipal
security
in
the
Fund
are
insured
by
either
a
new
issue
insurance
policy
or
a
secondary
insurance
policy.
Depending
on
the
type
of
coverage,
premiums
for
insurance
are
either
added
to
the
cost
basis
of
the
security
or
paid
by
a
third
party.
Insurance
companies
typically
insure
municipal
bonds
that
tend
to
be
of
very
high
quality,
with
the
majority
of
underlying
municipal
bonds
rated
A
or
better.
However,
an
event
involving
an
insurer
could
have
an
adverse
effect
on
the
value
of
the
securities
insured
by
that
insurance
company.
There
can
be
no
assurance
the
insurer
will
be
able
to
fulfill
its
obligations
under
the
terms
of
the
policy.
f.
Accounting
Estimates
The
preparation
of
financial
statements
in
accordance
with
U.S.
GAAP
requires
management
to
make
estimates
and
assumptions
that
affect
the
reported
amounts
of
assets
and
liabilities
at
the
date
of
the
financial
statements
and
the
amounts
of
income
and
expenses
during
the
reporting
period.
Actual
results
could
differ
from
those
estimates.
g.
Guarantees
and
Indemnifications
Under
the Fund's
organizational
documents,
its
officers
and trustees
are
indemnified
by
the
Fund against
certain
liabilities
arising
out
of
the
performance
of
their
duties
to
the
Fund.
Additionally,
in
the
normal
course
of
business,
the
Fund
enters
into
contracts
with
service
providers
that
contain
general
indemnification
clauses.
The Fund's
maximum
exposure
under
these
arrangements
is
unknown
as
this
would
involve
future
claims
that
may
be
made
against
the Fund
that
have
not
yet
occurred.
Currently,
the Fund
expects
the
risk
of
loss
to
be
remote.
1.
Organization
and
Significant
Accounting
Policies
(continued)
c.
Income
Taxes
(continued)
Franklin
New
York
Tax-Free
Income
Fund
Notes
to
Financial
Statements
2.
Shares
of
Beneficial
Interest
At
February
28,
2026,
there
were
an
unlimited
number
of
shares
authorized
(without
par
value).
Transactions
in
the
Fund's
shares
were
as
follows:
3.
Transactions
with
Affiliates
Franklin
Resources,
Inc.
is
the
holding
company
for
various
subsidiaries
that
together
are
referred
to
as
Franklin
Templeton.
Certain
officers
and trustees
of
the Fund are
also
officers
and/or directors
of
the
following
subsidiaries:
Year
Ended
February
28,
2026
Year
Ended
February
28,
2025
Shares
Amount
Shares
Amount
Class
A
Shares:
Shares
sold
a
...................................
5,536,566
$53,887,830
5,280,046
$52,749,156
Shares
issued
in
reinvestment
of
distributions
..........
1,055,531
10,242,777
1,016,596
10,139,140
Shares
redeemed
...............................
(7,960,642)
(77,055,787)
(7,117,954)
(71,033,532)
Net
increase
(decrease)
..........................
(1,368,545)
$(12,925,180)
(821,312)
$(8,145,236)
Class
A1
Shares:
Shares
sold
...................................
2,407,597
$23,419,121
2,432,649
$24,351,967
Shares
issued
in
reinvestment
of
distributions
..........
4,799,278
46,593,616
4,945,611
49,338,818
Shares
redeemed
...............................
(22,754,367)
(220,929,174)
(26,607,907)
(265,775,059)
Net
increase
(decrease)
..........................
(15,547,492)
$(150,916,437)
(19,229,647)
$(192,084,274)
Class
C
Shares:
Shares
sold
...................................
272,594
$2,635,253
414,842
$4,143,112
Shares
issued
in
reinvestment
of
distributions
..........
108,775
1,053,250
144,435
1,439,298
Shares
redeemed
a
..............................
(2,324,938)
(22,538,959)
(2,156,557)
(21,531,900)
Net
increase
(decrease)
..........................
(1,943,569)
$(18,850,456)
(1,597,280)
$(15,949,490)
Class
R6
Shares:
Shares
sold
...................................
7,237,003
$69,553,285
3,835,019
$38,222,250
Shares
issued
in
reinvestment
of
distributions
..........
355,770
3,459,545
315,717
3,155,329
Shares
redeemed
...............................
(5,485,594)
(52,888,925)
(1,544,297)
(15,432,112)
Net
increase
(decrease)
..........................
2,107,179
$20,123,905
2,606,439
$25,945,467
Advisor
Class
Shares:
Shares
sold
...................................
16,423,703
$158,361,754
26,098,559
$259,967,240
Shares
issued
in
reinvestment
of
distributions
..........
2,213,485
21,515,480
1,606,201
16,039,973
Shares
redeemed
...............................
(19,230,811)
(185,854,746)
(12,575,275)
(125,595,174)
Net
increase
(decrease)
..........................
(593,623)
$(5,977,512)
15,129,485
$150,412,039
a
May
include
a
portion
of
Class
C
shares
that
were
automatically
converted
to
Class
A.
Subsidiary
Affiliation
Franklin
Advisers,
Inc.
(Advisers)
Investment
manager
Franklin
Templeton
Services,
LLC
(FT
Services)
Administrative
manager
Franklin
Distributors,
LLC
(Distributors)
Principal
underwriter
Franklin
Templeton
Investor
Services,
LLC
(Investor
Services)
Transfer
agent
Franklin
New
York
Tax-Free
Income
Fund
Notes
to
Financial
Statements
a.
Management
Fees
The
Fund
pays
an
investment
management
fee,
calculated
daily
and
paid
monthly,
to
Advisers
based
on
the
month-end
net
assets
of
the
Fund
as
follows:
For
the
year
ended
February
28,
2026,
the
gross
effective
investment
management
fee
rate
was 0.459%
of
the
Fund’s
average daily
net
assets.
b.
Administrative
Fees
Under
an
agreement
with
Advisers,
FT
Services
provides
administrative
services
to
the
Fund.
The
fee
is
paid
by Advisers
based
on
the Fund's
average
daily
net
assets,
and
is
not
an
additional
expense
of
the
Fund.
c.
Distribution
Fees
The
Board
has
adopted
distribution
plans
for
each
share
class,
with
the
exception
of
Class
R6
and
Advisor
Class
shares,
pursuant
to
Rule
12b-1
under
the
1940
Act.
Under
the
Fund's
Class
A
and
A1
reimbursement
distribution
plans,
the
Fund
reimburses
Distributors
for
costs
incurred
in
connection
with
the
servicing,
sale
and
distribution
of the
Fund's
shares
up
to
the
maximum
annual
plan
rate
for
each
class.
Under
the
Class
A
and
A1
reimbursement
distribution
plans,
costs
exceeding
the
maximum
for
the
current
plan
year
cannot
be
reimbursed
in
subsequent
periods.
In
addition,
under
the
Fund's
Class
C
compensation
distribution
plan,
the
Fund
pays
Distributors
for
costs
incurred
in
connection
with
the
servicing,
sale
and
distribution
of
the
Fund's
shares
up
to
the
maximum
annual
plan
rate.
The
plan
year,
for
purposes
of
monitoring
compliance
with
the
maximum
annual
plan
rates,
is
February
1
through
January
31.
The
maximum
annual
plan
rates,
based
on
the
average
daily
net
assets,
for
each
class,
are
as
follows:
d.
Sales
Charges/Underwriting
Agreements
Front-end
sales
charges
and
contingent
deferred
sales
charges
(CDSC)
do
not
represent
expenses
of
the
Fund.
These
charges
are
deducted
from
the
proceeds
of
sales
of
fund
shares
prior
to
investment
or
from
redemption
proceeds
prior
to
remittance,
as
applicable.
Distributors
has
advised
the
Fund
of
the
following
commission
transactions
related
to
the
sales
and
redemptions
of
the
Fund's
shares
for
the
year:
Annualized
Fee
Rate
Net
Assets
0.625%
Up
to
and
including
$100
million
0.500%
Over
$100
million,
up
to
and
including
$250
million
0.450%
Over
$250
million,
up
to
and
including
$7.5
billion
0.440%
Over
$7.5
billion,
up
to
and
including
$10
billion
0.430%
Over
$10
billion,
up
to
and
including
$12.5
billion
0.420%
Over
$12.5
billion,
up
to
and
including
$15
billion
0.400%
Over
$15
billion,
up
to
and
including
$17.5
billion
0.380%
Over
$17.5
billion,
up
to
and
including
$20
billion
0.360%
In
excess
of
$20
billion
Class
A
....................................................................................
0.25%
Class
A1
...................................................................................
0.10%
Class
C
....................................................................................
0.65%
3.
Transactions
with
Affiliates
(continued)
Franklin
New
York
Tax-Free
Income
Fund
Notes
to
Financial
Statements
e.
Transfer
Agent
Fees
Each
class
of
shares
pays
transfer
agent
fees,
calculated
monthly
and
paid
monthly, to
Investor
Services
for
its
performance
of
shareholder
servicing
obligations. The
fees
are based
on
a
fixed
margin
earned
by
Investor
Services
and
are allocated
to
the Fund
based
upon
relative
assets
and
relative
transactions. In
addition,
each
class reimburses
Investor
Services
for
out
of
pocket
expenses
incurred
and,
except
for
Class
R6, reimburses
shareholder
servicing
fees
paid
to
third
parties.
These
fees
paid
to
third
parties
are
accrued
and
allocated
daily
based
upon
their
relative
proportion
of
such
classes'
aggregate
net
assets.
Class
R6
pays
Investor
Services
transfer
agent
fees
allocated
specifically
to
that
class
based
upon
its
relative
assets
and
relative
transactions.
For
the
year
ended
February
28,
2026,
the Fund
paid
transfer
agent
fees
as
noted
in
the
Statement of
Operations,
of
which
$603,262
was
retained
by
Investor
Services.
f.
Waiver
and
Expense
Reimbursements
Advisers
has contractually
agreed
in
advance
to
waive
or
limit
its fees
and
to
assume
as
its
own
expense
certain
expenses
otherwise
payable
by
the
Fund
so
that
the
operating expenses
(excluding
interest
expense,
distribution
fees,
acquired
fund
fees
and
expenses
and
certain
non-routine
expenses
or
costs,
including
those
relating
to
litigation,
indemnification,
reorganizations,
and
liquidations)
for
each
class
of
the
Fund
do
not
exceed 0.65%
based
on
the
average
net
assets
of
each
class
until
June
30,
2026.
Total
expenses
waived
or
paid
are
not
subject
to
recapture
subsequent
to
the
Fund's
fiscal
year
end.
Transfer
agent
fees
on
Class
R6
shares
of
the
Fund have
been
capped
so
that
transfer
agent
fees
for
that
class
do
not
exceed
0.03%
based
on
the
average
net
assets
of
the
class
until
June
30,
2026.
g.
Interfund
Transactions
The
Fund
engaged
in
purchases
and
sales
of
investments
with
funds
or
other
accounts
that
have
common
investment
managers
(or
affiliated
investment
managers),
directors,
trustees
or
officers.
During
the
year
ended
February
28,
2026,
these
purchase
and
sale
transactions
aggregated
$103,050,000
and
$142,175,000,
respectively.
4.
Income
Taxes
For
tax
purposes,
capital
losses
may
be
carried
over
to
offset
future
capital
gains.
At
February
28,
2026,
the
capital
loss
carryforwards
were
as
follows:
Sales
charges
retained
net
of
commissions
paid
to
unaffiliated
brokers/dealers
..............................
$12,461
CDSC
retained
..............................................................................
$35,137
Capital
loss
carryforwards
not
subject
to
expiration:
Short
term
................................................................................
$
98,020,176
Long
term
................................................................................
337,004,784
Total
capital
loss
carryforwards
...............................................................
$435,024,960
3.
Transactions
with
Affiliates
(continued)
d.
Sales
Charges/Underwriting
Agreements
(continued)
Franklin
New
York
Tax-Free
Income
Fund
Notes
to
Financial
Statements
The
tax
character
of
distributions
paid
during
the
years
ended
February
28,
2026
and
2025,
was
as
follows:
At
February
28,
2026,
the
cost
of
investments,
net
unrealized
appreciation
(depreciation)
and
undistributed
tax
exempt
income for
income
tax
purposes
were
as
follows:
Differences
between
income
and/or
capital
gains
as
determined
on
a
book
basis
and
a
tax
basis
are
primarily
due
to
differing
treatment
of
bond
discounts
and
premiums.
5.
Investment
Transactions
Purchases
and
sales
of
investments (excluding
short
term
securities) for
the
year
ended
February
28,
2026,
aggregated
$383,535,660 and
$566,969,927,
respectively.
6.
Concentration
of
Risk
The
Fund
invests
a
large
percentage
of
its total
assets
in
obligations
of
issuers
within
New
York
and
U.S.
territories.
Such
concentration
may
subject
the
Fund
to
risks
associated
with
industrial
or
regional
matters,
and
economic,
political
or
legal
developments
occurring
within
New
York
and
U.S.
territories. Investments
in
these
securities
are
sensitive
to
interest
rate
changes
and
credit
risk
of
the
issuer
and
may
subject
the
Fund
to
increased
market
volatility.
The
market
for
these
investments
may
be
limited,
which
may
make
them
difficult
to
buy
or
sell.
7.
Credit
Facility
The
Fund,
together
with
other
U.S.
registered
and
foreign
investment
funds
(collectively,
Borrowers),
managed
by
Franklin
Templeton,
are
borrowers
in
a
joint
syndicated
senior
unsecured
credit
facility
totaling
$2.995
billion
(Global
Credit
Facility)
which
matures
on
January
29,
2027.
This
Global
Credit
Facility
provides
a
source
of
funds
to
the
Borrowers
for
temporary
and
emergency
purposes,
including
the
ability
to
meet
future
unanticipated
or
unusually
large
redemption
requests.
Under
the
terms
of
the
Global
Credit
Facility,
the
Fund
may,
in
addition
to
interest
charged
on
any
borrowings
made
by
the
Fund
and
other
costs
incurred
by
the
Fund,
pay
its
share
of
fees
and
expenses
incurred
in
connection
with
the
implementation
and
maintenance
of
the
Global
Credit
Facility,
based
upon
its
relative
share
of
the
aggregate
net
assets
of
all
of
the
Borrowers,
including
an
annual
commitment
fee
of
0.15%
based
upon
the
unused
portion
of
the
Global
Credit
Facility.
These
fees
are
reflected
in
other
expenses
in
the
Statement
of
Operations.
During
the
year
ended
February
28,
2026,
the Fund
did
not
use
the
Global
Credit
Facility.
2026
2025
Distributions
paid
from:
Ordinary
income
..........................................................
$714,358
$2,112,309
Tax
exempt
income
........................................................
94,059,570
89,056,037
$94,773,928
$91,168,346
Cost
of
investments
..........................................................................
$2,675,008,616
Unrealized
appreciation
........................................................................
$66,301,221
Unrealized
depreciation
........................................................................
(81,689,824)
Net
unrealized
appreciation
(depreciation)
..........................................................
$(15,388,603)
Distributable
earnings:
Undistributed
tax
exempt
income
.................................................................
$4,300,572
4.
Income
Taxes
(continued)
Franklin
New
York
Tax-Free
Income
Fund
Notes
to
Financial
Statements
8.
Fair
Value
Measurements
The
Fund
follows
a
fair
value
hierarchy
that
distinguishes
between
market
data
obtained
from
independent
sources
(observable
inputs)
and
the Fund's
own
market
assumptions
(unobservable
inputs).
These
inputs
are
used
in
determining
the
value
of
the
Fund's financial
instruments
and
are
summarized
in
the
following
fair
value
hierarchy:
Level
1
–
quoted
prices
in
active
markets
for
identical
financial
instruments
Level
2
–
other
significant
observable
inputs
(including
quoted
prices
for
similar
financial
instruments,
interest
rates,
prepayment
speed,
credit
risk,
etc.)
Level
3
–
significant
unobservable
inputs
(including
the
Fund's
own
assumptions
in
determining
the
fair
value
of
financial
instruments)
The
input
levels
are
not
necessarily
an
indication
of
the
risk
or
liquidity
associated
with
financial
instruments
at
that
level.
A
summary
of
inputs
used
as
of February
28,
2026,
in
valuing
the
Fund's
assets
carried
at
fair
value,
is
as
follows:
A
reconciliation
in
which
Level
3
inputs
are
used
in
determining
fair
value
is
presented
when
there
are
significant
Level
3
assets
and/or
liabilities
at
the
beginning
and/or
end
of
the year.
9.
Operating
Segments
The Fund operates
as
a
single
operating
segment,
which
is
an
investment
portfolio.
The
portfolio
managers
assigned
to
the
Fund
within
the
Fund’s
investment
manager serve
as
the
Chief
Operating
Decision
Maker
(“CODM”)
and
are
responsible
for
evaluating
the
Fund's
operating
results
and
allocating
resources
in
accordance
with
the
Fund’s
investment
strategy.
Internal
reporting
provided
to
the
CODM
aligns
with
the
accounting
policies
and
measurement
principles
used
in
the financial
statements.
For
information
regarding
segment
assets,
segment
profit
or
loss,
and
significant
expenses,
refer
to
the Statement
of
Assets
and
Liabilities
and
the Statement
of
Operations,
along
with
the
related
notes
to
the financial
statements.
The Schedule
of
Investments
provides
details
of
the Fund's investments
that
generate
returns
such
as
interest,
dividends,
and
realized
and
unrealized
gains
or
losses.
Performance
metrics,
including
portfolio
turnover
and
expense
ratios,
are
disclosed
in
the Financial
Highlights.
10.
Subsequent
Events
The
Fund
has
evaluated
subsequent
events
through
the
issuance
of
the
financial
statements
and
determined
that
no
events
have
occurred
that
require
disclosure.
Level
1
Level
2
Level
3
Total
Franklin
New
York
Tax-Free
Income
Fund
Assets:
Investments
in
Securities:
a
Corporate
Bonds
........................
$
—
$
—
$
7,090,824
$
7,090,824
Municipal
Bonds
.........................
—
2,625,579,189
—
2,625,579,189
Short
Term
Investments
...................
—
26,950,000
—
26,950,000
Total
Investments
in
Securities
...........
$—
$2,652,529,189
$7,090,824
$2,659,620,013
a
For
detailed
categories,
see
the
accompanying
Schedule
of
Investments.
Franklin
New
York
Tax-Free
Income
Fund
Notes
to
Financial
Statements
Abbreviations
Selected
Portfolio
AG
Assured
Guaranty,
Inc.
AMBAC
American
Municipal
Bond
Assurance
Corp.
BAM
Build
America
Mutual
Assurance
Co.
FNMA
Federal
National
Mortgage
Association
GO
General
Obligation
LOC
Letter
of
Credit
NATL
National
Reinsurance
Corp.
SPA
Standby
Purchase
Agreement
Franklin
New
York
Tax-Free
Income
Fund
Report
of
Independent
Registered
Public
Accounting
Firm
To
the
Board
of
Trustees
and
Shareholders
of
Franklin
New
York
Tax-Free
Income
Fund
Opinion
on
the
Financial
Statements
We
have
audited
the
accompanying
statement
of
assets
and
liabilities,
including
the
schedule
of
investments,
of
Franklin
New
York
Tax-Free
Income
Fund
(the
"Fund")
as
of
February
28,
2026,
the
related
statement
of
operations
for
the
year
ended
February
28,
2026,
the
statements
of
changes
in
net
assets
for
each
of
the
two
years
in
the
period
ended
February
28,
2026,
including
the
related
notes,
and
the
financial
highlights
for
each
of
the
four
years
in
the
period
ended
February
28,
2026,
the
period
June
1,
2021
to
February
28,
2022
and
the
year
ended
May
31,
2021
(collectively
referred
to
as
the
“financial
statements”).
In
our
opinion,
the
financial
statements
present
fairly,
in
all
material
respects,
the
financial
position
of
the
Fund
as
of
February
28,
2026,
the
results
of
its
operations
for
the
year
then
ended,
the
changes
in
its
net
assets
for
each
of
the
two
years
in
the
period
ended
February
28,
2026
and
the
financial
highlights
for
each
of
the
four
years
in
the
period
ended
February
28,
2026,
the
period
June
1,
2021
to
February
28,
2022
and
the
year
ended
May
31,
2021
in
conformity
with
accounting
principles
generally
accepted
in
the
United
States
of
America.
Basis
for
Opinion
These
financial
statements
are
the
responsibility
of
the
Fund’s
management.
Our
responsibility
is
to
express
an
opinion
on
the
Fund’s
financial
statements
based
on
our
audits.
We
are
a
public
accounting
firm
registered
with
the
Public
Company
Accounting
Oversight
Board
(United
States)
(PCAOB)
and
are
required
to
be
independent
with
respect
to
the
Fund
in
accordance
with
the
U.S.
federal
securities
laws
and
the
applicable
rules
and
regulations
of
the
Securities
and
Exchange
Commission
and
the
PCAOB.
We
conducted
our
audits
of
these
financial
statements
in
accordance
with
the
standards
of
the
PCAOB.
Those
standards
require
that
we
plan
and
perform
the
audit
to
obtain
reasonable
assurance
about
whether
the
financial
statements
are
free
of
material
misstatement,
whether
due
to
error
or
fraud.
Our
audits
included
performing
procedures
to
assess
the
risks
of
material
misstatement
of
the
financial
statements,
whether
due
to
error
or
fraud,
and
performing
procedures
that
respond
to
those
risks.
Such
procedures
included
examining,
on
a
test
basis,
evidence
regarding
the
amounts
and
disclosures
in
the
financial
statements.
Our
audits
also
included
evaluating
the
accounting
principles
used
and
significant
estimates
made
by
management,
as
well
as
evaluating
the
overall
presentation
of
the
financial
statements.
Our
procedures
included
confirmation
of
securities
owned
as
of
February
28,
2026
by
correspondence
with
the
custodian,
private
placement
agent
and
broker.
We
believe
that
our
audits
provide
a
reasonable
basis
for
our
opinion.
/s/PricewaterhouseCoopers
LLP
San
Francisco,
California
April
17,
2026
We
have
served
as
the
auditor
of
one
or
more
investment
companies
in
the
Franklin
Templeton
Group
of
Funds
since
1948.
Franklin
New
York
Tax-Free
Income
Fund
Tax
Information
(unaudited)
By
mid-February,
tax
information
related
to
a
shareholder's
proportionate
share
of
distributions
paid
during
the
preceding
calendar
year
will
be
received,
if
applicable.
Please
also
refer
to
www.franklintempleton.com
for
per
share
tax
information
related
to
any
distributions
paid
during
the
preceding
calendar
year.
Shareholders
are
advised
to
consult
with
their
tax
advisors
for
further
information
on
the
treatment
of
these
amounts
on
their
tax
returns.
The
following
tax
information
for
the
Fund
is
required
to
be
furnished
to
shareholders
with
respect
to
income
earned
and
distributions
paid
during
its
fiscal
year.
The
Fund
hereby
reports
the
following
amounts,
or
if
subsequently
determined
to
be
different,
the
maximum
allowable
amounts,
for
the
fiscal
year
ended
February
28,
2026:
Pursuant
to:
Amount
Reported
Exempt-Interest
Dividends
Distributed
§852(b)(5)(A)
$94,059,570
Section
163(j)
Interest
Earned
§163(j)
$714,358
Franklin
New
York
Tax-Free
Income
Fund
Changes
In
and
Disagreements
with
Accountants
For
the
period
covered
by
this
report
Not
applicable.
Results
of
Meeting(s)
of
Shareholders
For
the
period
covered
by
this
report
Not
applicable.
Remuneration
Paid
to
Directors,
Officers
and
Others
For
the
period
covered
by
this
report
Refer
to
the
financial
statements
included
herein.
Remuneration
to
officers
is
paid
by
the
Fund’s
investment
manager
according
to
the
terms
of
the
agreement.
Board
Approval
of
Management
and
Subadvisory
Agreements
For
the
period
covered
by
this
report
Not
applicable.
©
2026
Franklin
Templeton.
All
rights
reserved.
|
ITEM 8. |
CHANGES IN AND DISAGREEMENTS WITH ACCOUNTANTS FOR OPEN-END MANAGEMENT INVESTMENT COMPANIES. |
The information is disclosed as part of the Financial Statements
included in Item 7 of this Form N-CSR.
|
ITEM 9. |
PROXY DISCLOSURES FOR OPEN-END MANAGEMENT INVESTMENT COMPANIES. |
The information is disclosed as part of the Financial Statements
included in Item 7 of this Form N-CSR.
|
ITEM 10. |
REMUNERATION PAID TO DIRECTORS, OFFICERS, AND OTHERS OF OPEN-END MANAGEMENT INVESTMENT
COMPANIES. |
The information is disclosed as part of the Financial Statements
included in Item 7 of this Form N-CSR.
|
ITEM 11. |
STATEMENT REGARDING BASIS FOR APPROVAL OF INVESTMENT ADVISORY CONTRACT. |
The information is disclosed as part of the Financial Statements
included in Item 7 of this Form N-CSR, as applicable.
|
ITEM 12. |
DISCLOSURE OF PROXY VOTING POLICIES AND PROCEDURES FOR CLOSED-END MANAGEMENT INVESTMENT
COMPANIES. |
Not applicable.
|
ITEM 13. |
PORTFOLIO MANAGERS OF CLOSED-END MANAGEMENT INVESTMENT COMPANIES. |
Not applicable.
|
ITEM 14. |
PURCHASES OF EQUITY SECURITIES BY CLOSED-END MANAGEMENT INVESTMENT COMPANY AND AFFILIATED
PURCHASERS. |
Not applicable.
|
ITEM 15. |
SUBMISSION OF MATTERS TO A VOTE OF SECURITY HOLDERS. |
There have been no changes to the procedures by which shareholders
may recommend nominees to the Registrant’s Board of Trustees that would require disclosure herein.
|
ITEM 16. |
CONTROLS AND PROCEDURES. |
|
(a) |
The Registrant’s chief executive officer and chief financial officer have
concluded that the Registrant’s disclosure controls and procedures (as defined in Rule 30a- 3(c) under the Investment Company Act
of 1940, as amended (the “1940 Act”)) are effective as of a date within 90 days of the filing date of this report that includes
the disclosure required by this paragraph, based on their evaluation of the disclosure controls and procedures required by Rule 30a-3(b)
under the 1940 Act and 15d-15(b) under the Securities Exchange Act of 1934. |
|
(b) |
There were no changes in the Registrant’s internal control over financial reporting
(as defined in Rule 30a-3(d) under the 1940 Act) that occurred during the period covered by this report that have materially affected
or are likely to materially affect the Registrant’s internal control over financial reporting. |
|
ITEM 17. |
DISCLOSURE OF SECURITIES LENDING ACTIVITIES FOR CLOSED-END MANAGEMENT INVESTMENT COMPANIES. |
Not applicable.
|
ITEM 18. |
RECOVERY OF ERRONEOUSLY AWARDED COMPENSATION. |
(a) (1) Code
of Ethics attached hereto.
Exhibit 99.CODE ETH
(a) (3) Certifications
pursuant to section 302 of the Sarbanes-Oxley Act of 2002 attached hereto.
Exhibit 99.CERT
(b) Certifications pursuant
to Section 906 of the Sarbanes-Oxley Act of 2002 attached hereto.
Exhibit 99.906CERT
SIGNATURES
Pursuant to the requirements of the Securities Exchange
Act of 1934 and the Investment Company Act of 1940, the registrant has duly caused this Report to be signed on its behalf by the undersigned,
there unto duly authorized.
Franklin New York Tax-Free Income Fund
| By: |
/s/ Christopher Kings |
|
| |
Christopher Kings |
|
| |
Chief Executive Officer - Finance and Administration |
|
Pursuant to the requirements of the Securities Exchange Act of 1934 and
the Investment Company Act of 1940, this report has been signed below by the following persons on behalf of the registrant and in the
capacities and on the dates indicated.
| By: |
/s/ Christopher Kings |
|
| |
Christopher Kings |
|
| |
Chief Executive Officer - Finance and Administration |
|
| Date: |
April 30, 2026 |
|
| |
|
|
| By: |
/s/ Jeffrey
White |
|
| |
Jeffrey White |
|
| |
Chief Financial Officer, Chief Accounting Officer and Treasurer |
|