Pure in Thousands
|
Value of initial fixed $100 investment based on: |
||||||||||||||||||||||||||||||||||||||||
|
Year |
Summary Compensation Table Total for Mr. Green(1) |
Compensation Actually Paid to Mr. Green(1) |
Summary Compensation Table Total for Mr. Hays(1) |
Compensation Actually Paid to Mr. Hays(1) |
Average Summary Compensation Table Total for Non-PEO NEOs |
Average Compensation Actually Paid to Non-PEO NEOs (2) |
Total Stockholder Return |
Peer group Total Stockholder Return(3) |
Net Income |
Revenue |
||||||||||||||||||||||||||||||
|
(in thousands) |
||||||||||||||||||||||||||||||||||||||||
|
2025 |
$ | 11,961,900 | $ | 14,791,900 | $ | 184,416 | $ | 203,338 | $ | 1,621,979 | $ | 2,090,935 | $ | 47.12 | $ | 134.40 | $ | 11,600 | $ | 137,390 | ||||||||||||||||||||
|
2024 |
– | – | $ | 184,862 | $ | (43,480 | ) | $ | 1,124,539 | $ | 296,563 | $ | 29.28 | $ | 142.93 | $ | 24,783 | $ | 143,060 | |||||||||||||||||||||
|
2023 |
– | – | $ | 195,566 | $ | 202,165 | $ | 428,157 | $ | 443,660 | $ | 64.34 | $ | 128.14 | $ | 30,971 | $ | 148,580 | ||||||||||||||||||||||
|
2022 |
– | – | $ | 181,173 | $ | 184,526 | $ | 410,113 | $ | 418,936 | $ | 59.60 | $ | 109.59 | $ | 31,800 | $ | 151,568 | ||||||||||||||||||||||
|
2021 |
– | – | $ | 217,094 | $ | 207,809 | $ | 490,467 | $ | 469,883 | $ | 64.98 | $ | 137.74 | $ | 37,466 | $ | 147,954 | ||||||||||||||||||||||
|
(1) |
Each of Mr. Green and Mr. Hays served as the Principal Executive Officer (“PEO”) during 2025 and Mr. Hays was the PEO for 2024, 2023, 2022, and 2021. The following amounts were deducted and added to determine the compensation actually paid to the PEO: |
|
Year |
Summary Compensation Table Total for PEO |
Deduct Stock and Option Awards Reported in the Summary Compensation Table |
Add Awards Granted During the Covered FY that are Outstanding and Unvested as of the End of the Covered FY |
Add Change in Fair Value as of the End of the Covered FY for Awards Granted in a Prior FY that are Outstanding and Unvested as of the End of the Covered FY |
Add Fair Value as of Vesting Date for Awards Granted in Covered FY that Vested During Covered FY |
Add Change in Fair Value as of the Vesting Date for Awards Granted in a Prior FY that Vested During the Covered FY |
Add Dividends Paid on Awards in the Covered FY Prior to the Vesting Date that are Not Otherwise Included in Total Compensation for the Covered FY |
Compensation Actually Paid to PEO |
||||||||||||||||||||||||
|
2025 – Mr. Green |
$ | 11,961,900 | $ | (6,755,000 | ) | $ | 9,385,000 | - | - | - | $ | 200,000 | $ | 14,791,900 | ||||||||||||||||||
|
2025 – Mr. Hays |
$ | 184,416 | $ | (54,554 | ) | $ | 57,530 | $ | 15,982 | - | $ | (36 | ) | - | $ | 203,338 | ||||||||||||||||
|
2024 |
$ | 184,862 | $ | (55,000 | ) | $ | 1,406 | $ | (179,760 | ) | - | $ | 5,012 | - | $ | (43,480 | ) | |||||||||||||||
|
2023 |
$ | 195,566 | $ | (64,455 | ) | $ | 70,289 | $ | (4,749 | ) | - | $ | 5,514 | - | $ | 202,165 | ||||||||||||||||
|
2022 |
$ | 181,173 | $ | (49,527 | ) | $ | 54,018 | $ | (2,257 | ) | - | $ | 1,119 | - | $ | 184,526 | ||||||||||||||||
|
2021 |
$ | 217,094 | $ | (49,595 | ) | $ | 45,549 | $ | (7,756 | ) | - | $ | 2,517 | - | $ | 207,809 | ||||||||||||||||
|
|
The shares granted to Mr. Green in 2025 fully vested on the grant date but were subject to repurchase by the Company for $1.00 if Mr. Green’s employment terminated prior to certain time-based service milestones. In accordance with applicable SEC guidance, these shares are reported as unvested until the repurchase right lapses. The terms of this award were amended in April 2026 to eliminate the repurchase right. See “Long-Term Equity Incentive” and “Compensation Decisions with Respect to 2026” above for additional information. |
|
(2) |
Mr. Harrison, Ms. Stacy, Ms. Hrdy, Mr. Monnich, and Mr. Rau were non-PEO Named Executive Officers (“NEOs”) for 2025. Jason Hahn (our former Chief Revenue Officer), Ms. Hrdy, Kevin Karas (our former Chief Financial Officer), Ms. Stacy, and Christophe Louvion (our former Chief Product Technology Officer) were non-PEO NEOs during 2024. Ms. Hrdy, Mr. Karas, and Jona S. Raasch (our former Chief Operating Officer) were non-PEO NEOs during 2023, 2022, and 2021. The following average amounts were deducted and added to determine the average compensation actually paid to the non-PEO NEOs: |
|
Year |
Average Summary Compensation Table Total for Non-PEO NEOs |
Deduct Stock and Option Awards Reported in the Summary Compensation Table |
Add Awards Granted During the Covered FY that are Outstanding and Unvested as of the End of the Covered FY |
Add Change in Fair Value as of the End of the Covered FY for Awards Granted in a Prior FY that are Outstanding and Unvested as of the End of the Covered FY |
Add Fair Value as of Vesting Date for Awards Granted in Covered FY that Vested During Covered FY |
Add Change in Fair Value as of the Vesting Date for Awards Granted in a Prior FY that Vested During the Covered FY |
Subtract Awards Granted in a Prior FY that Failed to Meet the Applicable Vesting Conditions During the Covered FY |
Add Dividends Paid on Awards in the Covered FY Prior to the Vesting Date that are Not Otherwise Included in Total Compensation for the Covered FY |
Average Compensation Actually Paid to Non-PEO NEOs |
|||||||||||||||||||||||||||
|
2025 |
$ | 1,621,979 | $ | (953,520 | ) | $ | 1,235,066 | $ | 5,444 | $ | 160,476 | $ | (14 | ) | - | $ | 21,504 | $ | 2,090,935 | |||||||||||||||||
|
2024 |
$ | 1,124,539 | $ | (682,800 | ) | $ | 17,457 | $ | (79,628 | ) | - | $ | 3,933 | $ | (86,939 | )(4) | - | $ | 296,563 | |||||||||||||||||
|
2023 |
$ | 428,157 | $ | (146,711 | ) | $ | 159,990 | $ | (9,317 | ) | - | $ | 11,541 | - | - | $ | 443,660 | |||||||||||||||||||
|
2022 |
$ | 410,113 | $ | (112,737 | ) | $ | 122,960 | $ | (3,742 | ) | - | $ | 2,342 | - | - | $ | 418,936 | |||||||||||||||||||
|
2021 |
$ | 490,467 | $ | (112,904 | ) | $ | 103,693 | $ | (16,358 | ) | - | $ | 4,985 | - | - | $ | 469,883 | |||||||||||||||||||
|
|
The shares granted to Ms. Hrdy and Mr. Monnich in 2025 fully vested on the grant date but were subject to repurchase by the Company for $1.00 if Ms. Hrdy’s or Mr. Monnich’s employment terminated prior to certain time-based service milestones. In accordance with applicable SEC guidance, these shares are reported as unvested until the repurchase right lapses. The terms of these awards were amended in April 2026 to eliminate the repurchase right. See “Long-Term Equity Incentive” and “Compensation Decisions with Respect to 2026” above for additional information. |
|
(3) |
Utilizes the Russell 2000 Index, which we also utilize in the stock performance graph required by Item 201(e) of Regulation S-K included in our Form 10-K for the year ended December 31, 2025. Because of the uniqueness of our markets and products and lack of publicly traded peers, we do not believe that a combination of peer issuers can be selected on an industry or line-of-business basis to provide a meaningful basis for comparing stockholder return. Accordingly, the Russell 2000 Index, which is comprised of issuers with generally similar market capitalizations to that of the Company, is included in the table as permitted by applicable regulations. The comparison assumes $100 was invested for the period starting December 31, 2020, through the end of the listed year in the Company and in the Russel 2000 Index, respectively. Historical stock performance is not necessarily indicative of future stock performance. |
|
(4) |
Represents options held by Mr. Karas that were forfeited upon his retirement in March 2024. |
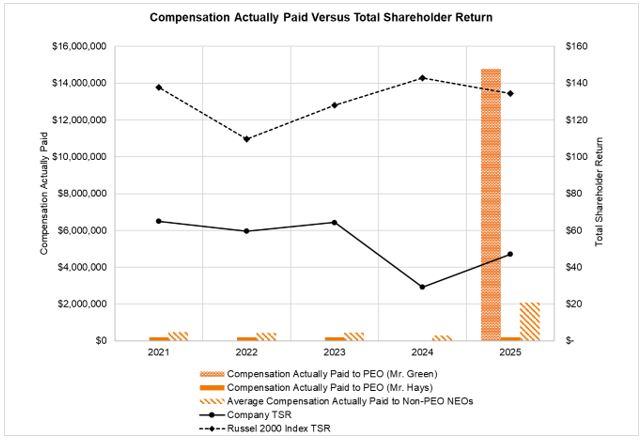
The relationship between the compensation actually paid to the PEO and the average compensation actually paid to the non-PEO NEOs and the cumulative total stockholder return of the Company and the Russell 2000 Index for 2025, 2024, 2023, 2022, and 2021 is represented by the graph below:
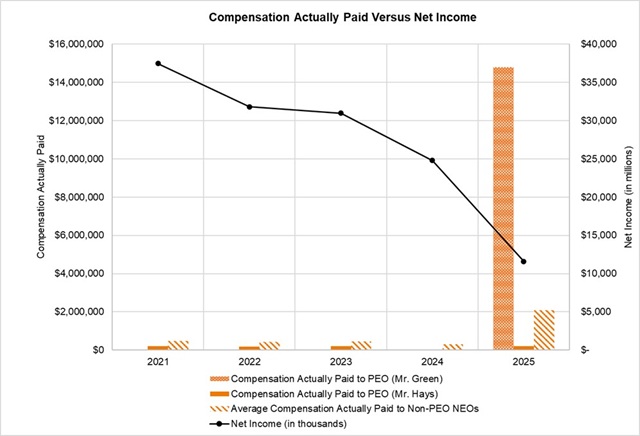
The relationship between the compensation actually paid to the PEO and the average compensation actually paid to the non-PEO NEOs and the Company’s net income for 2025, 2024, 2023, 2022, and 2021 is represented by the graph below:
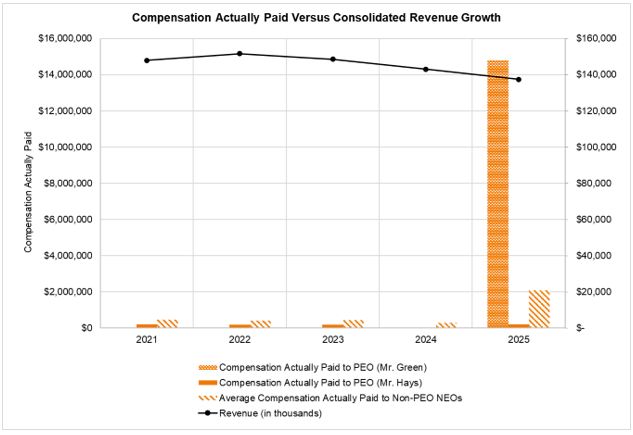
The relationship between the compensation actually paid to the PEO and the average compensation actually paid to the non-PEO NEOs and the Company’s revenue for 2025, 2024, 2023, 2022, and 2021 is represented by the graph below:
The following tabular list includes the financial performance measures which in the Company’s assessment represent the most important financial performance measures used by the Company to link compensation actually paid to the Company’s NEO’s for 2025 to Company performance.
|
Important Financial Measures |
|
Net Income |
|
Revenue |
|
Total Recurring Contract Value Adjusted EBITDA Margin |