NORTHWESTERN MUTUAL SERIES FUND, INC.
PROSPECTUS
| EQUITY PORTFOLIOS |
INTERNATIONAL PORTFOLIOS |
| GROWTH STOCK PORTFOLIO |
INTERNATIONAL GROWTH PORTFOLIO |
| FOCUSED APPRECIATION PORTFOLIO |
RESEARCH INTERNATIONAL CORE PORTFOLIO |
| LARGE CAP CORE STOCK PORTFOLIO |
INTERNATIONAL EQUITY PORTFOLIO |
| LARGE CAP BLEND PORTFOLIO |
EMERGING MARKETS EQUITY PORTFOLIO |
| INDEX 500 STOCK PORTFOLIO |
|
| LARGE COMPANY VALUE PORTFOLIO |
FIXED INCOME PORTFOLIOS |
| DOMESTIC EQUITY PORTFOLIO |
GOVERNMENT MONEY MARKET PORTFOLIO |
| EQUITY INCOME PORTFOLIO |
SHORT-TERM BOND PORTFOLIO |
| |
SELECT BOND PORTFOLIO |
| MID CAP GROWTH STOCK PORTFOLIO |
LONG-TERM U.S. GOVERNMENT BOND PORTFOLIO |
| INDEX 400 STOCK PORTFOLIO MID CAP VALUE PORTFOLIO |
INFLATION MANAGED PORTFOLIO (formerly Inflation Protection Portfolio) |
| |
HIGH YIELD BOND PORTFOLIO |
| SMALL CAP GROWTH STOCK PORTFOLIO |
MULTI-SECTOR BOND PORTFOLIO |
| INDEX 600 STOCK PORTFOLIO |
|
| SMALL CAP VALUE PORTFOLIO |
ACTIVE/PASSIVE ALLOCATION PORTFOLIOS |
| |
ACTIVE/PASSIVE VERY AGGRESSIVE PORTFOLIO (formerly Active/Passive All Equity Portfolio) |
| |
ACTIVE/PASSIVE AGGRESSIVE PORTFOLIO |
| |
ACTIVE/PASSIVE MODERATE PORTFOLIO (formerly Asset Allocation Portfolio) |
| |
ACTIVE/PASSIVE BALANCED PORTFOLIO (formerly Balanced Portfolio) |
| |
ACTIVE/PASSIVE CONSERVATIVE PORTFOLIO |
The Securities and Exchange Commission has not approved or disapproved these securities or passed upon the adequacy of this prospectus. Any representation to the contrary is a criminal offense.
Table of Contents
| |
Page |
| 1 | |
| 1 | |
| 4 | |
| 8 | |
| 11 | |
| 15 | |
| 19 | |
| 23 | |
| 26 | |
| 29 | |
| 32 | |
| 35 | |
| 39 | |
| 43 | |
| 46 | |
| 50 | |
| 54 | |
| 58 | |
| 62 | |
| 66 | |
| 69 | |
| 73 | |
| 77 | |
| 82 | |
| 86 | |
| 89 | |
| 94 | |
| 99 | |
| 105 | |
| 111 | |
| 117 | |
| 123 | |
| 123 | |
| 124 | |
| 124 | |
| 128 | |
| 149 | |
| 150 | |
| 151 | |
| 151 | |
| 151 | |
| 153 | |
| 157 | |
| 160 | |
| 160 |
i Northwestern Mutual Series Fund, Inc. Prospectus
| |
Page |
| 161 | |
| 161 | |
| 161 | |
| 161 | |
| 162 | |
| 162 | |
| 162 | |
| 163 | |
| 164 | |
| 164 | |
| 166 | |
| 171 |
Northwestern Mutual Series Fund, Inc. Prospectus ii
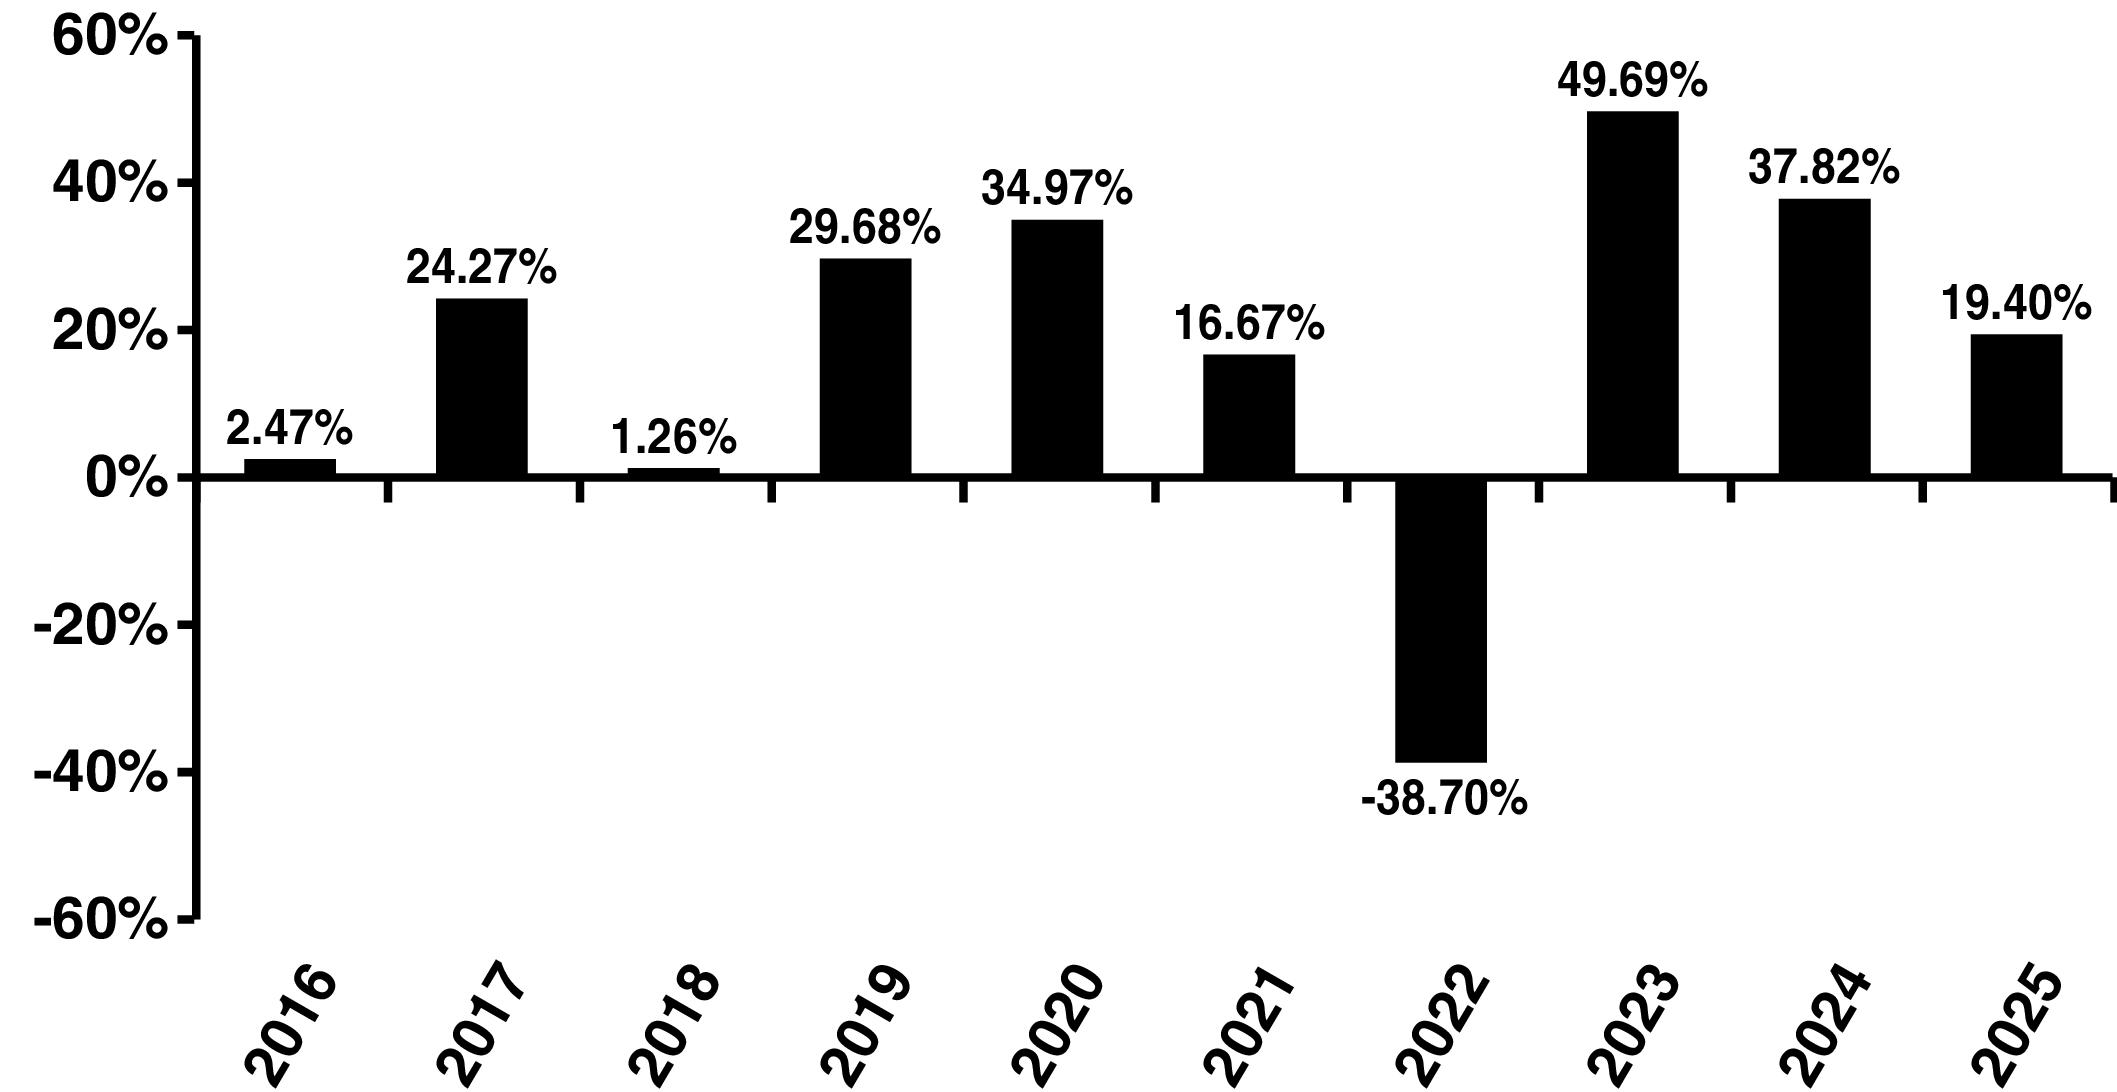
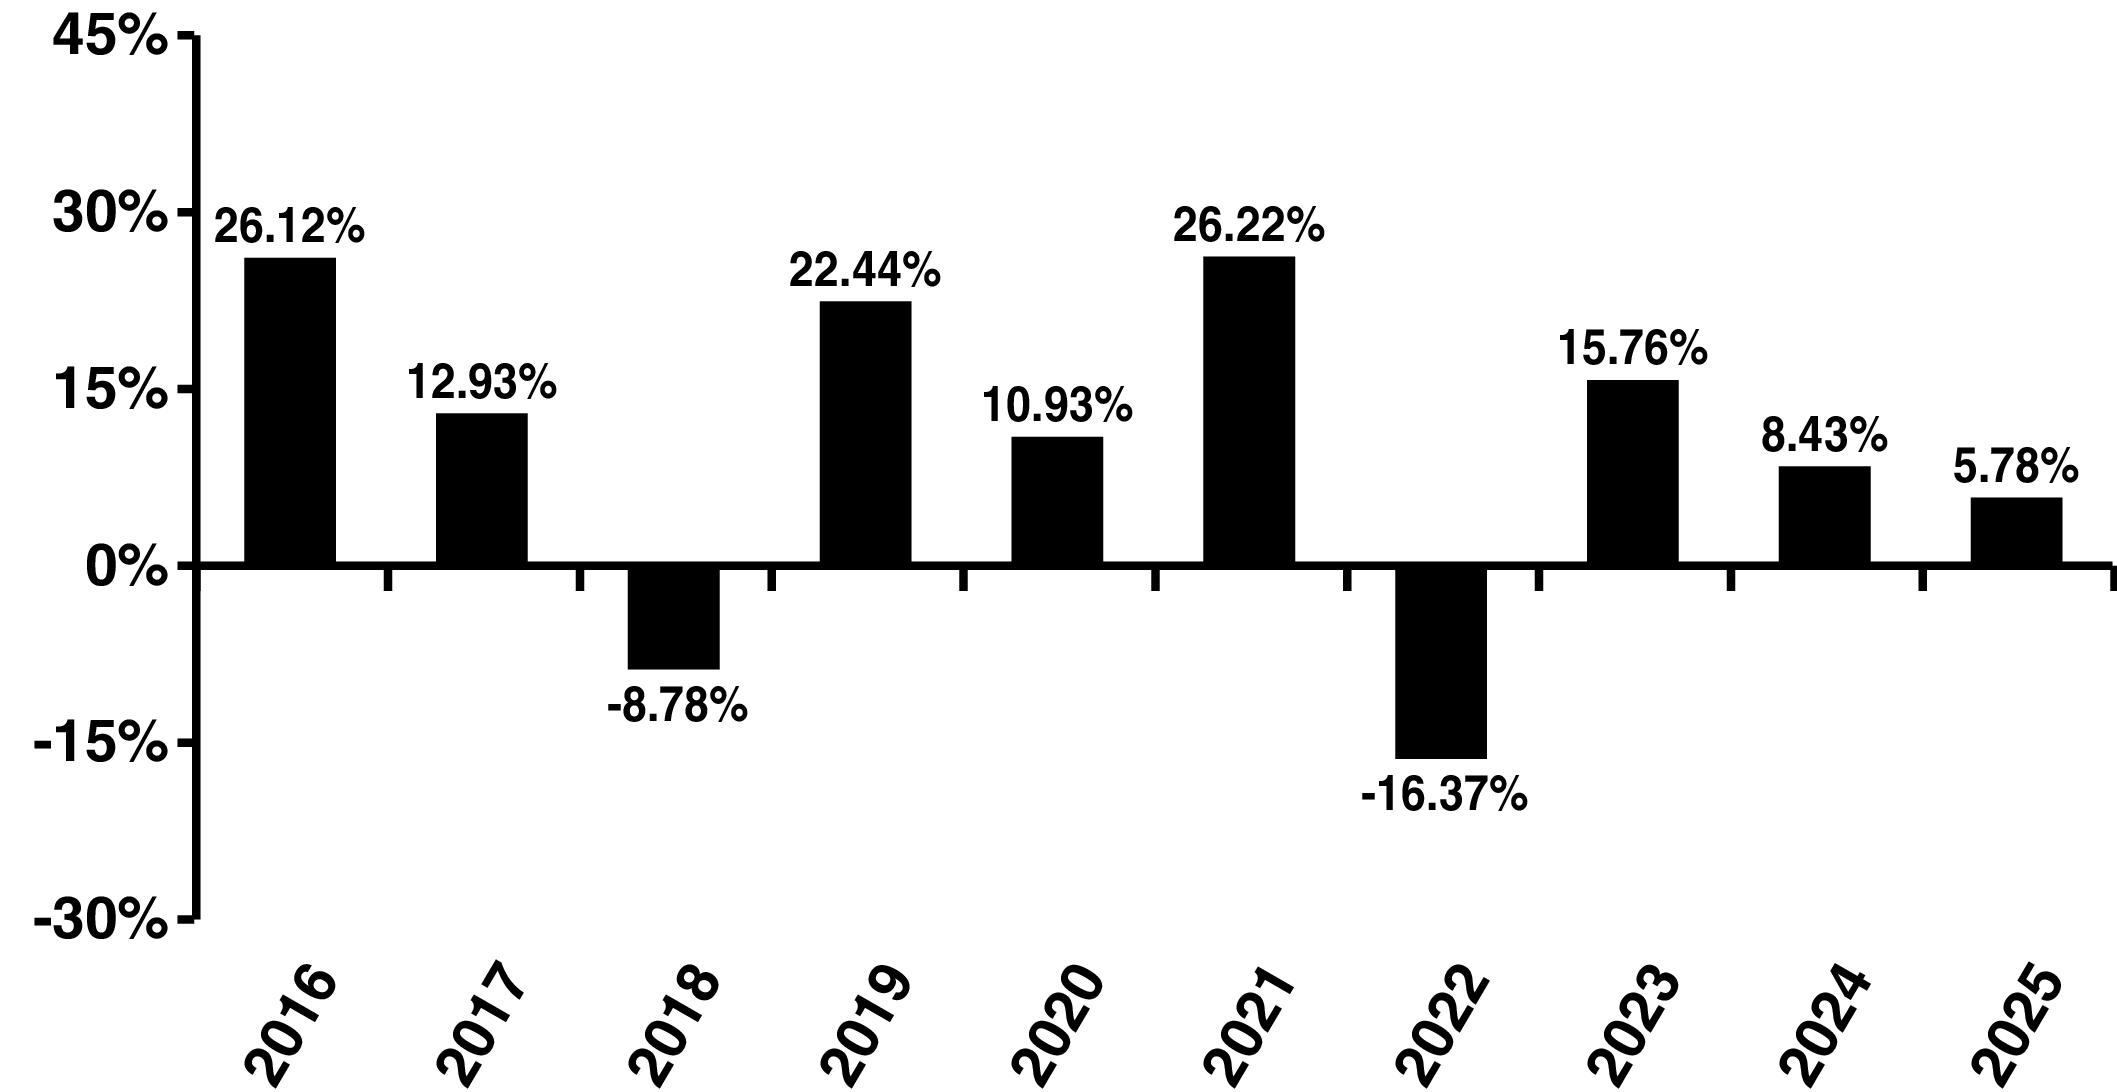
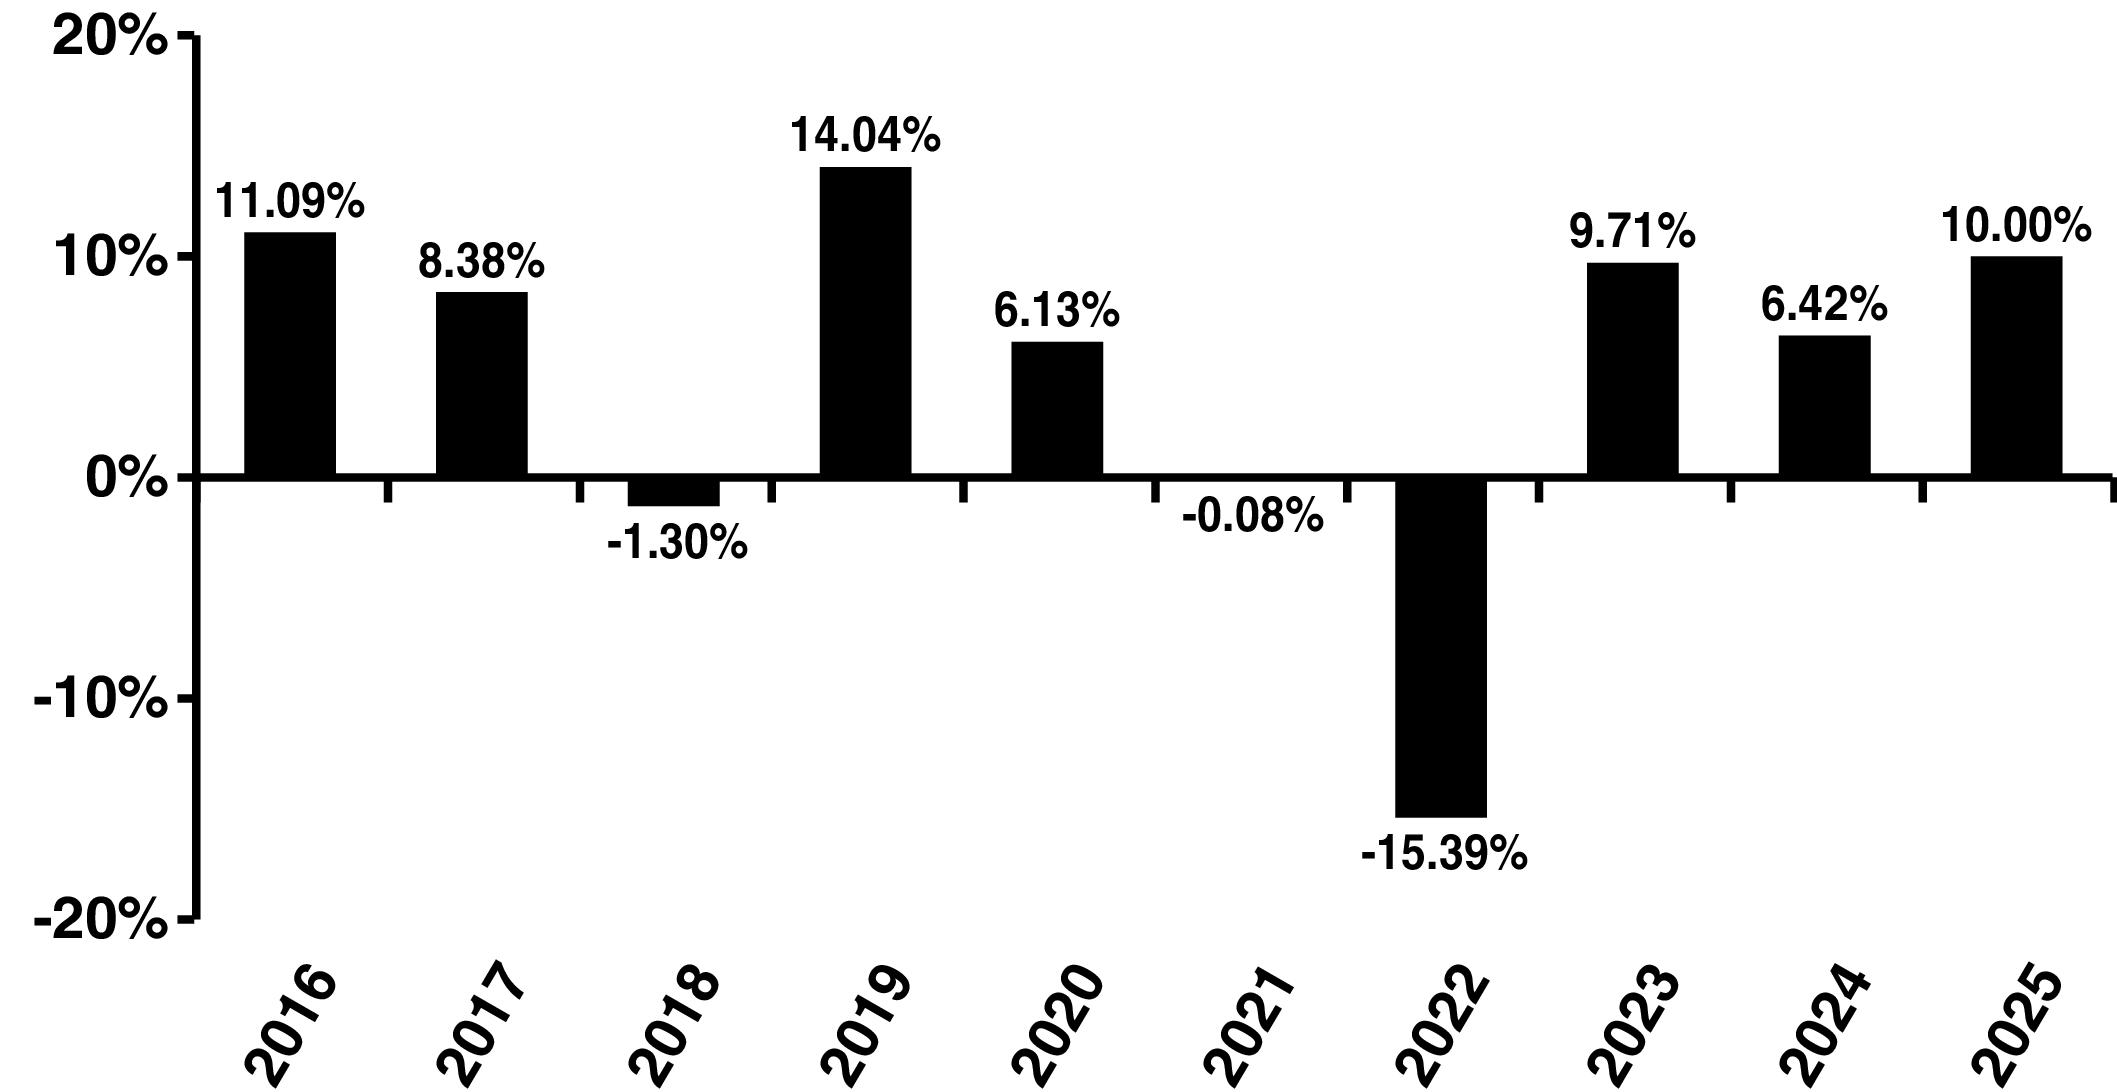
Growth Stock Portfolio – Summary
| |
|
| |
|
| Management Fee |
|
| Distribution and Service (12b-1) Fees |
|
| Other Expenses |
|
| Total Annual Portfolio Operating Expenses |
|
| Fee Waiver(1) |
|
| Total Annual Portfolio Operating Expenses After Fee Waiver(1) |
|
(1)
| 1 Year |
3 Years |
5 Years |
10 Years |
| $ |
$ |
$ |
$ |
1 Northwestern Mutual Series Fund, Inc. Prospectus
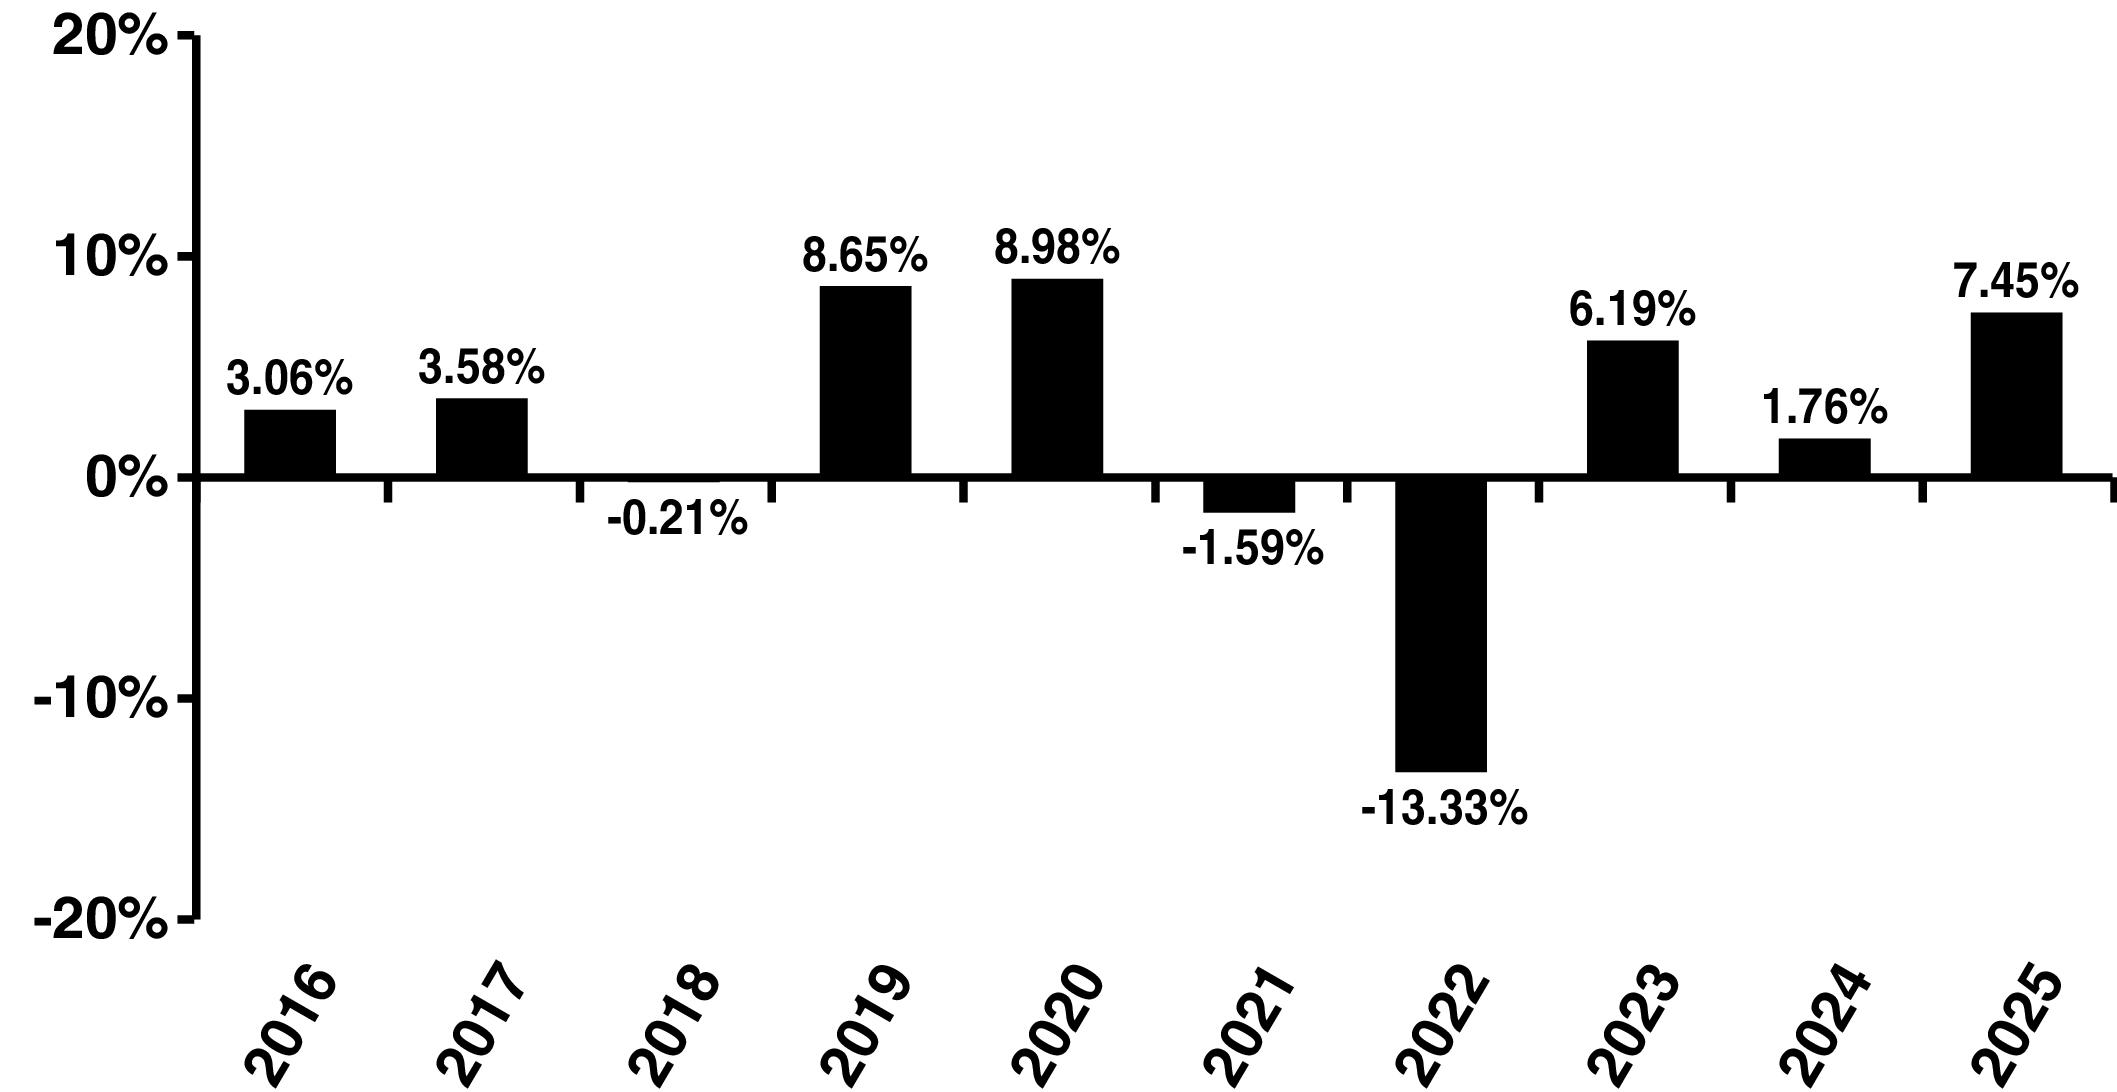
Growth Stock Portfolio – Summary
PRINCIPAL RISKS
Northwestern Mutual Series Fund, Inc. Prospectus 2
Growth Stock Portfolio – Summary
| |
|
|
| |
|
|
| |
|
|
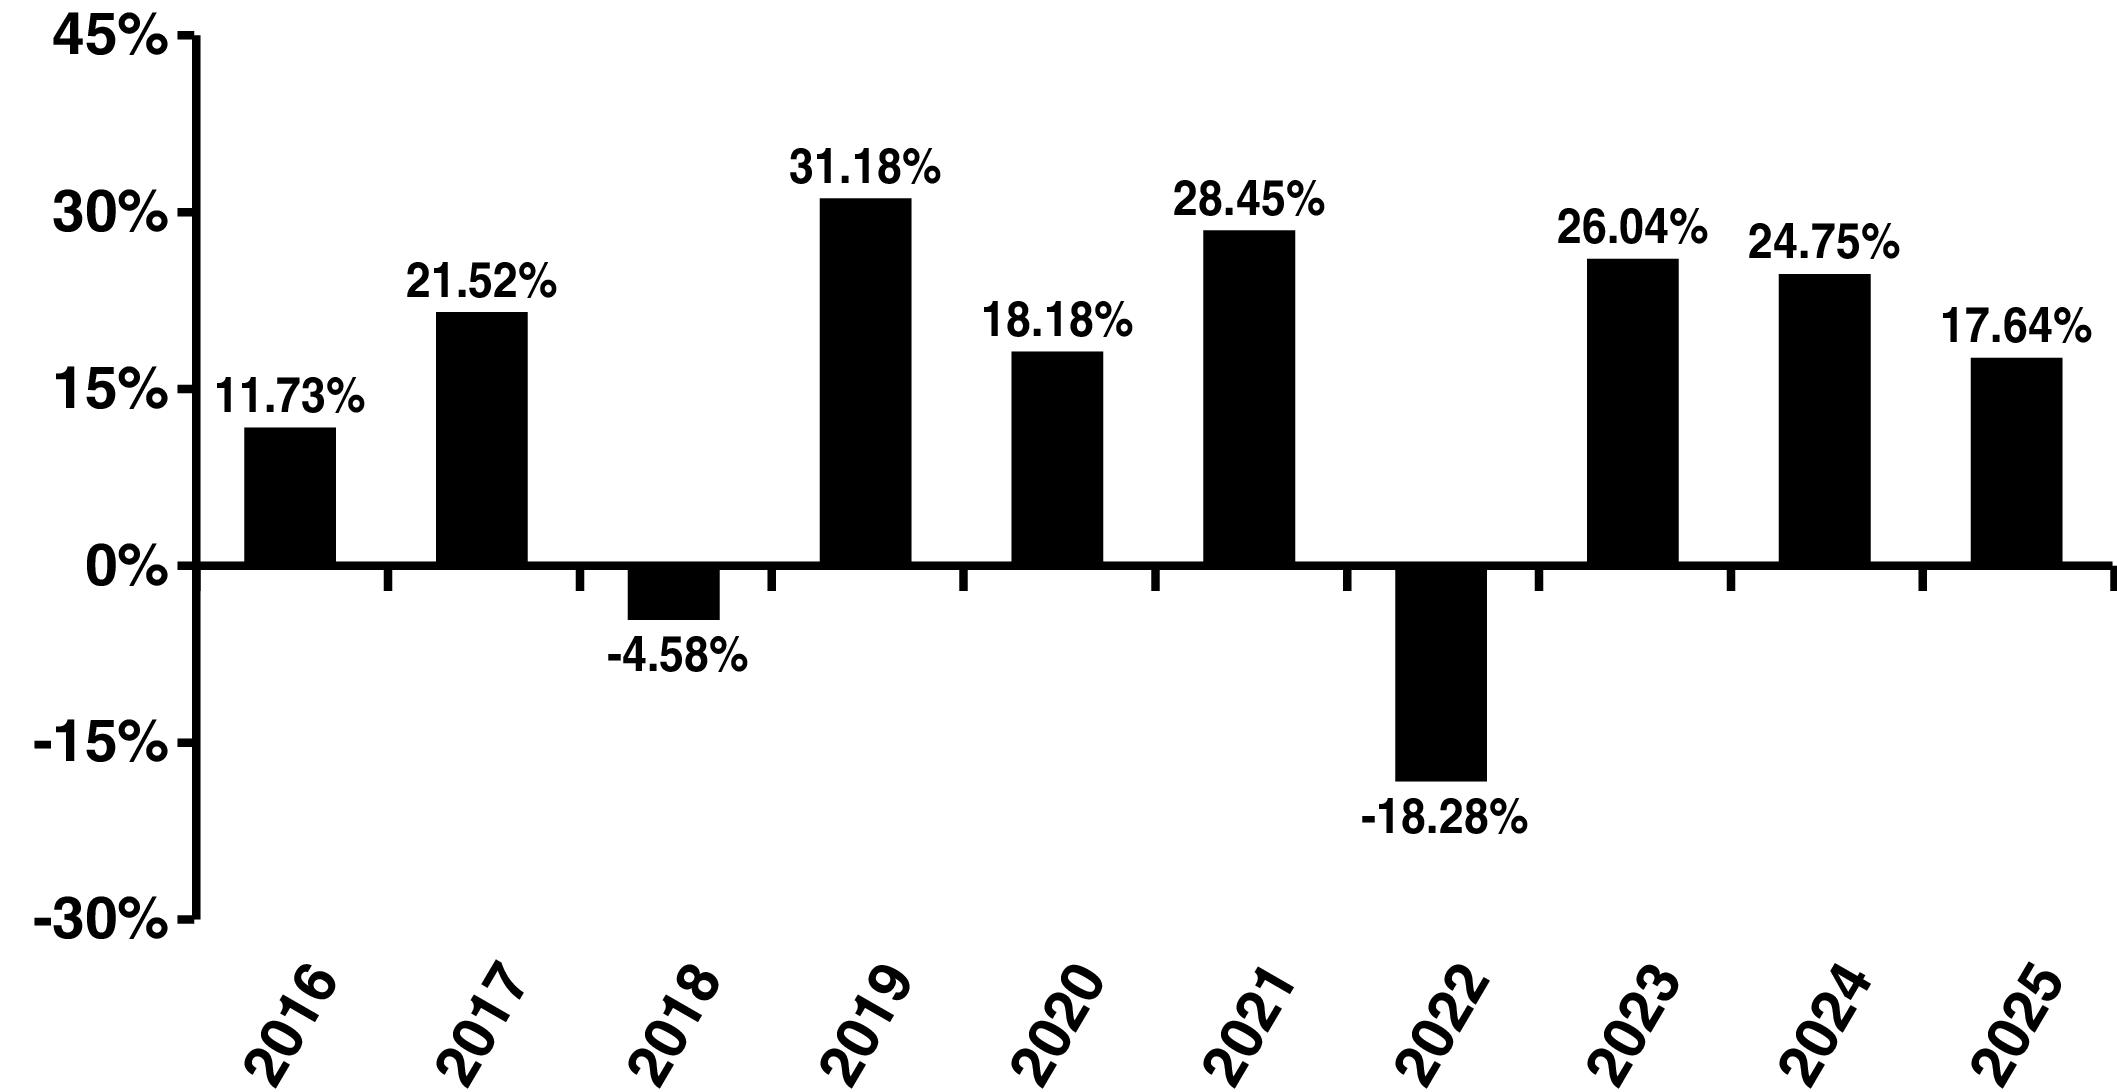
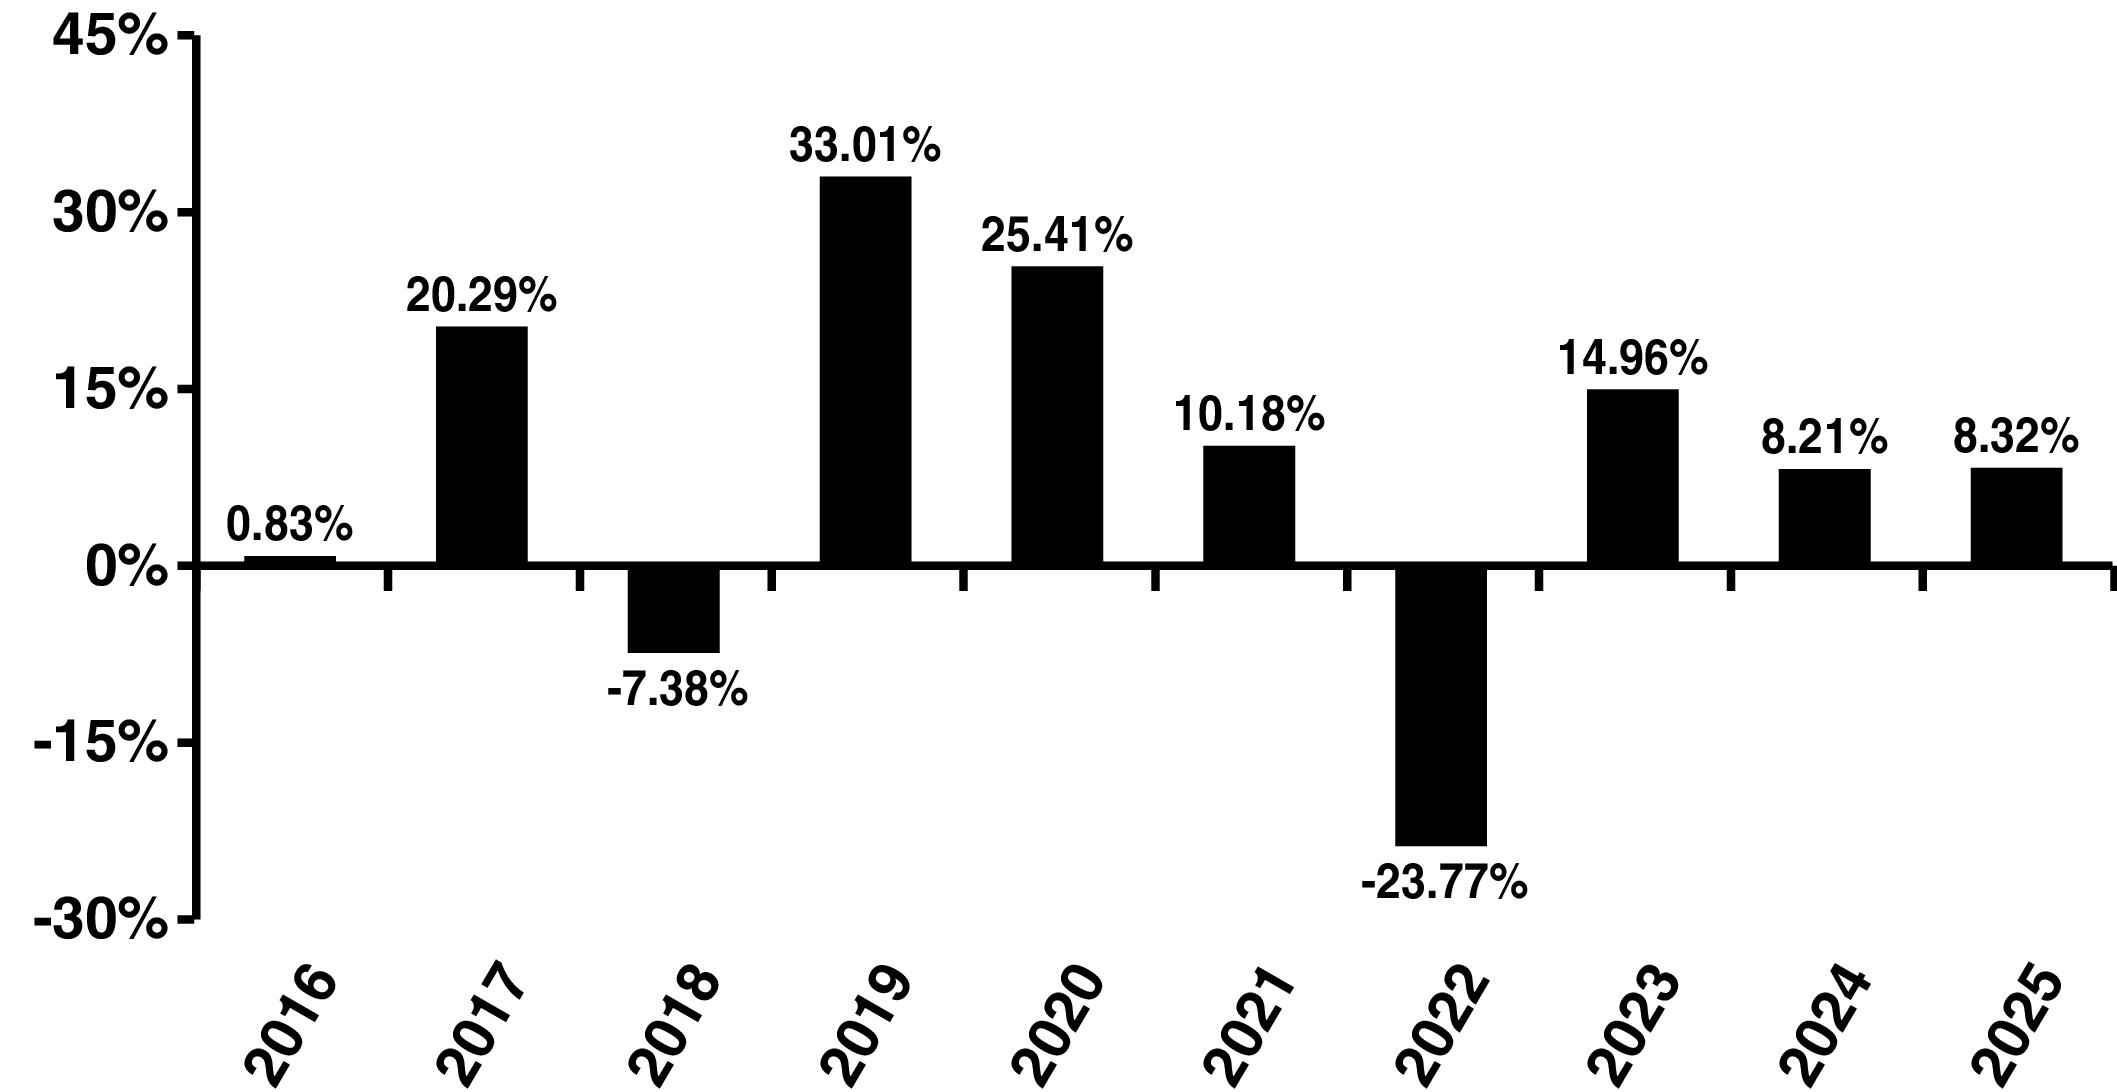
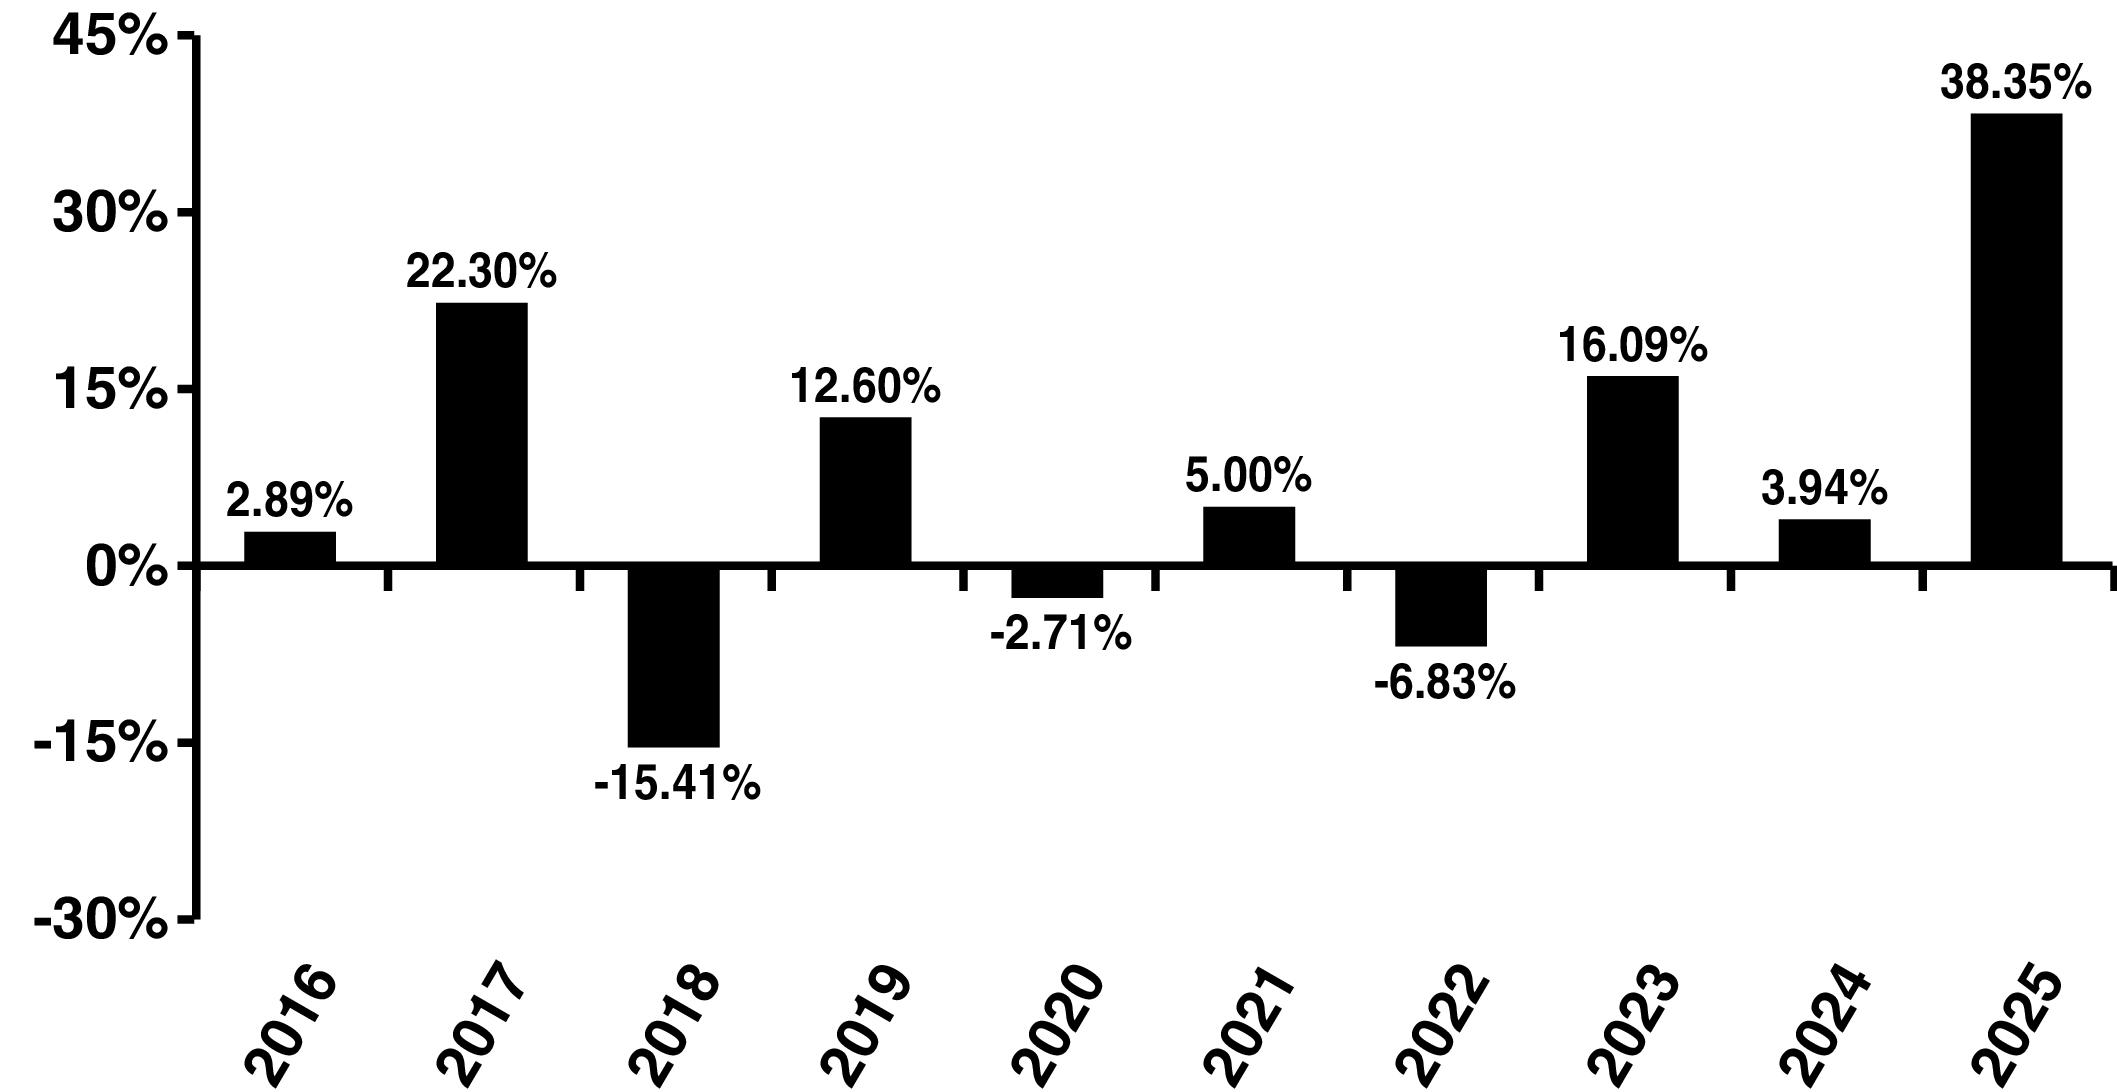
(for periods ended December 31, 2025)
| |
|
1 Yr |
5 Yr |
10 Yr |
| Portfolio: |
Growth Stock Portfolio |
|
|
|
| Strategy Index: |
Russell 1000® Growth Index (reflects no deduction for fees, expenses or taxes) |
|
|
|
| Broad-Based Index: |
S&P 500® Index (reflects no deduction for fees, expenses or taxes) |
|
|
|
PORTFOLIO MANAGEMENT
Investment Adviser: Mason Street Advisors, LLC
Sub-Adviser: T. Rowe Price Associates, Inc. (TRPA)
Portfolio Manager: Paul D. Greene II, Vice President and Associate Portfolio Manager of TRPA, joined T. Rowe Price in 2006 and has managed the Portfolio since 2020.
Sub-Adviser: T. Rowe Price Associates, Inc. (TRPA)
Portfolio Manager: Paul D. Greene II, Vice President and Associate Portfolio Manager of TRPA, joined T. Rowe Price in 2006 and has managed the Portfolio since 2020.
TAXES AND INTERMEDIARY COMPENSATION
For important information about taxes, dividends and financial intermediary compensation, please see “SUMMARY OF IMPORTANT INFORMATION REGARDING THE PORTFOLIOS” on page 123 of the Northwestern Mutual Series Fund, Inc. Prospectus.
3 Northwestern Mutual Series Fund, Inc. Prospectus
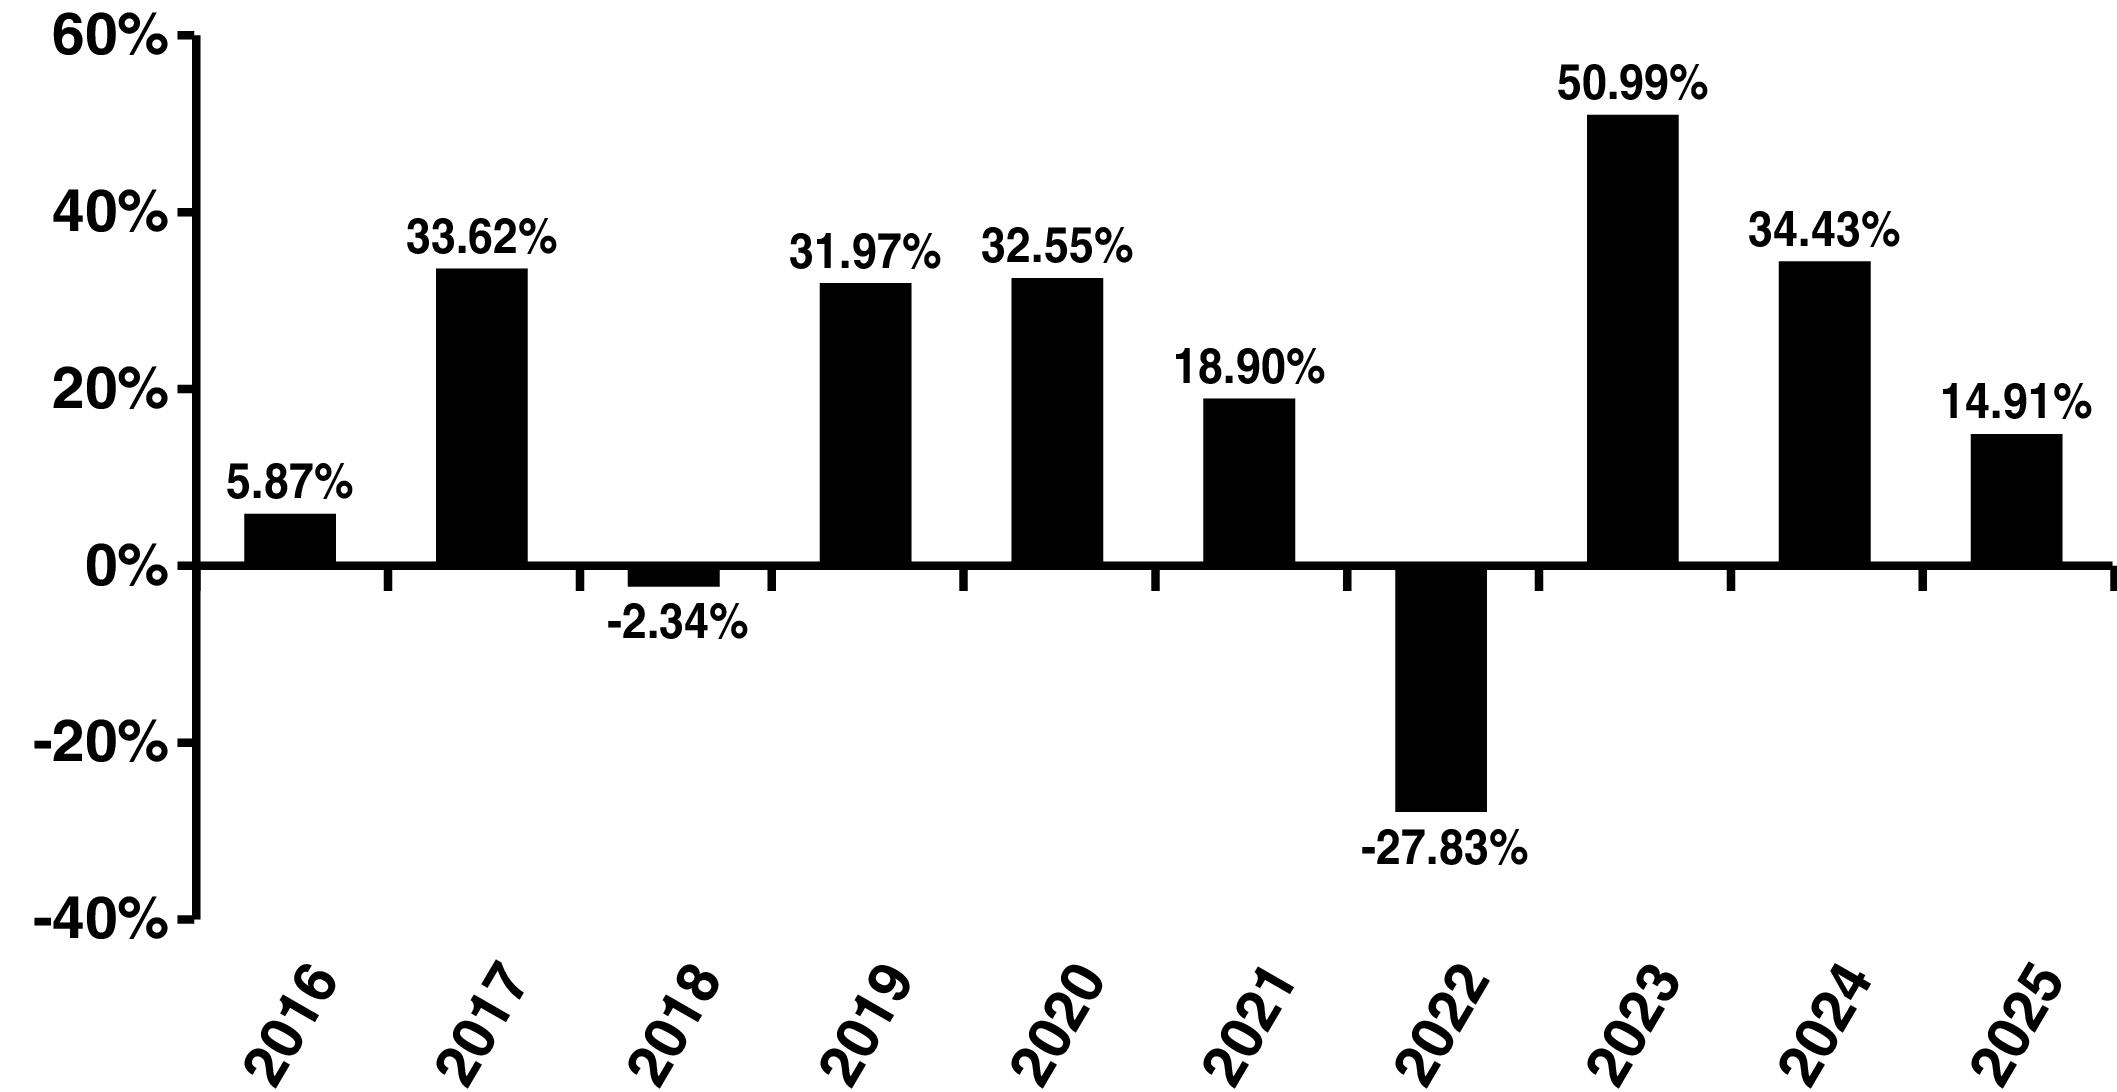
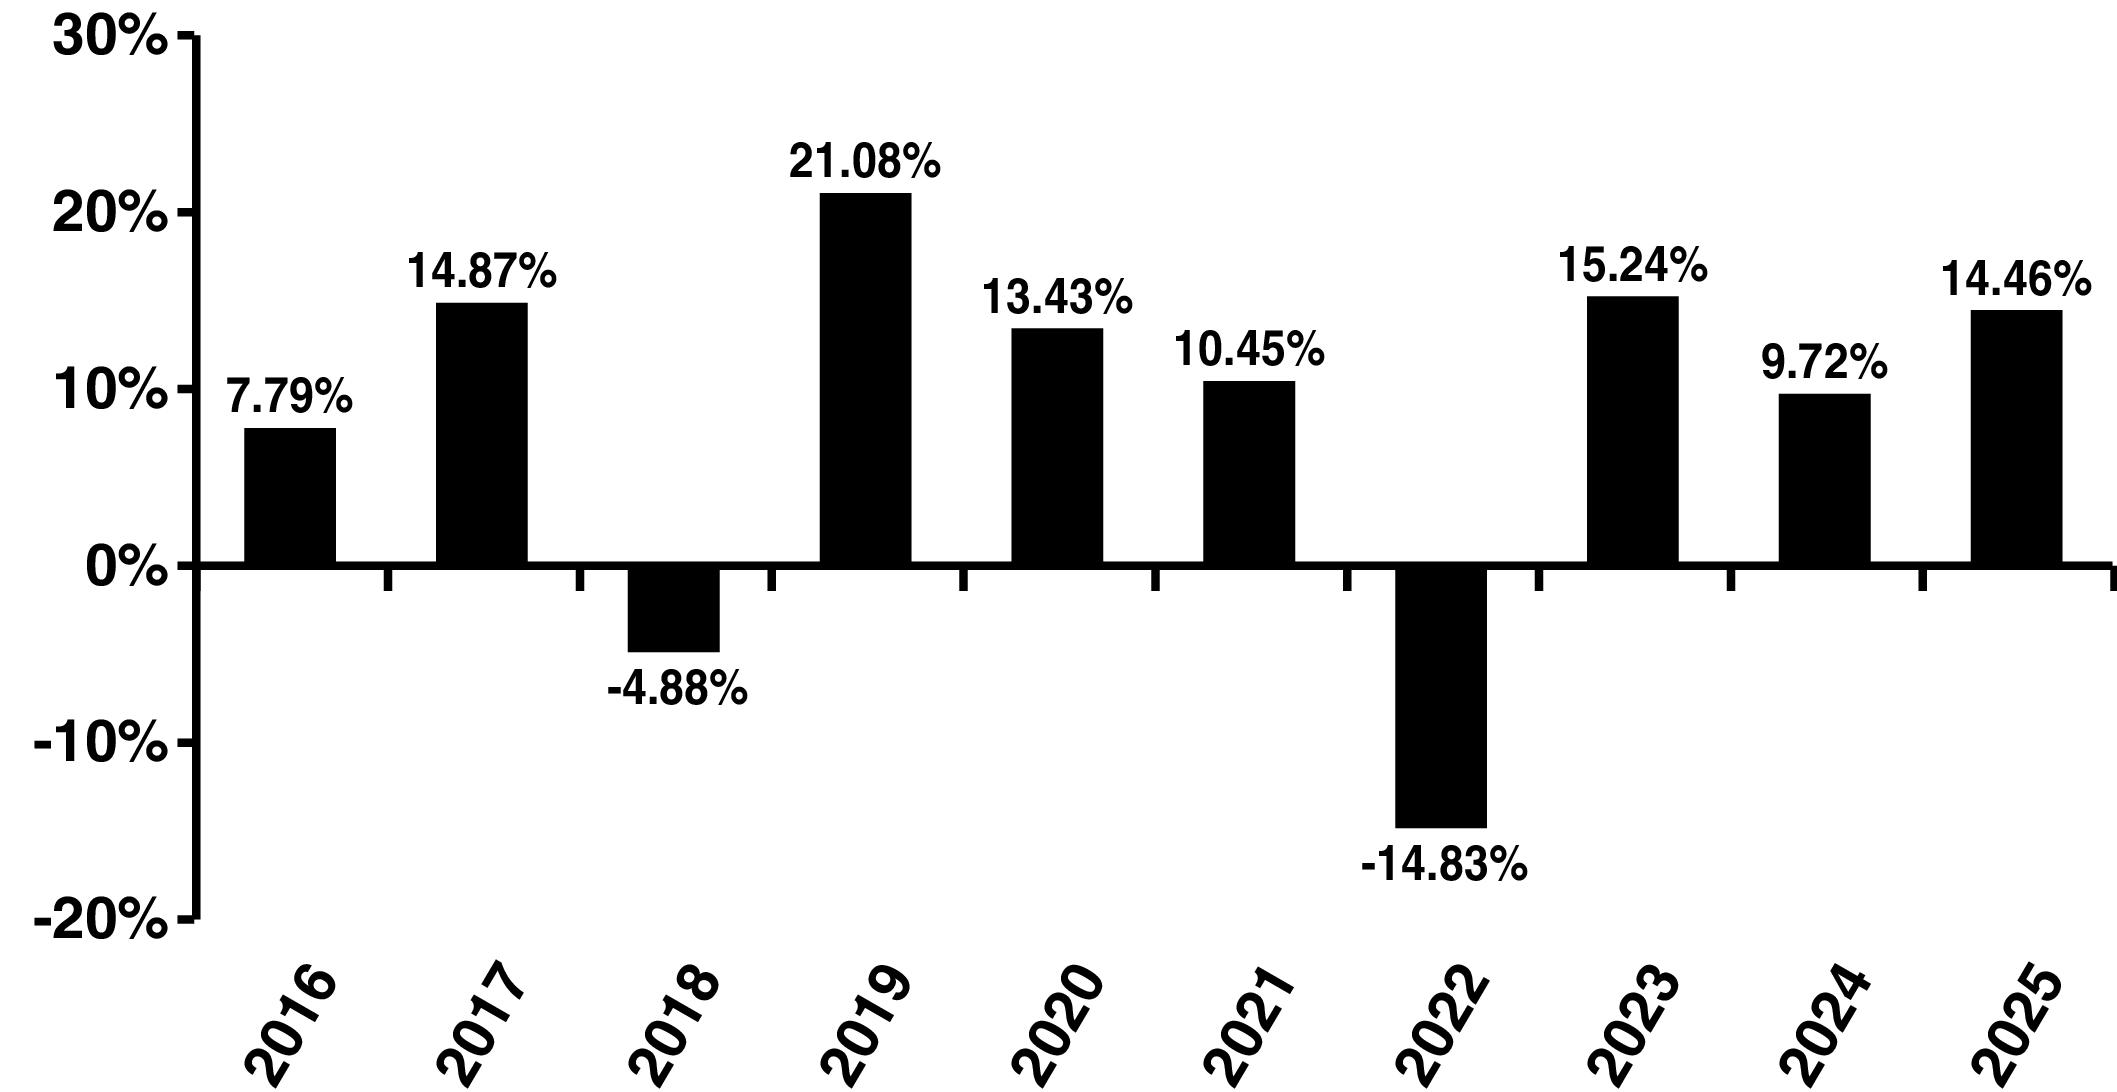
Focused Appreciation Portfolio – Summary
| |
|
| |
|
| Management Fee |
|
| Distribution and Service (12b-1) Fees |
|
| Other Expenses |
|
| Total Annual Portfolio Operating Expenses |
|
| Fee Waiver(1),(2) |
( |
| Total Annual Portfolio Operating Expenses After Fee Waiver(1),(2) |
|
(1)
(2)
| 1 Year |
3 Years |
5 Years |
10 Years |
| $ |
$ |
$ |
$ |
Northwestern Mutual Series Fund, Inc. Prospectus 4
Focused Appreciation Portfolio – Summary
PRINCIPAL RISKS
5 Northwestern Mutual Series Fund, Inc. Prospectus
Focused Appreciation Portfolio – Summary
| |
|
|
| |
|
|
| |
|
|
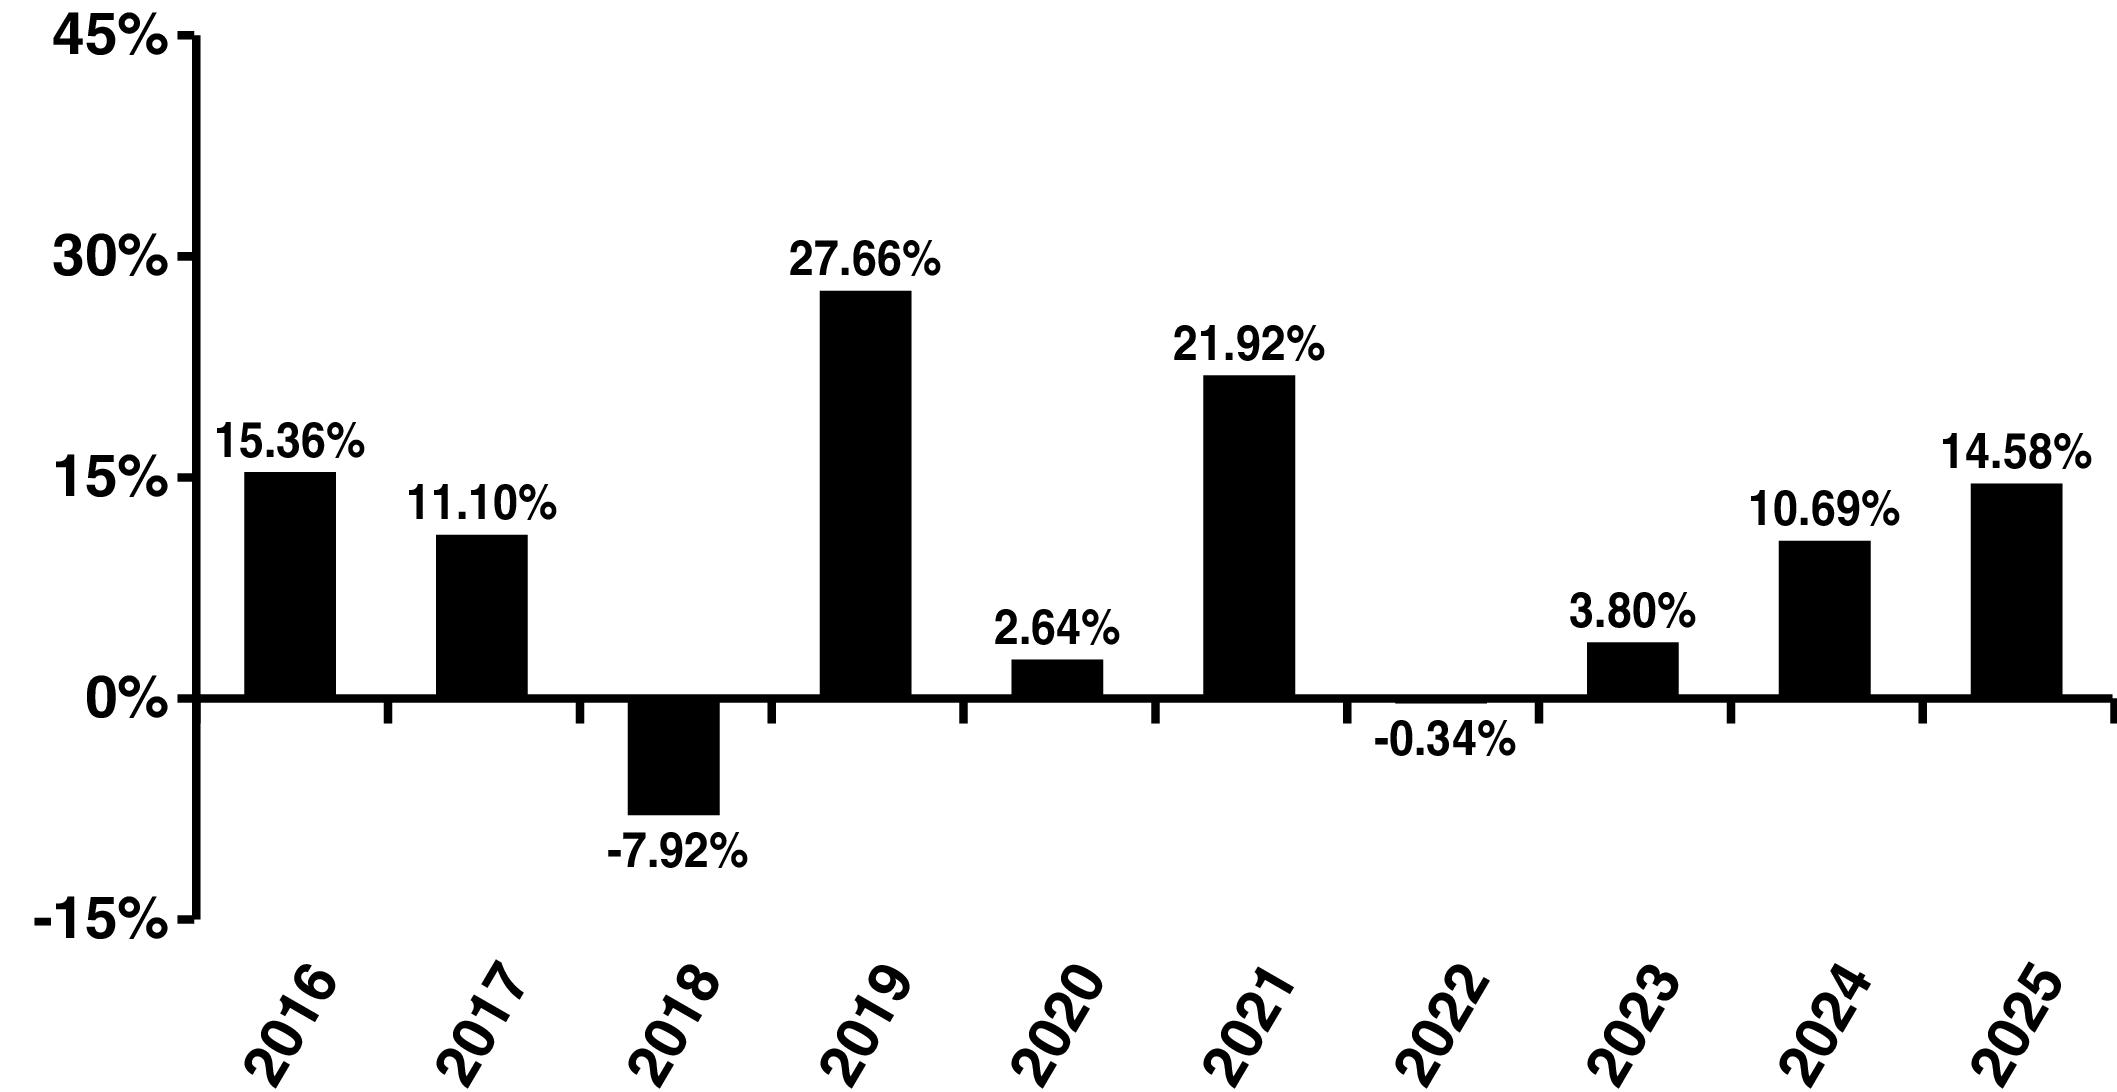
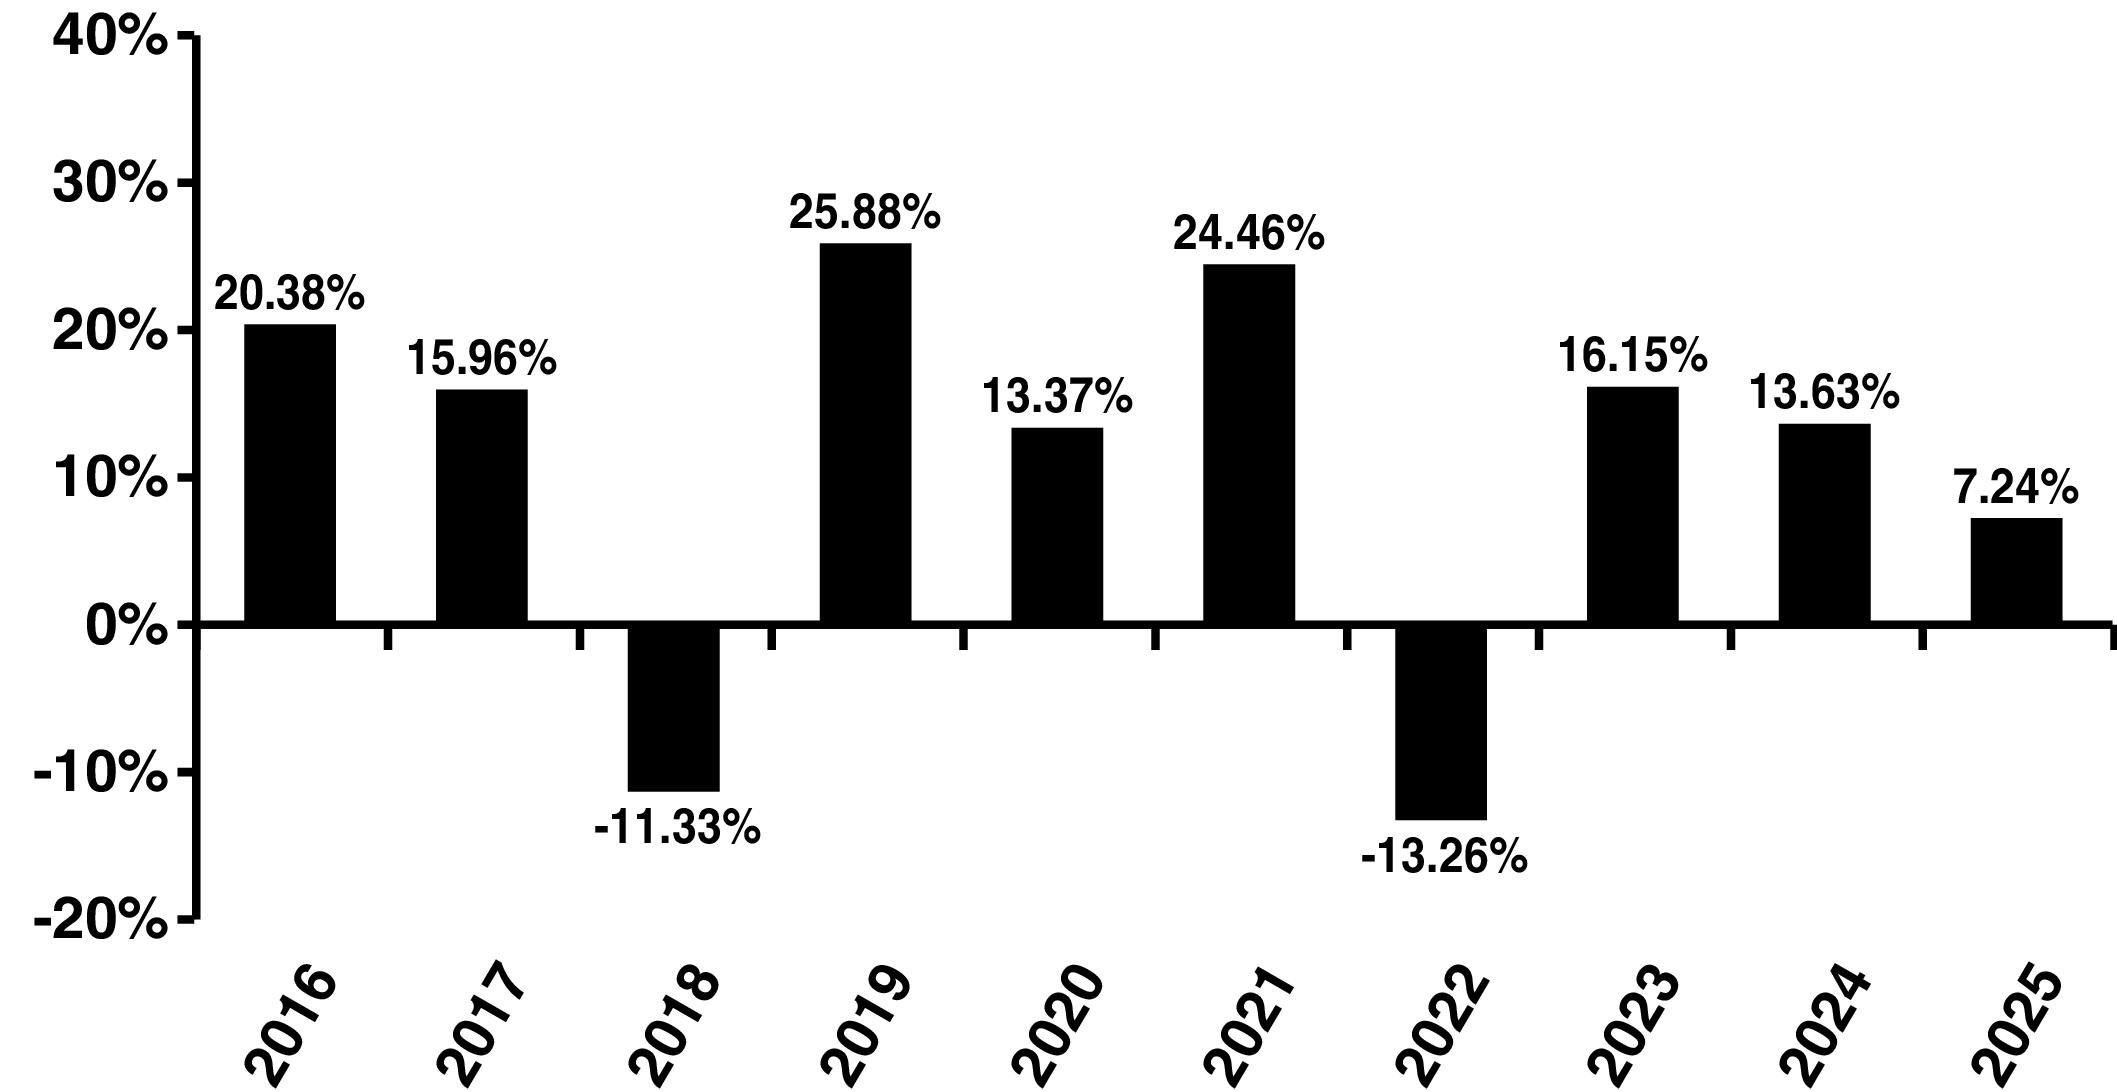
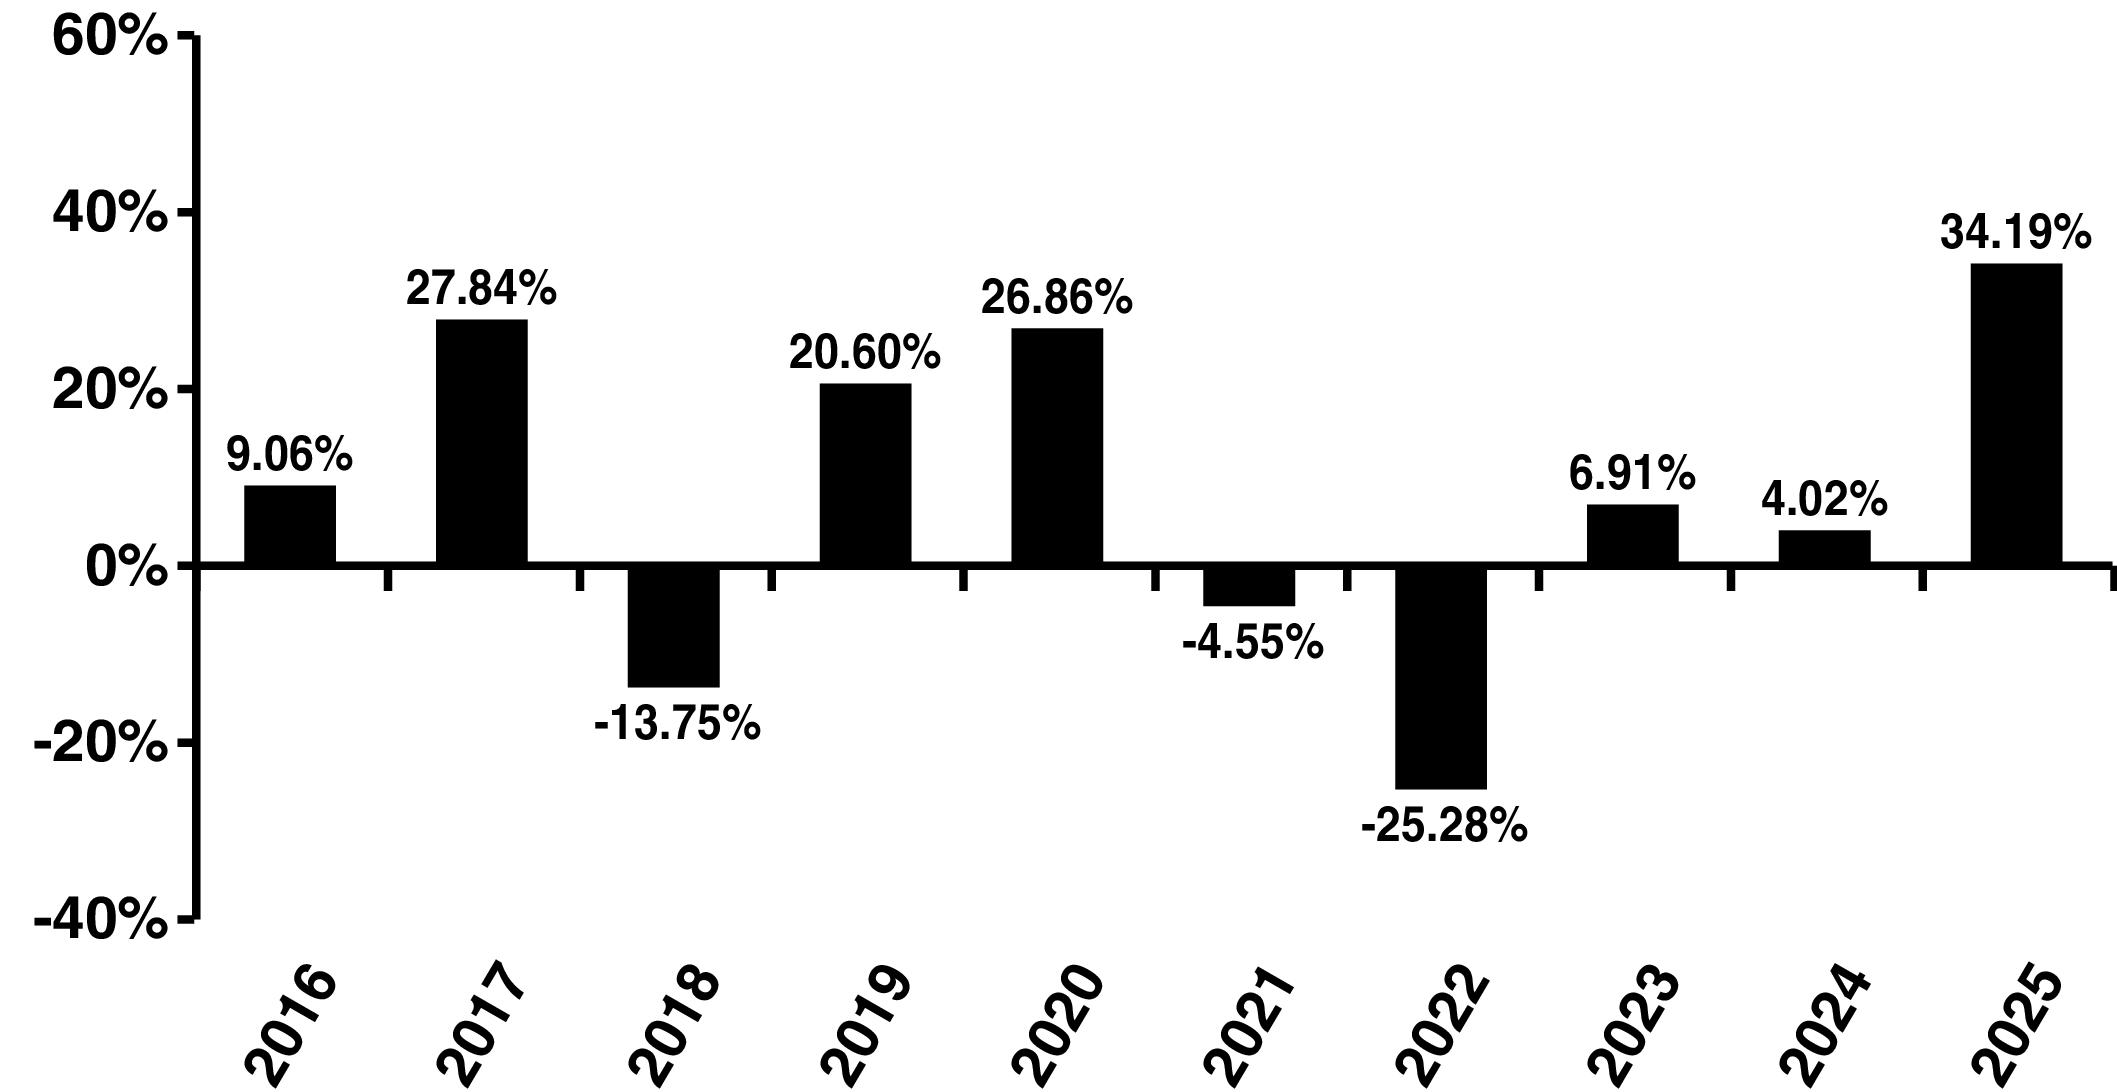
(for periods ended December 31, 2025)
| |
|
1 Yr |
5 Yr |
10 Yr |
| Portfolio: |
Focused Appreciation Portfolio |
|
|
|
| Strategy Index: |
Russell 1000® Growth Index (reflects no deduction for fees, expenses or taxes) |
|
|
|
| Broad-Based Index: |
S&P 500® Index (reflects no deduction for fees, expenses or taxes) |
|
|
|
Northwestern Mutual Series Fund, Inc. Prospectus 6
Focused Appreciation Portfolio – Summary
PORTFOLIO MANAGEMENT
Investment Adviser: Mason Street Advisors, LLC
Sub-Adviser: Loomis, Sayles & Company, L.P. (Loomis Sayles)
Portfolio Manager: Aziz V. Hamzaogullari, CFA, Executive Vice President of Loomis Sayles, joined Loomis Sayles in 2010 and has managed the Portfolio since 2015.
Sub-Adviser: Loomis, Sayles & Company, L.P. (Loomis Sayles)
Portfolio Manager: Aziz V. Hamzaogullari, CFA, Executive Vice President of Loomis Sayles, joined Loomis Sayles in 2010 and has managed the Portfolio since 2015.
TAXES AND INTERMEDIARY COMPENSATION
For important information about taxes, dividends and financial intermediary compensation, please see “SUMMARY OF IMPORTANT INFORMATION REGARDING THE PORTFOLIOS” on page 123 of the Northwestern Mutual Series Fund, Inc. Prospectus.
7 Northwestern Mutual Series Fund, Inc. Prospectus
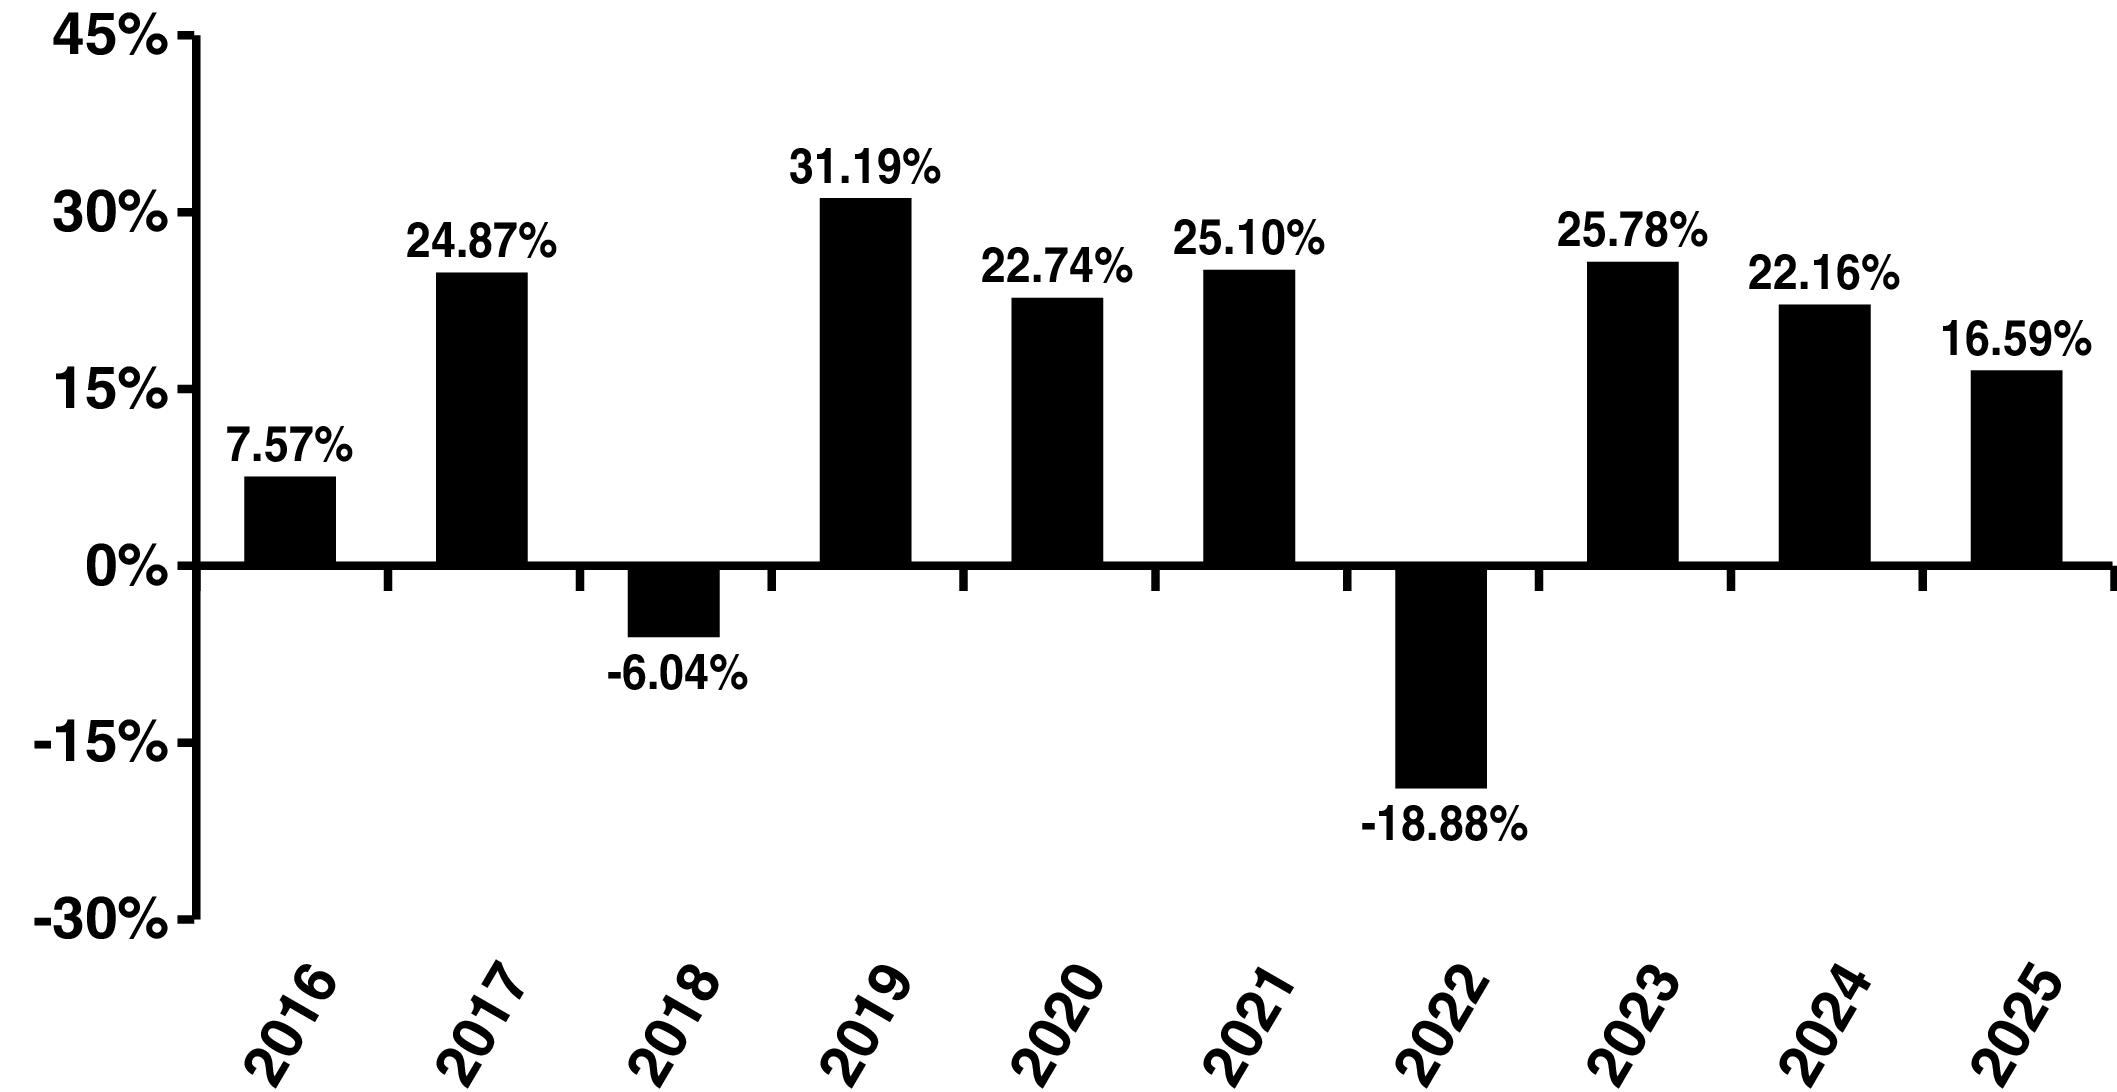
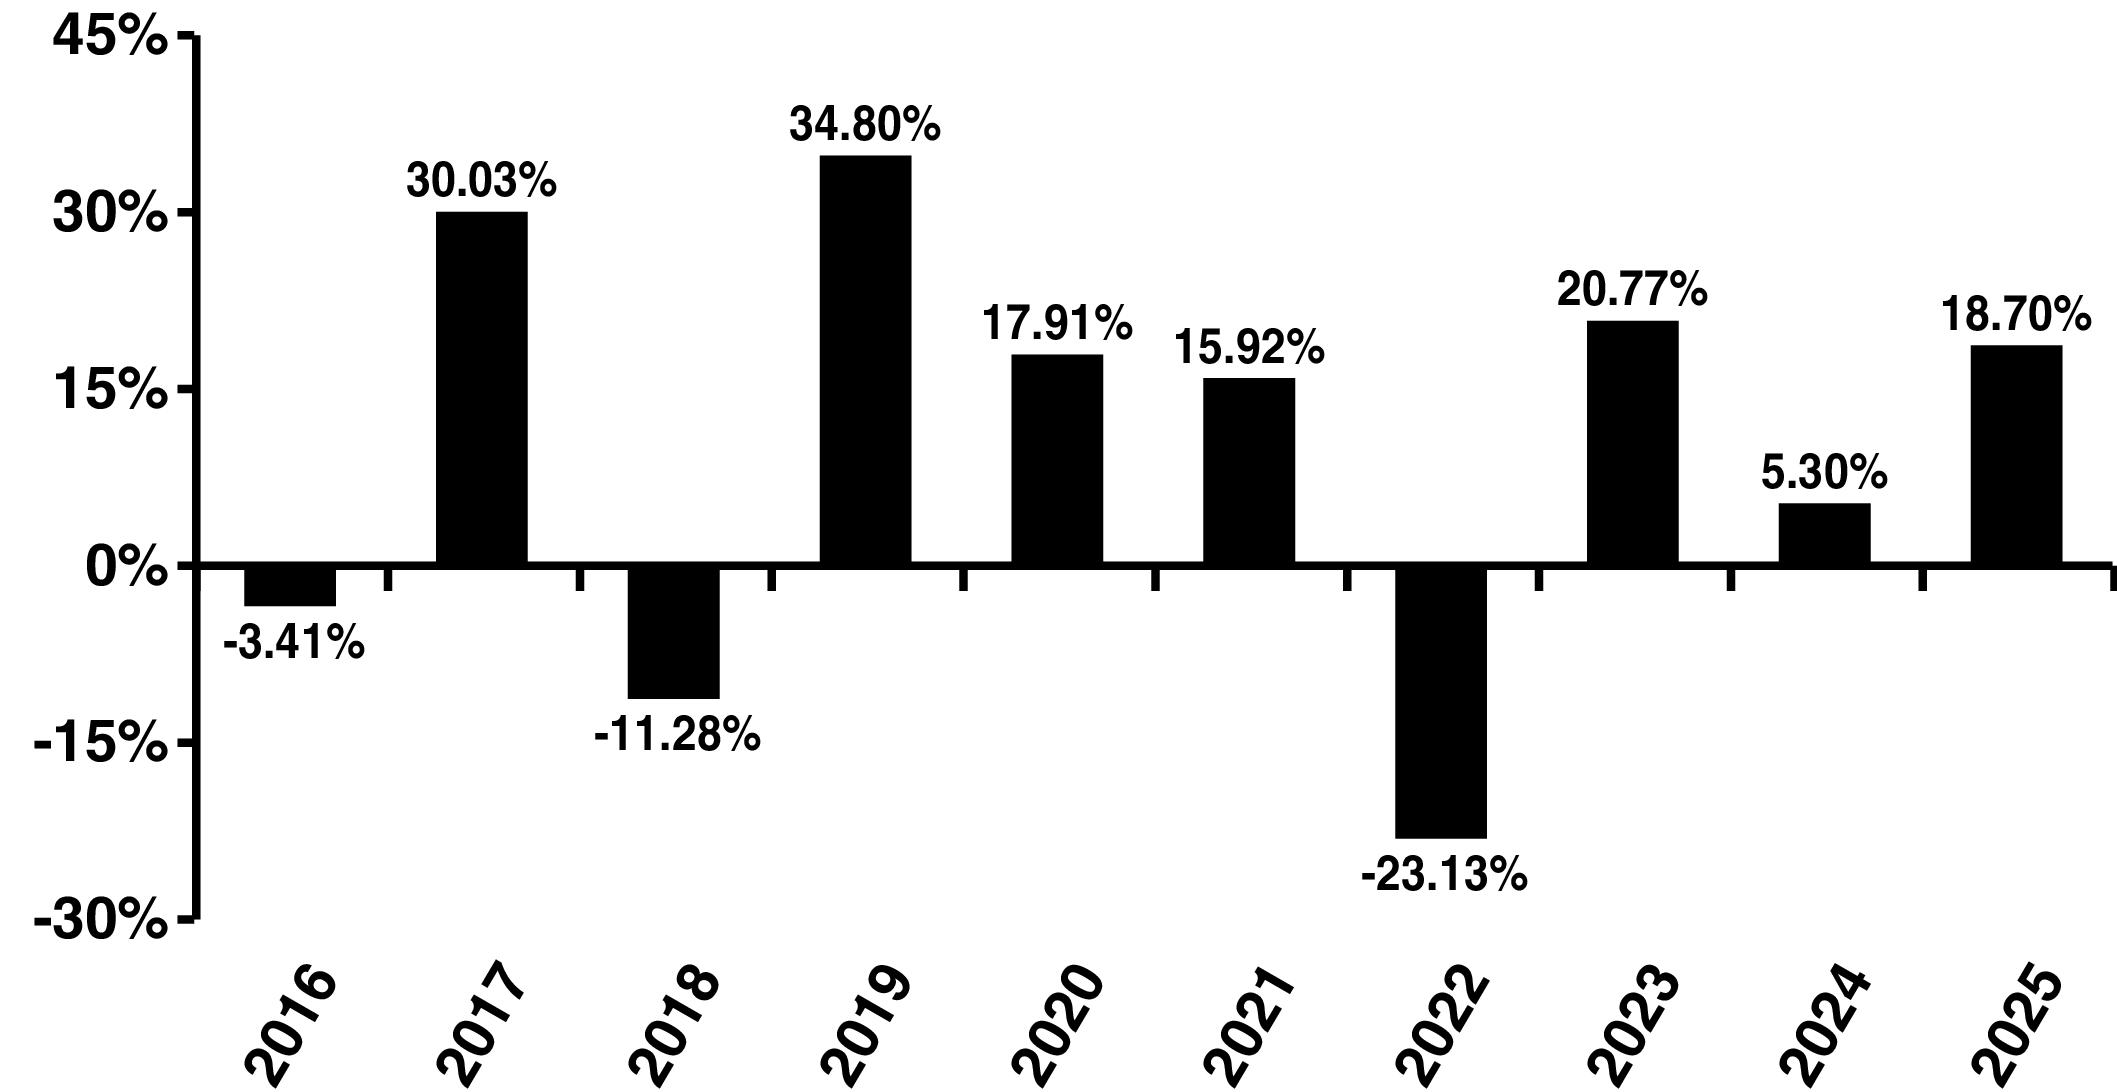
Large Cap Core Stock Portfolio – Summary
| |
|
| |
|
| Management Fee |
|
| Distribution and Service (12b-1) Fees |
|
| Other Expenses(1) |
|
| Total Annual Portfolio Operating Expenses(1) |
|
| Fee Waiver(2) |
( |
| Total Annual Portfolio Operating Expenses After Fee Waiver(1),(2) |
|
(1)
(2)
| 1 Year |
3 Years |
5 Years |
10 Years |
| $ |
$ |
$ |
$ |
Northwestern Mutual Series Fund, Inc. Prospectus 8
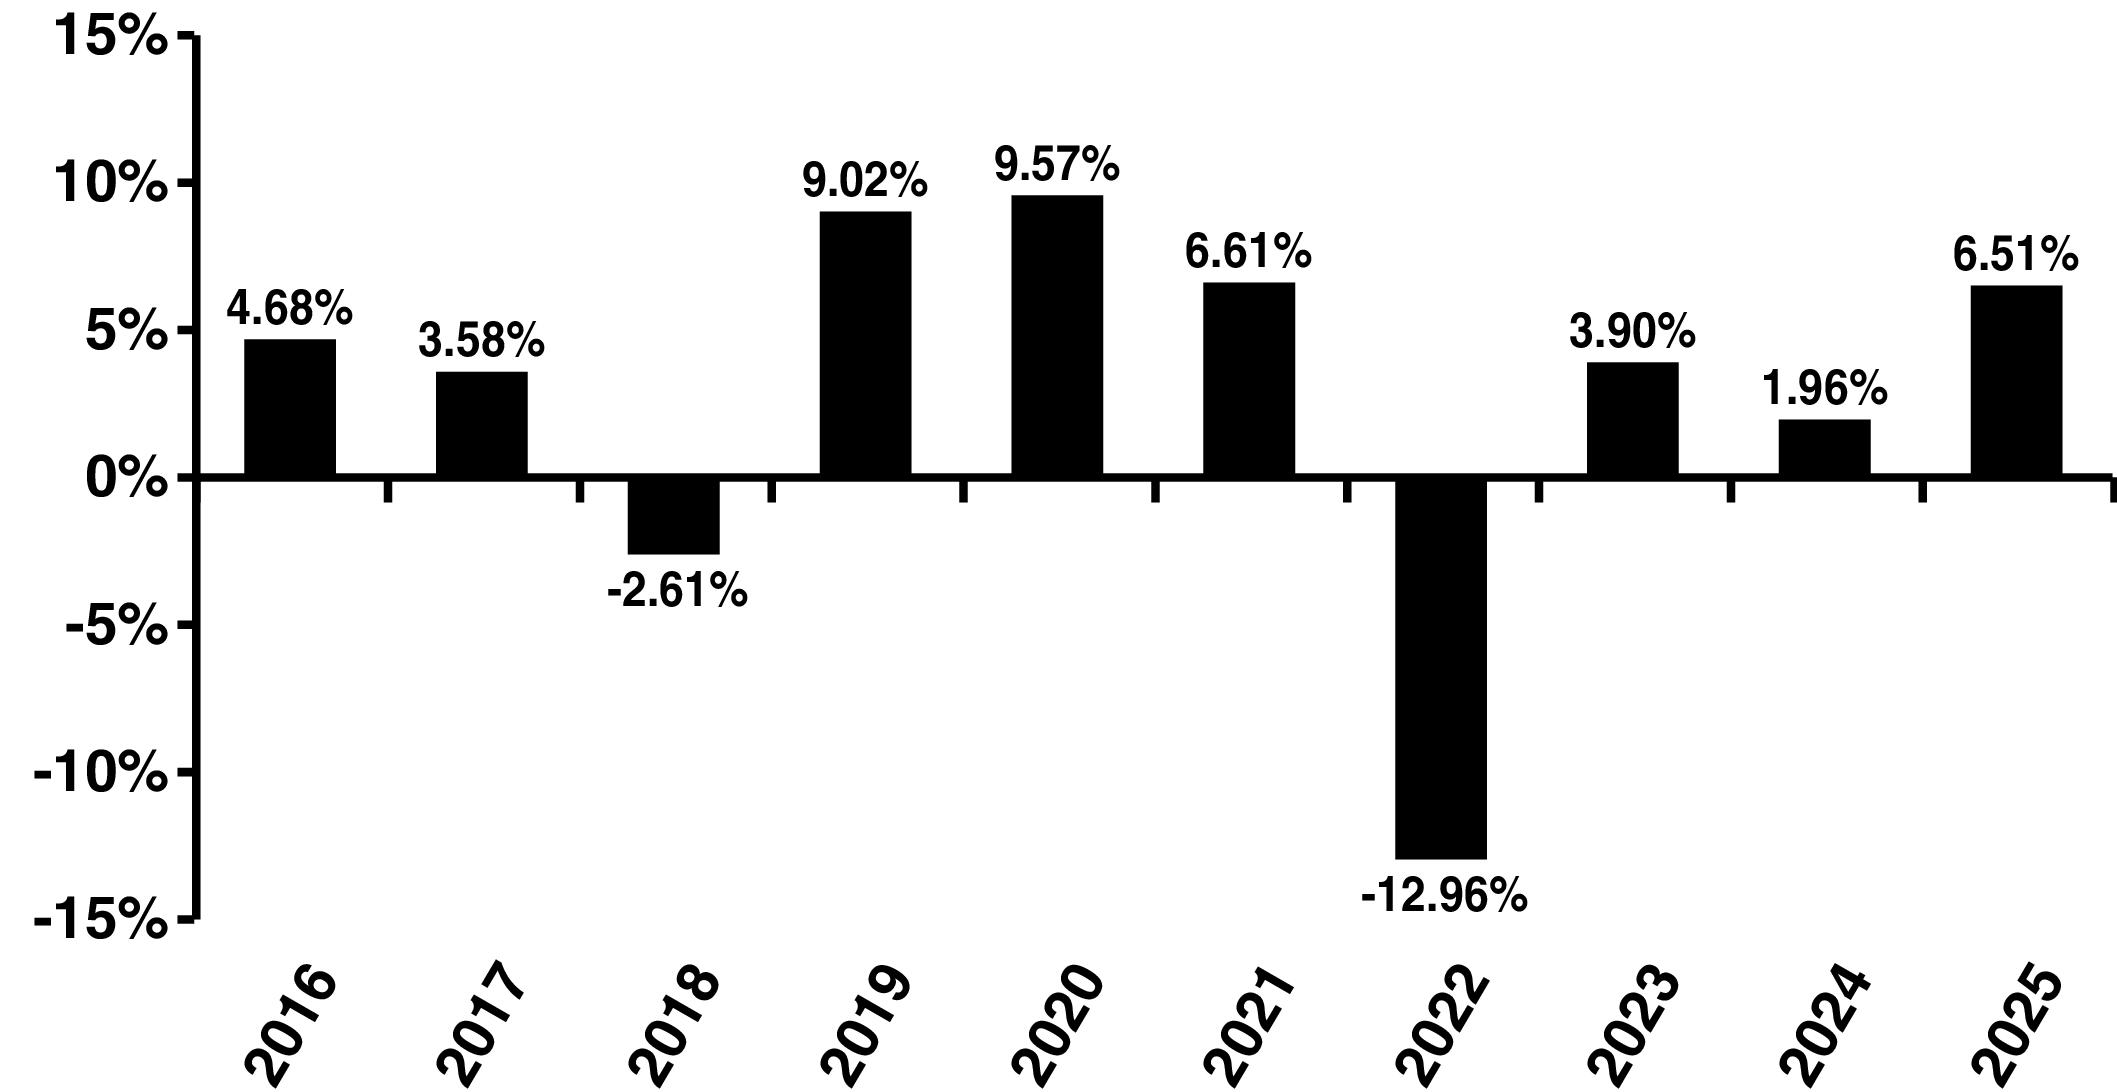
Large Cap Core Stock Portfolio – Summary
PRINCIPAL RISKS
9 Northwestern Mutual Series Fund, Inc. Prospectus
Large Cap Core Stock Portfolio – Summary
| |
|
|
| |
|
|
| |
|
|
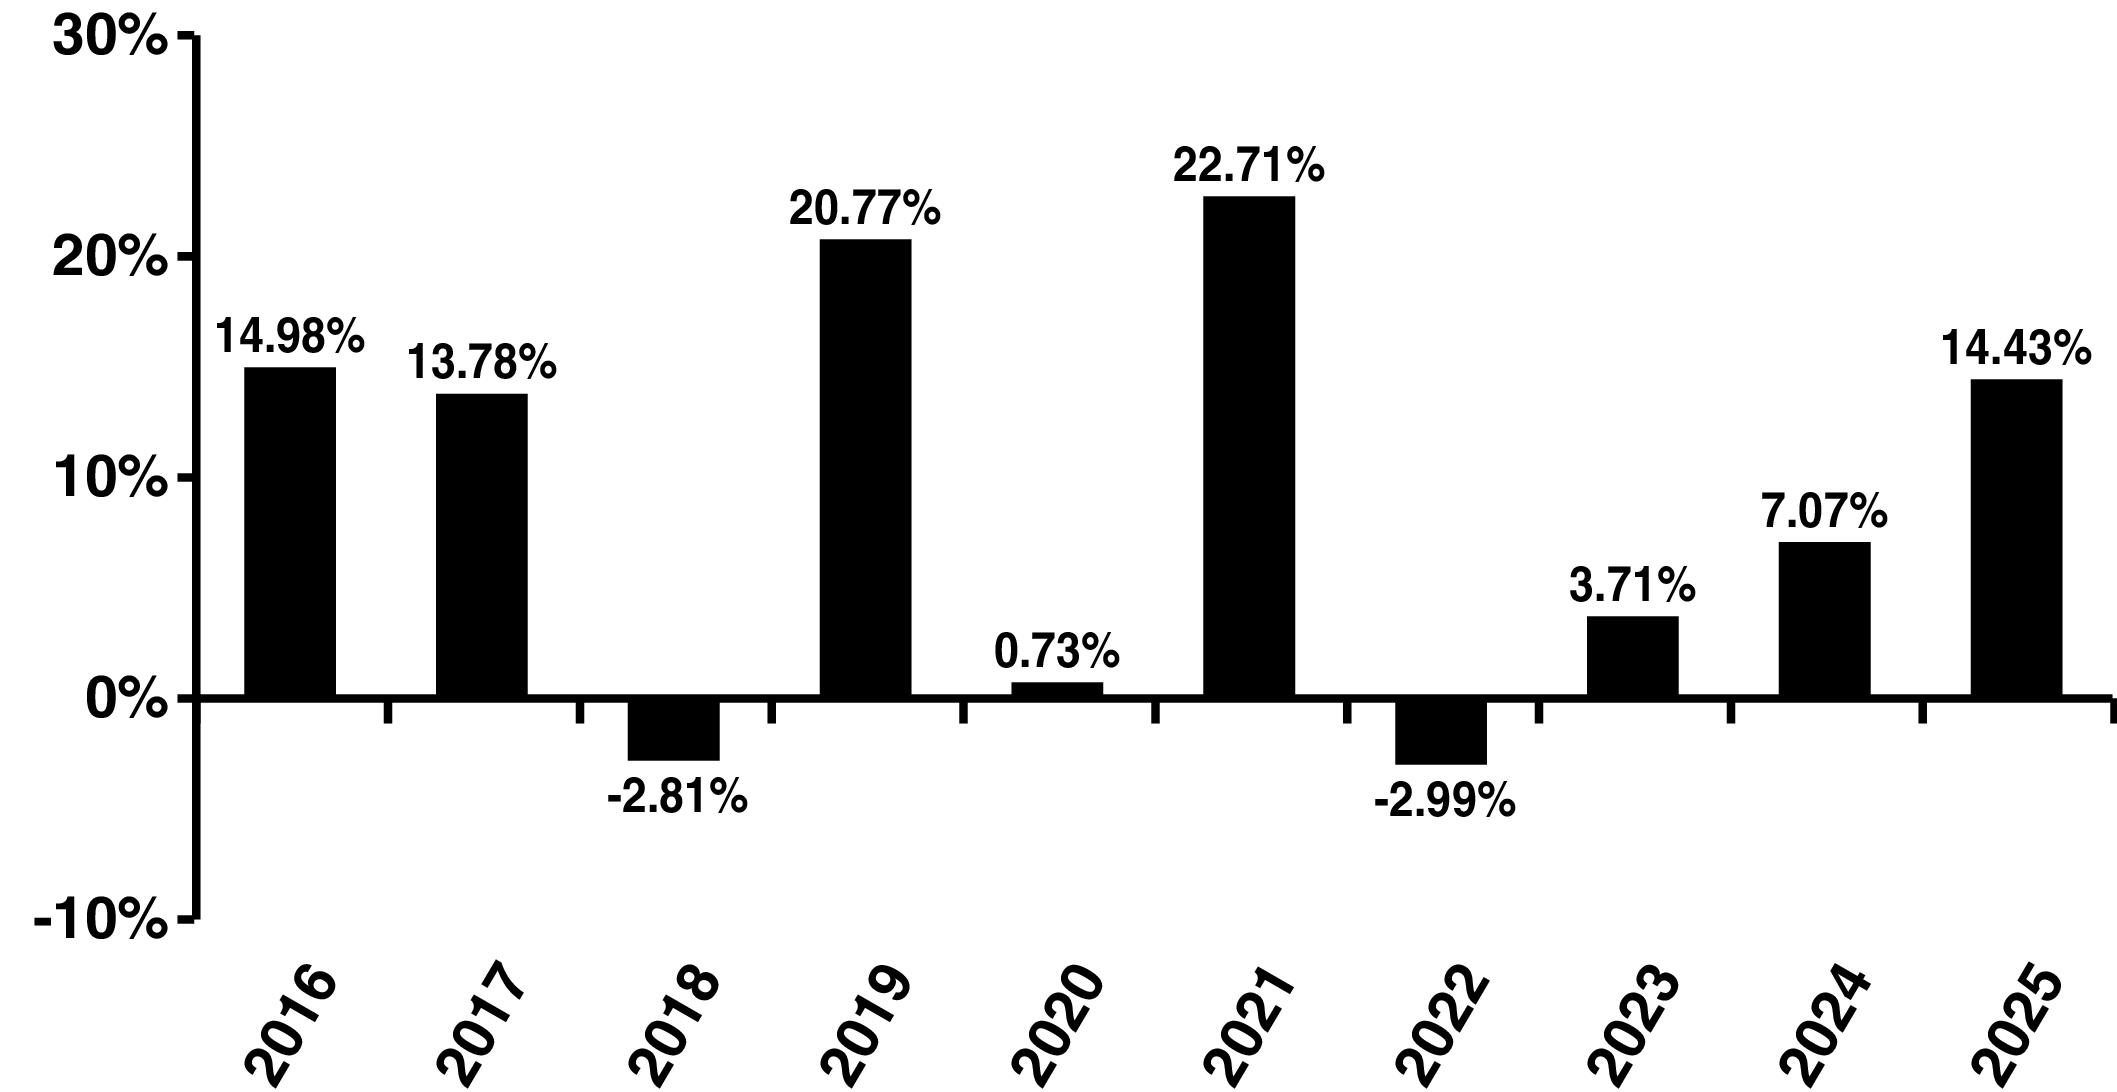
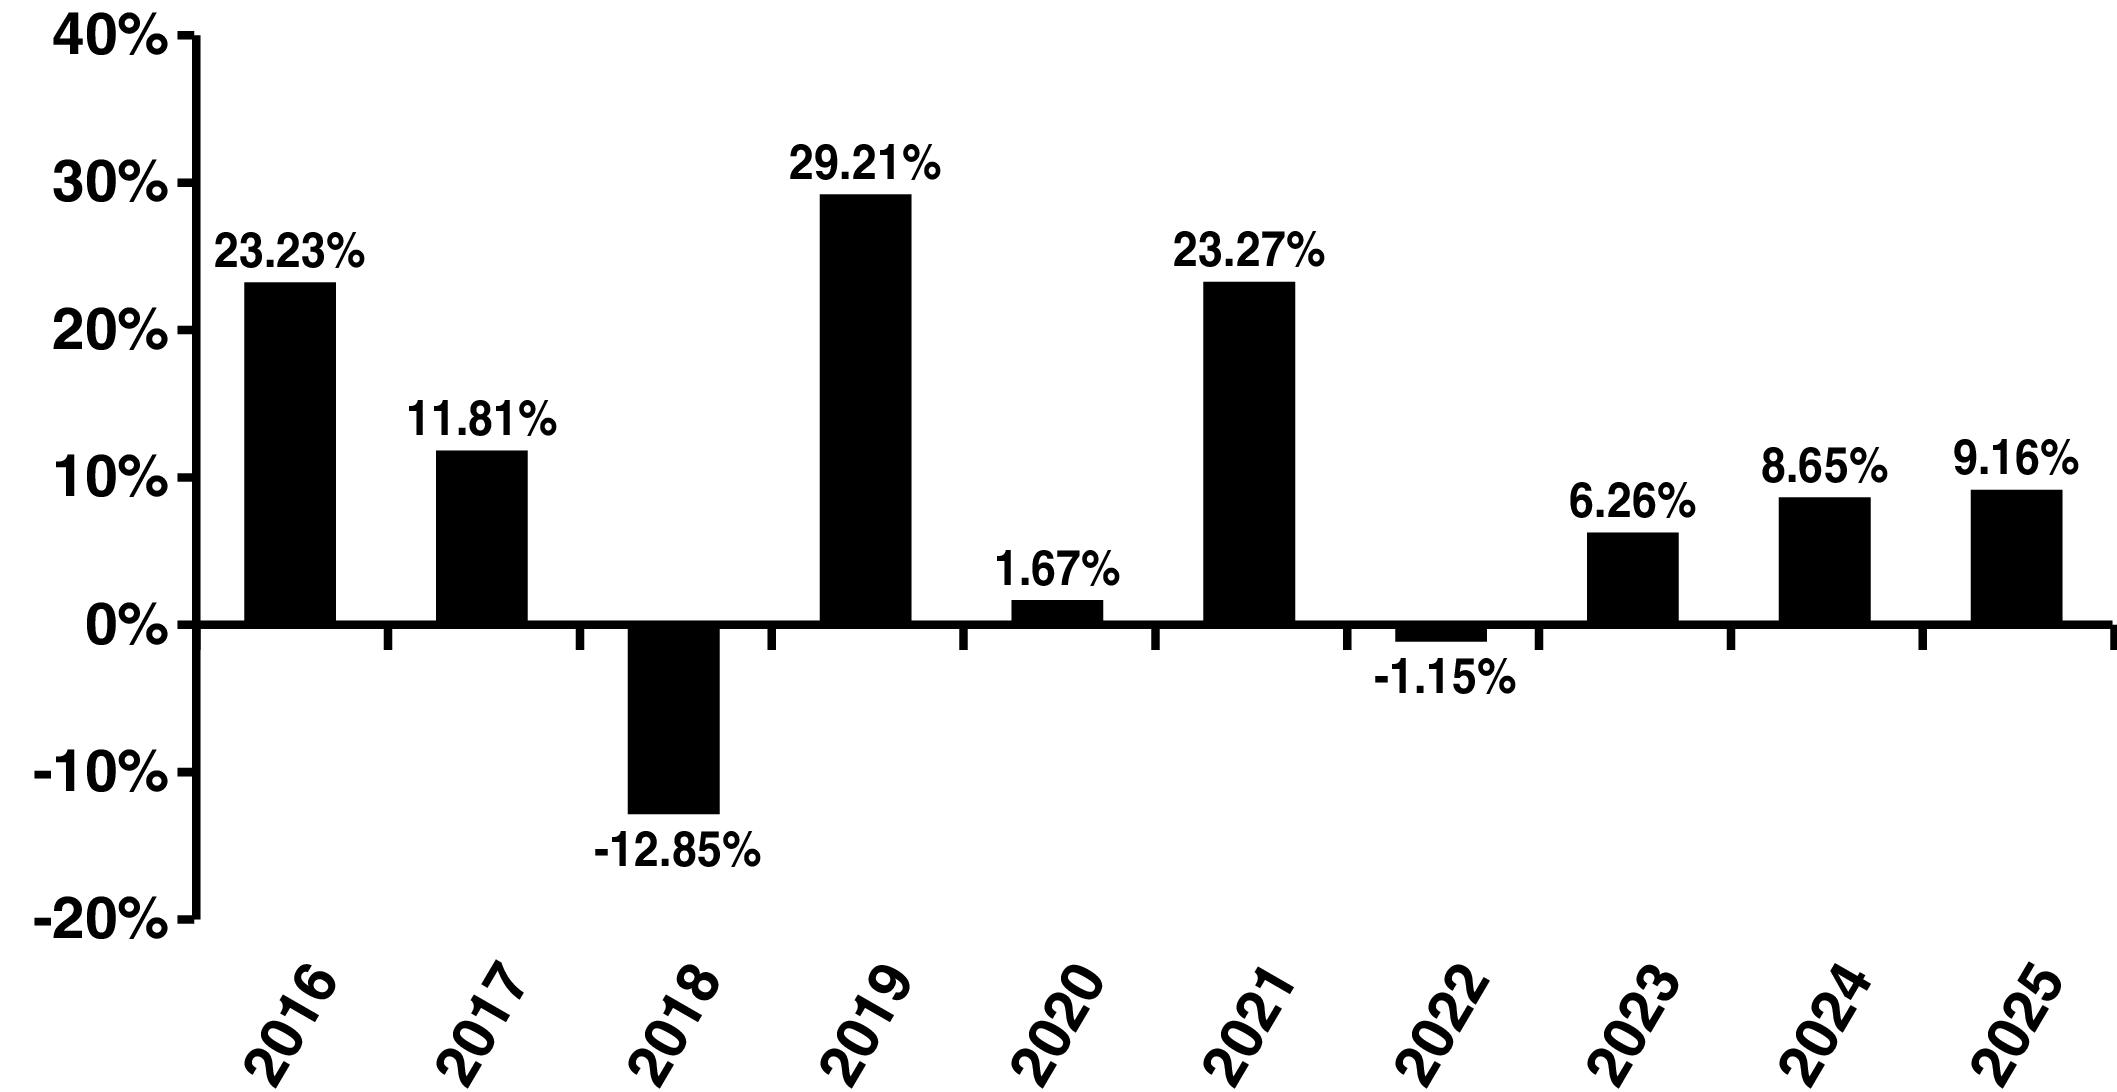
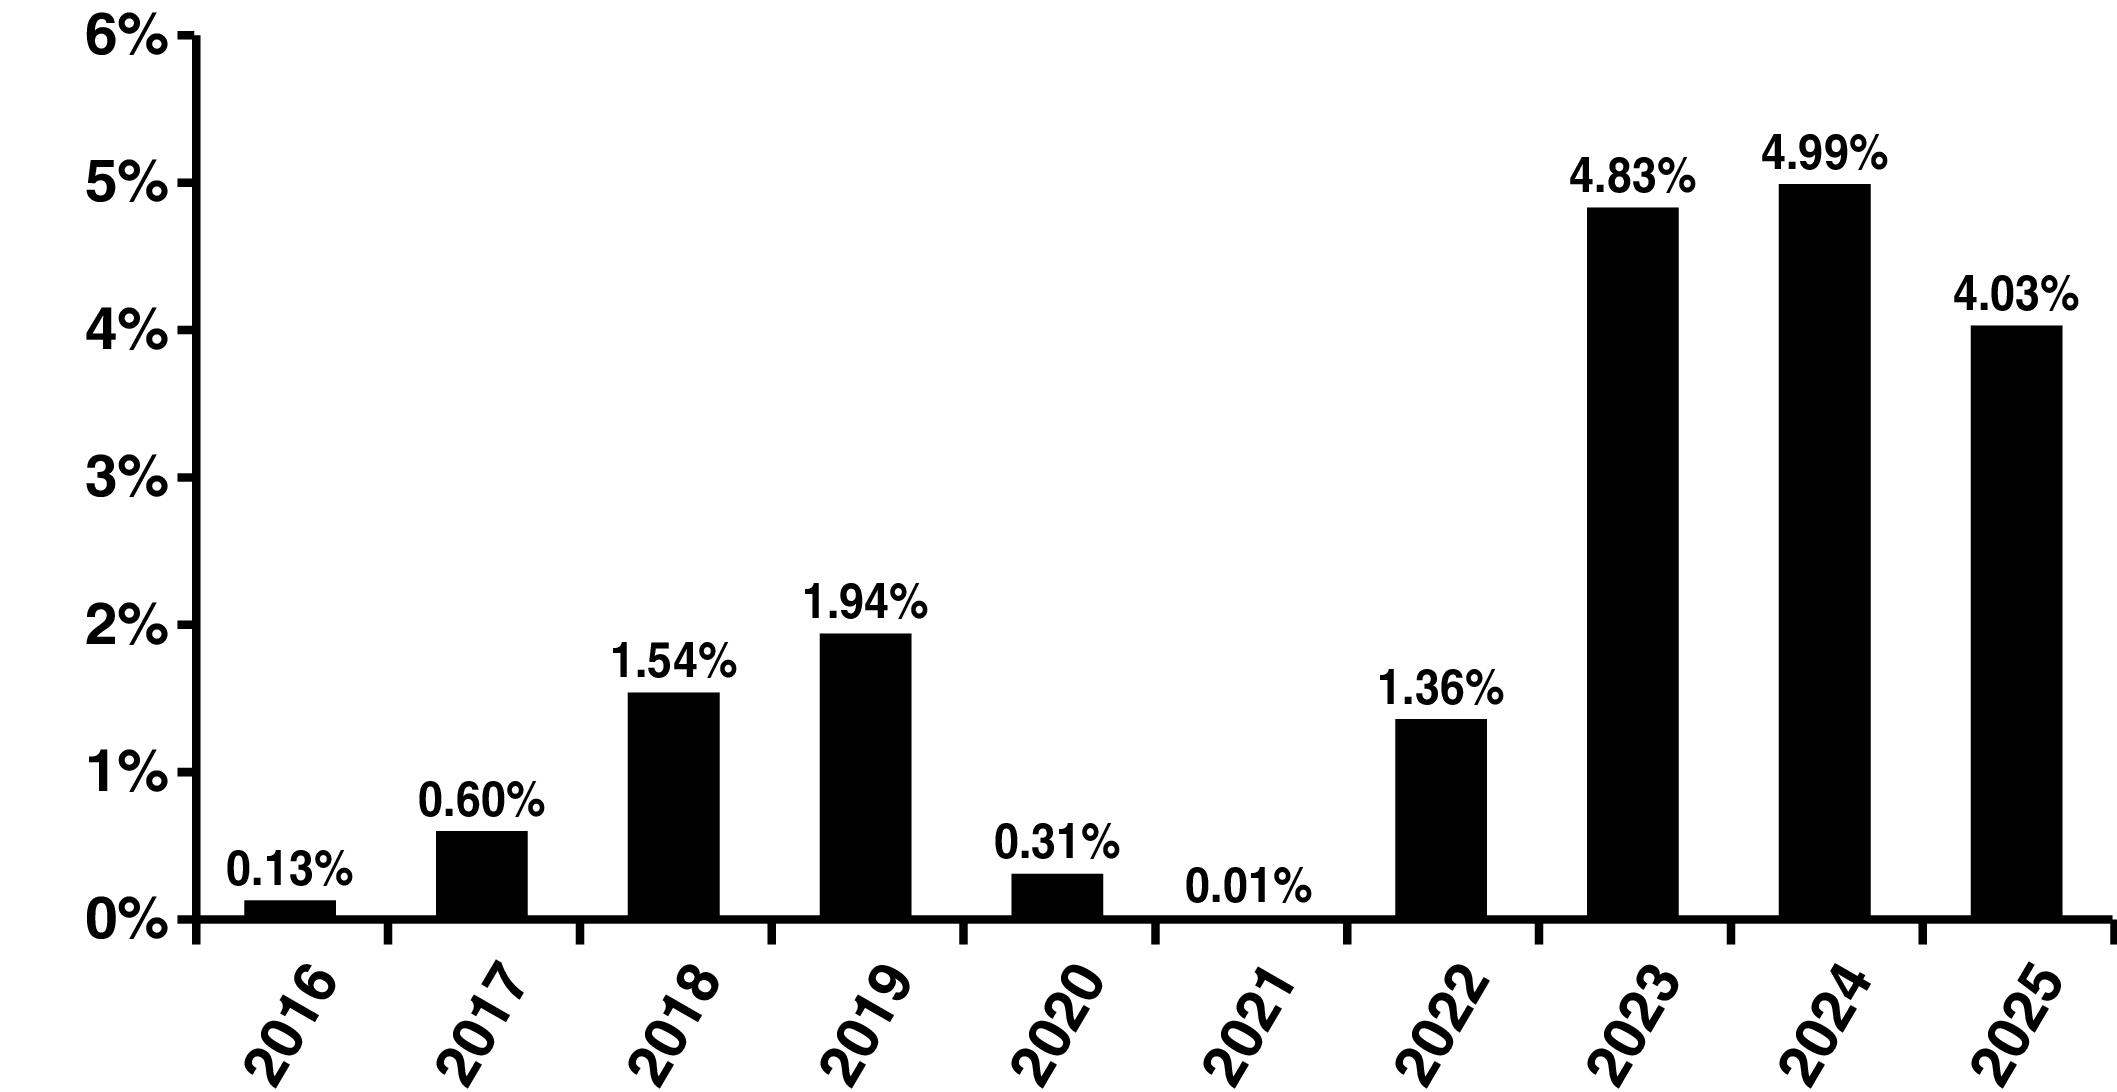
(for periods ended December 31, 2025)
| |
|
1 Yr |
5 Yr |
10 Yr |
| Portfolio: |
Large Cap Core Stock Portfolio |
|
|
|
| Broad-Based Index: |
S&P 500® Index (reflects no deduction for fees, expenses or taxes) |
|
|
|
PORTFOLIO MANAGEMENT
Investment Adviser: Mason Street Advisors, LLC
Sub-Adviser: Wellington Management Company LLP (Wellington Management)
Portfolio Managers: Jonathan G. White, CFA and Director of Research Portfolios, joined Wellington Management in 1999 and has managed the Portfolio since 2017.
Mary L. Pryshlak, CFA and Head of Investment Research, joined Wellington Management in 2004 and has managed the Portfolio since 2018.
TAXES AND INTERMEDIARY COMPENSATION
For important information about taxes, dividends and financial intermediary compensation, please see “SUMMARY OF IMPORTANT INFORMATION REGARDING THE PORTFOLIOS” on page 123 of the Northwestern Mutual Series Fund, Inc. Prospectus.
Northwestern Mutual Series Fund, Inc. Prospectus 10
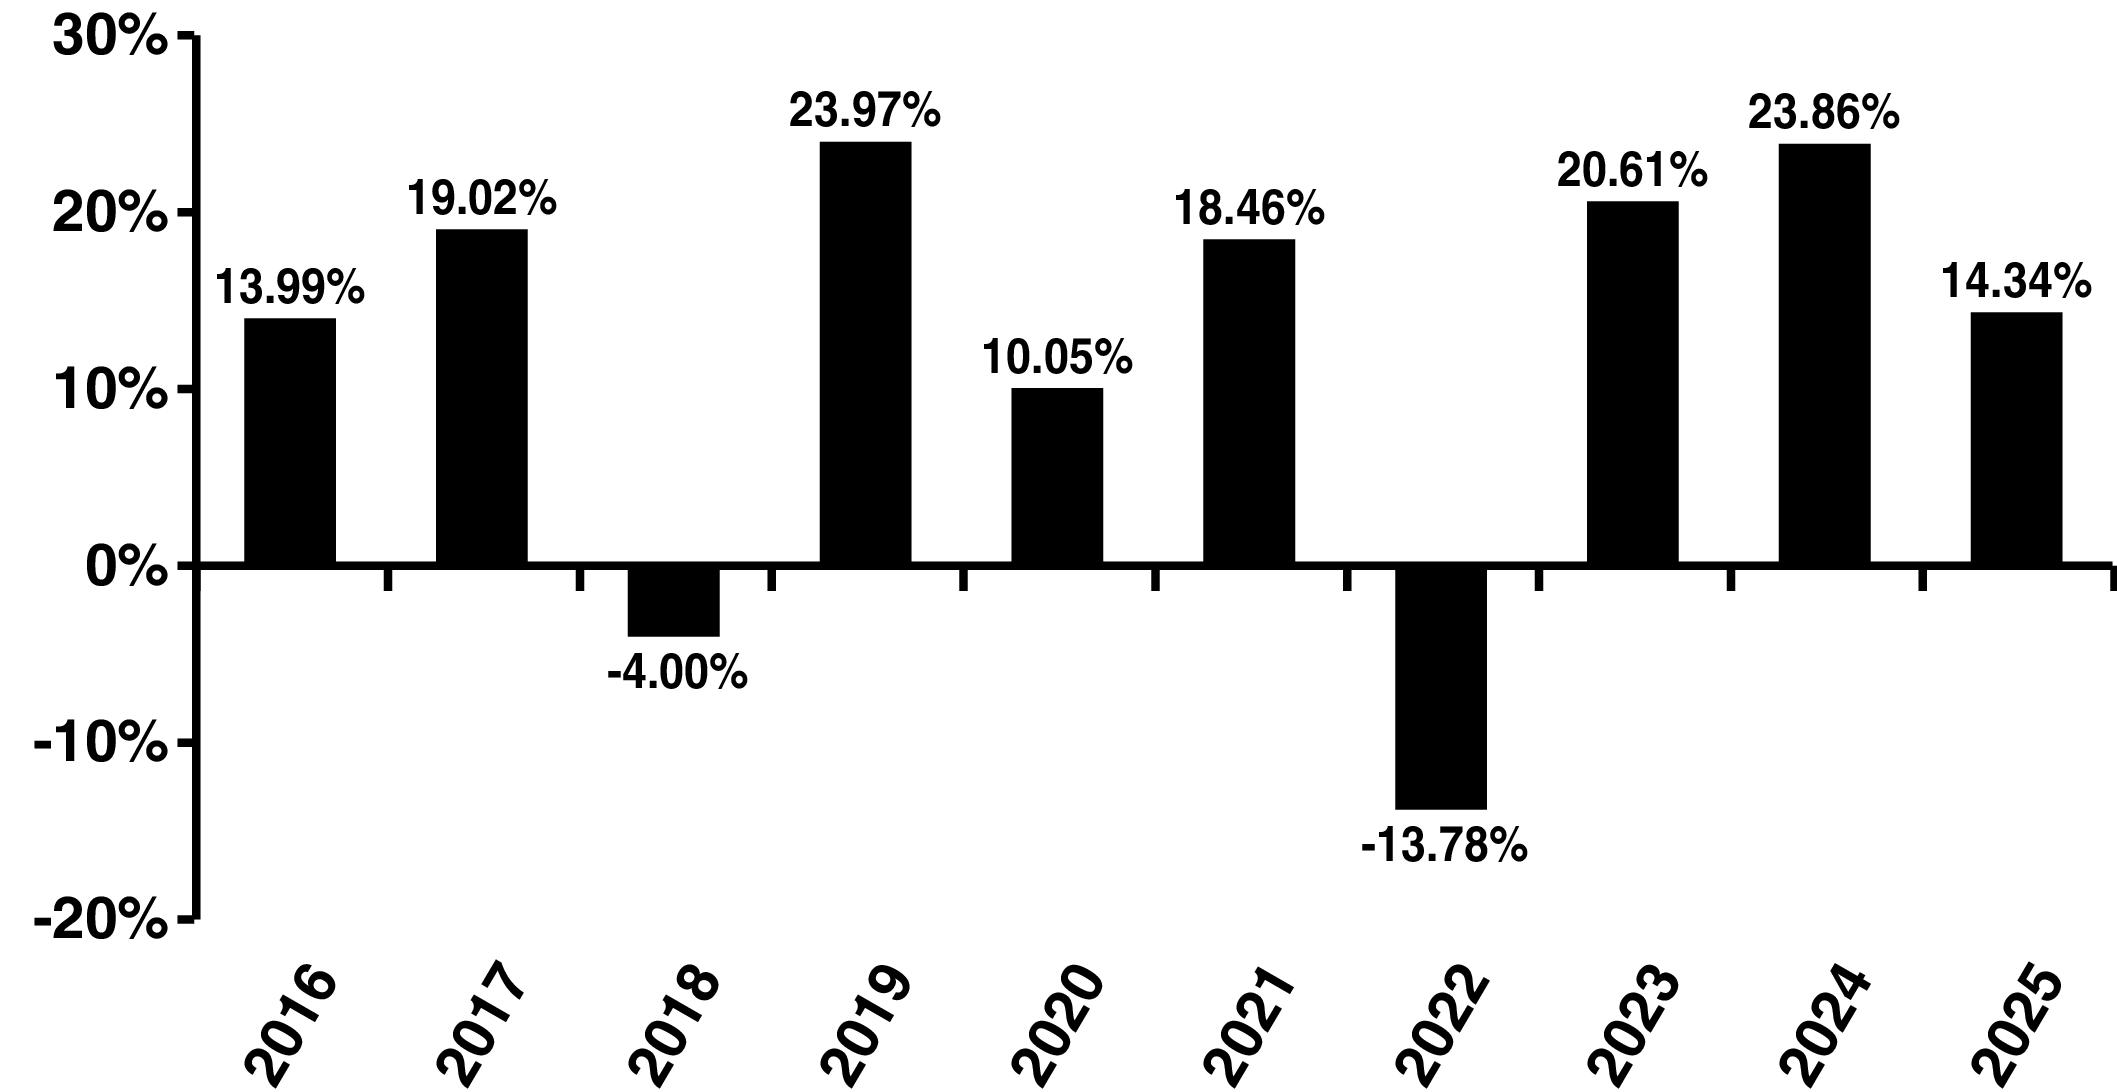
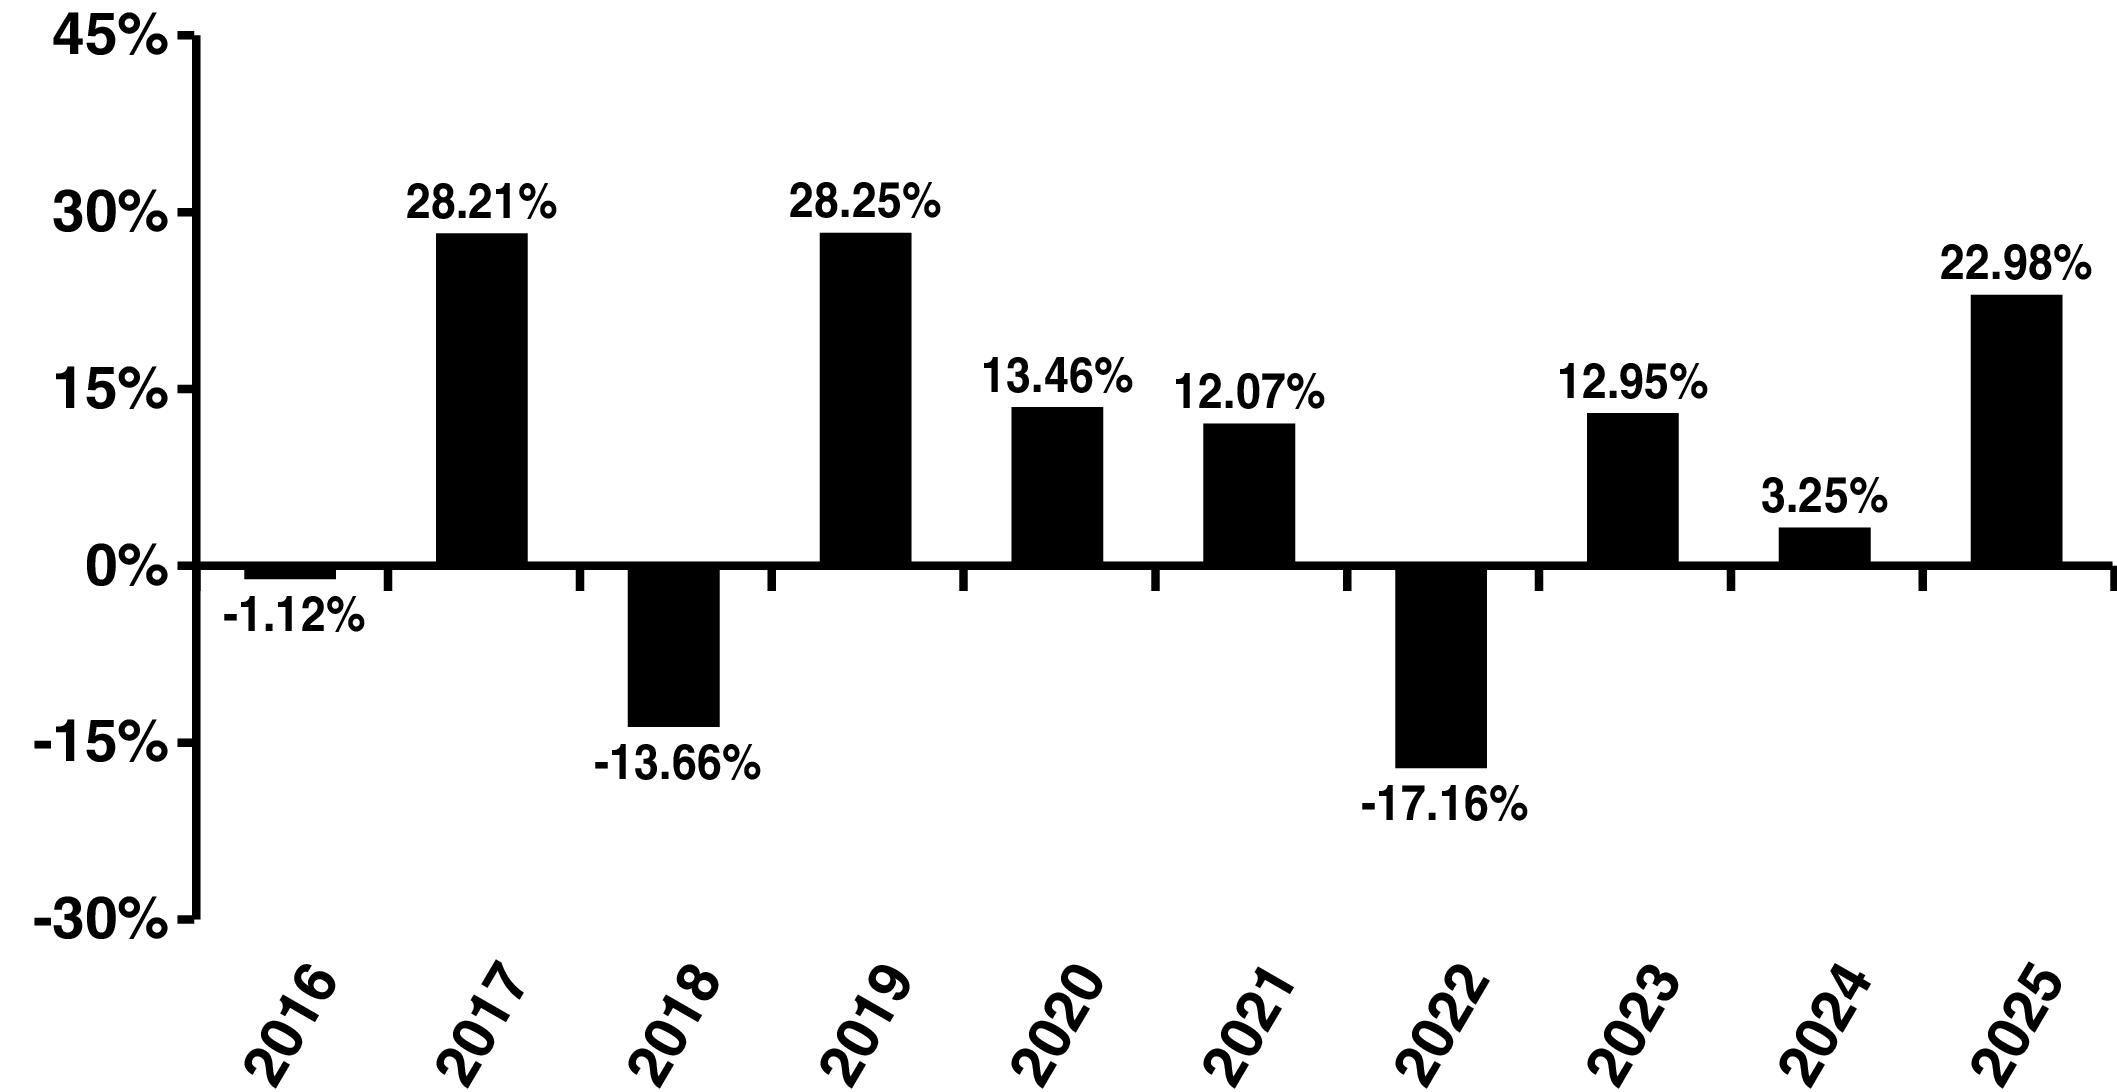
Large Cap Blend Portfolio – Summary
| |
|
| |
|
| Management Fee |
|
| Distribution and Service (12b-1) Fees |
|
| Other Expenses |
|
| Total Annual Portfolio Operating Expenses |
|
| Fee Waiver(1) |
( |
| Total Annual Portfolio Operating Expenses After Fee Waiver(1) |
|
(1)
| 1 Year |
3 Years |
5 Years |
10 Years |
| $ |
$ |
$ |
$ |
11 Northwestern Mutual Series Fund, Inc. Prospectus
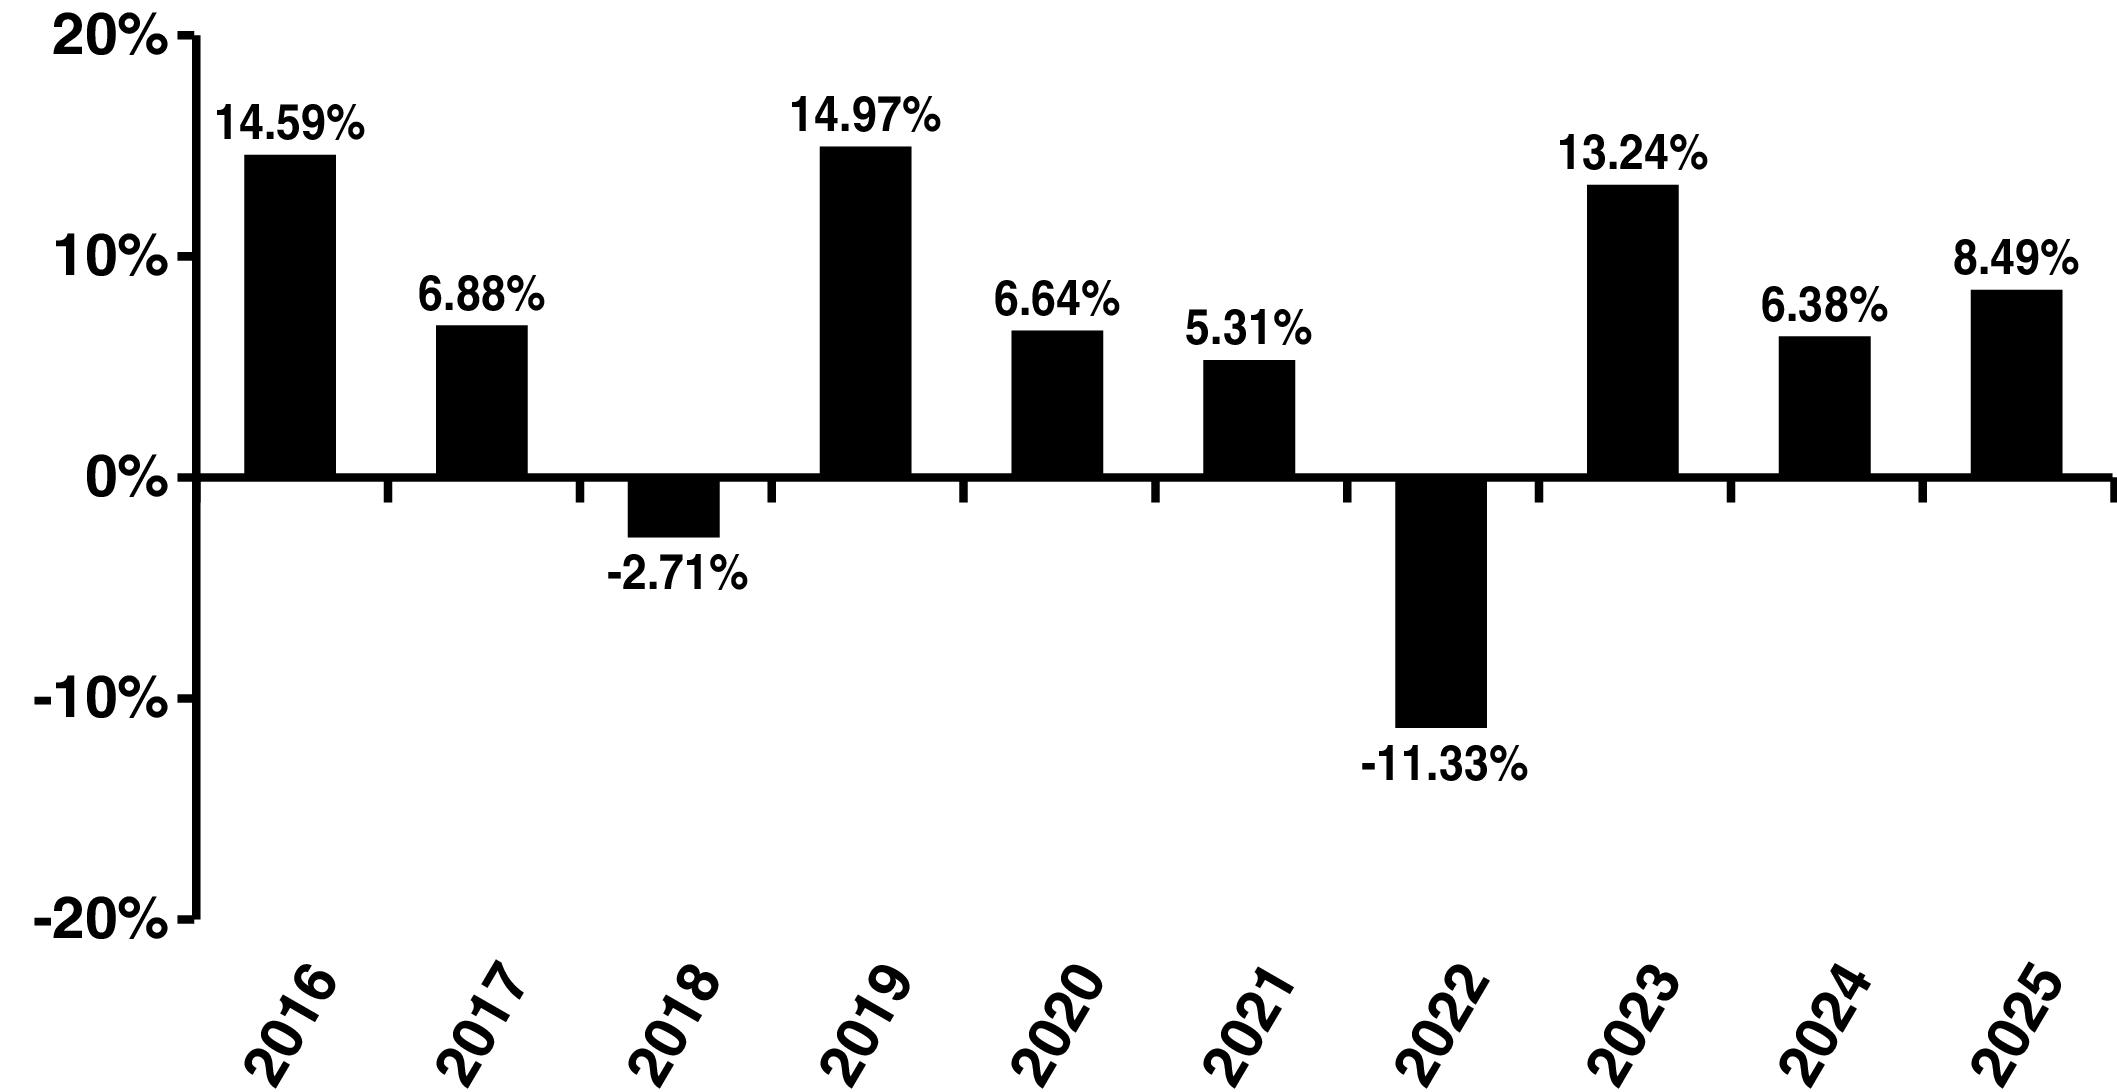
Large Cap Blend Portfolio – Summary
PRINCIPAL RISKS
Northwestern Mutual Series Fund, Inc. Prospectus 12
Large Cap Blend Portfolio – Summary
13 Northwestern Mutual Series Fund, Inc. Prospectus
Large Cap Blend Portfolio – Summary
| |
|
|
| |
|
|
| |
|
|
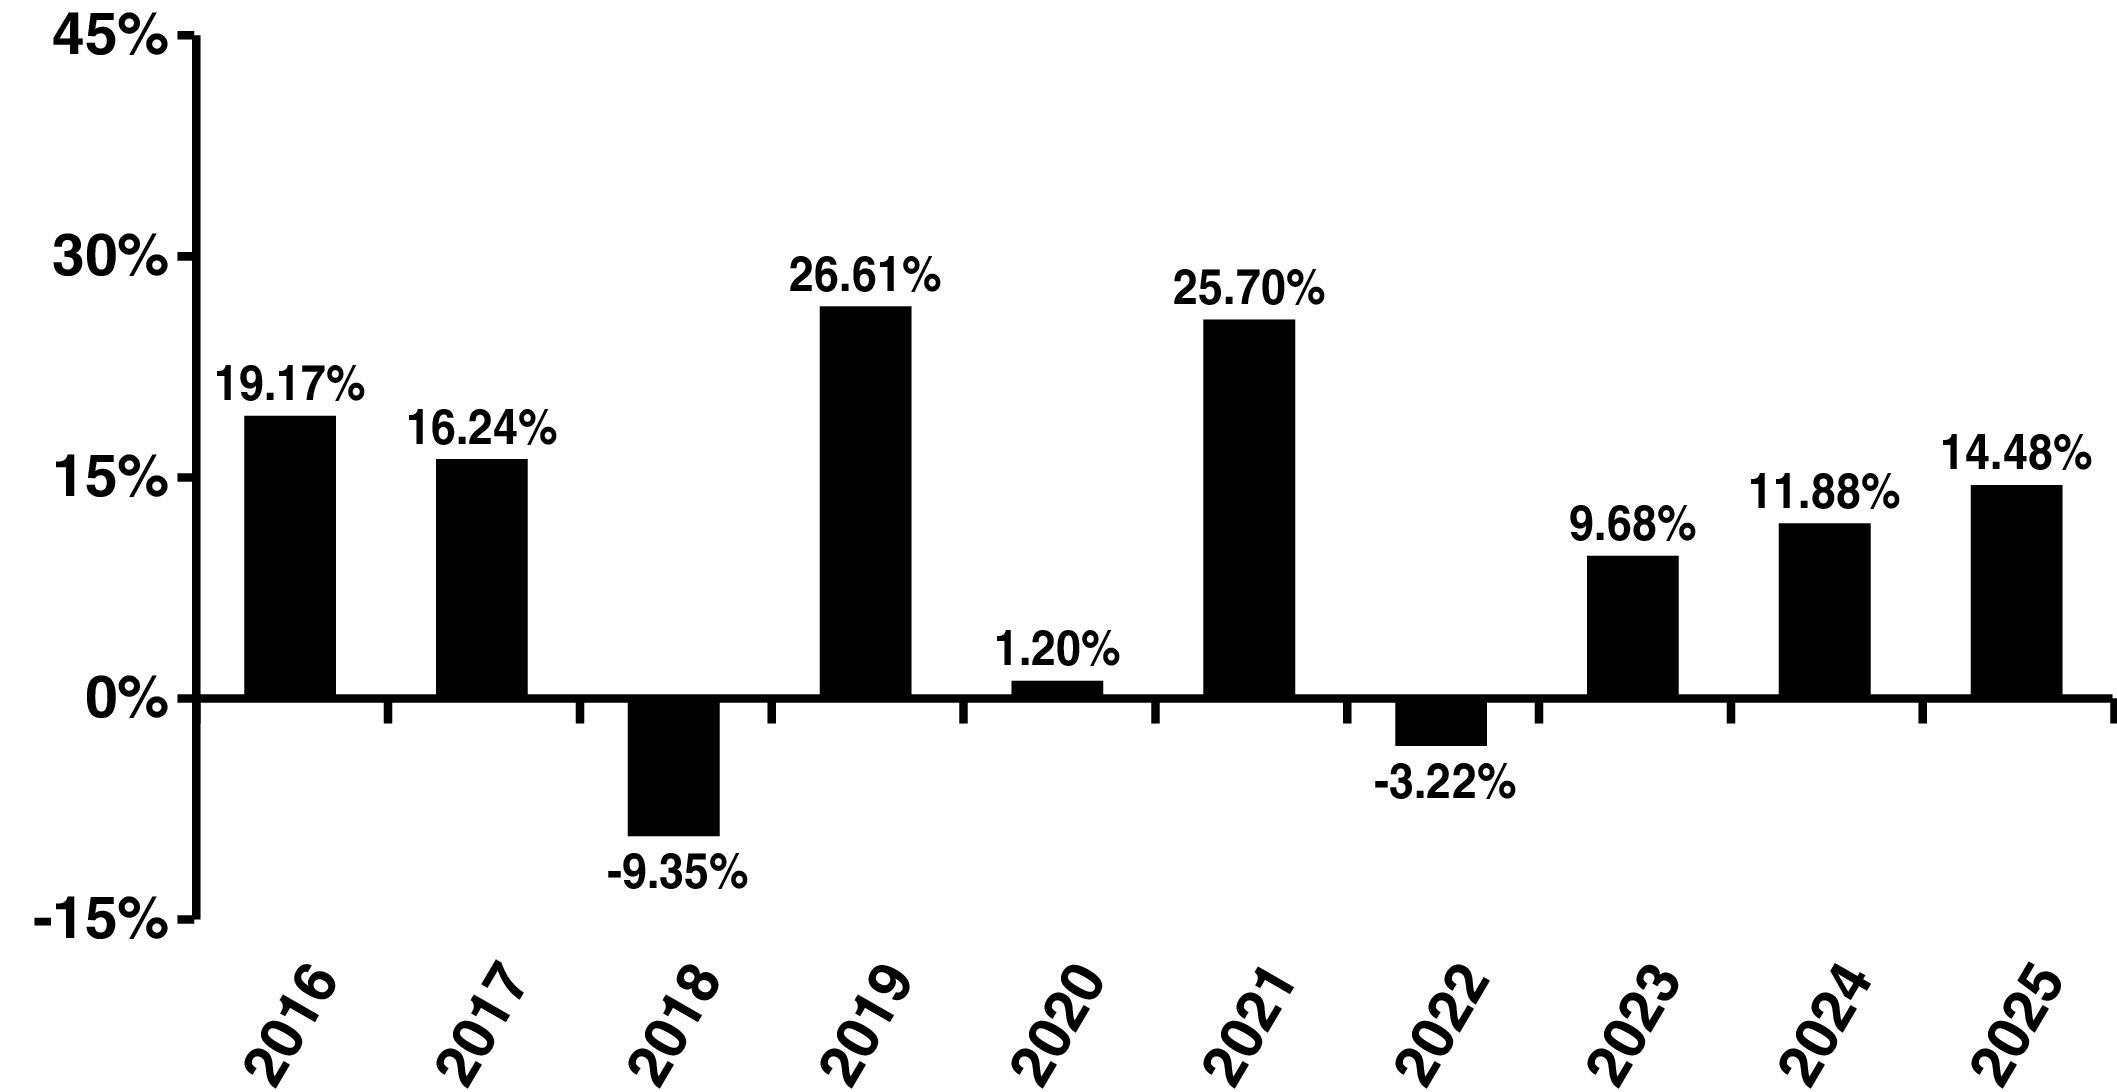
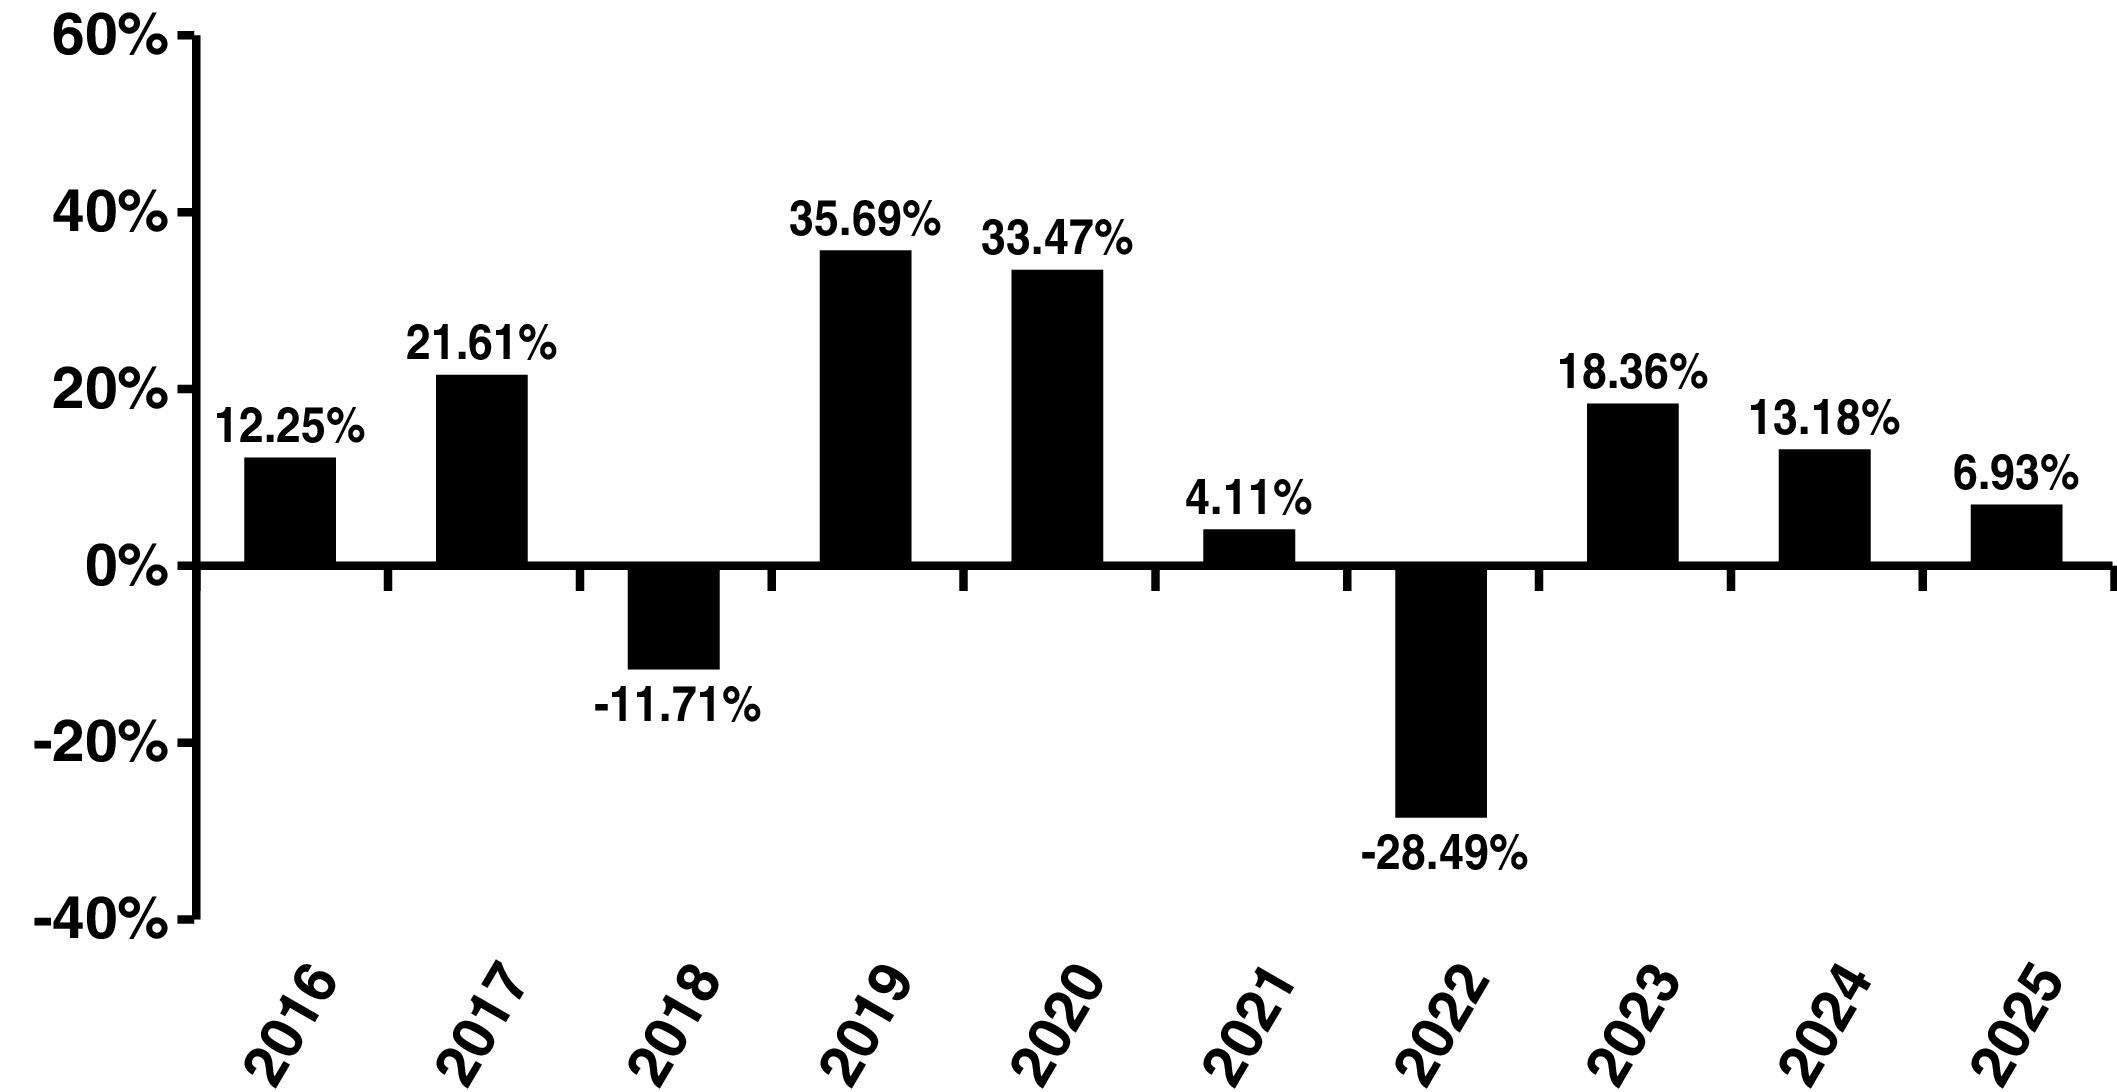
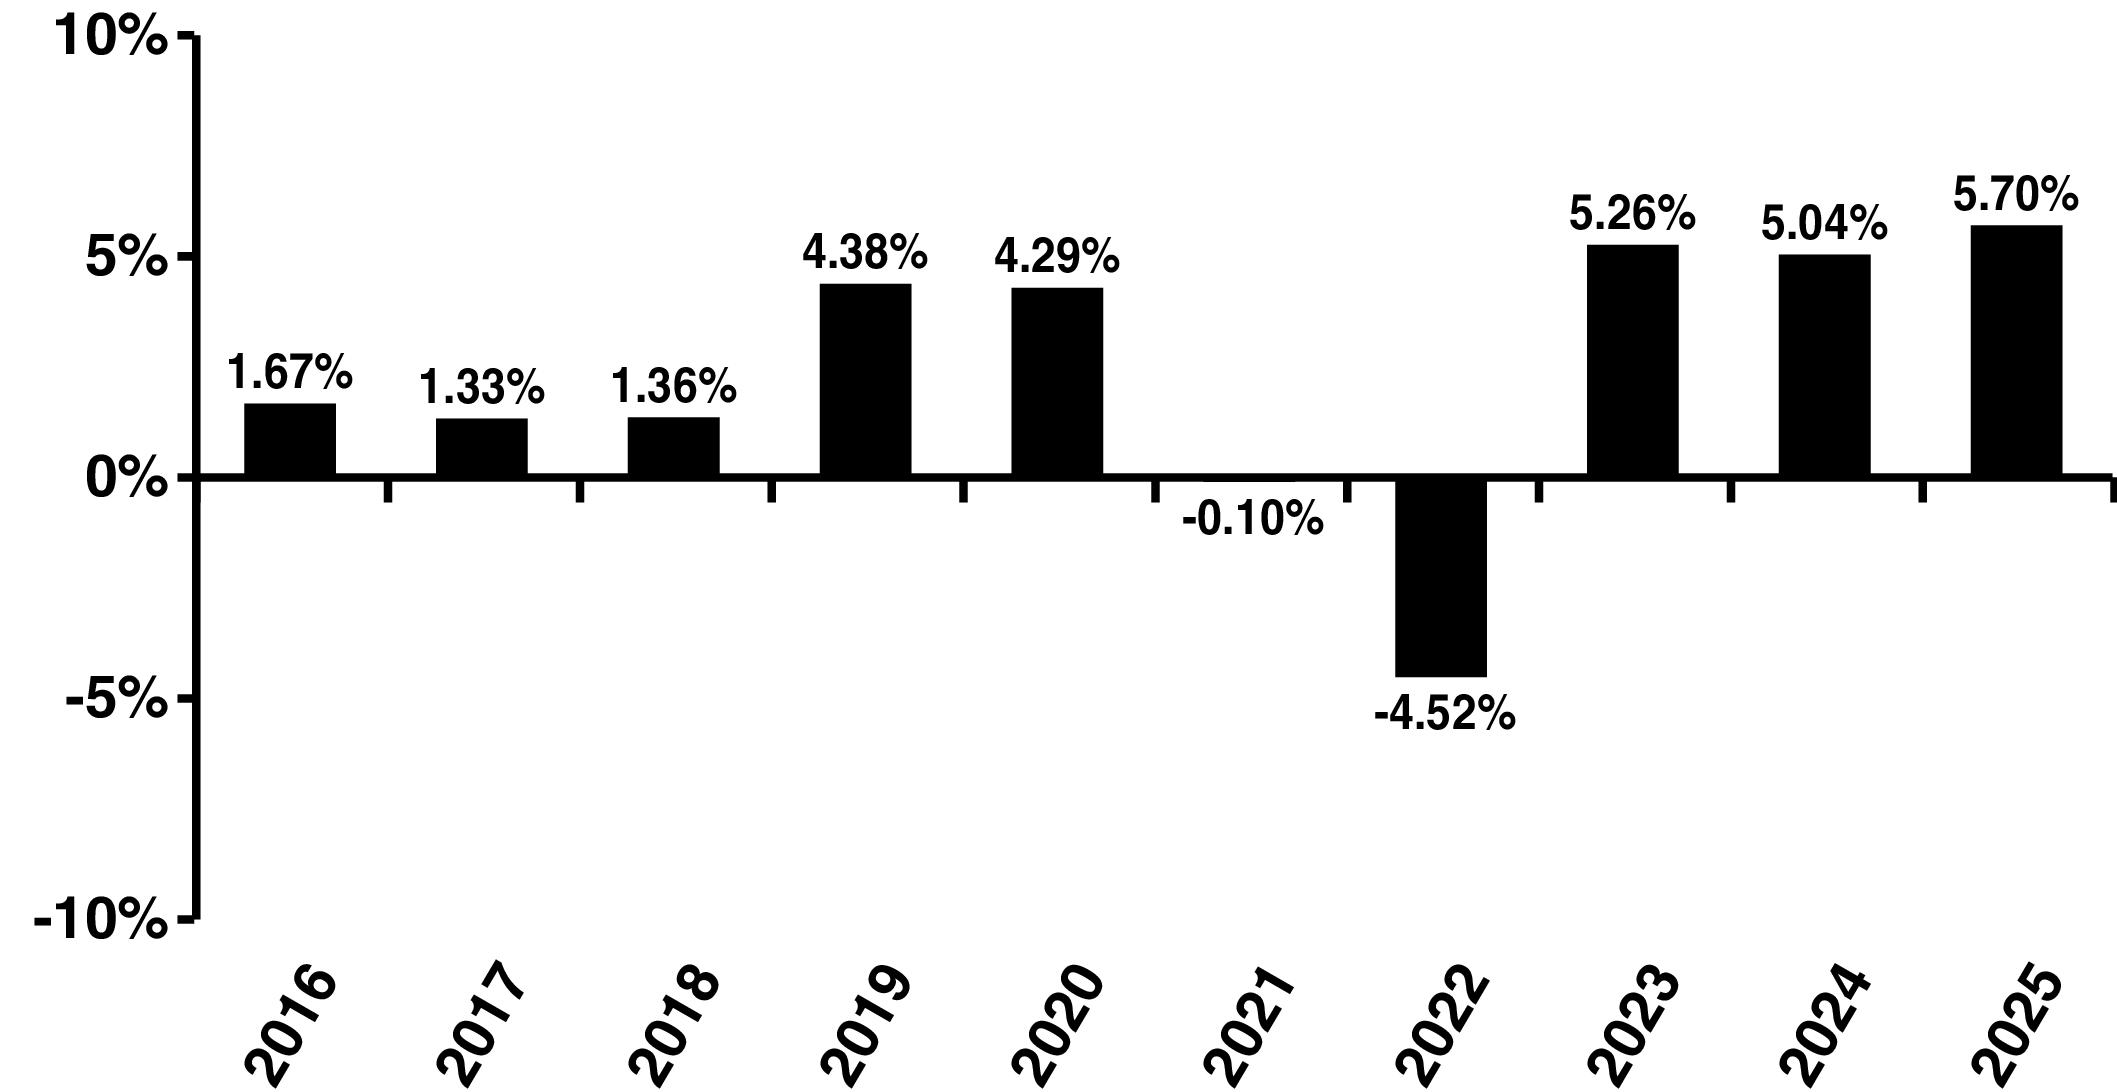
(for periods ended December 31, 2025)
| |
|
1 Yr |
5 Yr |
10 Yr |
| Portfolio: |
Large Cap Blend Portfolio |
|
|
|
| Broad-Based Index: |
S&P 500® Index (reflects no deduction for fees, expenses or taxes) |
|
|
|
PORTFOLIO MANAGEMENT
Investment Adviser: Mason Street Advisors, LLC
Sub-Adviser: J.P. Morgan Investment Management, Inc. (JP Morgan)
Portfolio Managers: Scott B. Davis, Managing Director, joined JP Morgan in 2006 and has managed the Portfolio since 2023.
Shilpee Raina, Executive Director, joined JP Morgan in 2005 and has managed the Portfolio since 2023.
Sub-Adviser: J.P. Morgan Investment Management, Inc. (JP Morgan)
Portfolio Managers: Scott B. Davis, Managing Director, joined JP Morgan in 2006 and has managed the Portfolio since 2023.
Shilpee Raina, Executive Director, joined JP Morgan in 2005 and has managed the Portfolio since 2023.
TAXES AND INTERMEDIARY COMPENSATION
For important information about taxes, dividends and financial intermediary compensation, please see “SUMMARY OF IMPORTANT INFORMATION REGARDING THE PORTFOLIOS” on page 123 of the Northwestern Mutual Series Fund, Inc. Prospectus.
Northwestern Mutual Series Fund, Inc. Prospectus 14
Index 500 Stock Portfolio – Summary
| |
|
| |
|
| Management Fee |
|
| Distribution and Service (12b-1) Fees |
|
| Other Expenses |
|
| Total Annual Portfolio Operating Expenses |
|
| Fee Waiver(1) |
( |
| Total Annual Portfolio Operating Expenses After Fee Waiver(1) |
|
(1)
| 1 Year |
3 Years |
5 Years |
10 Years |
| $ |
$ |
$ |
$ |
15 Northwestern Mutual Series Fund, Inc. Prospectus
Index 500 Stock Portfolio – Summary
PRINCIPAL RISKS
Northwestern Mutual Series Fund, Inc. Prospectus 16
Index 500 Stock Portfolio – Summary
| |
|
|
| |
|
|
| |
|
|
(for periods ended December 31, 2025)
| |
|
1 Yr |
5 Yr |
10 Yr |
| Portfolio: |
Index 500 Stock Portfolio |
|
|
|
| Broad-Based Index: |
S&P 500® Index (reflects no deduction for fees, expenses or taxes) |
|
|
|
PORTFOLIO MANAGEMENT
Investment Adviser: Mason Street Advisors, LLC
Sub-Adviser: BlackRock Advisors, LLC (BlackRock)
Portfolio Managers: Peter Sietsema, CFA, Director, joined BlackRock in 2007 and has managed the Portfolio since 2022.
Jennifer Hsui, CFA, Managing Director and Co-head and Chief Investment Officer of Global Index Equity, joined BlackRock in
Sub-Adviser: BlackRock Advisors, LLC (BlackRock)
Portfolio Managers: Peter Sietsema, CFA, Director, joined BlackRock in 2007 and has managed the Portfolio since 2022.
Jennifer Hsui, CFA, Managing Director and Co-head and Chief Investment Officer of Global Index Equity, joined BlackRock in
17 Northwestern Mutual Series Fund, Inc. Prospectus
Index 500 Stock Portfolio – Summary
2006 and has managed the Portfolio since 2021.
Steven White, Director and Head of the Active Risk Index ETF team in the Americas, and co-CIO for Index Equity Investments within BlackRock Global Markets & Index Investments, joined BlackRock in 2011 and has managed the Portfolio since 2025.
Steven White, Director and Head of the Active Risk Index ETF team in the Americas, and co-CIO for Index Equity Investments within BlackRock Global Markets & Index Investments, joined BlackRock in 2011 and has managed the Portfolio since 2025.
TAXES AND INTERMEDIARY COMPENSATION
For important information about taxes, dividends and financial intermediary compensation, please see “SUMMARY OF IMPORTANT INFORMATION REGARDING THE PORTFOLIOS” on page 123 of the Northwestern Mutual Series Fund, Inc. Prospectus.
Northwestern Mutual Series Fund, Inc. Prospectus 18
Large Company Value Portfolio – Summary
| |
|
| |
|
| Management Fee |
|
| Distribution and Service (12b-1) Fees |
|
| Other Expenses |
|
| Total Annual Portfolio Operating Expenses |
|
| Fee Waiver(1) |
( |
| Total Annual Portfolio Operating Expenses After Fee Waiver(1) |
|
(1)
| 1 Year |
3 Years |
5 Years |
10 Years |
| $ |
$ |
$ |
$ |
19 Northwestern Mutual Series Fund, Inc. Prospectus
Large Company Value Portfolio – Summary
PRINCIPAL RISKS
Northwestern Mutual Series Fund, Inc. Prospectus 20
Large Company Value Portfolio – Summary
21 Northwestern Mutual Series Fund, Inc. Prospectus
Large Company Value Portfolio – Summary
| |
|
|
| |
|
|
| |
|
|
(for periods ended December 31, 2025)
| |
|
1 Yr |
5 Yr |
10 Yr |
| Portfolio: |
Large Company Value Portfolio |
|
|
|
| Strategy Index: |
Russell 1000® Value Index (reflects no deduction for fees, expenses or taxes) |
|
|
|
| Broad-Based Index: |
S&P 500® Index (reflects no deduction for fees, expenses or taxes) |
|
|
|
PORTFOLIO MANAGEMENT
Investment Adviser: Mason Street Advisors, LLC
Sub-Adviser: American Century Investment Management, Inc. (American Century)
Portfolio Managers: Brian Woglom, CFA, Vice President and Senior Portfolio Manager, joined American Century in 2005 and has managed the Portfolio since 2016.
Philip Sundell, CFA, Vice President and Portfolio Manager, joined American Century in 1997 and has managed the Portfolio since 2019.
Adam Krenn, CFA, Vice President and Senior Investment Analyst, joined American Century in 2011 and has managed the Portfolio since 2022.
Kevin Toney, CFA, Chief Investment Officer – Global Value Equity, Senior Vice President and Senior Portfolio Manager, joined American Century in 1999 and has managed the Portfolio since 2025.
TAXES AND INTERMEDIARY COMPENSATION
For important information about taxes, dividends and financial intermediary compensation, please see “SUMMARY OF IMPORTANT INFORMATION REGARDING THE PORTFOLIOS” on page 123 of the Northwestern Mutual Series Fund, Inc. Prospectus.
Northwestern Mutual Series Fund, Inc. Prospectus 22
Domestic Equity Portfolio – Summary
| |
|
| |
|
| Management Fee |
|
| Distribution and Service (12b-1) Fees |
|
| Other Expenses |
|
| Total Annual Portfolio Operating Expenses |
|
| Fee Waiver(1) |
( |
| Total Annual Portfolio Operating Expenses After Fee Waiver(1) |
|
(1)
| 1 Year |
3 Years |
5 Years |
10 Years |
| $ |
$ |
$ |
$ |
PRINCIPAL RISKS
23 Northwestern Mutual Series Fund, Inc. Prospectus
Domestic Equity Portfolio – Summary
Northwestern Mutual Series Fund, Inc. Prospectus 24
Domestic Equity Portfolio – Summary
| |
|
|
| |
|
|
| |
|
|
(for periods ended December 31, 2025)
| |
|
1 Yr |
5 Yr |
10 Yr |
| Portfolio: |
Domestic Equity Portfolio |
|
|
|
| Strategy Index: |
Russell 1000® Value Index (reflects no deduction for fees, expenses or taxes) |
|
|
|
| Broad-Based Index: |
S&P 500® Index (reflects no deduction for fees, expenses or taxes) |
|
|
|
PORTFOLIO MANAGEMENT
Investment Adviser: Mason Street Advisors, LLC
Sub-Adviser: Putnam Investment Management, LLC (Putnam)
Portfolio Managers: Darren Jaroch, CFA, Portfolio Manager, has been with Putnam since 1999, and has managed the Portfolio since 2025.
Lauren DeMore, CFA, Portfolio Manager, has been with Putnam since 2006, and has managed the Portfolio since 2025.
TAXES AND INTERMEDIARY COMPENSATION
For important information about taxes, dividends and financial intermediary compensation, please see “SUMMARY OF IMPORTANT INFORMATION REGARDING THE PORTFOLIOS” on page 123 of the Northwestern Mutual Series Fund, Inc. Prospectus.
25 Northwestern Mutual Series Fund, Inc. Prospectus
Equity Income Portfolio – Summary
| |
|
| |
|
| Management Fee |
|
| Distribution and Service (12b-1) Fees |
|
| Other Expenses |
|
| Total Annual Portfolio Operating Expenses |
|
| Fee Waiver(1) |
( |
| Total Annual Portfolio Operating Expenses After Fee Waiver(1) |
|
(1)
| 1 Year |
3 Years |
5 Years |
10 Years |
| $ |
$ |
$ |
$ |
PRINCIPAL RISKS
Northwestern Mutual Series Fund, Inc. Prospectus 26
Equity Income Portfolio – Summary
27 Northwestern Mutual Series Fund, Inc. Prospectus
Equity Income Portfolio – Summary
| |
|
|
| |
|
|
| |
|
|
(for periods ended December 31, 2025)
| |
|
1 Yr |
5 Yr |
10 Yr |
| Portfolio: |
Equity Income Portfolio |
|
|
|
| Strategy Index: |
Russell 1000® Value Index (reflects no deduction for fees, expenses or taxes) |
|
|
|
| Broad-Based Index: |
S&P 500® Index (reflects no deduction for fees, expenses or taxes) |
|
|
|
PORTFOLIO MANAGEMENT
Investment Adviser: Mason Street Advisors, LLC
Sub-Adviser: T. Rowe Price Associates, Inc. (TRPA)
Portfolio Manager: John D. Linehan, CFA, Vice President, has been with TRPA since 1998. He has managed the Portfolio since November 2015.
Sub-Adviser: T. Rowe Price Associates, Inc. (TRPA)
Portfolio Manager: John D. Linehan, CFA, Vice President, has been with TRPA since 1998. He has managed the Portfolio since November 2015.
TAXES AND INTERMEDIARY COMPENSATION
For important information about taxes, dividends and financial intermediary compensation, please see “SUMMARY OF IMPORTANT INFORMATION REGARDING THE PORTFOLIOS” on page 123 of the Northwestern Mutual Series Fund, Inc. Prospectus.
Northwestern Mutual Series Fund, Inc. Prospectus 28
Mid Cap Growth Stock Portfolio – Summary
| |
|
| |
|
| Management Fee |
|
| Distribution and Service (12b-1) Fees |
|
| Other Expenses |
|
| Total Annual Portfolio Operating Expenses |
|
| Fee Waiver(1) |
|
| Total Annual Portfolio Operating Expenses After Fee Waiver(1) |
|
(1)
| 1 Year |
3 Years |
5 Years |
10 Years |
| $ |
$ |
$ |
$ |
29 Northwestern Mutual Series Fund, Inc. Prospectus
Mid Cap Growth Stock Portfolio – Summary
PRINCIPAL RISKS
Northwestern Mutual Series Fund, Inc. Prospectus 30
Mid Cap Growth Stock Portfolio – Summary
| |
|
|
| |
|
|
| |
|
|
(for periods ended December 31, 2025)
| |
|
1 Yr |
5 Yr |
10 Yr |
| Portfolio: |
Mid Cap Growth Stock Portfolio |
|
|
|
| Strategy Index: |
Russell MidCap® Growth Index (reflects no deduction for fees, expenses or taxes) |
|
|
|
| Broad-Based Index: |
S&P 500® Index (reflects no deduction for fees, expenses or taxes) |
|
|
|
PORTFOLIO MANAGEMENT
Investment Adviser: Mason Street Advisors, LLC
Sub-Adviser: J.P. Morgan Investment Management, Inc. (JPMIM)
Portfolio Managers: Felise L. Agranoff, CFA, Managing Director of JPMIM and Portfolio Manager, joined JPMIM in 2004 and has managed the Portfolio since 2024.
Michael Stein, CFA, Managing Director of JPMIM and Portfolio Manager, joined JPMIM in 2014 and has managed the Portfolio since 2025.
TAXES AND INTERMEDIARY COMPENSATION
For important information about taxes, dividends and financial intermediary compensation, please see “SUMMARY OF IMPORTANT INFORMATION REGARDING THE PORTFOLIOS” on page 123 of the Northwestern Mutual Series Fund, Inc. Prospectus.
31 Northwestern Mutual Series Fund, Inc. Prospectus
Index 400 Stock Portfolio – Summary
| |
|
| |
|
| Management Fee |
|
| Distribution and Service (12b-1) Fees |
|
| Other Expenses |
|
| Total Annual Portfolio Operating Expenses |
|
| Fee Waiver(1) |
( |
| Total Annual Portfolio Operating Expenses After Fee Waiver(1) |
|
(1)
| 1 Year |
3 Years |
5 Years |
10 Years |
| $ |
$ |
$ |
$ |
Northwestern Mutual Series Fund, Inc. Prospectus 32
Index 400 Stock Portfolio – Summary
PRINCIPAL RISKS
33 Northwestern Mutual Series Fund, Inc. Prospectus
Index 400 Stock Portfolio – Summary
| |
|
|
| |
|
|
| |
|
|
(for periods ended December 31, 2025)
| |
|
1 Yr |
5 Yr |
10 Yr |
| Portfolio: |
Index 400 Stock Portfolio |
|
|
|
| Strategy Index: |
S&P MidCap 400® Index (reflects no deduction for fees, expenses or taxes) |
|
|
|
| Broad-Based Index: |
S&P 500® Index (reflects no deduction for fees, expenses or taxes) |
|
|
|
PORTFOLIO MANAGEMENT
Investment Adviser: Mason Street Advisors, LLC
Sub-Adviser: Northern Trust Investments, Inc. (Northern Trust)
Portfolio Managers: Lucy Johnston, Portfolio Manager, joined Northern Trust in 1997 and has managed the Portfolio since February 2021.
Keith Carroll, Portfolio Manager, joined Northern Trust in 2007 and has managed the Portfolio since September 2024.
TAXES AND INTERMEDIARY COMPENSATION
For important information about taxes, dividends and financial intermediary compensation, please see “SUMMARY OF IMPORTANT INFORMATION REGARDING THE PORTFOLIOS” on page 123 of the Northwestern Mutual Series Fund, Inc. Prospectus.
Northwestern Mutual Series Fund, Inc. Prospectus 34
Mid Cap Value Portfolio – Summary
| |
|
| |
|
| Management Fee |
|
| Distribution and Service (12b-1) Fees |
|
| Other Expenses(1) |
|
| Total Annual Portfolio Operating Expenses(1) |
|
| Fee Waiver(2) |
( |
| Total Annual Portfolio Operating Expenses After Fee Waiver(1),(2) |
|
(1)
(2)
| 1 Year |
3 Years |
5 Years |
10 Years |
| $ |
$ |
$ |
$ |
35 Northwestern Mutual Series Fund, Inc. Prospectus
Mid Cap Value Portfolio – Summary
PRINCIPAL RISKS
Northwestern Mutual Series Fund, Inc. Prospectus 36
Mid Cap Value Portfolio – Summary
37 Northwestern Mutual Series Fund, Inc. Prospectus
Mid Cap Value Portfolio – Summary
| |
|
|
| |
|
|
| |
|
|
(for periods ended December 31, 2025)
| |
|
1 Yr |
5 Yr |
10 Yr |
| Portfolio: |
Mid Cap Value Portfolio |
|
|
|
| Strategy Index: |
Russell MidCap® Value Index (reflects no deduction for fees, expenses or taxes) |
|
|
|
| Broad-Based Index: |
S&P 500® Index (reflects no deduction for fees, expenses or taxes) |
|
|
|
PORTFOLIO MANAGEMENT
Investment Adviser: Mason Street Advisors, LLC
Sub-Adviser: American Century Investment Management, Inc. (American Century)
Portfolio Managers: Kevin Toney, CFA, Chief Investment Officer - Global Value Equity, Senior Vice President and Senior Portfolio Manager, has served American Century as a Portfolio Manager since 2006 and has managed the Portfolio since 2009.
Brian Woglom, CFA, Vice President and Senior Portfolio Manager, has served American Century as a Portfolio Manager since 2012 and has managed the Portfolio since 2012.
Nathan Rawlins, CFA, Portfolio Manager and Senior Investment Analyst, has served American Century as a Portfolio Manager since March 2022 and has managed the Portfolio since 2022.
TAXES AND INTERMEDIARY COMPENSATION
For important information about taxes, dividends and financial intermediary compensation, please see “SUMMARY OF IMPORTANT INFORMATION REGARDING THE PORTFOLIOS” on page 123 of the Northwestern Mutual Series Fund, Inc. Prospectus.
Northwestern Mutual Series Fund, Inc. Prospectus 38
Small Cap Growth Stock Portfolio – Summary
| |
|
| |
|
| Management Fee |
|
| Distribution and Service (12b-1) Fees |
|
| Other Expenses(1) |
|
| Total Annual Portfolio Operating Expenses(1) |
|
(1)
| 1 Year |
3 Years |
5 Years |
10 Years |
| $ |
$ |
$ |
$ |
39 Northwestern Mutual Series Fund, Inc. Prospectus
Small Cap Growth Stock Portfolio – Summary
PRINCIPAL RISKS
Northwestern Mutual Series Fund, Inc. Prospectus 40
Small Cap Growth Stock Portfolio – Summary
41 Northwestern Mutual Series Fund, Inc. Prospectus
Small Cap Growth Stock Portfolio – Summary
| |
|
|
| |
|
|
| |
|
|
(for periods ended December 31, 2025)
| |
|
1 Yr |
5 Yr |
10 Yr |
| Portfolio: |
Small Cap Growth Stock Portfolio |
|
|
|
| Strategy Index: |
Russell 2000® Growth Index (reflects no deduction for fees, expenses or taxes) |
|
|
|
| Broad-Based Index: |
S&P 500® Index (reflects no deduction for fees, expenses or taxes) |
|
|
|
PORTFOLIO MANAGEMENT
Investment Adviser: Mason Street Advisors, LLC
Sub-Adviser: Wellington Management Company LLP (Wellington Management)
Portfolio Manager: David Siegle, CFA, Managing Director and Equity Portfolio Manager, joined Wellington Management in 2001 and has managed the Portfolio since 2023.
Sub-Adviser: Wellington Management Company LLP (Wellington Management)
Portfolio Manager: David Siegle, CFA, Managing Director and Equity Portfolio Manager, joined Wellington Management in 2001 and has managed the Portfolio since 2023.
TAXES AND INTERMEDIARY COMPENSATION
For important information about taxes, dividends and financial intermediary compensation, please see “SUMMARY OF IMPORTANT INFORMATION REGARDING THE PORTFOLIOS” on page 123 of the Northwestern Mutual Series Fund, Inc. Prospectus.
Northwestern Mutual Series Fund, Inc. Prospectus 42
Index 600 Stock Portfolio – Summary
| |
|
| |
|
| Management Fee |
|
| Distribution and Service (12b-1) Fees |
|
| Other Expenses |
|
| Total Annual Portfolio Operating Expenses |
|
| 1 Year |
3 Years |
5 Years |
10 Years |
| $ |
$ |
$ |
$ |
43 Northwestern Mutual Series Fund, Inc. Prospectus
Index 600 Stock Portfolio – Summary
PRINCIPAL RISKS
Northwestern Mutual Series Fund, Inc. Prospectus 44
Index 600 Stock Portfolio – Summary
| |
|
|
| |
|
|
| |
|
|
(for periods ended December 31, 2025)
| |
|
1 Yr |
5 Yr |
10 Yr |
| Portfolio: |
Index 600 Stock Portfolio |
|
|
|
| Strategy Index: |
S&P SmallCap 600® Index (reflects no deduction for fees, expenses or taxes) |
|
|
|
| Broad-Based Index: |
S&P 500® Index (reflects no deduction for fees, expenses or taxes) |
|
|
|
PORTFOLIO MANAGEMENT
Investment Adviser: Mason Street Advisors, LLC
Sub-Adviser: Northern Trust Investments, Inc. (Northern Trust)
Portfolio Managers: Keith Carroll, Portfolio Manager, joined Northern Trust in 2007 and has managed the Portfolio since 2021.
Lucy Johnston, Portfolio Manager, joined Northern Trust in 1997 and has managed the Portfolio since 2024.
Sub-Adviser: Northern Trust Investments, Inc. (Northern Trust)
Portfolio Managers: Keith Carroll, Portfolio Manager, joined Northern Trust in 2007 and has managed the Portfolio since 2021.
Lucy Johnston, Portfolio Manager, joined Northern Trust in 1997 and has managed the Portfolio since 2024.
TAXES AND INTERMEDIARY COMPENSATION
For important information about taxes, dividends and financial intermediary compensation, please see “SUMMARY OF IMPORTANT INFORMATION REGARDING THE PORTFOLIOS” on page 123 of the Northwestern Mutual Series Fund, Inc. Prospectus.
45 Northwestern Mutual Series Fund, Inc. Prospectus
Small Cap Value Portfolio – Summary
| |
|
| |
|
| Management Fee |
|
| Distribution and Service (12b-1) Fees |
|
| Other Expenses |
|
| Total Annual Portfolio Operating Expenses |
|
| Fee Waiver(1) |
( |
| Total Annual Portfolio Operating Expenses After Fee Waiver(1) |
|
(1)
| 1 Year |
3 Years |
5 Years |
10 Years |
| $ |
$ |
$ |
$ |
Northwestern Mutual Series Fund, Inc. Prospectus 46
Small Cap Value Portfolio – Summary
PRINCIPAL RISKS
47 Northwestern Mutual Series Fund, Inc. Prospectus
Small Cap Value Portfolio – Summary
| |
|
|
| |
|
|
| |
|
|
(for periods ended December 31, 2025)
| |
|
1 Yr |
5 Yr |
10 Yr |
| Portfolio: |
Small Cap Value Portfolio |
|
|
|
| Strategy Index: |
Russell 2000® Value Index (reflects no deduction for fees, expenses or taxes) |
|
|
|
| Broad-Based Index: |
S&P 500® Index (reflects no deduction for fees, expenses or taxes) |
|
|
|
PORTFOLIO MANAGEMENT
Investment Adviser: Mason Street Advisors, LLC
Sub-Adviser: T. Rowe Price Investment Management, Inc. (TRPIM)
Portfolio Manager: J. David Wagner, CFA, a Vice President of TRPIM, has managed the Portfolio in his capacity with TRPIM since 2022 and had managed the Portfolio in his capacity with T. Rowe Price Associates, Inc. since 2014. Mr. Wagner joined T. Rowe Price in 2000.
Northwestern Mutual Series Fund, Inc. Prospectus 48
Small Cap Value Portfolio – Summary
TAXES AND INTERMEDIARY COMPENSATION
For important information about taxes, dividends and financial intermediary compensation, please see “SUMMARY OF IMPORTANT INFORMATION REGARDING THE PORTFOLIOS” on page 123 of the Northwestern Mutual Series Fund, Inc. Prospectus.
49 Northwestern Mutual Series Fund, Inc. Prospectus
International Growth Portfolio – Summary
| |
|
| |
|
| Management Fee |
|
| Distribution and Service (12b-1) Fees |
|
| Other Expenses |
|
| Total Annual Portfolio Operating Expenses |
|
| Fee Waiver(1) |
( |
| Total Annual Portfolio Operating Expenses After Fee Waiver(1) |
|
(1)
| 1 Year |
3 Years |
5 Years |
10 Years |
| $ |
$ |
$ |
$ |
Northwestern Mutual Series Fund, Inc. Prospectus 50
International Growth Portfolio – Summary
PRINCIPAL RISKS
51 Northwestern Mutual Series Fund, Inc. Prospectus
International Growth Portfolio – Summary
Northwestern Mutual Series Fund, Inc. Prospectus 52
International Growth Portfolio – Summary
| |
|
|
| |
|
|
| |
|
|
(for periods ended December 31, 2025)
| |
|
1 Yr |
5 Yr |
10 Yr |
| Portfolio: |
International Growth Portfolio |
|
|
|
| Strategy Index: |
MSCI EAFE® Growth Index (Net) (reflects no deduction for fees, expenses or taxes) |
|
|
|
| Broad-Based Index: |
MSCI® All Country World (ex- US) Index (Net) (reflects no deduction for fees, expenses or taxes) |
|
|
|
PORTFOLIO MANAGEMENT
Investment Adviser: Mason Street Advisors, LLC
Sub-Adviser: FIAM LLC (FIAM)
Portfolio Manager: Jed Weiss, Portfolio Manager, has managed the Portfolio since 2015.
Sub-Adviser: FIAM LLC (FIAM)
Portfolio Manager: Jed Weiss, Portfolio Manager, has managed the Portfolio since 2015.
TAXES AND INTERMEDIARY COMPENSATION
For important information about taxes, dividends and financial intermediary compensation, please see “SUMMARY OF IMPORTANT INFORMATION REGARDING THE PORTFOLIOS” on page 123 of the Northwestern Mutual Series Fund, Inc. Prospectus.
53 Northwestern Mutual Series Fund, Inc. Prospectus
Research International Core Portfolio – Summary
| |
|
| |
|
| Management Fee |
|
| Distribution and Service (12b-1) Fees |
|
| Other Expenses |
|
| Total Annual Portfolio Operating Expenses |
|
| Fee Waiver(1),(2) |
( |
| Total Annual Portfolio Operating Expenses After Fee Waiver(1),(2) |
|
(1)
(2)
| 1 Year |
3 Years |
5 Years |
10 Years |
| $ |
$ |
$ |
$ |
Northwestern Mutual Series Fund, Inc. Prospectus 54
Research International Core Portfolio – Summary
PRINCIPAL RISKS
55 Northwestern Mutual Series Fund, Inc. Prospectus
Research International Core Portfolio – Summary
| |
|
|
| |
|
|
| |
|
|
(for periods ended December 31, 2025)
| |
|
1 Yr |
5 Yr |
10 Yr |
| Portfolio: |
Research International Core Portfolio |
|
|
|
| Strategy Index: |
MSCI EAFE® Index (Net) (reflects no deduction for fees, expenses or taxes) |
|
|
|
| Broad-Based Index: |
MSCI® All Country World (ex- US) Index (Net) (reflects no deduction for fees, expenses or taxes) |
|
|
|
Northwestern Mutual Series Fund, Inc. Prospectus 56
Research International Core Portfolio – Summary
PORTFOLIO MANAGEMENT
Investment Adviser: Mason Street Advisors, LLC
Sub-Adviser: Massachusetts Financial Services Company (MFS®)
Portfolio Managers: John Mahoney, CFA, Investment Officer of MFS, joined MFS in 2005 and has managed the Portfolio since 2024.
Nicholas Paul, CFA, Investment Officer of MFS, joined MFS in 2010 and has managed the Portfolio since 2022.
Sub-Adviser: Massachusetts Financial Services Company (MFS®)
Portfolio Managers: John Mahoney, CFA, Investment Officer of MFS, joined MFS in 2005 and has managed the Portfolio since 2024.
Nicholas Paul, CFA, Investment Officer of MFS, joined MFS in 2010 and has managed the Portfolio since 2022.
TAXES AND INTERMEDIARY COMPENSATION
For important information about taxes, dividends and financial intermediary compensation, please see “SUMMARY OF IMPORTANT INFORMATION REGARDING THE PORTFOLIOS” on page 123 of the Northwestern Mutual Series Fund, Inc. Prospectus.
57 Northwestern Mutual Series Fund, Inc. Prospectus
International Equity Portfolio – Summary
| |
|
| |
|
| Management Fee |
|
| Distribution and Service (12b-1) Fees |
|
| Other Expenses |
|
| Total Annual Portfolio Operating Expenses |
|
| Fee Waiver(1) |
|
| Total Annual Portfolio Operating Expenses After Fee Waiver(1) |
|
(1)
| 1 Year |
3 Years |
5 Years |
10 Years |
| $ |
$ |
$ |
$ |
Northwestern Mutual Series Fund, Inc. Prospectus 58
International Equity Portfolio – Summary
PRINCIPAL RISKS
59 Northwestern Mutual Series Fund, Inc. Prospectus
International Equity Portfolio – Summary
Northwestern Mutual Series Fund, Inc. Prospectus 60
International Equity Portfolio – Summary
| |
|
|
| |
|
|
| |
|
|
(for periods ended December 31, 2025)
| |
|
1 Yr |
5 Yr |
10 Yr |
| Portfolio: |
International Equity Portfolio |
|
|
|
| Strategy Index: |
MSCI® All Country World (ex- US) Value Index (Net) (reflects no deduction for fees, expenses or taxes) |
|
|
|
| Broad-Based Index: |
MSCI® All Country World (ex- US) Index (Net) (reflects no deduction for fees, expenses or taxes) |
|
|
|
PORTFOLIO MANAGEMENT
Investment Adviser: Mason Street Advisors, LLC
Sub-Adviser: Dodge & Cox
Portfolio Managers: The Portfolio is managed by Dodge & Cox’s International Equity Investment Committee (“IEIC”), whose members are jointly and primarily responsible for the management of the Portfolio. The IEIC consists of the following members:
Roger G. Kuo, CFA, Chief Executive Officer, President, Director, and Research Analyst, joined Dodge & Cox in 1998 and has been an IEIC member since 2006 and has managed the Portfolio since 2021.
Englebert T. Bangayan, CFA, Vice President and Research Analyst, joined Dodge & Cox in 2002 and has been an IEIC member since 2015 and has managed of the Portfolio since 2021.
Sophie Chen, CFA, Vice President and Research Analyst, joined Dodge & Cox in 2012 and has been an IEIC member since 2024 and has managed the Portfolio since 2024.
David C. Hoeft CFA, Chair, Senior Vice President, Director, Chief Investment Officer, joined Dodge & Cox in 1993 and has been an IEIC member since 2025 and has managed the Portfolio since 2025.
Raymond J. Mertens, CFA, Senior Vice President and Director, and Research Analyst, joined Dodge & Cox in 2003 and has been an IEIC member since 2018 and has managed the Portfolio since 2021.
Paritosh Somani, CFA, Vice President and Research Analyst, joined Dodge & Cox in 2007 and has been an IEIC member since 2021 and has managed the Portfolio since 2021.
TAXES AND INTERMEDIARY COMPENSATION
For important information about taxes, dividends and financial intermediary compensation, please see “SUMMARY OF IMPORTANT INFORMATION REGARDING THE PORTFOLIOS” on page 123 of the Northwestern Mutual Series Fund, Inc. Prospectus.
61 Northwestern Mutual Series Fund, Inc. Prospectus
Emerging Markets Equity Portfolio – Summary
| |
|
| |
|
| Management Fee |
|
| Distribution and Service (12b-1) Fees |
|
| Other Expenses |
|
| Total Annual Portfolio Operating Expenses |
|
| Fee Waiver(1),(2) |
( |
| Total Annual Portfolio Operating Expenses After Fee Waiver(1),(2) |
|
(1)
(2)
| 1 Year |
3 Years |
5 Years |
10 Years |
| $ |
$ |
$ |
$ |
Northwestern Mutual Series Fund, Inc. Prospectus 62
Emerging Markets Equity Portfolio – Summary
PRINCIPAL RISKS
63 Northwestern Mutual Series Fund, Inc. Prospectus
Emerging Markets Equity Portfolio – Summary
Northwestern Mutual Series Fund, Inc. Prospectus 64
Emerging Markets Equity Portfolio – Summary
| |
|
|
| |
|
|
| |
|
|
(for periods ended December 31, 2025)
| |
|
1 Yr |
5 Yr |
10 Yr |
| Portfolio: |
Emerging Markets Equity Portfolio |
|
|
|
| Broad-Based Index: |
MSCI® Emerging Markets Index (Net) (reflects no deduction for fees, expenses or taxes) |
|
|
|
PORTFOLIO MANAGEMENT
Investment Adviser: Mason Street Advisors, LLC
Sub-Adviser: abrdn Investments Limited (Aberdeen)
Portfolio Managers: The Portfolio is managed using a team-based approach, with the following team members being jointly and primarily responsible for the day-to-day management of the Portfolio:
Devan Kaloo, Global Head of Equities and Head of Global Emerging Markets Equities, has managed the Portfolio since 2017.
Nick Robinson, CFA, Senior Investment Director, has managed the Portfolio since February 2023.
TAXES AND INTERMEDIARY COMPENSATION
For important information about taxes, dividends and financial intermediary compensation, please see “SUMMARY OF IMPORTANT INFORMATION REGARDING THE PORTFOLIOS” on page 123 of the Northwestern Mutual Series Fund, Inc. Prospectus.
65 Northwestern Mutual Series Fund, Inc. Prospectus
Government Money Market Portfolio – Summary
| |
|
| |
|
| Management Fee |
|
| Distribution and Service (12b-1) Fees |
|
| Other Expenses |
|
| Total Annual Portfolio Operating Expenses |
|
| 1 Year |
3 Years |
5 Years |
10 Years |
| $ |
$ |
$ |
$ |
PRINCIPAL RISKS
The main risks of investing in this Portfolio are identified below.
Northwestern Mutual Series Fund, Inc. Prospectus 66
Government Money Market Portfolio – Summary
67 Northwestern Mutual Series Fund, Inc. Prospectus
Government Money Market Portfolio – Summary
| |
|
|
| |
|
|
| |
|
|
(for periods ended December 31, 2025)
| |
1 Yr |
5 Yr |
10 Yr |
| Government Money Market Portfolio |
|
|
|
PORTFOLIO MANAGEMENT
Investment Adviser: Mason Street Advisors, LLC
Sub-Adviser: BlackRock Advisors, LLC
Sub-Adviser: BlackRock Advisors, LLC
TAXES AND INTERMEDIARY COMPENSATION
For important information about taxes, dividends and financial intermediary compensation, please see “SUMMARY OF IMPORTANT INFORMATION REGARDING THE PORTFOLIOS” on page 123 of the Northwestern Mutual Series Fund, Inc. Prospectus.
Northwestern Mutual Series Fund, Inc. Prospectus 68
Short-Term Bond Portfolio – Summary
| |
|
| |
|
| Management Fee |
|
| Distribution and Service (12b-1) Fees |
|
| Other Expenses |
|
| Total Annual Portfolio Operating Expenses |
|
| 1 Year |
3 Years |
5 Years |
10 Years |
| $ |
$ |
$ |
$ |
69 Northwestern Mutual Series Fund, Inc. Prospectus
Short-Term Bond Portfolio – Summary
PRINCIPAL RISKS
Northwestern Mutual Series Fund, Inc. Prospectus 70
Short-Term Bond Portfolio – Summary
| |
|
|
| |
|
|
| |
|
|
(for periods ended December 31, 2025)
| |
|
1 Yr |
5 Yr |
10 Yr |
| Portfolio: |
Short-Term Bond Portfolio |
|
|
|
| Strategy Index: |
Bloomberg® 1-3 Year U.S. Government/Credit Bond Index (reflects no deduction for fees, expenses or taxes) |
|
|
|
| Broad-Based Index: |
Bloomberg® U.S. Aggregate Bond Index (reflects no deduction for fees, expenses or taxes) |
|
- |
|
71 Northwestern Mutual Series Fund, Inc. Prospectus
Short-Term Bond Portfolio – Summary
PORTFOLIO MANAGEMENT
Investment Adviser: Mason Street Advisors, LLC
Sub-Adviser: T. Rowe Price Associates, Inc. (TRPA)
Portfolio Manager: Michael F. Reinartz, CFA, Portfolio Manager and Chairman of TRPA’s Short-Term Bond Investment Advisory Committee, joined TRPA in 1996, began managing the Portfolio in 2015 and has co-managed the Portfolio since 2023.
Steve Kohlenstein, CFA, Portfolio Manager and Chairman of TRPA’s Short-Term Bond Investment Advisory Committee, joined TRPA in 1996, and has co-managed the Portfolio since 2023.
TAXES AND INTERMEDIARY COMPENSATION
For important information about taxes, dividends and financial intermediary compensation, please see “SUMMARY OF IMPORTANT INFORMATION REGARDING THE PORTFOLIOS” on page 123 of the Northwestern Mutual Series Fund, Inc. Prospectus.
Northwestern Mutual Series Fund, Inc. Prospectus 72
Select Bond Portfolio – Summary
| |
|
| |
|
| Management Fee |
|
| Distribution and Service (12b-1) Fees |
|
| Other Expenses |
|
| Total Annual Portfolio Operating Expenses |
|
| Fee Waiver(1) |
( |
| Total Annual Portfolio Operating Expenses After Fee Waiver(1) |
|
(1)
| 1 Year |
3 Years |
5 Years |
10 Years |
| $ |
$ |
$ |
$ |
73 Northwestern Mutual Series Fund, Inc. Prospectus
Select Bond Portfolio – Summary
PRINCIPAL RISKS
Northwestern Mutual Series Fund, Inc. Prospectus 74
Select Bond Portfolio – Summary
| |
|
|
| |
|
|
| |
|
|
(for periods ended December 31, 2025)
| |
|
1 Yr |
5 Yr |
10 Yr |
| Portfolio: |
Select Bond Portfolio |
|
- |
|
| Broad-Based Index: |
Bloomberg® U.S. Aggregate Bond Index (reflects no deduction for fees, expenses or taxes) |
|
- |
|
PORTFOLIO MANAGEMENT
Investment Adviser: Mason Street Advisors, LLC
Sub-Adviser: Allspring Global Investments, LLC (Allspring)
Portfolio Managers: Maulik Bhansali, CFA, Senior Portfolio Manager and Co-Head of the Core Fixed Income team at Allspring, has managed the Portfolio in his capacity with Allspring since 2021 and had managed the Portfolio in his capacity with the previous sub-adviser since 2017.
Jarad Vasquez, Senior Portfolio Manager and Co-Head of the Core Fixed Income team at Allspring, has managed the Portfolio in his capacity with Allspring since 2021, and had managed the Portfolio in his capacity with the previous sub-adviser since 2017.
75 Northwestern Mutual Series Fund, Inc. Prospectus
Select Bond Portfolio – Summary
TAXES AND INTERMEDIARY COMPENSATION
For important information about taxes, dividends and financial intermediary compensation, please see “SUMMARY OF IMPORTANT INFORMATION REGARDING THE PORTFOLIOS” on page 123 of the Northwestern Mutual Series Fund, Inc. Prospectus.
Northwestern Mutual Series Fund, Inc. Prospectus 76
Long-Term U.S. Government Bond Portfolio – Summary
| |
|
| |
|
| Management Fee |
|
| Distribution and Service (12b-1) Fees |
|
| Other Expenses(1) |
|
| Interest Expense |
|
| Other Operating Expense |
|
| Total Annual Portfolio Operating Expenses(1) |
|
| Expense Reimbursement(2) |
( |
| Total Annual Portfolio Operating Expenses After Expense Reimbursement(1),(2) |
|
(1)
(2)
| 1 Year |
3 Years |
5 Years |
10 Years |
| $ |
$ |
$ |
$ |
77 Northwestern Mutual Series Fund, Inc. Prospectus
Long-Term U.S. Government Bond Portfolio – Summary
PRINCIPAL RISKS
Northwestern Mutual Series Fund, Inc. Prospectus 78
Long-Term U.S. Government Bond Portfolio – Summary
79 Northwestern Mutual Series Fund, Inc. Prospectus
Long-Term U.S. Government Bond Portfolio – Summary
| |
|
|
| |
|
|
| |
|
|
(for periods ended December 31, 2025)
| |
|
1 Yr |
5 Yr |
10 Yr |
| Portfolio: |
Long-Term U.S. Government Bond Portfolio |
|
- |
- |
| Strategy Index: |
Bloomberg® Long-Term Treasury Index |
|
- |
|
| Broad-Based Index: |
Bloomberg® U.S. Aggregate Bond Index (reflects no deduction for fees, expenses or taxes) |
|
- |
|
Northwestern Mutual Series Fund, Inc. Prospectus 80
Long-Term U.S. Government Bond Portfolio – Summary
PORTFOLIO MANAGEMENT
Investment Adviser: Mason Street Advisors, LLC
Sub-Adviser: Pacific Investment Management Company LLC (PIMCO)
Portfolio Managers: Michael Cudzil joined PIMCO in 2012 and is a Managing Director in PIMCO’s Newport Beach office. He has managed the Portfolio since 2016.
Tim Crowley joined PIMCO in 2008 and is an Executive Vice President in PIMCO’s Newport Beach office. He has managed the Portfolio since 2025.
TAXES AND INTERMEDIARY COMPENSATION
For important information about taxes, dividends and financial intermediary compensation, please see “SUMMARY OF IMPORTANT INFORMATION REGARDING THE PORTFOLIOS” on page 123 of the Northwestern Mutual Series Fund, Inc. Prospectus.
81 Northwestern Mutual Series Fund, Inc. Prospectus
Inflation Managed Portfolio (formerly Inflation Protection Portfolio) – Summary
| |
|
| |
|
| Management Fee |
|
| Distribution and Service (12b-1) Fees |
|
| Other Expenses |
|
| Total Annual Portfolio Operating Expenses |
|
| Fee Waiver(1) |
( |
| Total Annual Portfolio Operating Expenses After Fee Waiver(1) |
|
(1)
| 1 Year |
3 Years |
5 Years |
10 Years |
| $ |
$ |
$ |
$ |
Northwestern Mutual Series Fund, Inc. Prospectus 82
Inflation Managed Portfolio (formerly Inflation Protection Portfolio) – Summary
PRINCIPAL RISKS
83 Northwestern Mutual Series Fund, Inc. Prospectus
Inflation Managed Portfolio (formerly Inflation Protection Portfolio) – Summary
sensitive to changes in interest rates than a portfolio with a shorter average portfolio duration. For example, the market value of a fixed income portfolio with an average duration of five years generally would be expected to fall approximately 5% if interest rates rose by one percentage point. Declining interest rates may increase the risk that an issuer calls outstanding securities prior to their maturity.
Northwestern Mutual Series Fund, Inc. Prospectus 84
Inflation Managed Portfolio (formerly Inflation Protection Portfolio) – Summary
| |
|
|
| |
|
|
| |
|
|
(for periods ended December 31, 2025)
| |
|
1 Yr |
5 Yr |
10 Yr |
| Portfolio: |
Inflation Managed Portfolio |
|
|
|
| Strategy Index: |
Bloomberg® U.S. Treasury Inflation Protected Securities (TIPS) Index (reflects no deduction for fees, expenses or taxes) |
|
|
|
| Broad-Based Index: |
Bloomberg® U.S. Aggregate Bond Index (reflects no deduction for fees, expenses or taxes) |
|
- |
|
PORTFOLIO MANAGEMENT
Investment Adviser: Mason Street Advisors, LLC
Sub-Adviser: American Century Investment Management, Inc. (American Century)
Portfolio Managers: James E. Platz, CFA, Vice President and Portfolio Manager, has served American Century as a portfolio manager since 2003 and has managed the Portfolio since 2008.
Miguel Castillo, Vice President and Portfolio Manager, has served American Century as a portfolio manager since 2014 and has managed the Portfolio since 2015.
Stephen Bartolini, CFA, Vice President and Portfolio Manager, has served American Century as a portfolio manager since 2024 and has managed the Portfolio since 2024.
TAXES AND INTERMEDIARY COMPENSATION
For important information about taxes, dividends and financial intermediary compensation, please see “SUMMARY OF IMPORTANT INFORMATION REGARDING THE PORTFOLIOS” on page 123 of the Northwestern Mutual Series Fund, Inc. Prospectus.
85 Northwestern Mutual Series Fund, Inc. Prospectus
High Yield Bond Portfolio – Summary
| |
|
| |
|
| Management Fee |
|
| Distribution and Service (12b-1) Fees |
|
| Other Expenses |
|
| Total Annual Portfolio Operating Expenses |
|
| 1 Year |
3 Years |
5 Years |
10 Years |
| $ |
$ |
$ |
$ |
PRINCIPAL RISKS
Northwestern Mutual Series Fund, Inc. Prospectus 86
High Yield Bond Portfolio – Summary
87 Northwestern Mutual Series Fund, Inc. Prospectus
High Yield Bond Portfolio – Summary
| |
|
|
| |
|
|
| |
|
|
(for periods ended December 31, 2025)
| |
|
1 Yr |
5 Yr |
10 Yr |
| Portfolio: |
High Yield Bond Portfolio |
|
|
|
| Strategy Index: |
Bloomberg® U.S. Corporate High Yield 2% Issuer Capped Index (reflects no deduction for fees, expenses or taxes) |
|
|
|
| Broad-Based Index: |
Bloomberg® U.S. Aggregate Bond Index (reflects no deduction for fees, expenses or taxes) |
|
- |
|
PORTFOLIO MANAGEMENT
Investment Adviser: Mason Street Advisors, LLC
Sub-Adviser: Federated Investment Management Company (Federated)
Portfolio Manager: Mark E. Durbiano, CFA, Senior Portfolio Manager and Senior Vice President of Federated, has been with Federated since 1982 and has managed the Portfolio since 2014.
Kathryn Glass, CFA, Portfolio Manager and Vice President of Federated, has been with Federated since 1999 and has managed the Portfolio since 2024.
Thomas Scherr, CFA, Portfolio Manager and Vice President of Federated, has been with Federated since 2006 and has managed the Portfolio since 2024.
Randal Stuckwish, CFA, Portfolio Manager and Vice President of Federated, has been with Federated since 2013 and has managed the Portfolio since 2024.
TAXES AND INTERMEDIARY COMPENSATION
For important information about taxes, dividends and financial intermediary compensation, please see “SUMMARY OF IMPORTANT INFORMATION REGARDING THE PORTFOLIOS” on page 123 of the Northwestern Mutual Series Fund, Inc. Prospectus.
Northwestern Mutual Series Fund, Inc. Prospectus 88
Multi-Sector Bond Portfolio – Summary
| |
|
| |
|
| Management Fee |
|
| Distribution and Service (12b-1) Fees |
|
| Other Expenses(1) |
|
| Interest Expense |
|
| Other Operating Expense |
|
| Total Annual Portfolio Operating Expenses |
|
| Fee Waiver(2) |
( |
| Total Annual Portfolio Operating Expenses After Fee Waiver(1),(2) |
|
(1)
(2)
| 1 Year |
3 Years |
5 Years |
10 Years |
| $ |
$ |
$ |
$ |
89 Northwestern Mutual Series Fund, Inc. Prospectus
Multi-Sector Bond Portfolio – Summary
PRINCIPAL RISKS
Northwestern Mutual Series Fund, Inc. Prospectus 90
Multi-Sector Bond Portfolio – Summary
91 Northwestern Mutual Series Fund, Inc. Prospectus
Multi-Sector Bond Portfolio – Summary
Northwestern Mutual Series Fund, Inc. Prospectus 92
Multi-Sector Bond Portfolio – Summary
| |
|
|
| |
|
|
| |
|
|
(for periods ended December 31, 2025)
| |
|
1 Yr |
5 Yr |
10 Yr |
| Portfolio: |
Multi-Sector Bond Portfolio |
|
|
|
| Strategy Index: |
1/3 each: Bloomberg® Global Aggregate — Credit Component ex Emerging Markets, Hedged USD; ICE BofA® Global High Yield BB-B Rated Constrained Developed Markets Index, Hedged USD; JP Morgan® EMBI Global (reflects no deduction for fees, expenses or taxes) |
|
|
|
| Broad-Based Index: |
Bloomberg® Global Aggregate Index (reflects no deduction for fees, expenses or taxes) |
|
- |
|
PORTFOLIO MANAGEMENT
Investment Adviser: Mason Street Advisors, LLC
Sub-Adviser: Pacific Investment Management Company LLC (PIMCO)
Portfolio Managers: Sonali Pier, Managing Director of PIMCO, joined PIMCO in 2013 and has managed the Portfolio since 2018.
Daniel J. Ivascyn, Group Chief Investment Officer and Managing Director of PIMCO, joined PIMCO in 1998 and has managed the Portfolio since 2016.
Alfred T. Murata, Managing Director of PIMCO, joined PIMCO in 2001 and has managed the Portfolio since 2016.
Charles Watford, Executive Vice President of PIMCO, joined PIMCO in 2007, and has managed the Portfolio since 2022.
Regina Borromeo, Executive Vice President of PIMCO, joined PIMCO in 2022, and has managed the Portfolio since 2022.
TAXES AND INTERMEDIARY COMPENSATION
For important information about taxes, dividends and financial intermediary compensation, please see “SUMMARY OF IMPORTANT INFORMATION REGARDING THE PORTFOLIOS” on page 123 of the Northwestern Mutual Series Fund, Inc. Prospectus.
93 Northwestern Mutual Series Fund, Inc. Prospectus
Active/Passive Very Aggressive Portfolio (formerly Active/Passive All Equity
Portfolio) – Summary
| |
|
| |
|
| Management Fee |
|
| Distribution and Service (12b-1) Fees |
|
| Other Expenses |
|
| Acquired Fund Fees and Expenses |
|
| Total Annual Portfolio Operating Expenses(1) |
|
| Fee Waiver and Expense Reimbursement(2) |
( |
| Total Annual Portfolio Operating Expenses After Fee Waiver and Expense Reimbursement(1),(2) |
|
(1)
(2)
| 1 Year |
3 Years |
5 Years |
10 Years |
| $ |
$ |
$ |
$ |
Northwestern Mutual Series Fund, Inc. Prospectus 94
Active/Passive Very Aggressive Portfolio (formerly Active/Passive All Equity Portfolio) – Summary
| |
|
|
|
| |
|
|
|
PRINCIPAL RISKS
95 Northwestern Mutual Series Fund, Inc. Prospectus
Active/Passive Very Aggressive Portfolio (formerly Active/Passive All Equity
Portfolio) – Summary
Northwestern Mutual Series Fund, Inc. Prospectus 96
Active/Passive Very Aggressive Portfolio (formerly Active/Passive All Equity Portfolio) – Summary
97 Northwestern Mutual Series Fund, Inc. Prospectus
Active/Passive Very Aggressive Portfolio (formerly Active/Passive All Equity
Portfolio) – Summary
PORTFOLIO MANAGEMENT
Investment Adviser: Mason Street Advisors, LLC (MSA)
Portfolio Managers: James Fleming, CFA, Portfolio Manager of MSA, joined MSA in 2008 and has managed the Portfolio since 2025.
Rodney Schmucker, CFA, Senior Research & Portfolio Analyst of MSA, joined MSA in 2008 and has managed the Portfolio since 2025.
Brent G. Schutte, CFA, Chief Investment Officer of MSA, joined MSA in December 2021 and has managed the Portfolio since 2025.
Garrett D. Aird, CFA, Vice President of MSA, joined MSA in December 2021 and has managed the Portfolio since 2025.
TAXES AND INTERMEDIARY COMPENSATION
For important information about taxes, dividends and financial intermediary compensation, please see “SUMMARY OF IMPORTANT INFORMATION REGARDING THE PORTFOLIOS” on page 123 of the Northwestern Mutual Series Fund, Inc. Prospectus.
Northwestern Mutual Series Fund, Inc. Prospectus 98
Active/Passive Aggressive Portfolio – Summary
| |
|
| |
|
| Management Fee |
|
| Distribution and Service (12b-1) Fees |
|
| Other Expenses |
|
| Acquired Fund Fees and Expenses |
|
| Total Annual Portfolio Operating Expenses(1) |
|
| Fee Waiver and Expense Reimbursement(2) |
( |
| Total Annual Portfolio Operating Expenses After Fee Waiver and Expense Reimbursement(1),(2) |
|
(1)
(2)
| 1 Year |
3 Years |
5 Years |
10 Years |
| $ |
$ |
$ |
$ |
99 Northwestern Mutual Series Fund, Inc. Prospectus
Active/Passive Aggressive Portfolio – Summary
| |
|
|
|
| |
|
|
|
PRINCIPAL RISKS
Northwestern Mutual Series Fund, Inc. Prospectus 100
Active/Passive Aggressive Portfolio – Summary
101 Northwestern Mutual Series Fund, Inc. Prospectus
Active/Passive Aggressive Portfolio – Summary
Northwestern Mutual Series Fund, Inc. Prospectus 102
Active/Passive Aggressive Portfolio – Summary
PORTFOLIO MANAGEMENT
Investment Adviser: Mason Street Advisors, LLC (MSA)
Portfolio Managers: James Fleming, CFA, Portfolio Manager of MSA, joined MSA in 2008 and has managed the Portfolio since 2025.
Rodney Schmucker, CFA, Senior Research & Portfolio Analyst of MSA, joined MSA in 2008 and has managed the Portfolio since 2025.
Portfolio Managers: James Fleming, CFA, Portfolio Manager of MSA, joined MSA in 2008 and has managed the Portfolio since 2025.
Rodney Schmucker, CFA, Senior Research & Portfolio Analyst of MSA, joined MSA in 2008 and has managed the Portfolio since 2025.
103 Northwestern Mutual Series Fund, Inc. Prospectus
Active/Passive Aggressive Portfolio – Summary
Brent G. Schutte, CFA, Chief Investment Officer of MSA, joined MSA in December 2021 and has managed the Portfolio since 2025.
Garrett D. Aird, CFA, Vice President of MSA, joined MSA in December 2021 and has managed the Portfolio since 2025.
TAXES AND INTERMEDIARY COMPENSATION
For important information about taxes, dividends and financial intermediary compensation, please see “SUMMARY OF IMPORTANT INFORMATION REGARDING THE PORTFOLIOS” on page 123 of the Northwestern Mutual Series Fund, Inc. Prospectus.
Northwestern Mutual Series Fund, Inc. Prospectus 104
Active/Passive Moderate Portfolio (formerly Asset Allocation Portfolio) – Summary
| |
|
| |
|
| Management Fee(1) |
|
| Distribution and Service (12b-1) Fees |
|
| Other Expenses |
|
| Acquired Fund Fees and Expenses |
|
| Total Annual Portfolio Operating Expenses(2) |
|
| Fee Waiver(1),(3) |
( |
| Total Annual Portfolio Operating Expenses After Fee Waiver(1),(2),(3) |
|
(1)
(2)
(3)
| 1 Year |
3 Years |
5 Years |
10 Years |
| $ |
$ |
$ |
$ |
105 Northwestern Mutual Series Fund, Inc. Prospectus
Active/Passive Moderate Portfolio (formerly Asset Allocation Portfolio) – Summary
| |
|
|
|
| |
|
|
|
PRINCIPAL RISKS
Northwestern Mutual Series Fund, Inc. Prospectus 106
Active/Passive Moderate Portfolio (formerly Asset Allocation Portfolio) – Summary
107 Northwestern Mutual Series Fund, Inc. Prospectus
Active/Passive Moderate Portfolio (formerly Asset Allocation Portfolio) – Summary
Northwestern Mutual Series Fund, Inc. Prospectus 108
Active/Passive Moderate Portfolio (formerly Asset Allocation Portfolio) – Summary
109 Northwestern Mutual Series Fund, Inc. Prospectus
Active/Passive Moderate Portfolio (formerly Asset Allocation Portfolio) – Summary
| |
|
|
| |
|
|
| |
|
|
(for periods ended December 31, 2025)
| |
|
1 Yr |
5 Yr |
10 Yr |
| Portfolio: |
Active/Passive Moderate Portfolio |
|
|
|
| Strategy Index: |
Active/Passive Moderate Portfolio Blended Composite Benchmark: S&P 500® Index (28%), S&P 400® MidCap Index (7%), S&P SmallCap 600® Index (3%), MSCI EAFE® Index (15%), MSCI® Emerging Markets Index (6%), Dow Jones U.S. Select REIT Index (4%), Bloomberg® Commodity IndexSM (5%), Bloomberg® Barclays U.S. Aggregate Bond Index (30%), and ICE of BofA® US 3-Month Treasury Bill Index (2%) |
|
|
|
| Broad-Based Index: |
Bloomberg® U.S. Aggregate Bond Index (reflects no deduction for fees, expenses or taxes) |
|
- |
|
| Broad-Based Index: |
S&P 500® Index (reflects no deduction for fees, expenses or taxes) |
|
|
|
PORTFOLIO MANAGEMENT
Investment Adviser: Mason Street Advisors, LLC (MSA)
Portfolio Managers: James Fleming, CFA, Portfolio Manager of MSA, joined MSA in 2008 and has managed the Portfolio since 2025.
Rodney Schmucker, CFA, Senior Research & Portfolio Analyst of MSA, joined MSA in 2008 and has managed the Portfolio since 2025.
Brent G. Schutte, CFA, Chief Investment Officer of MSA, joined MSA in December 2021 and has managed the Portfolio since 2025.
Garrett D. Aird, CFA, Vice President of MSA, joined MSA in December 2021 and has managed the Portfolio since 2025.
TAXES AND INTERMEDIARY COMPENSATION
For important information about taxes, dividends and financial intermediary compensation, please see “SUMMARY OF IMPORTANT INFORMATION REGARDING THE PORTFOLIOS” on page 123 of the Northwestern Mutual Series Fund, Inc. Prospectus.
Northwestern Mutual Series Fund, Inc. Prospectus 110
Active/Passive Balanced Portfolio (formerly Balanced Portfolio) – Summary
| |
|
| |
|
| Management Fee(1) |
|
| Distribution and Service (12b-1) Fees |
|
| Other Expenses |
|
| Acquired Fund Fees and Expenses |
|
| Total Annual Portfolio Operating Expenses(2) |
|
| Fee Waiver(1),(3) |
( |
| Total Annual Portfolio Operating Expenses After Fee Waiver(1),(2),(3) |
|
(1)
(2)
(3)
| 1 Year |
3 Years |
5 Years |
10 Years |
| $ |
$ |
$ |
$ |
111 Northwestern Mutual Series Fund, Inc. Prospectus
Active/Passive Balanced Portfolio (formerly Balanced Portfolio) – Summary
| |
|
|
|
| |
|
|
|
PRINCIPAL RISKS
Northwestern Mutual Series Fund, Inc. Prospectus 112
Active/Passive Balanced Portfolio (formerly Balanced Portfolio) – Summary
113 Northwestern Mutual Series Fund, Inc. Prospectus
Active/Passive Balanced Portfolio (formerly Balanced Portfolio) – Summary
Northwestern Mutual Series Fund, Inc. Prospectus 114
Active/Passive Balanced Portfolio (formerly Balanced Portfolio) – Summary
115 Northwestern Mutual Series Fund, Inc. Prospectus
Active/Passive Balanced Portfolio (formerly Balanced Portfolio) – Summary
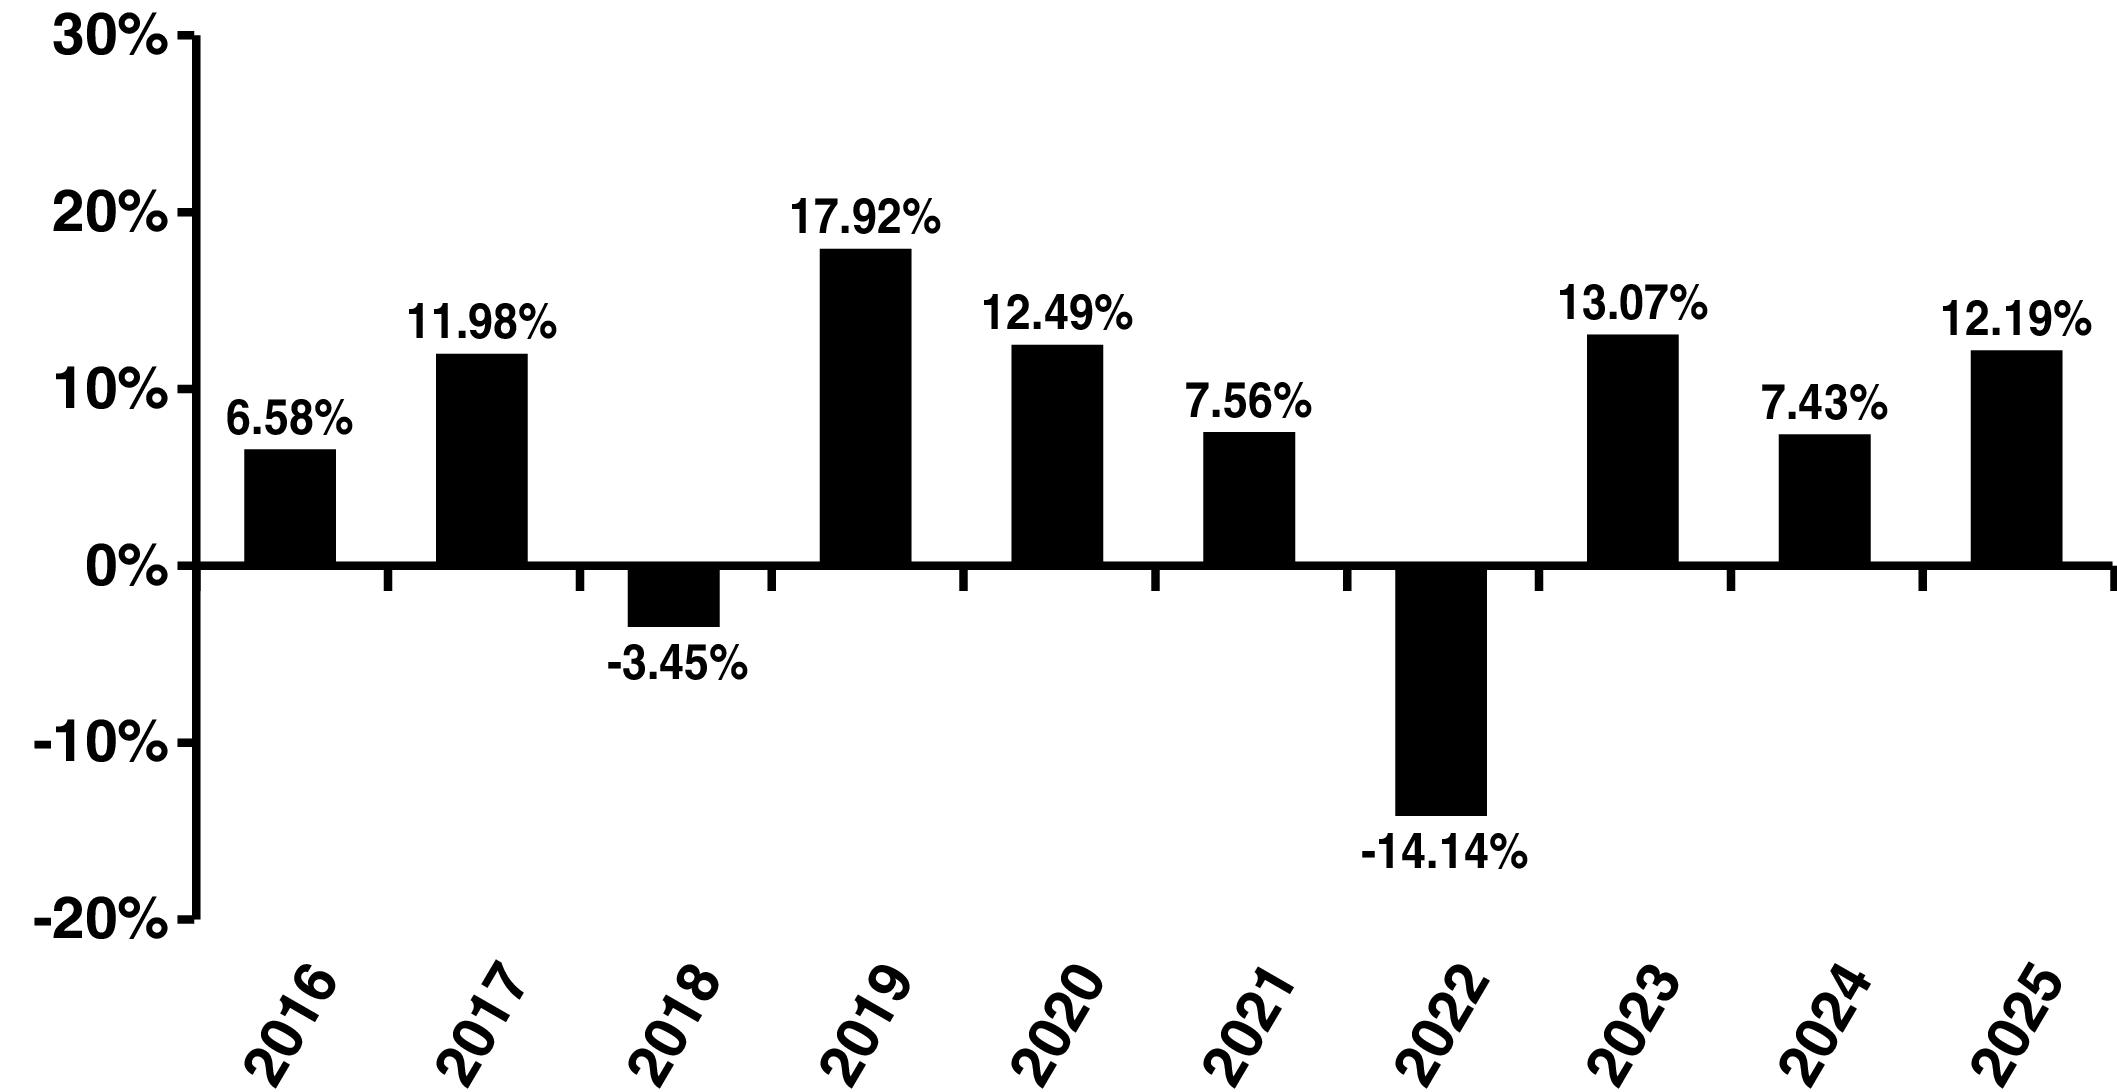
| |
|
|
| |
|
|
| |
|
|
(for periods ended December 31, 2025)
| |
|
1 Yr |
5 Yr |
10 Yr |
| Portfolio: |
Active/Passive Balanced Portfolio |
|
|
|
| Strategy Index: |
Active/Passive Balanced Portfolio Blended Composite Benchmark: S&P 500® Index (17%), S&P MidCap 400® Index (5%), S&P SmallCap 600® Index (3%), MSCI EAFE® Index (10%), MSCI® Emerging Markets Index (5%), Dow Jones U.S. Select REIT Index (4%), Bloomberg® Commodity IndexSM (4%), Bloomberg® Barclays U.S. Aggregate Bond Index (50%), and ICE of BofA® US 3-Month Treasury Bill Index (2%) |
|
|
|
| Broad-Based Index: |
S&P 500® Index (reflects no deduction for fees, expenses or taxes) |
|
|
|
| Broad-Based Index: |
Bloomberg® U.S. Aggregate Bond Index (reflects no deduction for fees, expenses or taxes) |
|
- |
|
PORTFOLIO MANAGEMENT
Investment Adviser: Mason Street Advisors, LLC (MSA)
Portfolio Managers: James Fleming, CFA, Portfolio Manager of MSA, joined MSA in 2008 and has managed the Portfolio since 2025.
Rodney Schmucker, CFA, Senior Research & Portfolio Analyst of MSA, joined MSA in 2008 and has managed the Portfolio since 2025.
Brent G. Schutte, CFA, Chief Investment Officer of MSA, joined MSA in December 2021 and has managed the Portfolio since 2025.
Garrett D. Aird, CFA, Vice President of MSA, joined MSA in December 2021 and has managed the Portfolio since 2025.
Portfolio Managers: James Fleming, CFA, Portfolio Manager of MSA, joined MSA in 2008 and has managed the Portfolio since 2025.
Rodney Schmucker, CFA, Senior Research & Portfolio Analyst of MSA, joined MSA in 2008 and has managed the Portfolio since 2025.
Brent G. Schutte, CFA, Chief Investment Officer of MSA, joined MSA in December 2021 and has managed the Portfolio since 2025.
Garrett D. Aird, CFA, Vice President of MSA, joined MSA in December 2021 and has managed the Portfolio since 2025.
TAXES AND INTERMEDIARY COMPENSATION
For important information about taxes, dividends and financial intermediary compensation, please see “SUMMARY OF IMPORTANT INFORMATION REGARDING THE PORTFOLIOS” on page 123 of the Northwestern Mutual Series Fund, Inc. Prospectus.
Northwestern Mutual Series Fund, Inc. Prospectus 116
Active/Passive Conservative Portfolio – Summary
| |
|
| |
|
| Management Fee |
|
| Distribution and Service (12b-1) Fees |
|
| Other Expenses |
|
| Acquired Fund Fees and Expenses |
|
| Total Annual Portfolio Operating Expenses(1) |
|
| Fee Waiver and Expense Reimbursement(2) |
( |
| Total Annual Portfolio Operating Expenses After Fee Waiver and Expense Reimbursement(1),(2) |
|
(1)
(2)
| 1 Year |
3 Years |
5 Years |
10 Years |
| $ |
$ |
$ |
$ |
117 Northwestern Mutual Series Fund, Inc. Prospectus
Active/Passive Conservative Portfolio – Summary
| |
|
|
|
| |
|
|
|
PRINCIPAL RISKS
Northwestern Mutual Series Fund, Inc. Prospectus 118
Active/Passive Conservative Portfolio – Summary
119 Northwestern Mutual Series Fund, Inc. Prospectus
Active/Passive Conservative Portfolio – Summary
Northwestern Mutual Series Fund, Inc. Prospectus 120
Active/Passive Conservative Portfolio – Summary
PORTFOLIO MANAGEMENT
Investment Adviser: Mason Street Advisors, LLC (MSA)
Portfolio Managers: James Fleming, CFA, Portfolio Manager of MSA, joined MSA in 2008 and has managed the Portfolio since 2025.
Rodney Schmucker, CFA, Senior Research & Portfolio Analyst of MSA, joined MSA in 2008 and has managed the Portfolio since 2025.
Portfolio Managers: James Fleming, CFA, Portfolio Manager of MSA, joined MSA in 2008 and has managed the Portfolio since 2025.
Rodney Schmucker, CFA, Senior Research & Portfolio Analyst of MSA, joined MSA in 2008 and has managed the Portfolio since 2025.
121 Northwestern Mutual Series Fund, Inc. Prospectus
Active/Passive Conservative Portfolio – Summary
Brent G. Schutte, CFA, Chief Investment Officer of MSA, joined MSA in December 2021 and has managed the Portfolio since 2025.
Garrett D. Aird, CFA, Vice President of MSA, joined MSA in December 2021 and has managed the Portfolio since 2025.
TAXES AND INTERMEDIARY COMPENSATION
For important information about taxes, dividends and financial intermediary compensation, please see “SUMMARY OF IMPORTANT INFORMATION REGARDING THE PORTFOLIOS” on page 123 of the Northwestern Mutual Series Fund, Inc. Prospectus.
Northwestern Mutual Series Fund, Inc. Prospectus 122
SUMMARY OF IMPORTANT INFORMATION REGARDING THE PORTFOLIOS
Tax Information: Shares of the Portfolios are offered only for funding variable annuity contracts and variable life insurance policies offered by The Northwestern Mutual Life Insurance Company through separate accounts. Insurance company separate accounts generally do not pay tax on dividends or capital gain distributions. Investors in variable annuity contracts and variable life insurance policies should refer to the prospectuses for the variable products for a discussion of the tax considerations that affect the insurance company and its separate accounts and the tax consequences to investors of owning such products.
Compensation to Broker-Dealers and Other Financial Intermediaries: Neither the Portfolios nor any related companies pay compensation to broker-dealers or other financial intermediaries for the sale of Portfolio shares or related services. Investors in variable annuity contracts and variable life insurance policies should refer to the prospectuses for the variable products for important information about compensation paid to financial intermediaries for sales of variable annuity contracts and variable life insurance policies.
INTRODUCTION
Northwestern Mutual Series Fund, Inc. (the “Fund”) is a mutual fund that offers its shares in separate investment portfolios, each of which is listed on the cover of this Prospectus (each, a “Portfolio” and collectively the “Portfolios”) and in the “PORTFOLIO SUMMARIES” section at the beginning of this Prospectus. Shares of the Portfolios are offered and sold only for funding variable annuity contracts (“Annuity Contracts”) and variable life insurance policies (“Life Insurance Policies”) offered by The Northwestern Mutual Life Insurance Company (“Northwestern Mutual”). The terms of the Annuity Contracts and Life Insurance Policies are described in separate offering documents for those products.
Mason Street Advisors, LLC (“Mason Street Advisors” or the “Adviser”) is the investment adviser for each Portfolio. To assist in managing certain Portfolios, Mason Street Advisors has retained certain sub-advisers (each, a “Sub-Adviser” or, with respect to those Portfolios for which it provides services, an “Adviser” and collectively, the “Sub-Advisers”). Pursuant to an exemptive order from the Securities and Exchange Commission that permits the Fund to employ a “manager of managers” structure, each such Sub-Adviser may be replaced
without the approval of shareholders. Information about the Adviser and each Sub-Adviser can be found in the “INVESTMENT ADVISER AND SUB-ADVISERS” section of this Prospectus.
Each Portfolio has its own investment objective and strategies for achieving that objective. Before investing, make sure the Portfolio’s objective matches your own. You can find a summary of each Portfolio’s investment objective, fees and expenses, principal investment strategies, principal risks, performance, and other important information under the “PORTFOLIO SUMMARIES” section of this Prospectus. For additional information about the Portfolios’ investment strategies and risks, please refer to the “MORE ABOUT INVESTMENT STRATEGIES AND RISKS” section of this Prospectus.
This Prospectus contains important information you should review before investing in a Portfolio. To obtain more information about the Portfolios, please refer to the back cover of this Prospectus.
123 Northwestern Mutual Series Fund, Inc. Prospectus
MORE ABOUT INVESTMENT STRATEGIES AND RISKS
General Information
This section includes information about the investment objectives and policies of the Portfolios and certain information about investing in the Portfolios. This section also includes additional information about the principal investment strategies of the Portfolios and associated risks described in the “PORTFOLIO SUMMARIES” section of this Prospectus. Although one or more Portfolios may employ the strategies described below as principal investment strategies, each other Portfolio may employ such strategies as non-principal strategies, unless otherwise noted. The Fund’s Statement of
Additional Information contains more detailed information about the investment strategies, securities and techniques that may be used by the Portfolios.
Investment Objectives. The table below lists the investment objective(s) of each Portfolio. The investment objective(s) of each of the Portfolios is non-fundamental, which means that it may be changed by the Fund’s Board of Directors without shareholder approval. Unless otherwise stated, all investment policies of the Portfolios may be changed by the Board of Directors without shareholder approval.
| Portfolio |
Objective |
Portfolio |
Objective |
| Growth Stock |
Long-term growth of capital. Current income is a secondary objective. |
Research International Core |
To seek capital appreciation. |
| Focused Appreciation |
Long-term growth of capital. |
International Equity |
Long-term growth of capital and income. |
| Large Cap Core Stock |
Long-term growth of capital and income. |
Emerging Markets Equity |
To seek capital appreciation. |
| Large Cap Blend |
To seek long-term growth of capital and income. |
Government Money Market |
To realize maximum current income to the extent consistent with liquidity and stability of capital. |
| Index 500 Stock |
To achieve investment results that approximate the performance of the S&P 500® Composite Stock Price Index. |
Short-Term Bond |
To provide as high a level of current income as is consistent with prudent investment risk. |
| Large Company Value |
To seek long-term capital growth. Income is a secondary objective. |
Select Bond |
To provide as high a level of total return as is consistent with prudent investment risk. A secondary objective is to seek preservation of shareholders’ capital. |
| Domestic Equity |
Long-term growth of capital and income. |
Long-Term U.S. Government Bond |
To seek maximum total return, consistent with preservation of capital and prudent investment management. |
| Equity Income |
Long-term growth of capital and income. |
Inflation Managed |
To pursue total return using a strategy that seeks to protect against U.S. inflation. |
| Mid Cap Growth Stock |
Long-term growth of capital. |
High Yield Bond |
To achieve high current income and capital appreciation. |
| Index 400 Stock |
To achieve investment results that approximate the performance of the S&P MidCap 400® Stock Price Index. |
Multi-Sector Bond |
To seek maximum total return, consistent with prudent investment management. |
Northwestern Mutual Series Fund, Inc. Prospectus 124
| Portfolio |
Objective |
Portfolio |
Objective |
| Mid Cap Value |
Long-term capital growth. Current income is secondary objective. |
Active/Passive Very Aggressive |
Long-term growth of capital. |
| Small Cap Growth Stock |
Long-term growth of capital. |
Active/Passive Aggressive |
To realize as high a level of total return as is consistent with aggressive investment risk primarily through capital appreciation and some income. |
| Index 600 Stock |
To achieve investment results that approximate the performance of the S&P SmallCap 600® Index. |
Active/Passive Moderate |
To realize as high a level of total return as is consistent with moderate investment risk through capital appreciation and secondarily through income. |
| Small Cap Value |
Long-term growth of capital. |
Active/Passive Balanced |
To realize as high a level of total return as is consistent with reasonable investment risk through appreciation and income. |
| International Growth |
Long-term growth of capital. |
Active/Passive Conservative |
To realize as high a level of total return as is consistent with conservative investment risk through income and secondarily through capital appreciation. |
Allocation Suite. The Active/Passive Very Aggressive Portfolio, Active/Passive Aggressive Portfolio, Active/Passive Moderate Portfolio, Active/Passive Balanced Portfolios, and Active/Passive Conservative Portfolio together comprise the Northwestern Mutual Series Fund, Inc. Active/Passive
Allocation Suite. Each such Portfolio operates primarily as a “fund of funds” and invests in a combination of both actively managed and passive (i.e., index-tracking) Underlying Portfolios. Each Portfolio of the Active/Passive Allocation Suite has a target asset allocation as indicated below.
| |
Equity and Other* Exposure |
Fixed Income or Debt Exposure |
Cash Equivalents |
| Active/Passive Very Aggressive Portfolio |
80 – 100% |
0 – 10% |
0 – 10% |
| Active/Passive Aggressive Portfolio |
75 – 95% |
5 – 25% |
0 – 10% |
| Active/Passive Moderate Portfolio |
60 – 80% |
20 – 40% |
0 – 10% |
| Active/Passive Balanced Portfolio |
40 – 60% |
40 – 60% |
0 – 10% |
| Active/Passive Conservative Portfolio |
20 – 40% |
60 – 80% |
0 – 10% |
*Other exposure includes REIT and commodity-related investments.
125
Investment Policies. Pursuant to Rule 35d-1 under the Investment Company Act of 1940, as amended, each Portfolio (except the Focused Appreciation, Research International Core, Inflation Managed, Active/Passive Very Aggressive, Active/Passive Aggressive, Active/Passive Moderate, Active/Passive Balanced, and Active/Passive Conservative Portfolios) has adopted a non-fundamental investment policy to invest under normal circumstances at least 80% of net assets, plus any borrowings for investment purposes, in accordance with the investment focus suggested by its name (each a “Names Rule Policy”). The Index 500 Stock, Index 400 Stock and Index 600 Stock Portfolios each expects to invest all, or substantially all, of its assets in stocks that make up the applicable index. Any derivatives that provide exposure to the investment focus suggested by the Portfolio's name, or to one or more market risk factors associated with the investment focus suggested by the Portfolio's name, are counted (as applicable) toward compliance with the Portfolio's 80% investment policy. Further, convertible securities will only be counted as equities if such securities are “in the money” (i.e., the conversion prices is less than the equity price.)
In addition, the Government Money Market Portfolio, pursuant to Rule 35d-1, has adopted a non-fundamental investment policy to invest under normal circumstances at least 80% of net assets in obligations issued or guaranteed as to principal and interest by the U.S. government, its agencies or instrumentalities, and repurchase agreements secured by such obligations. As a “government money market fund” under Rule 2a-7, the Government Money Market Portfolio must also meet a separate requirement to invest at least 99.5% of its total assets in cash, obligations issued or guaranteed as to principal and interest by the U.S. government, its agencies or instrumentalities, and repurchase agreements secured by such obligations or cash. Although the 99.5% requirement under Rule 2a-7 and the 80% policy under Rule 35d-1 are similar, the 99.5% requirement permits a broader range of investments than just government securities (i.e., it includes cash).
Each such Portfolio will provide notice to its shareholders at least 60 days prior to any change to its 80% investment policy.
Determining Portfolio Investment Limitations. Except for a Portfolio’s policies with respect to investments in illiquid securities and borrowing, the asset and security percentage limitations included in these policies and elsewhere in this Prospectus and the Statement of Additional Information apply at the time of purchase of a security and, unless otherwise stated, asset percentage limitations apply to the Portfolio’s net (not total) assets as calculated by the Portfolio for determining its net asset value per share. Maximum percentage limitations shall not be considered violated unless an excess over the percentage occurs immediately after, and is caused by, an acquisition of securities or assets of, or borrowings by, a Portfolio.
With a change in the rating of a debt security, the Adviser will review the security’s fundamentals and determine whether it continues to be an appropriate investment for the applicable
Portfolio. Except as indicated in a Portfolio’s investment strategy, a downgrade in a security’s credit quality rating is not an automatic signal to sell that security.
Market Capitalizations. The average market capitalization of a particular index, the companies that compose the index and the individual sizes of those companies may change over time. For the Portfolios that pursue an investment strategy that involves investments in companies within a range of market capitalizations or in companies the capitalizations of which do not exceed the maximum capitalization of a particular index, each Portfolio may continue to hold investments in companies that move above or below the applicable capitalization range. However, in accordance with each Portfolio’s Name Rule Policy, any investments that fall outside of the applicable capitalization range generally will comprise less than 20% of a Fund’s net assets (plus any borrowings for investment purposes).
Investing Risk, In General. As with any investment, an investment in a Portfolio has risks. Portfolio shares will rise and fall in value and there is a risk that you could lose money by investing in a Portfolio. Your investment in a Portfolio is not a deposit with a bank and is not insured, endorsed or guaranteed by the Federal Deposit Insurance Corporation or any other government agency.
Your investment in Portfolio shares, which represents an indirect investment in the securities owned by the Portfolio, is subject to market risk. The market price of securities owned by a Portfolio may go up or down, sometimes rapidly or unpredictably. Securities may decline in value due to factors affecting securities markets generally or particular industries represented in the securities markets. The value of a security may decline due to general market conditions that are not specifically related to a particular company. The value of a security may also decline due to factors that affect a particular industry or industries. During a general downturn in the securities markets, multiple asset classes may decline in value simultaneously. Equity securities generally have greater price volatility than fixed income securities. However, the value of fixed income securities may also be significantly affected by market events such as changes in interest rates, and will likely decline in a rising interest rate environment. At any point in time, your Portfolio shares may be worth less than what you invested, even after taking into account the reinvestment of dividends and distributions. Regardless of how well an individual company performs, if financial markets go down, you could lose money.
Special Market Events. The value of a Portfolio’s investments may decline because of economic changes or other events, such as inflation (or expectations for inflation), deflation (or expectations for deflation), interest rates, global demand for particular products or resources, market instability, debt crises and downgrades, embargoes, tariffs, sanctions and other trade barriers, regulatory events, other governmental trade or market control programs and related geopolitical events. The global economies and financial markets are becoming
126
increasingly interconnected, which increases the possibility that conditions in one country or region might adversely impact issuers in a different country or region. The Fund cannot predict the effects of geopolitical or other events in the future on the U.S. and other economies, the securities markets, or the Portfolios.
Unanticipated Events. Local and global markets and normal market operations can be adversely affected by significant market disruptions. Market disruptions can be caused by local, regional or global events such as war, military conflict, political instability, acts of terrorism, social unrest, environmental disasters, natural disasters or events, trade disputes, supply chain disruptions, spread of infectious diseases or other public health issues, climate change, recessions, or other events. Such events may affect certain sectors, industries, businesses, geographic regions or countries more significantly than others. Climate change, the outbreak of infectious diseases or other public health issues may exacerbate other pre-existing political, social, economic, market and financial risks. The impact of any such events could negatively affect the global economy as well as the economies of individual countries, the financial performance of individual companies, sectors and industries, and the markets in general in significant and unforeseen ways. In addition, any such circumstances could result in disruptions in the trading markets and could result in increased market volatility. Such events could adversely affect the prices and liquidity of a Portfolio’s securities and could have a materially negative impact on the value of a Portfolio. Such events also could impact the ability of the Fund to process transactions or perform other operational activities.
Risks of Infectious Diseases. A widespread outbreak of an infectious disease, such as COVID-19, swine flu, avian influenza, and SARS, may have material adverse impacts on the global economy or the economies of specific nations and may impact individual issuers and capital markets in ways that cannot be foreseen. The impact of infectious diseases in developing or emerging market countries may be greater due to less established health care systems. Certain sectors, industries, countries or companies may be more significantly and negatively impacted than others by any disruption caused by an infectious disease. Such events may negatively impact a Portfolio.
The long-term impact of the COVID-19 pandemic, and other epidemics and pandemics that may arise in the future, on national and global economies, individual companies and the financial markets is unpredictable and may result in uncertainty for potentially extended periods of time. The duration and effectiveness of responsive measures implemented by governments and central banks cannot be predicted.
Risks Related to Military Conflicts. Armed conflicts, such as those between the United States and Iran, Russia and Ukraine, and among Israel, Hamas and other militant groups in the Middle East, have caused and could continue to cause significant market disruptions and volatility within the markets in Russia, Europe, the Middle East and the United States. The imposition of economic sanctions by the United States and
other countries resulting from these hostilities have resulted in, and may continue to result in, significant market disruptions in such regions and beyond. The extent and duration of these or other hostilities are difficult to predict, but could result in significant market disruptions. These and any related events could have a significant negative impact on the performance of a Portfolio, even if the Portfolio does not have direct exposure to issuers located in the impacted geographic regions.
Government Policies. Policy and legislative changes in the United States and in other countries are affecting many aspects of financial regulation, and governmental and quasi-governmental authorities and regulators throughout the world have responded to economic disruptions with a variety of significant fiscal and monetary policy changes, including but not limited to direct capital infusions into companies, new monetary programs and changes in interest rates. The impact of these policies and legislative changes on the markets, and the practical implications for market participants, may not be fully known for some time. A reversal of these policies, or the ineffectiveness of these policies, could increase volatility in securities markets, which could adversely impact a Portfolio’s investments.
Federal Reserve Actions. The Federal Reserve, the nation’s central bank, is responsible for monetary policy. Monetary policy decisions are made by the Federal Open Market Committee (“FOMC”). The FOMC is responsible for monitoring inflation and unemployment and adjusting interest rates to achieve its dual mandate of maximum employment and price stability. The FOMC sets the target range for the federal funds rate, which is the rate at which the Federal Reserve lends money to banks. By adjusting this rate, the Federal Reserve influences the overall interest rates in the economy, which in turn affects economic activity. The FOMC’s decisions are based on a wide range of information, including labor market conditions, inflation pressures, and financial and international developments. The Federal Reserve’s primary instrument for setting monetary policy is the federal funds rate, and the FOMC’s actions are regularly announced in a statement to the public.
The level of interest rates impacts many aspects of economic activity. Higher interest rates result in higher borrowing costs for companies and consumers. Slowing economic growth could result in a weaker job market and higher unemployment. Higher borrowing costs, rising interest rates, less available capital and a potential decline in consumer spending could have a negative impact on the markets and the economy as a whole. Lower interest rates could result in increased or sustained inflation. Periods of economic change and uncertainty can be expected to result in increased volatility of market prices.
U.S. Government Impasses. The U.S. government’s inability at times to agree on a long-term budget and deficit reduction plan has in the past resulted, and may in the future result, in a government shutdown, which could have an adverse effect on a Portfolio’s investments and operations. Additional and/or prolonged government shutdowns may affect investor
127
and consumer confidence and may adversely impact financial markets and the broader economy, perhaps suddenly and to a significant degree.
Information on Standard & Poor’s. “Standard & Poor’s®”, “S&P®”, “S&P 500®”, “S&P® Mid Cap 400 Index”, “Standard & Poor’s Mid Cap 400 Index”, “Standard & Poor’s 500”, “S&P® SmallCap 600” and “Standard & Poor’s Small Cap 600” are trademarks of The McGraw-Hill Companies, Inc. and have been licensed for use by Northwestern Mutual. Neither the Fund nor any Portfolio is sponsored, endorsed, sold or promoted by Standard & Poor’s and Standard & Poor’s makes no representation regarding the advisability of investing in the Fund or a Portfolio. Please see the Statement of Additional Information which sets forth certain additional disclaimers and limitations of liabilities on behalf of S&P.
More About Principal Investment Strategies and Risks
The following section contains additional information about the principal investment strategies used by the Portfolios and the principal risks associated with these investment strategies. Principal investment strategies, which are presented in alphabetical order, are identified by an underlined paragraph header. Within each strategy section, principal risks are identified by italicized paragraph headers. Although one or more Portfolios may pursue the strategies discussed below as principal strategies (as noted in the summaries for the individual Portfolios and throughout this section), each other Portfolio has the authority to invest in the types of securities and employ the strategies described below as non-principal strategies, unless otherwise noted.
Active Management. All Portfolios (other than index portfolios) are actively managed by their Adviser or Sub-Adviser. The performance of a Portfolio that is actively managed will reflect in part the ability of its manager(s) to make investment decisions that are suited to achieving the Portfolio’s investment objective.
Active Management Risk. If the Portfolio manager’s investment strategies do not perform as expected, the Portfolio could underperform other mutual funds with similar investment objectives or lose money.
Active and Frequent Trading. Active management of a Portfolio may also result in active trading of Portfolio securities. The Select Bond, Long-Term U.S. Government Bond and Multi-Sector Bond Portfolios use active and frequent trading as a principal investment strategy to pursue their respective investment objectives, as set forth in the summaries for the foregoing Portfolios.
Risks of Active and Frequent Trading. Active and frequent trading can increase the portfolio turnover rate and may lead to higher brokerage commissions and other transaction costs. A higher portfolio turnover rate may have a greater adverse affect on the Portfolio’s performance. Portfolio turnover rates may vary from year to year.
ADRs. The Portfolios may invest in American Depositary Receipts and American Depositary Shares (collectively, ADRs) and other similar depositary receipts. The Growth Stock, Focused Appreciation, Large Cap Core Stock, Large Cap Blend, Large Company Value, Equity Income, Mid Cap Growth Stock, Mid Cap Value, Small Cap Growth Stock, Small Cap Value, International Growth, Research International Core, International Equity and Emerging Markets Equity Portfolios may invest in ADRs as a principal investment strategy. ADRs are receipts representing ownership of shares of a foreign issuer held by a U.S. bank or similar financial institution that entitle the holder to all dividends and capital gains on the underlying foreign shares. ADRs are typically denominated in U.S. dollars and trade in the U.S. securities markets. ADRs are alternatives to directly purchasing the underlying foreign securities in their national markets and currencies. ADRs are considered foreign securities for purposes of limitations stated herein regarding foreign securities except as specifically noted.
ADR Risk. ADRs and similar depositary receipts are subject to many of the same risks as direct investments in foreign securities, including the risk that material information about the issuer may not be disclosed in the United States and the risk that currency fluctuations may adversely affect the value of the ADR. See “Risks of Foreign Investing” below. The financial institution may charge fees for forwarding dividends and interest and for other services. The Portfolios are also exposed to the credit risk of the financial institution holding the ADRs. ADRs may be “sponsored,” meaning that they are implemented by a financial institution in collaboration with the issuing foreign company, or “unsponsored,” meaning that the financial institution created the instrument without the sponsorship or direct involvement of the foreign company. Differing registration requirements apply to each type of ADR. ADRs may transact on exchanges or on over-the-counter markets (“OTC”). Sponsored ADRs may be established on three program levels, which differ with respect to market listing exposure and applicable reporting requirements. Level 1 sponsored ADRs are exempt from full SEC registration and reporting and only trade on OTC markets. For Level 2 and Level 3 sponsored ADRs, the issuing financial institution and foreign company jointly register the ADR with the Securities and Exchange Commission (“SEC”), after which the ADRs can be listed and traded on major U.S. stock exchanges. These ADR programs are subject to SEC registration requirements (including the requirement to file an annual report and comply with U.S. accounting standards) and exchange listing requirements. Unlike a sponsored ADR where the depositary has an exclusive relationship with the foreign issuer, an unsponsored ADR may be created by a depositary institution independently and without the cooperation of the foreign issuer. Consequently, information concerning the foreign issuer may be less current or reliable for an unsponsored ADR and the price of an unsponsored ADR may be more volatile than if it was a sponsored ADR. Depositaries of unsponsored ADRs are not required to distribute shareholder communications received from the foreign issuer or to pass through voting rights to its
128
holders. The holders of unsponsored ADRs generally bear all the costs associated with establishing the unsponsored ADR, whereas the foreign issuers typically bear certain costs in a sponsored ADR. Unsponsored ADRs generally trade only in OTC markets. Conducting transactions in OTC markets may result in higher costs, a lack of pricing transparency and lower liquidity when compared with exchange-based transactions. Based on the foregoing, risks associated with different ADR types will vary, based upon differences in registration, reporting, listing and disclosure requirements that apply to such ADRs and the characteristics of the market in which transactions for the particular ADR are conducted.
Asset Allocation Strategy. As a principal investment strategy, the Active/Passive Allocation Suite Portfolios allocate their investments among multiple investment asset classes, among Underlying Portfolios and ETFs, and among various segments of markets, based upon judgments made by the portfolio manager. No other Portfolio employs an asset allocation strategy, either as a principal investment strategy, or a non-principal investment strategy.
Asset Allocation Risk. A Portfolio could miss attractive investment opportunities by underweighting markets or sectors where there are significant returns and could lose value by overweighting markets where there are significant declines, or may not correctly predict the times to shift assets from one type of investment to another.
Contingent Convertible Instruments. The Multi-Sector Bond Portfolio may invest in contingent convertible securities as a principal investment strategy. Contingent convertible securities (“CoCos”) are a form of hybrid debt security that may be either converted into equity or have their principal written down upon the occurrence of certain “triggers.” Such triggers are generally linked to the inability of the issuing institution to maintain applicable regulatory capital thresholds or to the discretionary action on the part of the issuer’s regulator based upon the regulator’s assessment of the issuer’s ongoing financial viability. CoCos’ unique equity conversion or principal write-down features are tailored to the issuing banking institution and its regulatory requirements. See, “Equity Securities, Risks of Convertible Securities” below. Some additional risks associated with CoCos include, but are not limited to:
Economic Risk. CoCos have fully discretionary coupons. This means coupons can potentially be deferred or cancelled at the banking institution’s discretion or at the request of the relevant regulatory authority in order to help the bank absorb losses. Such deferral or cancellation of the coupons will not cause an event of default. In addition, CoCos often contain both regulatory call and tax call provisions which grant the issuer the right to repurchase the securities under certain conditions, typically tied to negative financial impacts caused by a changing regulatory or tax environment.
Commodities. The Active/Passive Allocation Suite Portfolios may invest in instruments, including exchange traded funds and total return swaps, whose performance is linked to the price of an underlying commodity or commodity index. To the extent a
Portfolio makes such investments, the Portfolio may be subject to the risks associated with investing in physical commodities. Commodity prices may be significantly impacted by regulatory, economic and political developments, weather events, and natural disasters, pestilence and market disruption. As a result, commodity-related investments may have greater volatility than investments in traditional securities.
Derivatives. The Index 500 Stock, Large Cap Blend, Large Company Value, Domestic Equity, Index 400 Stock, Mid Cap Value, Index 600 Stock, International Equity, Short-Term Bond, Select Bond, Long-Term U.S. Government Bond, Inflation Managed, Multi-Sector Bond, and Active/Passive Allocation Suite Portfolios may use derivative instruments as described in their respective summary section. The other Portfolios may, but are not required to, use derivative instruments individually or in combination to seek to protect its assets, implement a tax or cash management strategy, gain or manage exposures, adjust duration or as part of its investment strategies to seek to enhance returns. Generally, derivatives are financial contracts whose value depends upon, or is derived from, the value of an underlying asset, reference rate or index, and may relate to stocks, bonds, interest rates, currencies or currency exchange rates, commodities and related indices. Examples of derivative instruments include options contracts, forward and futures contracts (including foreign currency forwards and futures), options on futures contracts, and swap agreements (including, but not limited to, interest rate, total return equity, total return commodities, total return fixed income, inflation, and credit default swaps). Each Portfolio may invest in derivative instruments, subject to the Portfolio’s objective and policies. For purposes of determining whether a Portfolio has invested at least 80% of net assets (plus any borrowing for investment purposes) in a particular type of security, the Portfolio may include a derivative instrument in the 80% base to the extent it has economic characteristics similar to the securities included in the base. A portfolio manager may decide not to employ any of these strategies and there is no assurance that any derivatives strategy used by a Portfolio will succeed. A description of these and other derivative instruments that the Portfolios may use are described under “MORE ABOUT THE PORTFOLIOS’ OBJECTIVES AND STRATEGIES – Derivative Instruments” in the Statement of Additional Information.
Risks of Derivatives. A Portfolio’s use of derivative instruments involves risks different from, or greater than, the risks associated with investing directly in securities and other more traditional investments. A description of various risks associated with particular derivative instruments is included in the “MORE ABOUT THE PORTFOLIOS’ OBJECTIVES AND STRATEGIES – Derivative Instruments” section of the Statement of Additional Information. The following provides a more general discussion of important risk factors relating to derivative instruments that may be used by the Portfolios.
Management Risk. Derivative products are highly specialized instruments that require investment techniques and risk analyses different from those associated with stocks and bonds. The use of a derivative requires an understanding not
129
only of the underlying instrument but also of the derivative itself, without the benefit of observing the performance of the derivative under all possible market conditions. Derivative instruments used by a Portfolio may experience losses because the investment techniques and risk analyses applied did not produce the desired results.
Correlation Risk. Changes in the value of the derivative may not correlate as intended with the underlying asset, rate or index. This may also be referred to as basis risk. For example, changes in the value of a hedging instrument may not match those of the investment being hedged.
Counterparty Risk. The use of a derivative instrument involves the risk that a loss may be sustained as a result of the failure of another party to the contract (i.e., a counterparty or clearinghouse) to make required payments or otherwise comply with the contract’s terms. This risk is partially mitigated if collateral or margin has been posted and is held against the position.
Credit Risk. A derivative instrument may involve credit risk and the value of a Portfolio’s derivative instrument may be negatively affected to the extent that the issuer of an underlying asset will be unable to make principal and interest payments when due or otherwise honor its obligations. Underlying assets are subject to varying degrees of credit risk. The extent to which a derivative instrument involves credit risk may increase due to the leverage component of the derivative instrument. See “Leverage Risk,” below.
Interest Rate Risk. When interest rates change, the value of a Portfolio’s derivatives instruments may be negatively affected to the extent the derivative instrument or its underlying asset, reference rate or index are sensitive to changes in market interest rates. The extent to which a derivative instrument involves interest rate risk may increase due to the leverage component of the derivative instrument. See “Leverage Risk,” below.
Liquidity Risk. Liquidity risk exists when a particular derivative instrument is difficult to purchase or sell. If a derivative transaction is particularly large or if the relevant market is illiquid (as is the case with many privately negotiated derivatives), it may not be possible to initiate a transaction or liquidate a position at an advantageous time or price. These risks may be magnified during periods of economic turmoil or in an extended economic downturn.
Leverage Risk. Because derivatives have a leverage component, adverse changes in the value or level of the underlying asset, reference rate or index can result in a loss substantially greater than the amount invested in the derivative itself. Certain derivatives have the potential for unlimited loss, regardless of the size of the initial investment. When a Portfolio uses derivatives for leverage, investments in that Portfolio will tend to be more volatile, resulting in larger gains or losses in response to market changes.
Commodities Related Investments Risk. Exposure to the commodities markets may subject a Portfolio to greater volatility than investments in traditional securities. The value of commodity-linked derivative investments may be affected by changes in overall market movements, commodity index volatility, changes in inflation, interest rates, or factors affecting a particular industry or commodity, such as drought, floods, weather, embargoes, tariffs and international economic, political and regulatory developments.
Rule 18f-4 Requirements related to Derivatives. Effective August 19, 2022, the Series Fund has adopted a derivatives risk management program pursuant to Rule 18f-4. Rule 18f-4 permits a fund to enter into derivatives transactions provided it adopts and implements a derivatives risk management program (including the appointment of a derivatives risk manager and the implementation of certain testing requirements) and complies with specific value-at-risk leverage limits for certain derivatives users and reporting requirements in respect of derivatives usage. Rule 18f-4 could restrict a Portfolio’s ability to engage in certain derivatives transactions and/or increase the costs of such derivatives transactions, which could adversely affect the value or performance of a Portfolio.
Lack of Availability. Because the markets for certain derivative instruments (including markets located in foreign countries) are relatively new and still developing, suitable derivatives transactions may not be available in all circumstances for risk management or other purposes. In addition, certain market conditions, such as those present in a zero-interest rate environment or during periods of extreme volatility, which have recently occurred, may make the use of certain derivatives financially unattractive or impractical. There is no assurance that a Portfolio will engage in derivatives transactions at any time or from time to time. A Portfolio’s ability to use derivatives may also be limited by certain regulatory and tax considerations.
Market and Other Risks. Like most other investments, derivative instruments are subject to the risk that the market value of the instrument will change in a way detrimental to a Portfolio’s interest due to market events unanticipated by the Adviser or a Sub-Adviser. If the Adviser or Sub-Adviser incorrectly forecasts the values of securities, currencies or interest rates or other economic factors in using derivatives for a Portfolio, the Portfolio might have been in a better position if it had not entered into the transaction at all. While some strategies involving derivative instruments can reduce the risk of loss, they can also reduce the opportunity for gain or even result in losses by offsetting favorable price movements in other Portfolio investments.
Operational Risk. Operational risk generally refers to the risks related to potential operational issues, including documentation issues, settlement issues, systems failures, inadequate controls, and human error.
130
Legal Risk. Legal risk refers to the risks related to insufficient documentation, insufficient capacity or authority of a counterparty to enter into a derivatives transaction, or legality or enforceability of a derivatives transaction contract.
Other risks in using derivatives include the risk of mispricing or improper valuation of derivatives. Valuation for derivatives may not be readily available in the market. Valuation may be more difficult in times of market turmoil since many investors and market makers may be reluctant to purchase complex instruments or quote prices for them. Bilateral derivatives contracts are privately negotiated directly with the counterparty, while exchange-traded derivatives are traded via an exchange. Different counterparties often use different valuation techniques for determining the value of a derivative, and while the portfolio reconciliation process can help to highlight differences in valuation, there is little guidance from regulators on how such discrepancies should be resolved. Additionally, a common provision in privately negotiated derivative contracts permits the counterparty to the contract to terminate the derivative contract, if the value of a Portfolio’s total net assets declines by a specified amount over a specific time period. The decline of a Portfolio’s total net assets (which usually must be significant) could be caused by shareholder redemptions and/or a decrease in market value of its securities. The termination of the derivative contract in such an instance may adversely affect the Portfolio by increasing losses and/or costs and/or preventing the Portfolio from fully implementing its investment strategies. In addition, a Portfolio’s use of derivatives may cause the Portfolio to realize higher amounts of short-term capital gains (generally taxed at ordinary income tax rates) than if the Portfolio had not used such instruments.
Furthermore, SEC regulations may make derivatives more costly, may limit the availability or reduce the liquidity of derivatives, or may otherwise adversely affect the value or performance of derivatives. See, “MORE ABOUT THE PORTFOLIOS’ OBJECTIVES AND STRATEGIES – Derivative Instruments – Regulatory Impact” in the Statement of Additional Information for more information.
Diversification. Each Portfolio, other than the Focused Appreciation Portfolio, is classified as a diversified investment company pursuant to the Investment Company Act of 1940, as amended (the “1940 Act”). Diversification requirements are measured at the time of acquisition of investments. Subsequent market fluctuations in the values of acquired securities that cause a Portfolio to exceed prescribed diversification limits will not result in the Portfolio losing its status as a diversified investment company, provided that the Portfolio complies with constraints that apply to new acquisitions, as provided under the 1940 Act. The Focused Appreciation Portfolio is classified as a non-diversified investment company as defined under the 1940 Act.
The Index 500 Stock Portfolio intends to be diversified in approximately the same proportion as the underlying index is diversified. The Portfolio may become “non-diversified,” as defined in the 1940 Act, solely as a result of a change in
relative market capitalization or index weighting of one or more constituents of the underlying index. A “non-diversified” fund generally invests a greater proportion of its assets in the securities of one or more issuers and invests overall in a smaller number of issuers than a diversified fund. Shareholder approval will not be sought if the Portfolio becomes non-diversified due solely to a change in the relative market capitalization or index weighting of one or more constituents of the underlying index.
Non-Diversification Risk. A non-diversified Portfolio may hold a relatively large percentage of its assets in a single issuer or small number of issuers. As a result, its performance could be closely tied to the value of that one issuer or issuers and could be more volatile than the performance of more diversified funds.
Equity Securities. The equity portion of each Portfolio designed to invest primarily in equity securities as a principal investment strategy (Growth Stock, Focused Appreciation, Large Cap Core Stock, Large Cap Blend, Index 500 Stock, Large Company Value, Domestic Equity, Equity Income, Mid Cap Growth Stock, Index 400 Stock, Mid Cap Value, Small Cap Growth Stock, Index 600 Stock, Small Cap Value, International Growth, Research International Core, International Equity, and Emerging Markets Equity Portfolios, each, an “Equity Portfolio”) and the equity portions of the Active/Passive Allocation Suite Portfolios through their fund-of-funds strategy, may include common stocks and preferred stocks and (except for the Index 400 Stock, Index 500 Stock and Index 600 Stock Portfolios), rights, warrants, and securities convertible into common or preferred stocks. Entities such as limited partnerships, limited liability companies, business trusts and companies organized outside the United States may issue equity securities comparable to common or preferred stock. Equity securities may also include interests in real estate investment trusts, or REITs. See “Real Estate Investment Trusts (REITs)”, below. Each of the Portfolios designed to invest primarily in fixed income securities (Short-Term Bond, Select Bond, Long-Term U.S. Government Bond, Inflation Managed, High Yield Bond, and Multi-Sector Bond Portfolios, each, a “Fixed Income Portfolio”) may invest in common and preferred stocks and other types of equity securities as a principal investment strategy as may be identified in the respective Portfolio’s summary, and otherwise as a non-principal investment strategy.
Risks of Equity Securities, Generally. Equity securities represent equity ownership in a company. Stock markets are volatile. The price of equity securities will fluctuate and can decline and reduce the value of a Portfolio investing in equities. The price of equity securities fluctuate based on changes in a company’s financial condition and overall market and economic conditions. The value of equity securities purchased by a Portfolio could decline if the financial condition of the companies the Portfolio is invested in declines or if overall market and economic conditions deteriorate. An issuer of a security purchased by a Portfolio may perform poorly, and, therefore, the value of its common stocks and preferred stocks
131
may decline. Poor performance may be caused by poor management decisions, competitive pressures, breakthroughs in technology, reliance on suppliers, labor problems or shortages, corporate restructurings, fraudulent disclosures, or other factors.
Risks of Preferred Stocks. Preferred stocks often lack a fixed maturity or redemption date and are therefore more susceptible to price fluctuations when interest rates change. Preferred stocks also carry a greater risk of non-receipt of income because unlike interest on debt securities, dividends on preferred stocks must be declared by the issuer’s board of directors before becoming payable. Claims on assets and earnings of an issuer by a preferred stockholder are subordinate to the claims of all creditors but senior to the claims of common stockholders in a liquidation or reorganization of an issuer under bankruptcy or similar laws.
Risks of Large Cap Companies. Even Portfolios that invest in high quality or “blue chip” equity securities or securities of established companies with large market capitalizations (which generally have strong financial characteristics) can be negatively impacted by poor overall market and economic conditions. Companies with large market capitalizations may also have less growth potential than smaller companies and may be able to react less quickly to change in the marketplace.
Risks of Small and Mid Cap Companies. Each Portfolio may invest to varying degrees in small and mid cap stocks, subject to the Portfolio’s objectives and policies. Small and mid cap companies may have more growth potential and may be able to react to market conditions more quickly; however, small and mid cap stocks may involve greater risks of loss and price fluctuation than stocks of companies with larger capitalizations. Small and mid-sized companies often have a more limited track record, have narrower markets for their products and services and more limited managerial and financial resources than larger, more established companies. These stocks may react differently to issuer, political, market and economic developments than stocks with larger capitalizations. Also, the trading markets for small and mid cap stocks tend to be less liquid than securities of larger companies, which may result in difficulty buying or selling a small or mid cap stock, especially during periods of market volatility.
Risks of Micro Cap Companies. Each Portfolio may invest in varying degrees in micro cap stocks, subject to the Portfolio’s objectives and policies. The Small Cap Growth Stock, Small Cap Value and Emerging Markets Equity Portfolios may invest in micro cap companies as a principal investment strategy. Micro cap companies may have more growth potential and may be able to react to market place conditions more quickly, however, investing in micro cap stocks may involve greater risks than investing in stocks of companies
with larger capitalizations. Micro cap companies often have a more limited track record, narrower markets for their products and services and more limited managerial and financial resources and face a greater risk of business failure. For these reasons, the prices of micro cap securities are typically more volatile and their markets less liquid than small, mid-and large cap stocks.
Risks of Rights and Warrants. Investments in rights and warrants may be more volatile than the underlying common stock and may cause the Portfolio increased risk of loss if the rights or warrants cannot be exercised prudently by the expiration date or if the rights and warrants lack a liquid secondary market for resale. Warrants can provide exposure to an underlying stock for a portion of the price of direct ownership of shares of that stock. As a result, most warrants have some degree of leverage, which can vary depending on the type of warrant. This means that small changes in the value of the underlying stock results in larger changes in the value of the warrant. This can magnify gains when stock prices rise, but it can also magnify losses when stock prices fall.
Risks of When Issued Securities. When issued securities involve risk that the security the Portfolio buys may lose value prior to its delivery or may not be issued causing the Portfolio to incur a loss. This risk is in addition to the risk that the Portfolio’s other assets will decline in value. Therefore, these transactions may result in a form of leverage and increase a Portfolio’s overall investment exposure. Please see “When Issued, Delayed Delivery and Forward Commitment Transactions” below, which describes additional information about such transactions.
Risks of Dividend-Paying Stocks. The Equity Income Portfolio focuses on large capitalization stocks with a strong record of paying dividends, and other Portfolios that invest in equity securities may hold dividend-paying stocks as well. Dividend-paying stocks, and Portfolios that invest in them, may underperform similar funds that invest without consideration of a company’s track record of paying dividends. Stocks of companies with a history of paying dividends may not participate in a broad market advance to the same degree as most other stocks, and a sharp rise in interest rates or economic downturn could cause a company to unexpectedly reduce or eliminate its dividend. Currently, interest rates are near historically low levels.
Risks of Convertible Securities. Convertible securities can be bonds, notes, debentures, preferred stock or other securities which are convertible into common stock. Convertible securities are subject to both the credit and interest rate risks associated with fixed income securities and to the stock market risk associated with equity securities. The value of a convertible security may not increase or decrease as rapidly as the underlying common stock. A Portfolio may be forced to convert
132
a security before it would otherwise choose, which may have an adverse effect on the Portfolio’s ability to achieve its investment objective. See “Contingent Convertible Instruments”, above, for more information specifically related to investments in such securities.
Fixed Income Securities. Each of the Fixed Income Portfolios may invest in various types of debt investments as a principal investment stratety, which may include:
•
corporate debt securities of U.S. and non-U.S. issuers, including convertible securities;
•
obligations of the U.S. government, its agencies and instrumentalities, including government sponsored enterprises (see “U.S. Government Securities”, below);
•
pass-through securities (i.e., securities that enable investors to receive payments derived from a pool of underlying assets), generally including mortgage- and asset-backed securities;
•
loan participations and assignments, and dollar roll transactions (i.e., selling a mortgage-backed security for immediate settlement and simultaneously agreeing to purchase the same type of security on a future date at a discount);
•
inflation-indexed bonds issued by both governments and corporations;
•
municipal securities issued by states or local governments and their agencies;
•
obligations of non-U.S. governments or their agencies;
•
money market instruments, such as repurchase agreements: and
•
Rule 144A securities (i.e., privately placed securities that can be sold without SEC registration only among qualified institutional buyers (“QIBs”) such as investment banks, pension funds, and large investment managers).
The debt securities in which the Fixed Income Portfolios may invest as a principal investment strategy are noted in the summaries for each of the Fixed Income Portfolios. The Fixed Income Portfolios may also invest in any other debt securities as a non-principal investment strategy, consistent with the particular Portfolio’s investment objective and strategy. The Equity Portfolios may invest in debt securities as a non-principal strategy consistent with the Portfolio’s investment objective and strategy.
Investments in fixed income securities involve risks different from investments in equity securities. The primary risks associated with an investment in fixed income securities are as follows:
Interest Rate Risk. When interest rates change, the value of a Portfolio’s investments may be affected because prices of debt investments generally rise and fall in response to changes
in market interest rates. When interest rates rise, the prices of fixed income investments fall. Changes in interest rates can be sharp and the effect on the value of fixed income investments can be significant. Any change in a central bank’s monetary policy or improving economic conditions may result in an increase in interest rates. See “Investing Risk, In General – Federal Reserve Actions”, above, for information regarding the Federal Reserve Bank’s recent actions on interest rates and monetary policy. A significant rise in interest rates over a short period of time could cause significant losses in the market value of a Portfolio’s fixed income investments. Duration is a measure of the sensitivity of the price of a Portfolio’s fixed income securities to changes in interest rates; the longer the duration, the more sensitive the price will be to changes in interest rates. Similarly, a Portfolio with a longer average portfolio duration will be more sensitive to changes in interest rates than a Portfolio with a shorter average portfolio duration. By way of example, the price of a bond fund with an average duration of three years would be expected to fall approximately 3% if interest rates rose by one percentage point.
Credit Risk. Credit risk is the risk that an issuer will be unable to make principal and interest payments when due. A Portfolio could lose money if the issuer or guarantor of a fixed income security, or the counterparty to a derivatives contract, repurchase agreement or a loan of portfolio securities is unwilling or unable to make timely principal and/or interest payments, or to otherwise honor its obligations. In times of extreme economic turmoil or in an extended economic downturn, the risk of default may increase. Securities are subject to varying degrees of credit risk, which are often reflected in credit ratings. Credit ratings are essentially opinions of credit rating agencies as to the credit quality of the issuer, the lower the credit rating, the greater the credit risk. Changes in an issuer’s credit rating or the market’s perception of an issuer’s creditworthiness may also affect the value of a Portfolio’s investment in that issuer. A lower credit rating may lead to a decline in the value of a fixed income security because investors may demand a higher rate of interest to compensate for the perceived increased credit risk of the issuer. Credit ratings, however, may prove to be inaccurate. In determining the credit quality of a fixed income security for the Portfolios’ investment strategies, the Fund primarily considers the credit ratings assigned to the security by Standard & Poor’s Ratings Service (“S&P”), Moody’s Investors Service, Inc. (“Moody’s) and Fitch Ratings (“Fitch”). The Fund considers a fixed income security to be investment grade if the security is rated investment grade by at least two of the three credit rating agencies (BBB- or higher by S&P; Baa3 or higher by Moody’s; BBB- or higher by Fitch) and a security to be non-investment grade (sometimes referred to as “high yield” or “junk”) if the security is rated below investment grade by at least two of the three credit ratings agencies (BB+ or lower by S&P; Ba1 or lower by Moody’s; BB+ or lower by Fitch). If a security is rated by only two of the three credit ratings agencies, then the Fund assigns the security with the lower of the two ratings. If only one of the three credit ratings agencies rates a security, then the
133
Fund assigns the security that agency’s rating. And if a security is unrated, then the Fund considers the security to be investment grade or non-investment grade if determined by the Portfolio’s Adviser or Sub-Adviser to be of comparable quality.
Call or Prepayment Risk. Call or Prepayment Risk is the risk that an issuer will pay principal on an obligation earlier than scheduled or expected, which would accelerate cash flows from, and shorten the average life of, the security. Bonds are typically called when interest rates have declined. In the event of a bond being called, the Adviser or Sub-Adviser may have to reinvest the proceeds in lower yielding securities to the detriment of the Portfolio.
Extension Risk. If interest rates rise, repayments of fixed income securities may occur more slowly than anticipated by the market. This may drive the prices of these securities down because their interest rates are lower than the current interest rate and they remain outstanding longer.
LIBOR Reference Rate and Transition Risk. Certain of the Fixed Income Portfolios may hold debt securities and other financial investments that continue to rely on the Intercontinental Exchange London Interbank Offered Rate (“LIBOR”). Prior to the discontinuation of the formal maintenance of all LIBOR settings on June 30, 2023, LIBOR was used extensively in the U.S. and globally as the reference rate for various commercial and financial contracts, including corporate and municipal bonds and loans, floating rate mortgages, asset-backed securities, consumer loans, and interest rate swaps and other derivatives.
Actions by regulators have resulted in the establishment of alternative reference rates to LIBOR in most major currencies. The U.S. Federal Reserve, based on the recommendations of the Alternative Reference Rates Committee, has been publishing a Secured Overnight Financing Rate (“SOFR”), which has replaced U.S. dollar LIBOR. Market participants generally have adopted alternative rates such as SOFR or otherwise amended such financial instruments to include fallback provisions and other measures that contemplated the discontinuation of LIBOR. To facilitate the transition of legacy derivatives contracts referencing LIBOR, the International SWAPs and Derivatives Association, Inc. (“ISDA”) launched a protocol to incorporate fallback provisions.
Although the transition process away from the use of LIBOR has been completed, some LIBOR use is continuing and there are potential effects related to the transition away from LIBOR or continued use of LIBOR on a fund, or on certain instruments in which a fund invests, which can be difficult to ascertain and may vary depending on certain factors. Investments that involve individual contracts that have no existing fallback provisions, inadequate fallback provisions, or have no language that contemplates the discontinuance of LIBOR could experience increased volatility or reduced liquidity as a result of the transition process. Interest rate provisions included in such
contracts may need to be renegotiated in contemplation of the LIBOR transition and the application of a replacement rate may result in a reduction in the value of certain instruments held by a Portfolio. Further, an instrument’s transition to a replacement rate could result in variations in the reported yields of a Portfolio that holds such instrument. In addition, use of a replacement benchmark rate and any accompanying pricing adjustments imposed by a regulator or by counterparties or otherwise may adversely affect a Portfolio’s performance and/or NAV.
Environmental, Social and Governance (“ESG”) Factors. Certain of the Portfolios reference the incorporation of ESG factors as part of the principal investment strategies employed in connection with the sub-adviser’s management of the particular Portfolio. For illustrative purposes only, examples of such ESG factors include climate change risk, human capital management, employee safety, shareholder rights, executive compensation, and corporate governance. There is not a single or uniform approach to the integration and consideration of ESG factors as part of a sub-adviser’s investment process or philosophy. A sub-adviser’s ESG integration approach does not change the Portfolio’s investment objective, exclude specific types of industries or companies or limit the Portfolio’s investable universe. The Portfolios are not designed for investors who wish to screen out particular types of companies or investments or are looking for funds that meet specific ESG goals. Rather, those Portfolios that reference the incorporation of ESG factors in their investment approach integrate the consideration of such factors as circumstances may warrant, along with the consideration of multiple other factors deemed relevant to the sub-adviser, based on the judgment of the Portfolio’s portfolio managers and the application of the individualized investment philosophy applied by the sub-adviser. As a result, the basis and method by which ESG factors are incorporated into a particular sub-adviser’s investment process or philosophy will vary over time and across sub-advisory firms.
ESG Risk. Incorporating the consideration of ESG factors in the investment process affect the Portfolio’s exposure to certain issuers or industries and may not work as intended. The Portfolio may underperform other funds that do not consider ESG factors or that use different ESG factors to evaluate a security. Information used to evaluate ESG factors may not be readily available, complete, or accurate, and may vary across providers and issuers, as ESG factors are not uniformly defined or assessed. There is no guarantee that evaluating ESG considerations for individual securities will positively contribute to the Portfolio’s performance results.
Focused Security Investing. Although diversified, the Large Company Value Portfolio typically only invests in a smaller number of companies than the other Portfolios as a result of pursuing a focused investment strategy as a principal investment strategy.
134
Security Focus Risk. To the extent a Portfolio invests its assets in a small number of issuers, the Portfolio’s performance could be closely tied to the value of one or a small group of issuers and therefore could be more volatile than the performance of funds with more numerous holdings.
Foreign Securities. The International Growth, Research International Core, International Equity, Emerging Markets Equity and Multi-Sector Bond Portfolios each have an unlimited ability to invest in foreign securities as part of their principal investment strategies. The Index 400 Stock, Index 500 Stock and Index 600 Stock Portfolios will only invest in foreign securities if such securities are added to their respective benchmark index. Each other Portfolio may invest in foreign securities as a principal investment strategy as set forth in the summary for each such Portfolio or may otherwise invest in foreign securities as a non-principal investment strategy.
Except as noted below, for purposes of applying the foreign investment limitation, “foreign securities” shall mean:
•
securities of companies whose principal trading activities are outside the U.S.; or
•
securities denominated in non U.S. dollar currencies; or
•
securities of companies that:
•
are organized under the laws of, or have principal offices in, a country other than the U.S., and
•
derive 50% or more of their total revenue from either goods or services produced or sales made in markets outside the U.S.; or
•
American Depositary Receipts and American Depositary Shares.
Portfolios that invest in securities denominated in non-U.S. dollar currencies may enter into forward foreign currency exchange contracts and invest in foreign currency futures contracts.
Foreign securities may include securities of issuers economically tied to countries with developing (or “emerging market”) economies. A security is economically tied to an emerging market country if it: i) is organized under the laws of, or has its principal office in an emerging market country; ii) has its principal securities trading market in an emerging market country; and/or iii) derives the majority of its annual revenue or earnings or assets from goods produced, sales made or services performed in an emerging market country. The Adviser or Sub-Adviser has broad discretion to identify and invest in countries that it considers to qualify as emerging securities markets. Emerging market countries include countries determined by the Adviser or Sub-Adviser to have emerging market economies, taking into account a number of factors, such as the country’s credit rating, its political and economic stability and the development of its financial and capital markets. Emerging market countries include, but are not limited to, countries that comprise the MSCI Emerging Markets Index.
Risks of Foreign Investing. A Portfolio that invests in foreign securities may experience more rapid and extreme changes in value than a Portfolio that invests exclusively in securities of U.S. companies. To the extent a Portfolio invests a relatively large percentage of its assets in issuers located in a single country, a small number of countries, or a particular geographic region, the Portfolio’s performance could be closely tied to the market, currency, economic, political, or regulatory conditions and developments in those countries or that region, and could be more volatile than the performance of more geographically diversified funds. Specific risks of investing in foreign securities include the following:
Political and Economic Risk. Foreign investments can be subject to greater political and economic risks, including political, economic, and social instability. In some countries, there is the risk that the government may take over assets or operation of the company or impose taxes or place limits on the removal of assets that would adversely affect the value of the security. The possibility of default in foreign government securities, political or social instability or diplomatic developments generally are more of a concern in developing countries, where the possibility of political instability (including revolution) and dependence on foreign economic assistance may be greater than in developed countries. In the event of nationalization, expropriation or other confiscation, a Portfolio could lose its entire investment in foreign securities.
Regulatory Risk. In many countries there is less publicly available information about issuers than is available for companies in the U.S. Foreign companies may not be subject to uniform accounting, auditing and financial reporting standards, and auditing practices and requirements may not be comparable to those applicable to U.S. companies. In many foreign countries there is less government supervision and regulation of business and industry practices, stock exchanges, brokers, and listed companies than in the U.S., and it may be more difficult to obtain or enforce judgments against foreign entities.
Foreign Market Risk. Foreign securities often trade with less frequency and volume than domestic securities and are therefore less liquid and more volatile than securities of comparable domestic issuers. Further, the settlement period of securities transactions in foreign markets may be longer than in domestic markets.
Transaction Costs. Commission rates in foreign countries, which are generally fixed rather than subject to negotiation as in the U.S., are likely to be higher. In addition, other costs, such as taxes and custody costs, are generally higher than for domestic transactions.
Foreign Currency Risk. Portfolios that invest in securities that trade in, and receive revenues in, foreign (non-U.S.) currencies, or in derivatives that provide exposure to foreign (non-U.S.) currencies, are subject to the risk that those currencies will decline in value relative to the U.S. dollar, or, in the case of hedged positions, that the U.S. dollar will decline in value relative to the currency being hedged. Currency rates in
135
foreign countries may fluctuate significantly over short periods of time for a number of reasons, including changes in interest rates, intervention (or the failure to intervene) by U.S. or foreign governments, central banks or supranational entities such as the International Monetary Fund, or by the imposition of currency controls or other political developments in the U.S. or abroad. As a result, a Portfolio’s investments in foreign currency denominated securities may reduce the returns of the Portfolio. Additionally, restrictions on currency trading that are imposed by foreign countries may have an adverse effect on the value of the securities of companies that trade or operate in those countries.
Forward Foreign Currency Exchange Contracts Risk. Forward foreign currency exchange contracts are OTC contracts to purchase or sell a specific currency at a future date at a price set at the time of the contract. Forward foreign currency exchange contracts can be used to reduce a Portfolio’s exposure to changes in the value of the currency it will deliver, to shift exposure to foreign currency fluctuations from one currency to another or to increase a Portfolio’s exposure to changes in the value of the currency that it will receive for the duration of the contract. Forward foreign currency exchange contracts do not eliminate fluctuations in the value of non-U.S. securities but rather allow the Portfolio to establish a fixed rate of exchange for a future point in time. Foreign currency transactions can be affected unpredictably by intervention (or the failure to intervene) by U.S. or foreign governments or central banks, or by currency controls or political developments. Such events may prevent or restrict a Portfolio’s ability to enter into foreign currency transactions, force the Portfolio to exit a foreign currency transaction at a disadvantageous time or price or result in penalties for the Portfolio, any of which may result in a loss to the Portfolio. A contract to sell a foreign currency would limit any potential gain that might be realized if the value of the currency increases. Suitable hedging transactions may not be available in all circumstances and there can be no assurance that a Portfolio will engage in such transactions at any given time or from time to time. A Portfolio engaging in forward foreign currency exchange contracts will be subject to counterparty credit risk and any failure to perform by a counterparty could result in a loss to the Portfolio.
Emerging Markets Risk. Investing in emerging market securities imposes risks different from, or greater than, risks of investing in domestic securities or in foreign, developed countries. These risks include: smaller market capitalization of securities markets, which may suffer periods of relative illiquidity; significant price volatility; restrictions on foreign investment; and possible repatriation of investment income and capital. In addition, foreign investors may be required to register the proceeds of sales; future economic or political crises could lead to price controls, forced mergers, expropriation or confiscatory taxation, seizure, nationalization, or creation of government monopolies. The currencies of emerging market countries may experience significant declines against the U.S. dollar, and devaluation may occur subsequent to investments in these currencies by a Portfolio. Inflation and
rapid fluctuations in inflation rates have had, and may continue to have, negative effects on the economies and securities markets of certain emerging market countries. Many developing countries are heavily dependent on international trade and can be adversely affected by trade barriers and protectionist measures, as well as the depreciation or devaluation of their currencies.
Additional risks of emerging markets securities may include: greater social, economic and political uncertainty and instability; more substantial governmental involvement in the economy; less governmental supervision and regulation; unavailability of currency hedging techniques; companies that are newly organized and small; differences in auditing and financial reporting standards, which may result in unavailability of material information about issuers; and less developed legal systems. Shares of companies that only trade on an emerging market securities exchange are not likely to file reports with the SEC. The availability of financial information about such companies, and its reliability, may be compromised since such companies are generally not subject to the same regulatory, accounting, auditing, or auditor oversight requirements applicable to companies that file reports with the SEC.
Investors in emerging markets may not have the ability to seek certain legal remedies in U.S. courts as private plaintiffs. As a practical matter, investors may have to rely on domestic legal remedies that are available in the emerging market and such remedies are often limited and difficult for international investors to pursue. Shareholder claims, including class action and securities law and fraud claims, generally are difficult or impossible to pursue as a matter of law or practicality in many emerging markets. In addition, the SEC, U.S. Department of Justice and other authorities often have substantial difficulties in bringing and enforcing actions against non-U.S. companies and non-U.S. persons, including company officers and directors, in certain emerging markets due to jurisdictional limitations, matters of comity and various other factors.
In addition, emerging securities markets may have different clearance and settlement procedures, which may be unable to keep pace with the volume of securities transactions or otherwise make it difficult to engage in such transactions. Settlement problems may cause a Portfolio to miss attractive investment opportunities, hold a portion of its assets in cash pending investment, or be delayed in disposing of a portfolio security. Such a delay could result in possible liability to a purchaser of the security.
Asian Investing Risk. Certain of the Portfolios may invest a significant portion of their assets in Asian securities, and those Portfolios may be more volatile than a portfolio that is broadly diversified geographically. Such investments are subject to general economic and political conditions in Asia and the Asia region may be subject to a greater degree of economic, political, and social instability than is the case in the U.S. and Europe. Many Asian countries can be characterized as emerging markets or newly industrialized and tend to
136
experience more volatile economic cycles than developed countries and are subject to the risks described above under “Emerging Markets Risk.” Many countries in Asia have historically experienced political uncertainty, corruption, military intervention, social unrest, and natural disasters.
Investing in Asian companies could be adversely affected by major hostilities in the region. If a military conflict or the perception of such a conflict occurs, it could affect many aspects of the region’s economy, which may subject a Portfolio to increased volatility. Many Asian countries are dependent on the economies of the U.S. and Europe as key trading partners. Reduction in spending on products and services or changes in the U.S. or European economies or their relationships with countries in the region may cause an adverse impact on the regional economy, which may have a negative impact on a Portfolio’s investments. Most of the securities markets of Asia have substantially less volume than markets in the U.S., and equity and debt securities of most companies in Asia are less liquid and more volatile than equity and debt securities of U.S. companies of comparable size. In addition, Asia has historically depended on oil for most of its energy requirements. Almost all of its oil is imported. In the past, oil prices have had a major impact on the Asian economy. Further, the Asian region has in the past experienced earthquakes, mud slides and tidal waves of varying degrees of severity (e.g., tsunami), and the risks of such phenomena, and the damage resulting from natural disasters, continue to exist.
China Investing. In addition to the risks of investing in foreign securities, and the risks of emerging markets and Asian investing as described above, investing in China presents additional risks. To the extent a Portfolio focuses its investments in China and Hong Kong, the value of the Portfolio may be significantly more volatile than more geographically diverse Portfolios.
Hong Kong reverted to Chinese sovereignty on July 1, 1997. Although China is obligated to maintain the current capitalist economic and social system of Hong Kong through June 30, 2047, the continuation of economic and social freedoms enjoyed in Hong Kong is dependent on the government of China. There is no guarantee that China will continue to honor its agreement to allow Hong Kong to maintain a high degree of autonomy with regard to its political, legal and economic systems, and China may change its policies regarding Hong Kong at any time. Any attempt by China to tighten its control over Hong Kong's political, economic or social policies may result in an adverse effect on Hong Kong's economy. Hong Kong’s evolving relationship with China’s central government has been a source of political unrest and may result in economic disruption. In addition, China is Hong Kong's largest trading partner, both in terms of exports and imports. The economy of Hong Kong is closely tied to the economy of China. Any changes in the Chinese economy, trade regulations or currency exchange rates may have an adverse impact on Hong Kong's economy.
Additional risks associated with investments in China and Hong Kong include exposure to currency fluctuations, less liquidity, expropriation, confiscatory taxation, nationalization, exchange control regulations (including currency blockage), trading halts, imposition of tariffs, limitations on repatriation, and differing legal standards. Any spread of an infectious illness, public health threat or similar issue could reduce consumer demand or economic output, result in market closures, travel restrictions or quarantines, and generally have a significant impact on the Chinese economy, which in turn could adversely affect a Portfolio’s investments. Inflation and rapid fluctuations in inflation and interest rates have had, and may continue to have, negative effects on the economies and securities markets of China or Hong Kong. The Chinese government could, at any time, alter or discontinue economic reform programs implemented many years ago and could return to the prior, completely centrally planned, economy. Military conflicts, either in response to internal social unrest or conflicts with other countries, are an ever present consideration. Actual and threatened responses to such military conflicts, internal social unrest, cyberattacks and other activities, including purchasing restrictions, sanctions, tariffs or cyberattacks on the Chinese government or Chinese companies, may adversely impact China’s economy and Chinese issuers of securities. The Chinese economy is highly dependent on exporting products and services and could experience a significant slowdown if there is a reduction in global demand for Chinese exports or as the result of trade tensions with key trading partners. The adoption or continuation of protectionist trade policies by one or more countries (including the U.S.) could lead to decreased demand for Chinese products and have an adverse effect on the Chinese securities markets. The current political climate has intensified concerns about heightened trade tensions between China and the U.S., as each country has imposed, and may in the future impose additional, tariffs on the other country’s products. These actions may result in a significant reduction in international trade, the oversupply of certain manufactured goods, substantial price reductions of goods and possible failure of individual companies and/or large segments of China’s export industry, which could have a negative impact on a Portfolio’s performance. U.S. companies that source material and goods from China and those that make large amounts of sales in China would be particularly vulnerable to an escalation of trade tensions. Developments regarding the course and impact of changing trade policies between the U.S. and China are difficult to predict and it is unclear whether further tariffs may be imposed or other escalating actions may be taken in the future.
Chinese authorities may intervene in the China securities market and halt or suspend trading of securities for short or even longer periods of time. The Chinese securities market continues to experience considerable volatility and has been subject to relatively frequent and extensive trading halts and suspensions. These trading halts and suspensions have, among other things, contributed to uncertainty in the markets and
137
reduced the liquidity of the securities subject to such trading halts and suspensions, which could include securities held by the Portfolios.
A Portfolio may gain exposure to companies based or operated in China by investing through legal structures known as variable interest entities. See, “Variable Interest Entities.”
Variable Interest Entities. A Portfolio may obtain exposure to companies based or operated in China by investing through legal structures known as variable interest entities (“VIEs”), which utilize offshore companies established by the Chinese company to facilitate foreign investment. Because of Chinese governmental restrictions on non-Chinese ownership of companies in certain industries in China, certain Chinese companies have used VIEs to facilitate foreign investment without distributing direct ownership of companies based or operated in China. In such cases, the Chinese operating company establishes an offshore company, and the offshore company enters into contractual arrangements (often through an intermediary entity) with the Chinese company. These contractual arrangements are intended to give the offshore company the ability to exercise power over and obtain economic rights from the Chinese company. Shares of the offshore company, in turn, are listed and traded on exchanges outside of China and are available to non-Chinese investors, such as the Fund. This arrangement allows non-Chinese investors in the offshore company to obtain economic exposure to the Chinese company without direct equity ownership in the Chinese company.
Although VIEs are a longstanding industry practice and well known to officials and regulators in China, VIEs are not formally recognized under Chinese law. There is a risk that China may cease to tolerate VIEs at any time or impose new restrictions on the structure, in each case either generally or with respect to specific industries, sectors or companies. Investments involving a VIE may also pose additional risks because such investments are made through a company whose interests in the underlying Chinese company are established through contract rather than through equity ownership. For example, in the event of a dispute, the offshore company’s contractual claims with respect to the Chinese company may be deemed unenforceable in China, thus limiting (or eliminating) the remedies and rights available to the offshore company and its investors. Such legal uncertainty may also be exploited against the interests of the offshore company and its investors. Further, the interests of the equity owners of the Chinese company may conflict with the interests of the investors of the offshore company, and the fiduciary duties of the officers and directors of the Chinese company may differ from, or conflict with, the fiduciary duties of the officers and directors of the offshore company. The VIE structure generally restricts a Portfolio’s ability to influence the Chinese company through proxy voting and other means and may restrict the ability of an issuer to pay dividends to shareholders from the Chinese company’s earnings. VIE structures also could face delisting or other ramifications for failure to meet the requirements of the
SEC, the Public Company Accounting Oversight Board (PCAOB) or other United States regulators. If these risks materialize, the value of investments in VIEs could be adversely affected and a Portfolio could incur significant losses with no recourse available.
Debt Obligations of Foreign Governments. The issuer of the foreign debt or the governmental authorities that control the repayment of the debt may be unable or unwilling to repay principal or interest when due, and the Portfolio may have limited recourse in the event of a default. The market prices of debt obligations of governments and their agencies, and the Portfolio’s net asset value, may be more volatile than prices of U.S. debt obligations.
European Economic Developments and Ongoing Brexit Risk. The Economic and Monetary Union of the European Union (“EU”) requires compliance with restrictions on inflation rates, deficits, interest rates, debt levels and fiscal and monetary controls, each of which may significantly affect every country in Europe. Decreasing imports or exports, changes in governmental or EU regulations on trade, changes in the exchange rate of the euro (the common currency of certain EU countries), the default or threat of default by an EU member country on its sovereign debt, and/or an economic recession in an EU member country may have a significant adverse effect on the economies of EU member countries and their trading partners. Political events, including nationalist unrest in Europe, uncertainties surrounding the sovereign debt of a number of EU countries and the viability of the EU (or the euro) itself, also may cause market disruptions. In addition, a number of countries in Europe have suffered terrorist attacks and additional attacks may occur in the future. Such attacks may cause uncertainty in financial markets and may adversely affect the performance of the issuers to which a Portfolio has exposure.
On January 31, 2020, the United Kingdom (“UK”) formally withdrew from the EU (commonly referred to as “Brexit”) and entered a transition period during which the UK remained part of the EU single market and customs union, which concluded on December 31, 2020. The UK and EU have since entered into a trade agreement governing the new relationship with respect to trading goods and services. While the full impact of Brexit on the UK and Europe is unknown, the UK’s departure resulted in volatility in European and global markets. Potential negative long term effects could include, among others, greater market volatility and illiquidity, disruptions to securities markets, currency fluctuations, deterioration in economic activity, a decrease in business confidence, and an increased likelihood of a recession in the UK. The value of a Portfolio’s investments, particularly those investments with exposure to the European financial markets, may be negatively impacted by the foregoing developments. Any further exits from the EU, or the possibility of such exits, may have a significant impact on the UK, Europe, and global economies, which may result in increased volatility and illiquidity, new legal and regulatory uncertainties and potentially lower economic growth for such economies that
138
could potentially have an adverse effect on the value of a Portfolio's investments. If one or more countries leave the EU or the EU dissolves, the world’s securities markets likely will be significantly disrupted.
Fund of Funds Investing. Each of the Active/Passive Allocation Suite Portfolios operate primarily as a “fund of funds” by investing in one or more portfolios of the Fund (each, an “Underlying Portfolio”), in addition to exchange-traded funds (“ETFs”), to gain exposure to the various components of its principal investment strategy. The ETFs are not portfolios of the Fund. The portfolios of the Fund that may serve as Underlying Portfolios include the following:
| Equity Portfolios |
International Portfolios |
| Growth Stock Portfolio |
International Growth Portfolio |
| Focused Appreciation Portfolio |
Research International Core Portfolio |
| Large Cap Core Stock Portfolio |
International Equity Portfolio |
| Large Cap Blend Portfolio |
Emerging Markets Equity Portfolio |
| Index 500 Stock Portfolio |
|
| Large Company Value Portfolio |
Fixed Income Portfolios |
| Domestic Equity Portfolio |
Government Money Market Portfolio |
| Equity Income Portfolio |
Short-Term Bond Portfolio |
| Mid Cap Growth Stock Portfolio |
Select Bond Portfolio |
| Index 400 Stock Portfolio |
Long-Term U.S. Government Bond Portfolio |
| Mid Cap Value Portfolio |
Inflation Managed Portfolio |
| Small Cap Growth Stock Portfolio |
High Yield Bond Portfolio |
| Index 600 Stock Portfolio |
Multi-Sector Bond Portfolio |
| Small Cap Value Portfolio |
|
The Adviser allocates the assets of the Active/Passive Allocation Suite Portfolios among the Underlying Portfolios and ETFs based on the Adviser’s economic and market outlook and the investment objectives and strategies of the Underlying Portfolios and ETFs. With respect to the equity and international Underlying Portfolios, the Adviser considers their investment focus on small, mid or large market capitalizations, domestic or foreign investments, whether the Underlying Portfolio is diversified or non-diversified and whether it employs a “growth” or “value” style of investing, among other characteristics. Under normal conditions, the equity portion of the strategy will be allocated to one or more actively managed equity and international Underlying Portfolios (or ETFs) and not to the Fund’s index portfolios: the Index 500 Stock, Index 400 Stock, and Index 600 Stock Portfolios. With respect to fixed income Underlying Portfolios, the Adviser considers their focus on investment grade or non-investment grade debt securities, domestic or foreign investments, whether the issuer is a government or government agency, the duration and maturity of the Underlying Portfolio or ETF, and other characteristics. The Adviser regularly reviews and adjusts the allocation among the Underlying Portfolios and ETFs to favor investments that the Adviser believes provide the most favorable position for achieving the Portfolio’s investment objective.
In connection with the allocation process, the Adviser may from time to time invest more than 25% of the assets of the Active/Passive Allocation Suite Portfolios in one Underlying Portfolio or one ETF.
Through its investments in the equity and international Underlying Portfolios and ETFs, the Active/Passive Allocation Suite Portfolios may be exposed to a wide range of equity securities and other instruments, including small, mid and large cap U.S. and non-U.S. stocks. Equity securities could include common and preferred stocks, securities convertible into stocks and depositary receipts for those securities. Through its investments in the fixed income Underlying Portfolios and ETFs, each Portfolio may be exposed to a wide range of fixed income securities with varying durations and maturities, including investment grade and non-investment grade debt securities, debt of corporate and government issuers, inflation-indexed debt securities, and other fixed income instruments. An Underlying Portfolio or ETF may invest a large percentage of its assets in a single issuer, security, market or sector (or limited group thereof) or in the case of an international Underlying Portfolio or international ETF, may invest in emerging markets, a small number of countries or a particular geographic region. An Underlying Portfolio or ETF may also use certain derivative instruments including futures, forwards, options and swaps to meet their investment objective and for cash management purposes. For a discussion of equity securities, foreign securities (including emerging markets) and derivatives, see the corresponding headings above in this section of the Prospectus.
Risks of Fund of Funds Investing. To the extent that the Active/Passive Allocation Suite Portfolios invest in an Underlying Portfolio or ETF, the Portfolio indirectly bears all the risks associated with the investment strategies used by that Underlying Portfolio or ETF in direct proportion to the amount of assets the Portfolio allocates to that Underlying Portfolio or ETF, and bears a pro rata share of the Underlying Portfolio’s or ETF’s expenses in addition to its own expenses. A description of the principal investment strategies, the principal risks associated with those strategies, and expense information for each Underlying Portfolio is set forth in the “PORTFOLIO SUMMARIES” section at the beginning of this Prospectus. To the extent that the Portfolio invests a significant portion of its assets in a single Underlying Portfolio or single ETF, it will be particularly sensitive to the risks associated with that Underlying Portfolio or ETF, and changes in the value of that Underlying Portfolio or ETF may have a significant effect on the Portfolio’s net asset value. The performance of each such Portfolio is significantly impacted by the investment performance of the Underlying Portfolios and ETFs it holds. The ability of the Portfolio to meet its investment objective with respect to its fund of funds strategy is related to the ability of the Underlying Portfolios and ETFs to meet their respective investment objectives as well as the Adviser’s allocation decisions with respect to the Underlying Portfolios and ETFs. The Underlying Portfolios and ETFs will pursue their
139
investment objectives and strategies without the approval of the Portfolios. If an Underlying Portfolio or ETF were to change its investment objective or strategies, a Portfolio may be forced to withdraw its investment from the Underlying Portfolio or ETF at a disadvantageous time. Because the Portfolios and the Underlying Portfolios are affiliated funds, the Portfolios are subject to risks associated with such affiliation. The Adviser will have the authority to select and allocate investments of the Portfolios among the Underlying Portfolios. The Adviser may be subject to potential conflicts of interest in selecting Underlying Portfolios because the fees paid to it by some Underlying Portfolios are higher than the fees paid by other Underlying Portfolios. Moreover, a situation could occur where proper action for a Portfolio could be adverse to the interest of the Underlying Portfolios or vice versa.
Underlying Portfolio Risks. The Underlying Portfolios are used as investments for the Active/Passive Allocation Suite Portfolios, and may have a large percentage of their shares owned by such Portfolios. Subject to the investment policies of the Active/Passive Allocation Suite Portfolios, there is no limit on the percentage of an Underlying Portfolio’s shares that may be owned by such Portfolios and such ownership percentage may exceed a majority of an Underlying Portfolio’s shares. For information relating to ownership by the Active/Passive Balanced and Active/Passive Moderate Portfolios of each of the Underlying Portfolio’s shares, see “Appendix C – Ownership of Shares of the Fund” in the Fund’s Statement of Additional Information. Each Underlying Portfolio may experience large investments or redemptions from a Portfolio due to reallocation or rebalancing of the Portfolios. In the event of a large investment by a Portfolio, the Underlying Portfolio may be unable to quickly deploy the new funds in its strategy resulting in a larger cash position than typical for a period of time, which may cause the Portfolio to miss out on potential investment opportunities and gains if the market advances during that period. Large redemption activity by a Portfolio could result in the Underlying Portfolio being forced to sell portfolio securities at a loss to meet redemptions. Large redemptions by a Portfolio could also cause an Underlying Portfolio’s expense ratio to increase due to a resulting smaller asset base. Consequently, relatively large investments and redemptions by a Portfolio could adversely affect the performance of a Portfolios and the Underlying Portfolios. The Adviser may coordinate directly with the portfolio managers of the Underlying Portfolios to attempt to ensure that transactions are accommodated efficiently, including possibly implementing trades over a period of days rather than all at once. These practices may temporarily affect the Adviser’s ability to fully implement a Portfolio’s investment strategies. In addition, each Underlying Portfolio is subject to investment restrictions imposed by SEC Rule 12d1-4, which limits the Underlying Portfolio’s investments other funds to 10% of its total assets. For this purpose, funds include mutual funds, ETFs and other types of pooled investment vehicles like CLOs, CDOs, private mortgage REITS and other private securities relying on Sections 3(c)(1)
or (7) of the Investment Company Act of 1940, as amended, to avoid registration. These restrictions may limit the ability of an Underlying Portfolio to fully pursue its investment strategy.
High Yield Bonds. The High Yield Bond Portfolio invests primarily in high yield debt securities as a principal investment strategy. The Multi-Sector Bond Portfolio may invest in high yield bonds as part of its principal investment strategy. The Fund considers a debt security to be “high yield,” or non-investment grade (sometimes referred to as “junk bonds”), if the debt security is rated below investment grade by at least two of the three credit ratings agencies used by the Fund (BB+ or lower by S&P; Ba1 or lower by Moody’s; BB+ or lower by Fitch), or if unrated, determined by the Portfolio’s Adviser or Sub-Adviser to be of comparable quality. See “Fixed Income Securities – Credit Risk”, above, for more information on the Fund’s use of credit ratings agencies.
Risks of Investing in High Yield Bonds. The historical financial condition of the issuers of these securities is usually not as strong as that of other issuers and the price of these securities is usually more volatile and more likely to react to developments affecting market and credit risk than are more highly rated securities. As a result, high yield debt securities are subject to greater levels of interest rate and credit risk and greater risk of loss of income and principal than higher rated securities. Also, the trading markets for high yield debt securities tend to be less liquid than the trading markets for more highly rated securities and a Portfolio could find it more difficult to sell such securities or only sell at prices lower than more widely traded securities.
Illiquid Investments. Each Portfolio may invest up to 15% (5% for the Government Money Market Portfolio) of net assets in illiquid investments, which may include restricted securities, private placements by public and privately held entities and Rule 144A securities. An illiquid investment means any investment that the Fund reasonably expects cannot be sold or disposed of in current market conditions in seven calendar days or less without the sale or disposition significantly changing the market value of the investment, as determined pursuant to the provisions of Rule 22e-4. For example, some securities are not registered under U.S. securities laws and cannot be sold in a U.S. public offering because of SEC regulations (these are known as “restricted securities”). Under procedures adopted by the Fund’s Board of Directors, certain restricted securities may be deemed liquid, and will not be counted toward this 15% (or 5%, as applicable) limit.
Risks of Investing in Illiquid Securities. Investments in illiquid securities involve liquidity risk to the extent that a Portfolio may be unable to sell an illiquid security or sell at a reasonable price. This risk may be magnified during periods of economic turmoil or in an extended economic downturn. In addition, in order to sell a restricted security, a Portfolio might have to bear the expense and incur the delays associated with registering the shares with the SEC.
140
The value of a security on a given date depends entirely on its market price. Investors necessarily rely on the integrity of the marketplace. There is no guarantee that the securities markets will function in an orderly manner. High yield securities, foreign securities and securities with small capitalizations may be more thinly traded than other securities, which normally causes them to be less liquid and more difficult for a Portfolio to buy, sell and price such securities. In addition, during periods of extreme volatility or in an extended economic downturn, it may not be possible to liquidate positions at advantageous times or prices, which could have the effect of decreasing the overall level of a Portfolio’s liquidity. To the extent that a Portfolio’s principal investment strategies involve foreign securities, derivatives or securities with substantial market and/or credit risk, the Portfolio will tend to have a higher exposure to liquidity risk.
Indexed Investing. The Index 400 Stock, Index 500 Stock and Index 600 Stock Portfolios (the “Index Portfolios”) employ an indexing strategy as a principal investment strategy in an attempt to achieve their investment objectives. That is, they seek to replicate the performance of a target index by investing all, or substantially all of their assets in the stocks that make up the index, in approximately the same weighting as the index.
Indexing Strategy Risk. The Index Portfolios use a passive management strategy, which is not “actively” managed, and therefore does not engage in shifting portfolio assets to take advantage of market opportunity, and does not attempt to manage market volatility, use defensive strategies or reduce the effects of any long-term periods of poor stock performance. Since the Index Portfolios implement a full replication strategy with respect to the particular index which they each track, to the extent the index has a significant allocation to an industry or group of industries, a particular sector, or to a single issuer or small number of issuers, the Index Portfolio will exhibit a significant investment level in that industry, group of industries, sector, issuer or small number of issuers. Portfolio performance may be adversely affected by a significant investment in an industry, group of industries, sector, issuer or small number of issuers, and may be more susceptible to adverse economic, market, political or regulatory developments affecting the industry, group of industries sector or issuer(s) subject to a significant level of investment.
Tracking Error Risk. The Index Portfolios may be subject to tracking error, which is the divergence of an Index Portfolio’s performance from that of the underlying index. Tracking error may occur because of differences between the securities and other instruments held in the Portfolio and those included in the underlying index, changes in the composition of the underlying index and the timing of rebalance transactions by the Portfolio, pricing differences (including, as applicable, differences between a security’s price at the local market close and the Portfolio’s valuation of a security at the time of calculation of the Portfolio’s net asset value), transaction costs incurred by the Portfolio, the Portfolio’s holding of uninvested cash, differences in timing of the accrual of or the valuation of dividends or
interest, the requirements to maintain pass-through tax treatment, transactions carried out to minimize the distribution of capital gains to shareholders, the costs to the Portfolio of complying with various new or existing regulatory requirements and the timing of purchases and redemptions of Portfolio shares. Tracking error also may occur due to the Portfolio’s investment in futures and exchange traded funds, as the values of such investments may not correlate as intended with the underlying index. Tracking error risk may be heightened during times of increased market volatility or other unusual market conditions. Tracking error also may result because the Index Portfolio incurs fees and expenses, while the underlying index does not.
Inflation-Indexed Bonds. The Inflation Managed Portfolio invests in inflation-indexed bonds as a primary part of its principal investment strategies. Inflation-indexed bonds are fixed income securities whose principal value is periodically adjusted according to the rate of inflation. If the index measuring inflation falls, the principal value of inflation-indexed bonds will be adjusted downward, and consequently the interest payable on these securities (calculated with respect to a smaller principal amount) will be reduced. Repayment of the original bond principal upon maturity (as adjusted for inflation) is guaranteed in the case of U.S. Treasury inflation-indexed bonds. For bonds that do not provide a similar guarantee, the adjusted principal value of the bond repaid at maturity may be less than the original principal.
Risks of Inflation-Indexed Bonds. The value of inflation-indexed bonds is expected to change in response to changes in real interest rates. Real interest rates are tied to the relationship between nominal interest rates and the rate of inflation. If nominal interest rates increase at a faster rate than inflation, real interest rates may rise, leading to a decrease in value of inflation-indexed bonds. Short-term increases in inflation may lead to a decline in value. Any increase in the principal amount of an inflation-indexed bond will be considered taxable ordinary income, even though investors do not receive their principal until maturity.
Investment Styles. Actively managed Portfolios may utilize a particular style of investing, such as “growth” or “value,” or a combination of both.
Investment Style Risk. Market performance tends to be cyclical, and during various cycles, the market may not favor the portion of the Portfolio that utilizes a particular style of investing, such as growth or value, and a Portfolio’s returns may vary considerably from other Portfolios or other funds using different investment styles. “Growth” stocks are typically priced higher than other stocks, in relation to earnings and other measures, because investors believe they have more appreciation potential. This potential may or may not be realized and growth stock prices tend to fluctuate more dramatically than the overall stock market. “Growth” stocks also may provide minimal dividends. “Value” stocks are typically those that the portfolio managers believe are
141
undervalued in relation to their intrinsic values. The price of “value” stocks may turn out to have been too high, or the market may not recognize what the portfolio managers believe are their intrinsic values.
Leverage. Certain transactions in which the Portfolios engage may give rise to a form of leverage including, among others, swap agreements, futures contracts, and other derivative instruments (See, “Derivatives”, above), and the use of when issued, delayed delivery or forward commitment transactions (See, “When Issued, Delayed Delivery and Forward Commitment Transactions”, below) . To seek to mitigate leveraging risk, a Portfolio will segregate or “earmark” assets determined to be liquid by the Adviser or Sub-Adviser or otherwise cover its positions in a permissible manner.
Leverage Risk. The use of leverage may cause a Portfolio to liquidate portfolio positions when it may not be advantageous to do so to satisfy its obligations. Leverage, including borrowing, may cause a Portfolio to be more volatile than if the Portfolio had not been leveraged because leverage tends to exaggerate the effect of any increase or decrease in the value of a Portfolio’s securities holdings.
Loans and Other Direct Debt Instruments. The Portfolios may invest in fixed- and floating-rate loans, including senior loans, and other direct debt instruments. In particular, the Multi-Sector Bond Portfolio invests in loans, including senior loans, as a principal investment strategy. Such investments generally will be in the form of loan participations and assignments of portions of such loans. Loan participations typically represent a direct investment, together with other parties, in a loan to a corporate borrower, and generally are offered by banks or other financial institutions or lending syndicates. The Portfolios may participate in such syndications, or may buy part of the loan, becoming a part lender. The Portfolios may invest in loan participations with credit quality comparable to that of issuers of its securities investments. Senior loans are syndicated commercial loans with floating interest rates, typically providing for a fixed spread above the three-month London Interbank Offered Rate. Such loans generally provide for the lenders to have a claim on underlying company assets which is senior to unsecured debt holders and preferred and common shareholders.
Loan Risk. To the extent the Fund invests in loans, it is exposed to risks associated with more traditional debt securities as well as additional risks. Loan participations and assignments involve credit risk, interest rate risk, liquidity risk, and the risks of being a lender. The Fund’s ability to receive payments in connection with the loan depends primarily on the financial condition of the corporate borrower and whether a loan is secured by collateral. Although some loans are secured by collateral, there is no assurance that the liquidation of collateral from a secured loan would satisfy the corporate borrower’s obligation, or that the collateral can be liquidated. When an interest in a direct debt instrument is acquired through purchasing loan participations, a Portfolio assumes the credit risk associated with the corporate borrower and may also assume the credit risk associated with the interposed bank or
other financial intermediary. The loan participations in which a Portfolio invests may not be rated by any nationally recognized rating service. Indebtedness of companies whose creditworthiness is poor involves substantially greater risks, and may be highly speculative. Some companies may never pay off their indebtedness, or may pay only a small fraction of the amount owed. In the event of a bankruptcy of a corporate borrower, the Fund could experience delays or limitations in its ability to realize the benefits of any collateral securing a loan. All direct debt instruments involve a risk of loss in cases of default or insolvency of the borrower. Loans may decline in market value if their interest rates do not rise as much or as fast as interest rates in general. An economic downturn or individual corporate developments could adversely affect the market for loans and reduce the Fund’s ability to sell these instruments at an advantageous time or price. An economic downturn would generally lead to a higher non-payment rate, and the loan may lose significant market value before a default occurs. There is no organized exchange or board of trade on which loans are traded and the market for loans has limited transparency. As such, the secondary market for loans may be comparatively limited relative to markets for other more liquid fixed income securities. Restrictions on transfers in loan agreements, a lack of publicly-available information, irregular trading activity and wide bid/ask spreads among other factors, may, in certain circumstances, make loans more difficult to sell at an advantageous time or price than other types of securities or instruments. Loans may also be subject to extension risk (the risk that borrowers will repay a loan more slowly in periods of rising interest rates) and prepayment risk (the risk that borrowers will repay a loan more quickly in periods of falling interest rates). In addition, loan investments may not be considered securities and may not have the protections afforded by the federal securities laws.
Senior Loan Risk. To the extent the Portfolios invest in senior loans, including bank loans, the Portfolios will be subject to the general risks associated with loans, and may be subject to enhanced levels of credit risk, call risk, settlement risk and liquidity risk. These instruments are considered predominantly speculative with respect to an issuer’s continuing ability to make principal and interest payments and such loans are rated below investment grade. Senior loans may be more volatile than other types of loans and direct debt instruments. The market for senior loans is generally considered illiquid. As a result of the foregoing risks and related factors, a Portfolio may be unable to realize full value for the senior loans and/or may not receive the proceeds from a sale of a senior loan for an extended period after such sale, each of which could result in losses to a Portfolio. Senior loans may have extended trade settlement periods, including settlement periods of greater than 7 days, which may result in cash not being immediately available to a Portfolio. If an issuer of a senior loan prepays or redeems the loan prior to maturity, a Portfolio may have to reinvest the proceeds in other senior loans or similar instruments that pay lower interest rates. Senior loans that are considered to be “covenant-lite” offer less protection to the loan holder and may have increased credit risk and call risk.
142
Covenant-lite senior loans may also be subject to heightened liquidity risk. Because of the risks involved in investing in senior loans, an investment in a Portfolio that invests in such instruments should be considered speculative.
Mortgage Related and Other Asset-Backed Securities. Each Portfolio may invest in mortgage- and asset-backed securities. In particular, the Short-Term Bond, Select Bond, Long-Term U.S. Government Bond, Inflation Managed, Multi-Sector Bond, Active/Passive Allocation Suite Portfolios may invest in mortgage- and asset-backed securities as a principal investment strategy. An asset-backed security is a fixed income security that derives its credit worthiness from cash flows relating to a pool of assets. There are a number of different types of asset-backed securities, including mortgage-backed securities, securities backed by other pools of collateral (such as automobile loans, credit card receivables and home equity loans), collateralized mortgage obligations and collateralized debt obligations. Mortgage-backed securities are asset-backed securities backed by pools of residential and commercial mortgages, which may include sub-prime mortgages. Mortgage related securities include mortgage pass-through securities, collateralized mortgage obligations (“CMOs”), commercial mortgage-backed securities, mortgage dollar rolls, to-be-announced (“TBA”) mortgage-backed securities, specified pools of forward settling mortgage-backed securities, CMO residuals stripped mortgage-backed securities (“SMBSs”) and other securities that directly or indirectly represent a participation in, or are secured by and payable from, mortgage loans on real property.
Risks of Mortgage- and Asset-Backed Securities. The value of some mortgage- or asset-backed securities may be particularly sensitive to changes in prevailing interest rates. Early repayment of principal on some mortgage related securities may expose a Portfolio to a lower rate of return upon reinvestment of principal. When interest rates rise, the value of a mortgage related security generally will decline; however, when interest rates are declining, the value of mortgage related securities with prepayment features may not increase as much as other fixed income securities. The rate of prepayments on underlying mortgages will affect the price and volatility of a mortgage related security, and may shorten or extend the effective maturity of the security beyond what was anticipated at the time of purchase. If unanticipated rates of prepayment on underlying mortgages increase the effective maturity of a mortgage related security, the volatility of the security can be expected to increase. The value of these securities may fluctuate in response to the market’s perception of the creditworthiness of the issuers. Additionally, although mortgages and mortgage related securities are generally supported by some form of government or private guarantee and/or insurance, there is no assurance that private guarantors or insurers will meet their obligations.
Mortgage- and asset-backed securities are subject to prepayment risk. When borrowers refinance their mortgages to take advantage of declining interest rates, their existing
mortgages are prepaid. The mortgages, which back the mortgage-backed securities purchased by a Portfolio, may be prepaid in this fashion. Likewise, borrowers may prepay the credit card or automobile trade receivables, home equity loans, corporate loans or bonds or other assets underlying a Portfolio’s asset-backed securities. When this happens, a Portfolio will be required to purchase new securities at current rates, which will usually be lower. Because of this prepayment risk, a Portfolio investing in mortgage- and asset-backed securities may benefit less from declining interest rates than other funds. Mortgage risk is the risk that in a period of rising interest rates, mortgage related securities may exhibit additional volatility, which may increase the volatility of a Portfolio’s share price. In addition, in some places, local governments may seek to use their eminent domain powers to buy underwater home loans held by mortgage-backed securities. The price of the loans purchased in such cases may be made at a discount to the loan’s true value.
Mortgage- and asset-backed securities are also subject to varying degrees of credit risk, depending on whether they are issued by agencies or instrumentalities of the U.S. government (including those whose securities are neither guaranteed nor issued by the U.S. government) or by non-governmental issuers. Mortgage-backed securities offered by non-governmental issuers are subject to specific risks, such as the failure of private insurers to meet their obligations and unexpectedly high rates of defaults on the mortgages backing the securities. Although there is generally a liquid market for these investments, those securities issued by private organizations may not be readily marketable. Mortgage-backed securities are subject to the risk of loss of principal if the obligors of the underlying obligations default in their payment obligations. The risk of defaults associated with mortgage-backed securities is generally higher in the case of mortgage-backed investments that include sub-prime mortgages. Asset-backed securities may be subject to risks similar to those associated with mortgage-backed securities, as well as risks associated with the nature and servicing of the assets underlying the securities. Asset-backed securities may not have the benefit of a security interest in collateral comparable to that of mortgage assets, resulting in additional credit risk.
Municipal Securities. One type of debt security in which the Portfolios may invest are municipal securities. The Multi-Sector Bond Portfolio may invest in municipal securities as a principal investment strategy. Municipal debt securities include general obligation bonds of municipalities, local or state governments, project or revenue-specific bonds, or pre-refunded or escrowed bonds, including hybrids and synthetic securities. Municipal securities are issued to raise money for a variety of public and private purposes, including general financing for state and local governments, or financing for a specific project or public facility. Municipal securities may be backed by the local government, by the credit of a private issuer, by the current or anticipated revenues from a specific project or specific assets, or by domestic or foreign entities providing credit support such as letters of credit, guarantees or insurance.
143
Risks of Investing in Municipal Securities. Municipal securities can be significantly affected by political changes as well as uncertainties in the municipal markets relating to taxation, legislative changes, or the rights of municipal security holders. Because many municipal securities are issued to finance similar projects, especially those related to education, health care, transportation and utilities, conditions in those sectors can affect the overall municipal market. In addition, changes in the overall financial condition of an individual municipal issuer can affect the overall municipal market. Municipal securities backed by current or anticipated revenues from a specific project or specific assets can be negatively affected by the discontinuance of the taxation supporting the project or assets or the inability to collect revenues for the project or from the assets. If the Internal Revenue Service determines that an issuer of a municipal security has not complied with applicable tax requirements, interest from the security could become taxable and the security could decline significantly in value.
Each Portfolio may also invest in municipal bonds issued pursuant to the American Recovery and Reinvestment Act of 2009 (the “Act”), which provides for the issuance of taxable municipal debt on which the issuer receives federal support of the interest paid (“Build America Bonds”). The Act authorizes state and local governments who issue Build America Bonds to elect to either (i) receive a direct payment from the federal government equal to 35% of the interest costs; or (ii) provide federal tax credits to investors in the bonds equal to 35% of the coupon interest received. The federal interest subsidy or tax credit benefit continues for the life of the bonds. Unlike most other municipal bonds, interest received on Build America Bonds is subject to federal taxation. Issuance of Build America Bonds ended on December 31, 2010.
Build America Bonds are subject to the same types of risks as other municipal bonds. Build America Bonds are not issued or guaranteed by the U.S. Treasury and the government subsidy does not enhance the issuer’s creditworthiness. The credit of the bond is backed by the municipality issuing the bond, not the federal government. In addition, if the issuer fails to continue to meet the applicable requirements of the Act, it is possible that the issuer may not continue to receive the federal subsidy, thereby impairing the issuer’s ability to make payments on the bond. Some Build America Bonds have been issued with provisions that allow state and local governments to “call” the bonds back if the federal government stops paying a subsidy on the interest.
Federal legislation passed in 2011 to raise the federal debt ceiling included a provision referred to as “sequestration,” which provides for automatic federal spending cuts in the absence certain other Congressional action to address the federal budget deficit, beginning on March 1, 2013. Under the sequestration provision, the federal subsidy payments to issuers of Build America Bonds have been reduced. The U.S. Congress has continued to extend the period for sequestration, and it was most recently extended through 2029 by the Bipartisan Budget Act of 2019. Since the subsidy cuts began, some municipalities
have called or announced plans to call Build America Bonds from investors. Reductions to the subsidy may increase the risk that issuers of Build America Bonds may call the bonds back, as noted above, and increases the risk that issuers may be unable to meet all or part of their payment obligations.
Real Estate Investment Trusts (REITs). The Active/Passive Allocation Suite, Focused Appreciation, Large Cap Core Stock, Large Cap Blend, Equity Income, Mid Cap Growth Stock, Mid Cap Value, Small Cap Growth Stock and Small Cap Value Portfolios, may invest in real estate investment trusts, or REITs, as a principal investment strategy, while the other Portfolios may invest in REITs as a non-principal investment strategy. REITs are pooled investment vehicles that typically invest directly in real estate, mortgages and loans collateralized by real estate, or in a combination of the two. “Equity” REITs invest primarily in real estate that produces income from rentals. “Mortgage” REITs invest primarily in mortgages and derive their income from interest payments. REITs usually specialize in a particular type of property and may concentrate their investments in particular geographical areas. Investments in REITs may provide the Portfolio with an efficient, low-cost means of diversifying among various types of property in different regions.
Risks of Investing in REITs. Investments in REITs are subject to the types of risks associated with investing in the real estate industry, including, among other risks: adverse developments affecting the real estate industry; declines in real property values; changes in interest rates; defaults by mortgagors or other borrowers and tenants; lack of availability of mortgage funds or financing; extended vacancies of properties, especially during economic downturns; casualty or condemnation losses; property taxes and operating losses; and governmental actions, such as changes to tax laws, zoning regulations or environmental regulations. REITs are dependent upon the quality of their management, may have limited financial resources and heavy cash flow dependency, may not be diversified geographically or by property type, and may be subject to self-liquidation. Because REITs are pooled investment vehicles that have their own expenses, the Portfolio will indirectly bear its proportionate share of those expenses. REITs are subject to the risk of failing to maintain their exemptions from registration as investment companies under the Investment Company Act of 1940, as amended,, and the possibility of failing to satisfy specific requirements under the Internal Revenue Code of 1986, as amended (the “Code”) that allow REITs to pass through income to shareholders without paying tax at the entity level.
Repurchase Agreements. The Government Money Market Portfolio may enter into repurchase agreements as a principal investment strategy, and each other Portfolio may enter into repurchase agreements as a non-principal investment strategy. When a Portfolio enters into a repurchase agreement, the Portfolio purchases a security from a bank or broker-dealer who agrees to repurchase the security at the Portfolio’s cost plus interest within a specified time. The other party to a repurchase agreement may be located inside or outside of the U.S. The
144
Government Money Market Portfolio may invest 100% of its assets in repurchase agreements that are fully collateralized by U.S. government securities.
Repurchase Agreements Risk. If the party agreeing to repurchase should default, the Portfolio will seek to sell the securities which it holds. This could involve procedural costs or delays in addition to a loss on the securities if their value should fall below their repurchase price. If the other party to a repurchase agreement is located outside of the U.S., these risks may be heightened. Repurchase agreements maturing in more than seven days are considered illiquid securities.
Sector Focus. At times, a Portfolio may have a relatively high percentage of its assets invested in securities of companies conducting business in a particular sector. Among the Portfolios that may from time to time exhibit an elevated level of investment in a particular sector are the following: the Growth Stock, Focused Appreciation, Large Cap Core Stock, Large Cap Blend, Large Company Value, Domestic Equity, Equity Income, Mid Cap Growth Stock, Mid Cap Value, Small Cap Growth Stock, Small Cap Value, International Growth, Research International Core, International Equity, Emerging Markets Equity, and Active/Passive Allocation Suite Portfolios. Dependent on a number of factors, including the implementation of an investment strategy by a Portfolio, changing market and economic conditions, and adjustments or modifications to a Portfolio’s benchmark index, other Portfolios may have an elevated level of investment in a particular sector at any point in time. (The Index 500 Stock Portfolio may have a heightened level of investment in a particular sector due to the composition of the benchmark index with which it aligns.)
Sector Focus Risk. To the extent the Portfolio invests a relatively high percentage of its assets in a particular sector, it will have greater exposure to the risks associated with that sector, including the risk that the securities of companies within the sector will underperform due to adverse economic conditions, regulatory or legislative changes, or increased competition affecting the sector. To the extent the Portfolio is underweight in other sectors, the Portfolio risks missing out on advances in those sectors.
When a Portfolio has an elevated level of investment in a particular sector, there may be specific risks associated with companies that belong to that economic sector. Portfolios with an elevated level of investment in the following sectors may be subject to the risks associated with the particular sector as described below:
Information Technology Sector Risks. Companies in the information technology sector can be adversely affected by intense competition, both domestically and internationally, which may impact their profit margins. Information technology companies may have limited product lines, markets, financial resources, or personnel. The products of information technology companies may face obsolescence due to rapid technological developments, frequent new product
introduction, unpredictable changes in growth rates, competition for the services of qualified personnel, and changing consumer preferences. Companies in the information technology sector are heavily dependent on patent and intellectual property rights. The loss or impairment of these rights may adversely affect the profitability of these companies.
Certain of the largest information technology companies, including Meta (Facebook), Alphabet (Google), Amazon and Apple, have been subject to increased scrutiny regarding the use and handling of data collected from individuals utilizing their services and standards applicable to online content. They have also been targeted for investigation concerning potential anticompetitive conduct. Concern regarding the data practices employed by these companies has prompted the European Commission to evaluate compliance with its General Data Protection Regulation, which adopted strict privacy controls in Europe in 2018. The European Parliament and EU member states recently agreed upon the Digital Services Act, which addresses illegal and harmful content on social media platforms. The Act sets out standards for illegal content, with an accompany requirement for removal of such content, imposes a ban on targeted advertising aimed at children, and establishes obligations for the vetting of third-party sellers. Draft legislation has been introduced in the U.S. House of Representatives Energy and Commerce Committee, which oversees online privacy issues, which could diminish the ability of companies like Google and Facebook to monitor users across the internet and require them to get permission to share their customers’ data with others, among other restrictions. Review of potential anticompetitive conduct is occurring on multiple fronts, including an investigation by the U.S. House of Representatives Antitrust Subcommittee into potential abusive conduct in the information technology sector, the conduct of antitrust probes by the U.S. Federal Trade Commission and U.S. Department of Justice, and the opening of antitrust investigations by state attorneys general from multiple U.S. states. The Judiciary Committee of the U.S. Senate recently approved legislation (the American Innovation and Choice Online Act) which would make it illegal for the largest internet platforms to unfairly favor their own products and services over those of other businesses that use the platform. The foregoing activities, although targeted principally on a focused group of the largest companies within the sector, may have far-reaching ramifications which may be significantly impactful across the information technology sector.
Financials Sector Risks. Performance of companies in the financials sector may be adversely impacted by many factors, including, among others, government regulations, economic conditions, credit rating downgrades, changes in interest rates, and decreased liquidity in credit markets. The potential for additional regulation could reduce profit margins and adversely affect the scope of activities of such companies, increase the amount of capital they must maintain, and limit the amounts and types of loans and other financial commitments they can
145
make. In addition, companies in the financials sector may also be negatively impacted by decreases in the availability of capital, increased borrowing costs, the rate of debt defaults, increased competition and adverse conditions in other related markets.
Healthcare Sector Risks. The profitability of healthcare companies may be adversely affected by extensive government regulations, restrictions on government reimbursement for medical expenses, rising costs of medical products and services, pricing pressure, an increased emphasis on outpatient services, a limited number of products, industry innovation, changes in technologies and other market developments. Many healthcare companies are heavily dependent on patent protection. The expiration of a company’s patents may adversely affect that company’s profitability. Many healthcare companies are subject to litigation based on product liability and similar claims. Healthcare companies are subject to competitive forces that may make it difficult to raise prices and, in fact, may result in price discounting. Many new products in the healthcare sector are subject to regulatory approval requirements. The process of obtaining such approvals may be long and costly, and such efforts ultimately may be unsuccessful. Companies in the healthcare sector may be thinly capitalized and may be susceptible to product obsolescence.
Industrials Sector Risks. Companies in the industrials sector may be affected by a number of economic factors, including global economic growth trends and the state of global manufacturing. Companies may be challenged by a tight labor market, which may result in difficulties filling critical jobs, which can serve as a constraint on growth. Companies in the sector may be impacted by geopolitical tensions, and trade arrangements among significant trade partners, such as the U.S. and China. The imposition of tariffs and the related impact on trading can threaten profitability, and uncertainty arising from changing trade agreements can affect trade flows and capital and resource planning. Such factors can lower management confidence in capital spending, which can negatively affect revenue growth. The sector has significant exposure to emerging markets, and is affected by capital goods and services demand fluctuations as may occur in emerging market countries.
Communication Services Sector Risks. Industries within this sector include telecommunication services (diversified and wireless), media, entertainment, and interactive media and services. Companies in the communication services sector can be significantly affected by government regulation, intense competition, rapid changes in technology, and changes in consumer and business spending and preferences. From the standpoint of regulation, recent developments include a significant focus on antitrust concerns, which creates potential risk for search engine and social media companies in this sector. Recent more restrictive privacy laws and requirements have also been an area of focus for regulators, impacting the manner in which companies may use and rely upon consumer data. Operational risk may be heightened due to economic and market environmental factors. Individual industry groups and
companies in the sector may be affected by the commoditization of key service offerings, such as streaming and cellular phone service, where significant competition and pricing sensitivity can diminish customer loyalty and result in frequent turnover of providers.
Consumer Discretionary Sector Risk. The consumer discretionary sector may be affected by changes in domestic and international economies, exchange and interest rates, competition, consumers’ disposable income and consumer preferences, social trends and marketing campaigns. The success of consumer product manufacturers and retailers is tied closely to the performance of the overall global economy, interest rates, competition and consumer confidence. Success depends heavily on disposable household income and consumer spending. Also, companies in the consumer discretionary sector may be subject to severe competition, which may have an adverse impact on their respective profitability. Changes in demographics and consumer tastes can also affect the demand for, and success of, consumer products and services in the marketplace.
Securities of Other Investment Companies. The Portfolios may acquire securities of other investment companies, including exchange-traded funds and business development companies, subject to the limitations of the Investment Company Act of 1940, as amended. The Small Cap Value Portfolio may invest in a variety of investment companies as part of its principal investment strategies. As a shareholder of another investment company, a Portfolio would bear, along with other shareholders, its pro rata portion of the other investment company’s expenses, including advisory expenses. These indirect expenses would be in addition to the management fee that each Portfolio bears directly in connection with its own operations. The expenses associated with business development companies in particular may be significant. Fees and expenses incurred indirectly by a Portfolio as a result of its investing in investment companies, business development companies and other pooled investment vehicles are reflected in a Portfolio’s fee and expense table in “Other Expenses,” if the indirect expenses incurred by the Portfolio do not exceed 0.01% (one basis point) of the Portfolio’s average net assets or in a separate line item called “Acquired Fund Fees and Expenses,” if such amount exceeds 0.01% of the Portfolio’s average net assets.
Each Portfolio may invest in exchange traded funds (ETFs) with the same percentage limitations as investments in registered investment companies. Portfolios that may invest in ETFs as part of their principal investment strategies include the Index 500 Stock, Index 400 Stock, Index 600 Stock, Small Cap Growth Stock, Small Cap Value, and Active/Passive Allocation Suite Portfolios. ETFs are a type of fund bought and sold on a securities exchange. An ETF trades like common stock and usually represents a fixed portfolio of securities designed to track the performance and dividend yield of a particular domestic or foreign market index. A Portfolio may purchase an ETF to temporarily gain exposure to a portion of the U.S. or foreign market while awaiting the purchase of underlying securities. The Active/Passive Allocation Suite Portfolios may
146
purchase ultra-short bond ETFs in order to enhance short duration returns. The Portfolios may rely on Rule 12d1-4 under the Investment Company Act of 1940, as amended that permits funds meeting various conditions to invest in ETFs in amounts exceeding limits set forth in Section 12(d) of the Investment Company Act of 1940, as amended, that would otherwise be applicable.
Each Portfolio may invest in business development companies (BDCs). The Small Cap Value Portfolio may invest in BDCs as part of its principal investment strategies. BDCs are a type of registered investment company that typically invests in and lends to small and medium-sized private companies that may not have access to public equity markets for raising capital. Some BDCs may also be invested in a relatively small number of holdings or concentrate in a particular industry or sector.
Risks of Investing in Securities of Other Investment Companies. As with other investments, investments in other investment companies are subject to market and selection risks. Registered investment companies and unregistered investment companies generally entail the same risks as the underlying securities held by them. A Portfolio investing in another investment company may be affected by the losses of the underlying funds and the level of risk arising from the investment practices of the underlying funds.
Risks of Investing in ETFs. The main risk of investing in an index based investment is the same as investing in a portfolio of equity securities comprising the index, although lack of liquidity in an ETF could result in it being more volatile. As a shareholder of another investment company, a Portfolio investing in ETFs would bear its pro rata portion of the other investment company’s expenses, including advisory fees, in addition to the expenses the Portfolio bears directly in connection with its own operation. The market prices of index based investments will fluctuate in accordance with both changes in the market value of their underlying portfolio securities and due to supply and demand for the instruments on the exchanges on which they are traded, which may result in their trading at a discount or premium to their net asset values. A Portfolio will overpay for the ETF’s assets if it is trading at a premium and will get less than the value of the ETF’s assets are selling if it is trading at a discount. Index based investments may not replicate exactly the performance of their specific index because of transaction costs and because of the temporary unavailability of certain component securities of the index. An active market for an ETF may not be developed or maintained. Furthermore, trading of an ETF’s shares may be halted by the exchange on which the ETF is listed, in which case a Portfolio would be unable to sell its shares of the ETF unless and until trading is resumed. To the extent that authorized participants do not place sufficient creation and redemption orders, an ETF's shares may trade at a premium or discount or may face a trading halt or delisting. Investments in ultra-short bond ETFs may pose greater risk than investment in cash equivalents such as money market mutual funds, including risks associated with credit quality, duration and interest rate sensitivity of the bond instruments held within such ETFs.
Ultra-short bond ETFs may be volatile and involve greater credit and interest rate risk than money market funds and other cash equivalents. The price of an ultra-short bond ETF may fluctuate, while the goal of a money market mutual fund is to maintain its NAV at a stable $1 per share. Ultra-short bond ETFs may lose money despite a stated investment objective of returning capital. The risk profile of ultra-short bond ETFs is affected by the strategy of such ETFs to seek to produce higher yields as well as environmental risks that affect bond holdings generally, including interest rate movements.
Risks of Investing in BDCs. Like investments in other types of investment companies, a Portfolio that invests in BDCs would bear its pro rata portion of the BDC’s expenses; the expenses associated with some BDCs may be significant. A BDC is subject to the risks inherent in investing in smaller companies, including that portfolio companies may be dependent on a small number of products or services and may be more adversely affected by poor economic or market conditions. Investments in such small companies may also be less liquid than publicly traded companies. To the extent BDCs have a relatively small number of holdings or concentrate in a particular industry or sector, the BDC is particularly subject to the risks associated with those holdings, industries and sectors, which may also increase the BDC’s volatility and risk. Shares of a BDC may not be redeemable at the option of shareholders and therefore may trade at a discount or premium to its net asset value, which means the Portfolio will overpay for an BDC’s assets if it is trading at a premium and will get less than the value of the BDC’s assets when selling if it is trading at a discount. An active market for a BDC may not be developed or maintained.
Short Sales. Each Portfolio may make short sales as part of its overall portfolio management strategies or to offset a potential decline in value of a security. In particular, the Long-Term U.S. Government Bond Portfolio and the Multi-Sector Bond Portfolio may engage in short sales as part of their principal investment strategies. A short sale involves the sale of a security that is borrowed from a broker or other institution to complete the sale. A Portfolio may also enter into a short derivative position through a futures contract or swap agreement.
Risks of Short Sales. Short sales expose a Portfolio to the risk that it will be required to acquire, convert or exchange securities to replace the borrowed securities (also known as “covering” the short position) at a time when the securities or derivative sold short have appreciated in value, thus resulting in a loss to the Portfolio. A Portfolio making a short sale may segregate or “earmark” assets determined to be liquid by the Adviser or Sub-Adviser or otherwise cover its position in a permissible manner.
Stable Net Asset Value. The Government Money Market Portfolio operates as a “government money market fund” under Rule 2a-7 of the Investment Company Act of 1940, as amended. As a government money market fund, the Portfolio seeks to maintain a net asset value (“NAV”) of $1.00 per share,
147
and is required to, among other things, invest at least 99.5% of its total assets in U.S. Government Securities, cash, and repurchase agreements securities by U.S. Government Securities or cash. See “Government Money Market Portfolio—Summary” under the “PORTFOLIO SUMMARIES” section at the beginning of this Prospectus and the “U.S. Government Securities” section, below.
Stable Net Asset Value Risk. The Government Money Market Portfolio may not be able to maintain a stable NAV of $1.00 per share at all times. If the Portfolio fails to maintain a stable NAV (or there is a perceived threat of such failure), the Portfolio, along with other money market funds, could be subject to increased redemption activity. In 2023, the SEC adopted new regulations governing how money market funds may operate when interest rates are negative. Should a negative interest rate scenario occur in future periods and cause the Government Money Market Portfolio to have negative gross yield, the Portfolio has the flexibility under the final rules to use a floating NAV or engage in share cancellation (via a reverse distribution mechanism (“RDM”)) if the Board determines either course is in the best interests of the Portfolio. If the Portfolio converts to a floating NAV in a negative interest rate environment, the Portfolio’s losses will be reflected through a declining share price. If the Portfolio uses share cancellation, the Portfolio will maintain a stable share price, despite losing value, by reducing the number of its outstanding shares. If it is anticipated that the Portfolio will convert to a floating NAV or engage in share cancellation, the Portfolio will reassess its disclosures to ensure that such disclosures adequately describe the consequences, including specifically tax consequences, to shareholders.
U.S. Government Securities. The Government Money Market, Short-Term Bond, Select Bond, Long-Term U.S. Government Bond, Inflation Managed, Multi-Sector Bond, Active/Passive Allocation Suite Portfolios may invest in U.S. government securities as a principal investment strategy. U.S. government securities include direct obligations of the U.S. government, including U.S. Treasury bonds, bills, notes, and other obligations, and those issued or guaranteed by various U.S. government agencies and instrumentalities, including government sponsored enterprises. U.S. Treasury obligations are guaranteed as to the timely payment of interest and principal when held to maturity, but the market prices for such securities are not guaranteed and will fluctuate. Obligations issued or guaranteed by U.S. government agencies or instrumentalities may not be guaranteed by the U.S. Treasury or otherwise backed by the full faith and credit of the U.S. government. For example, the Government National Mortgage Association (“GNMA”), a wholly owned U.S. Government corporation, is authorized to guarantee, with the full faith and credit of the U.S. government, the timely payment of principal and interest on securities issued by institutions approved by GNMA and backed by pools of mortgages insured by the Federal Housing Administration or guaranteed by the Department of Veterans Affairs. Government-related guarantors
(i.e., not backed by the full faith and credit of the U.S. Government) include the Federal National Mortgage Association (“FNMA”) and the Federal Home Loan Mortgage Corporation (“FHLMC”). Securities issued by FNMA are guaranteed as to timely payment of principal and interest by FNMA but are not backed by the full faith and credit of the U.S. Government. FHLMC guarantees the timely payment of interest and ultimate collection of principal, but its participation certificates are not backed by the full faith and credit of the U.S. government. U.S. government agency obligations also include, but are not limited to, those of the Student Loan Marketing Association, Federal Home Loan Banks, Federal Intermediate Credit Banks, Tennessee Valley Authority, and Federal Farm Credit Banks.
U.S. Government Securities Risk. As indicated above, not all obligations of the U.S. government, its agencies and instrumentalities are backed by the full faith and credit of the U.S. Treasury. Some obligations are backed only by the credit of the issuing agency or instrumentality, and in some cases there may be some risk of default by the issuer. Any guarantee by the U.S. government or its agencies or instrumentalities of a security held by the Portfolio does not apply to the market value of such security or to shares of the Portfolio itself. No assurance can be given that the U.S. government would provide financial support to any U.S. government agency or instrumentality if it is not obligated to do so by law.
Special Considerations. On September 7, 2008, FNMA and FHLMC were placed under the conservatorship of the Federal Housing Finance Agency (FHFA) to provide stability in the financial markets, mortgage availability and taxpayer protection by preserving FNMA and FHLMC’s assets and property and putting FNMA and FHLMC in a sound and solvent condition. Under the conservatorship, the U.S. Treasury received senior preferred equity shares and warrants as a means to provide access for FNMA and FHLMC to significant financial support. Also at that time, the U.S. Treasury instituted a secured lending credit facility, available to FNMA and FHLMC to assist the entities in funding their regular business activities in the capital markets. In October 2019, the FHFA issued a Strategic Plan which outlines an end-state vision for FNMA and FHLMC to return to operating as fully-private companies within a competitive, liquid, efficient, and resilient housing finance system. The Strategic Plan articulates the commitment of FHFA that it will ensure that FNMA and FHLMC have the capital reserves, risk management capabilities, corporate governance, and regulatory oversight that are appropriate for their size, risk, and systematic importance outside of conservatorship. The FHFA advises that the attainment of the goal of ending the conservatorships is subject to achieving significant changes on multiple fronts, including changes to the housing finance market, changes in the scope of regulatory and supervisory authority accorded FHFA in a post-conservatorship environment, and changes in the operation of both FNMA and FHLMC, including particularly changes in business models which will facilitate
148
the maintenance of capital levels that will prudently support business risk levels. While the FHFA has articulated the end-state vision which would permit FNMA and FHLMC to exit conservatorship, achievement of this goal, the projected timeline within which such goal can be accomplished, and the ultimate terms under which such conservatorships may end, is uncertain.
Variable and Floating Rate Securities. Variable and floating rate securities provide for a periodic adjustment in the interest rate paid on the obligations. Each Portfolio may invest in floating rate debt instruments (“floaters”) and engage in credit spread trades. Each Portfolio may also invest in inverse floating rate debt instruments (“inverse floaters”). The Fixed Income Portfolios, and in particular, the Government Money Market Portfolio, may invest in variable and floating rate securities as part of their principal investment strategies.
Risks of Variable and Floating Rate Securities. While floaters provide a certain degree of protection against rises in interest rates, a Portfolio will participate in any declines in interest rates as well. An inverse floater may exhibit greater price volatility than a fixed rate obligation of similar credit quality. In addition, the absence of an active market for these securities could make it difficult for a Portfolio to dispose of them if the issuer defaults.
When Issued, Delayed Delivery and Forward Commitment Transactions. Each Portfolio may purchase securities which it is eligible to purchase on a when issued basis, may purchase and sell such for delayed delivery and make contracts to purchase such securities for a fixed price at a future date beyond normal settlement time (forward commitments). In particular, the Government Money Market, Long-Term U.S. Government Bond and Multi-Sector Bond Portfolios may make such investments as part of their principal investment strategies.
Risks of When Issued, Delayed Delivery and Forward Commitment Transactions. When issued transactions, delayed delivery purchases and forward commitments involve a risk of loss if the value of the securities declines prior to the settlement date. This risk is in addition to the risk that the Portfolio’s other assets will decline in value. Therefore, these transactions may result in a form of leverage and increase a Portfolio’s overall investment exposure. Typically, no income accrues on securities a Portfolio has committed to purchase prior to the time delivery of the securities is made, although a Portfolio may earn income on securities it has segregated or “earmarked” to cover these positions.
Non-Principal Investment Strategies and Risks
Commodities. Certain of the Portfolios may invest in instruments, including exchange traded funds, whose performance is linked to the price of an underlying commodity or commodity index as a non-principal investment strategy. To the extent a Portfolio makes such investments, the Portfolio may be subject to the risks of investing in physical commodities. These types of risks include regulatory, economic
and political developments, weather events, and natural disasters, pestilence and market disruption. Commodity prices may have greater volatility than investments in traditional securities.
Delayed Funding Loans and Revolving Credit Facilities. The Portfolios may also enter into, or acquire participations in, delayed funding loans and revolving credit facilities, in which a lender agrees to make loans up to a maximum amount upon demand by the borrower during a specified term. The commitments may have the effect of requiring a Portfolio to increase its investment in a company at a time when it might not otherwise decide to do so (including at a time when the company’s financial condition makes it unlikely that such amounts will be repaid). To the extent that a Portfolio is committed to advance additional funds, it may segregate or “earmark” assets determined to be liquid by the Adviser or Sub-Adviser in an amount sufficient to meet such commitments. Delayed funding loans and revolving credit facilities are subject to credit, interest rate and liquidity risk and the risks of being a lender.
ESG Considerations. With respect to the Growth Stock, Large Cap Core Stock, Domestic Equity, Equity Income, Small Cap Growth Stock, Small Cap Value, Research International Core, Short-Term Bond, and High Yield Bond Portfolios, the adviser may integrate ESG factors into their research processes for certain investments. The ESG factors considered are those most likely to have a material impact on the financial risk or performance of a Portfolio’s investments. For illustrative purposes only, such ESG factors may include carbon emissions, waste and harmful substance management, labor relations, employee safety, diversity, human rights issues, and corporate governance structure and oversight. The weight given to all investment factors, including ESG considerations, will vary relative to the impact they may have on the risk/return assessment of the issuer.
Master Limited Partnerships. The Portfolios may invest in master limited partnerships (“MLPs”). MLPs are limited partnerships whose limited partnership interests (units) are traded on a public exchange. As a result, MLP units are generally more liquid than units of private limited partnerships. MLPs have two types of partners – one or more general partners that conduct the day-to-day management of the MLP, and one or more limited partners that contribute capital but are not involved in the day-to-day management. When a Portfolio invests in a MLP, it becomes a limited partner. Limited partners have limited control over the MLP and may have limited voting rights on matters affecting the MLP. There may be fewer corporate protections afforded investors in an MLP than investors in a corporation. Conflicts of interest may exist among unit holders, subordinated unit holders and the general partner of an MLP, including those arising from incentive distribution payments. MLPs that concentrate in a particular industry or region are subject to risks associated with such industry or region. MLPs holding credit-related investments are subject to interest rate risk and the risk of default on payment
149
obligations by debt issuers. Investments held by MLPs may be illiquid. MLP units may trade infrequently and in limited volume, and they may be subject to abrupt or erratic price movements. MLPs typically pay higher distributions than other types of companies. The amount of cash a MLP can distribute to its partners will depend on the amount of cash it generates from its operations and its operating costs, working capital needs and other like factors, all of which are affected by market movements and factors affecting its business lines. The benefit of investing in MLPs depends largely on the MLP being treated as a partnership for federal income tax purposes, which are not subject to income tax at the entity level. To qualify as a partnership for federal income tax purposes, a MLP must receive at least 90% of its income from qualifying sources as set forth in the Code, which include, among others, interest, dividends, real property rents, certain capital gains, and the exploration, development, mining, production, processing, refining, transportation, and marketing of oil, gas, minerals and other natural resources. If, as a result of a change in current law or change in an MLP’s business, an MLP were treated as a corporation for federal income tax purposes, the MLP would be obligated to pay federal income tax on its income at the corporate tax rate. In such cases, the amount of cash available for distribution would be reduced and the distributions received by the Portfolio might be taxed entirely as dividend income.
Temporary Defensive Investments and Cash Reserves. A certain portion of a Portfolio’s assets may be held in cash or money market reserves. Short-term, high-quality U.S. and foreign dollar denominated money market securities, including repurchase agreements, may be held by any Portfolio. In times of unstable or adverse market or economic conditions, up to 100% of a Portfolio’s assets may be invested in temporary defensive instruments in an effort to enhance liquidity or preserve capital. Temporary defensive investments may be inconsistent with a Portfolio’s principal investment strategies and generally include cash, cash equivalents such as commercial paper, money market instruments, short-term debt securities, U.S. government securities or repurchase agreements. A Portfolio could also hold these types of securities pending the investment of proceeds from the sale of Portfolio shares or Portfolio securities, to meet anticipated redemptions of Portfolio shares or in support of a Portfolio’s position in certain derivative instruments. A Portfolio may invest in temporary defensive investments for undetermined periods of time, depending on market or economic conditions. To the extent a Portfolio holds cash reserves or invests defensively in these securities, it might not achieve its investment objective.
Other Investments and Techniques. The Portfolios may invest in other types of securities and use a variety of investment techniques and strategies which are not described in this
Prospectus. These securities and techniques may subject the Portfolios to additional risks. Please see the Statement of Additional Information for additional information about the securities and investment techniques described in this Prospectus and about additional securities and techniques that may be used by the Portfolios.
Other Risks
Cyber Security. The Fund and its service providers have administrative and technical safeguards in place with respect to information security. Nevertheless, the Fund and its service providers are potentially susceptible to operational and information security risks resulting from a cyber-attack as the Fund is highly dependent upon the effective operation of its computer systems and those of its business partners. These risks include, among other things, the theft, misuse, corruption and destruction of data maintained online or digitally, denial of service on websites and other operational disruption and unauthorized release of confidential customer information. Cyber-attacks affecting Northwestern Mutual, the Fund, the Adviser, Sub-Advisers, custodians, intermediaries and other affiliated or third-party service providers may adversely affect the Fund and contract owners. For instance, cyber-attacks may interfere with the processing of Fund transactions, including the processing of orders, impact the Fund’s ability to calculate net asset values, cause the release and possible destruction of confidential customer or business information, impede trading, subject the Fund and/or its service providers and intermediaries to regulatory fines and financial losses and/or cause reputational damage. Cyber security risks may also impact the issuers of securities in which the Fund invests, which may cause the Fund’s investments to lose value. The Fund may also incur additional costs for cyber security risk management in the future. There can be no assurance that the Fund or its service providers will avoid losses affecting the Fund due to cyber-attacks or information security breaches in the future.
Operational Risk. The Fund is exposed to operational risk arising from a number of factors, including but not limited to, human error, processing and communication errors, errors of the Fund’s service providers, counterparties or other third parties, failed or inadequate processes and technology or system failures. Additionally, the success of a Portfolio will depend in part upon the skill and expertise of certain personnel of the Portfolio’s Sub-Adviser, and there can be no assurance that any such personnel will continue to be associated with a Portfolio.
Regulation Risk. Laws and regulations affecting the Fund, the Adviser and the Sub-Advisers change from time to time. The Fund cannot predict the effects, if any, of future legal and regulatory changes on the Fund.
150
THE INVESTMENT ADVISER AND SUB-ADVISERS
The Investment Adviser
The investment adviser for each Portfolio is Mason Street Advisors, LLC, a wholly owned subsidiary of Northwestern Mutual. Mason Street Advisors’ address is 720 East Wisconsin Avenue, Milwaukee, Wisconsin 53202. Mason Street Advisors provides advisory and related services to Northwestern Mutual Series Fund, Inc. (the “Fund”). As of December 31, 2025, Mason Street Advisors had approximately $33.3 billion in assets under management.
As investment adviser, Mason Street Advisors manages the operations of the Fund and provides investment advice and recommendations regarding the purchase and sale of securities for those Portfolios that do not employ a sub-adviser. For those Portfolios that employ a sub-adviser, Mason Street Advisors oversees and evaluates the activities of the sub-advisers, including investment performance, investment operations and processes. See also “Manager of Managers Structure”, below. Pursuant to its advisory agreement with the Fund, Mason Street Advisors also provides or procures the management of the Fund’s administrative affairs, including mutual fund accounting services, legal services, investment operations services and corporate and regulatory reporting, oversees the Fund’s service providers and provides overall risk management for the Fund, including investment, operational and financial risk.
The Sub-Advisers
Each of the following sub-advisers has been retained by Mason Street Advisors and the Fund pursuant to an investment sub-advisory agreement to provide investment advice and, in general, to conduct the management investment program of one or more Portfolios, subject to the general control of the Board of Directors of the Fund and Mason Street Advisors:
abrdn Investments Limited (formerly known as Aberdeen Asset Managers Limited) (“Aberdeen”), a Scottish company, with its registered offices at 10 Queen’s Terrace, Aberdeen, Scotland AB10 1XL, has served as sub-adviser to the Emerging Markets Equity Portfolio since March 2017. Aberdeen is an indirect wholly-owned subsidiary of Aberdeen Group plc which has registered offices at 1 George Street, Edinburgh, Scotland EH2 2LL. Aberdeen Group plc provides asset management and investment solutions for clients and customers worldwide and also has a strong position in the pensions and savings market.
Allspring Global Investments, LLC (“Allspring”), 1415 Vantage Park Drive, Charlotte, North Carolina, 28203, has served as sub-adviser to the Select Bond Portfolio since 2021 (with the Allspring portfolio management team providing management services to the Portfolio on behalf of the previous sub-adviser since 2014). Allspring is a wholly-owned subsidiary of Allspring Global Investment Holdings, LLC, a
holding company indirectly owned by certain private funds of GTCR LLC and Reverence Capital Partners, L.P. Allspring is a leading independent asset management firm that offers a broad range of investment products and solutions through thoughtful investing, purposeful planning, and the desire to deliver outcomes that expand above and beyond financial gains.
American Century Investment Management, Inc. (“American Century Investments”), 4500 Main Street, Kansas City, Missouri 64111, has been managing mutual funds since 1958. American Century Investments has served as sub-adviser to the Large Company Value and Inflation Managed Portfolios since May 2007 and to the Mid Cap Value Portfolio since February 2009. American Century Investments is a direct, wholly owned subsidiary of American Century Companies, Inc. (“ACC”). The Stowers Institute for Medical Research (“SIMR”) controls ACC by virtue of its beneficial ownership of more than 25% of the voting securities of ACC. SIMR is part of a non-for-profit biomedical research organization dedicated to finding the keys to the causes, treatments and prevention of disease.
BlackRock Advisors, LLC (“BlackRock”), 100 Bellevue Parkway, Wilmington, Delaware 19809, an indirect, wholly owned subsidiary of BlackRock, Inc., has served as sub-adviser to the Government Money Market Portfolio since November 2014 and the Index 500 Stock Portfolio since February 2021. BlackRock was organized in 1994 to perform advisory services for investment companies.
Dodge & Cox, 555 California Street, 40th Floor, San Francisco, California 94104, has served as sub-advisor for the International Equity Portfolio since November 2021. Dodge & Cox, a California corporation, is one of the oldest professional investment management firms in the United States, having acted continuously as investment managers since 1930. Dodge & Cox’s activities are devoted to investment research and the supervision of investment accounts for individuals and institutions.
Federated Investment Management Company (“Federated”), 1001 Liberty Avenue, Pittsburgh, Pennsylvania 15222-3779, has served as sub-adviser to the High Yield Bond Portfolio since November 2014. Federated is an indirect, wholly owned subsidiary of Federated Hermes, Inc. (“FHI”). FHI is a client-driven, multi-product, and multi-strategy investment manager. FHI provides world-class active investment management and engagement services to more than 10,000 institutions and intermediaries including corporations, government entities, insurance companies, foundations and endowments, banks and broker/dealers.
FIAM LLC (“FIAM”), 900 Salem Street, Smithfield, Rhode Island, 02917, has served as sub-adviser to the International Growth Portfolio since August 2015. FIAM provides
151 Northwestern Mutual Series Fund, Inc. Prospectus
investment management services to institutional investors worldwide. FIAM is an indirectly held, wholly owned subsidiary of FMR LLC.
J.P. Morgan Investment Management Inc. (“JPMIM”), 383 Madison Avenue, New York, NY 10179, serves as sub-adviser to the Large Cap Blend Portfolio since July 2023 and the Mid Cap Growth Stock Portfolio effective from and after October 28, 2024. JPMIM is a wholly-owned subsidiary of JPMorgan Asset Management Holdings Inc., which is a wholly-owned subsidiary of JPMorgan Chase & Co., a bank holding company.
Loomis, Sayles & Company, L.P. (“Loomis Sayles”), One Financial Center, Boston, Massachusetts 02111, has served as sub-adviser to the Focused Appreciation Portfolio since August 2015. Loomis Sayles is a Delaware limited partnership. Loomis Sayles’ sole general partner, Loomis, Sayles & Company, Inc. is directly owned by Natixis Investment Managers, LLC (“Natixis LLC”). Natixis LLC is an indirect subsidiary of Natixis Investment Managers, an international asset management group based in Paris, France, that is in turn owned by Natixis, a French investment banking and financial services firm. Natixis is wholly owned by BPCE, France’s second largest banking group. BPCE is owned by banks comprising two autonomous and complementary retail banking networks consisting of the Caisse d’Epargne regional savings banks and the Banque Populaire regional cooperative banks. The registered address of Natixis is 30, avenue Pierre Mendès France, 75013 Paris, France. The registered address of BPCE is 50, avenue Pierre Mendès France, 75013 Paris, France.
Massachusetts Financial Services Company (MFS®(1)), 111 Huntington Avenue, Boston, Massachusetts 02199, has served as sub-adviser for the Research International Core Portfolio since May 2007. MFS® is America’s oldest mutual fund organization. MFS® and its predecessor organizations have a history of money management dating from 1924 and the founding of the first mutual fund, Massachusetts Investors Trust. MFS is a subsidiary of Sun Life of Canada (U.S.) Financial Services Holdings, Inc., which in turn is an indirect, majority-owned subsidiary of Sun Life Financial Inc., a diversified financial services company.
Northern Trust Investments, Inc. (“Northern Trust”), 50 South LaSalle Street, Chicago, Illinois 60603, an indirect subsidiary of Northern Trust Corporation, has served as sub-adviser to the Index 400 Stock and Index 600 Stock Portfolios since February 2021. Northern Trust is an Illinois State Banking Corporation and an investment adviser registered under the Investment Advisers Act of 1940, as amended. It primarily manages assets for institutional and individual separately managed accounts, investment companies and bank common and collective funds.
Pacific Investment Management Company LLC (“PIMCO”), 650 Newport Center Drive, Newport Beach, California 92660, has served as sub-adviser for the Multi-Sector Bond Portfolio and the Long-Term U.S. Government Bond Portfolio since May 2007. PIMCO was organized in 1971 and provides investment management and advisory services to private accounts of institutional and individual clients and to mutual funds. PIMCO is a majority-owned subsidiary of Allianz Asset Management of America LLC (“AAM”), which is a subsidiary of Allianz SE (“Allianz”). Allianz is a European-based, multinational insurance and financial services holding company.
Putnam Investment Management, LLC (“Putnam”), 100 Federal Street, Boston, MA 02110, has served as sub-adviser to the Domestic Equity Portfolio since July 2025. Putnam is an indirect wholly-owned subsidiary of Franklin Resources, Inc. (“FRI”). FRI and its predecessors have been engaged in the financial services business, marketing, distribution, transfer agency and administrative services since 1947. Putnam is a global diversified, equity asset manager and specialist investment manager of FRI.
T. Rowe Price Associates, Inc. (“TRPA”), 1307 Point Street, Baltimore, Maryland 21231, is a wholly owned subsidiary of T. Rowe Price Group, Inc., a publicly traded financial services holding company. TRPA has served as the sub-adviser for the Equity Income Portfolio since May 2003, the Short-Term Bond Portfolio since November 2014, the Growth Stock Portfolio since November 2019, and the Small Cap Value Portfolio from August 2001 – March 7, 2022.
T. Rowe Price Investment Management, Inc. (“TRPIM”), 1307 Point Street, Baltimore, Maryland 21231, is a wholly owned subsidiary of T. Rowe Price Associates, Inc., an investment management firm and wholly owned subsidiary of T. Rowe Price Group, Inc., a publicly traded financial services holding company (collectively, “T. Rowe Price”). TRPIM has served as the sub- adviser for the Small Cap Value Portfolio since March 7, 2022.
Wellington Management Company LLP (“Wellington Management”), 280 Congress Street, Boston, Massachusetts 02210, has served as sub-adviser to the Small Cap Growth Stock Portfolio since July 2013 and the Large Cap Core Stock Portfolios since October 2017. Wellington Management is a professional investment counseling firm that provides investment services to investment companies, employee benefit plans, endowments, foundations, and other institutions. Wellington Management and its predecessor organizations have provided investment advisory services for over 90 years. Wellington Management is owned by the partners of Wellington Management Group LLP.
(1)
MFS® is a registered trademark of Massachusetts Financial Services Company.
Northwestern Mutual Series Fund, Inc. Prospectus 152
Portfolio Managers
A brief biography of each portfolio manager who has responsibility for the day-to-day management of one or more Portfolios is set forth below. Please see the Statement of Additional Information for additional information about the portfolio managers’ investments in the Portfolio(s) that they manage, a description of portfolio manager compensation and information regarding other accounts that the portfolio managers manage.
Growth Stock Portfolio
Paul D. Greene II, CFA, Vice President of TRPA and an Associate Portfolio Manager of TRPA’s US Large-Cap Core Growth Equity Strategy in the U.S. Equity Division, has managed the Portfolio since 2020. Mr. Greene has served as portfolio manager for several T. Rowe Price funds. He joined TRPA in 2006, beginning as a member of the firm’s U.S. Equity Division.
Focused Appreciation Portfolio
Aziz V. Hamzaogullari, CFA, is the founder of the Growth Equity Strategies Team and Chief Investment Officer at Loomis Sayles. He is the Portfolio Manager of the Loomis Sayles Large Cap Growth, All Cap Growth, Global Growth and International Growth long-only strategies as well as the Long/Short Growth Equity strategy. Offerings include the Loomis Sayles US Growth Equity, US Equity Leaders and Global Growth Equity funds, along with US products. Mr.Hamzaogullari is also a member of the Firm’s Board of Directors. He joined Loomis Sayles in 2010 from Evergreen Investments where he was a senior portfolio manager. He joined Evergreen in 2001, was promoted to director of research in 2003 and portfolio manager in 2006. Mr.Hamzaogullari was head of Evergreen’s Berkeley Street Growth Equity team and was the founder of the research and investment process. Prior to Evergreen, he was a senior equity analyst and portfolio manager at Manning & Napier Advisors. Mr.Hamzaogullari is a member of the Board of Trustees at Dana Hall School in Wellesley, Massachusetts. He earned a BS from Bilkent University, Türkiye, and an MBA from George Washington University. Mr.Hamzaogullari is also a CFA® charterholder and a member of the CFA Society of Boston.
Large Cap Core Stock Portfolio
Jonathan G. White, CFA and Head of Research Portfolios of Wellington Management, has managed the Portfolio since 2017. He joined Wellington Management in 1999 and has been in his current role since 2013. Prior to his current position, he was manager of equity portfolio coordination for the firm.
Mary L. Pryshlak, CFA, Head of Investment Research of Wellington Management, has managed the Portfolio since 2018. She joined Wellington Management in 2004 and has been in her current role since 2018. Prior to her current position, she was a Global Industry Analyst covering property and casualty insurance stocks.
Large Cap Blend Portfolio
Scott B. Davis,Managing Director, joined J.P. Morgan Investment Management Inc. in 2006, previously worked as an analyst in the U.S. Equity Research Group, became a portfolio manager in 2013 and has managed the Portfolio since 2023.
Shilpee Raina,Executive Director, CFA charterholder, joined J.P. Morgan Investment Management Inc. in 2005, previously worked as a research analyst on the JPMorgan Equity Income and U.S. Value Funds, and has managed the Portfolio since 2023.
Index 500 Stock Portfolio
Peter Sietsema, CFA, Director of BlackRock, Inc. since 2007, member of Black Rock’s Index Equity Portfolio Management Group, has managed the Portfolio since 2022.
Jennifer Hsui, CFA, Managing Director of BlackRock, Inc. since 2011, Director of BlackRock, Inc. from 2009 to 2011, Principal of BGI from 2006 to 2009, has managed the Portfolio since 2021.
Matt Waldron, CFA, Managing Director of BlackRock since 2023, US Head of International Portfolio Management within BlackRock Global Markets & Index Investments (“BGM”) since 2022, joined BlackRock in 2003 and has managed the Portfolio since 2025.
Steven White, Director since 2020, Head of the Active Risk Index ETF team in the Americas, and co-CIO for Index Equity Investments within BGM since 2024, joined BlackRock in 2011 and has managed the Portfolio since 2025.
Large Company Value Portfolio
American Century Investments uses teams of portfolio managers and analysts, organized by broad investment categories, to manage funds. The listed portfolio managers are members of the team that manages the Large Company Value Portfolio and are ultimately responsible for the day-to-day management of the Portfolio, which includes security selection and portfolio construction, as well as compliance with stated investment objectives.
Brian Woglom, CFA, Vice President and Senior Portfolio Manager, joined American Century Investments in 2005 and became a portfolio manager in 2012.
Philip Sundell, CFA, Vice President and Portfolio Manager, joined American Century Investments in 1997 and became a portfolio manager in 2017.
Adam Krenn, CFA, Portfolio Manager and Senior Investment Analyst, joined American Century Investments in 2011 and became a portfolio manager in 2020.
Kevin Toney, CFA, Chief Investment Officer – Global Value Equity, Senior Vice President and Senior Portfolio Manager, joined American Century in 1999 and became a portfolio manager in 2006.
153 Northwestern Mutual Series Fund, Inc. Prospectus
Domestic Equity Portfolio
Darren Jaroch, CFA, Portfolio Manager of Putnam, joined Putnam in 1999 and has managed the Portfolio since 2025.
Lauren DeMore, CFA, Portfolio Manager of Putnam, joined Putnam in 2006 and has managed the Portfolio since 2025.
Equity Income Portfolio
The Equity Income Portfolio is managed by an investment advisory committee whose chairman is John D. Linehan, a Vice President of TRPA. As investment advisory committee chairman, he has day-to-day responsibility for managing the Portfolio and works with the committee in developing and executing its investment program. Mr. Linehan has been chairman of the Portfolio’s committee since 2015 and joined TRPA in 1998. Since 2015, he has served as portfolio manager and the Head of U.S. Equity for TRPA.
Mid Cap Growth Stock Portfolio
Felise L. Agranoff, Managing Director, joined J.P. Morgan Investment Management, Inc. in 2004,previously worked as an analyst in the U.S. Equity Group, became a portfolio manager in 2015 andhas managed the Portfolio since 2024.
Michael Stein,CFA, Managing Director, joined J.P. Morgan Investment Management, Inc. in 2014 as a research analyst in the U.S. Equity Group, and became a portfolio manager in 2023 and has managed the Portfolio since 2025.
Index 400 Stock Portfolio
Lucy Johnston, Vice President of Northern Trust Investments, Inc., has managed the Portfolio since 2021. Ms. Johnston joined Northern Trust Investments, Inc. in 1997 and has managed passive and index products for large, medium and small capitalization markets.
Keith Carroll, Portfolio Manager at Northern Trust Investments, Inc., has managed the Portfolio since 2024. Mr. Carroll joined Northern Trust Investments, Inc. in 2007.
Mid Cap Value Portfolio
American Century Investments uses teams of portfolio managers and analysts, organized by broad investment categories, to manage funds. The listed portfolio managers are members of the team that manages the Mid Cap Value Portfolio and are ultimately responsible for the day-to-day management of the Portfolio, which includes security selection and portfolio construction, as well as compliance with stated investment objectives.
Kevin Toney, CFA, Chief Investment Officer — Global Value Equity, Senior Vice President and Senior Portfolio Manager, joined American Century Investments in 1999 and became a portfolio manager in 2006.
Brian Woglom, CFA, Vice President and Senior Portfolio Manager, joined American Century Investments in 2005 and became a portfolio manager in 2012.
Nathan Rawlins, CFA, Portfolio Manager and Senior Investment Analyst, joined American Century in 2015 as an investment analyst, became a senior investment analyst in 2020 and a portfolio manager in 2022.
Small Cap Growth Stock Portfolio
David Siegle, CFA, Managing Director and Equity Portfolio Manager of Wellington Management, has managed the Portfolio since 2023. He joined Wellington Management in 2001 and has been an investment professional since 2001.
Index 600 Stock Portfolio
Keith Carroll, Portfolio Manager at Northern Trust Investments, Inc., has managed the Portfolio since 2021. Mr. Carroll joined Northern Trust Investments, Inc. in 2007.
Lucy Johnston, Vice President of Northern Trust Investments, Inc., has managed the Portfolio since 2024. Ms. Johnston joined Northern Trust Investments, Inc. in 1997 and has managed passive and index products for large, medium and small capitalization markets.
Small Cap Value Portfolio
J. David Wagner, CFA, a Vice President of T. Rowe Price Investment Management, Inc. (“TRPIM”) has managed the Portfolio in his capacity with TRPIM since 2022 and had managed the Portfolio in his capacity with T. Rowe Price Associates, Inc. since 2014. He has day-to-day responsibility for managing the Portfolio. Mr. Wagner joined T. Rowe Price in 2000.
International Growth Portfolio
Jed Weiss, Portfolio Manager, has managed the Portfolio since 2015. Mr. Weiss has worked as a research analyst and portfolio manager (other than for a 6-month leave of absence in 2017) at Fidelity Management & Research Company, LLC. (an affiliate of FIAM LLC) since 1997.
Research International Core Portfolio
John Mahoney, CFA, Investment Officer of MFS, has been employed in the investment area of MFS since January 2024, and had previously served as a Senior Strategist - Investment Product Specialist at MFS until January 2024. Mr. Mahoney has managed the Portfolio since 2024.
Nicholas Paul, CFA, Investment Officer of MFS, has been employed in the investment area of MFS since 2018, and had previously served as an investment product specialist at MFS since 2010. Mr. Paul has managed the Portfolio since 2022.
Northwestern Mutual Series Fund, Inc. Prospectus 154
Mr. Paul and Mr. Mahoney co-manage the Portfolio, each providing general oversight of a team of investment professionals.
International Equity Portfolio
The Portfolio is managed by Dodge & Cox’s International Equity Investment Committee (“IEIC”), whose members are jointly and primarily responsible for the management of the Portfolio. The IEIC consists of the following members:
Roger G. Kuo, CFA, President since 2022, Director since 2016, Research Analyst since 1998 and member of IEIC since 2006, joined Dodge & Cox in 1998 and has managed the Portfolio since 2021.
Sophie Chen, CFA, Vice President since 2016, Research Analyst since 2012 and member of IEIC since 2024, joined Dodge & Cox in 2012 and has managed the Portfolio since 2024.
Englebert T. Bangayan, CFA. Vice President since 2011, Research Analyst since 2002, and member of IEIC since 2015, joined Dodge & Cox in 2002 and has managed the Portfolio since 2021.
Raymond J. Mertens, CFA, Senior Vice President and Director since 2022, Vice President since 2008, Research Analyst since 2003, and member of IEIC since 2018, joined Dodge & Cox in 2003 and has managed the Portfolio since 2021.
Paritosh Somani, CFA, Vice President since 2012, Research Analyst since 2007, and member of IEIC since 2021, joined Dodge & Cox in 2007 and has managed the Portfolio since 2021.
Emerging Markets Equity Portfolio
The Portfolio is managed by Aberdeen’s Global Emerging Markets Equity Team. The team members are jointly and primarily responsible for the day-to-day management of the Portfolio, with the following members having the most significant responsibility for the day-to-day management of the Portfolio:
Devan Kaloo is Global Head of Equities and Head of Global Emerging Markets Equities for Aberdeen. Mr. Kaloo joined Aberdeen in 2000 as part of the Asian Equities Team in Singapore, before later transferring to London where he took up the position of Head of Global Emerging Markets Equities in 2005. In 2015, he was promoted to Global Head of Equities and joined Aberdeen’s group management board. Mr. Kaloo started in fund management with Martin Currie in 1994 covering Latin America, before subsequently working with the North American equities, global asset allocation and eventually the Asian equities teams.
Nick Robinson, CFA, is a Senior Investment Director on the Global Emerging Markets Equity Team at Aberdeen. Mr. Robinson joined the company in 2000 and spent eight years on
the North American Equities team, including three years based in the company’s U.S. offices. In 2008 he joined the Global Emerging Markets Equity team. Mr. Robinson relocated to São Paulo in 2009 to start Aberdeen’s operations in Brazil. In 2016 he returned to London.
Short-Term Bond Portfolio
Michael F. Reinartz, CFA, a Vice President of TRPA and Chairman of TRPA’s Short-Term Bond Investment Advisory Committee has managed the Portfolio since 2015. Mr. Reinartz joined TRPA in 1996, and his investment experience dates back to 2000. During the past five years, he has served as a portfolio manager and prior to that worked closely with TRPA’s portfolio managers in managing the short-term bond strategies, and as an investment analyst for short-term bond and multi-sector bond strategies.
Steve Kohlenstein, CFA, a Vice President of TRPA and Co-Chairman of TRPA’s Short-Term Bond Investment Advisory committee has co-managed the Portfolio since 2023. Mr. Kohlenstein joined TRPA in 2010, and his investment experience dates back to 2011. During the past five years, he has served as a co-portfolio manager of the US Short Duration Income Strategy and worked closely with the Low Duration and Investment Grade teams, partnered in the portfolio management of securitized credit assets, and worked with the Fixed Income Quantitative team in providing support for the investment strategies.
Select Bond Portfolio
Maulik Bhansali, CFA, is a Senior Portfolio Manager and Co-Head of the Core Fixed Income Team at Allspring. He has managed the Portfolio in his capacity with Allspring since 2021 and had managed the Portfolio in his capacity with the previous sub-adviser, Wells Fargo Asset Management (WFAM), since 2017. Prior to his current role, Mr. Bhansali served as an equity research analyst responsible for quantitative modeling and portfolio construction in addition to fundamental analysis for various equity teams. Before joining WFAM, he served as a retirement actuary at Watson Wyatt Worldwide.
Jarad Vasquez is a Senior Portfolio Manager and Co-Head of the Core Fixed Income team at Allspring. He has managed the Portfolio in his capacity with Allspring since 2021 and had managed the Portfolio in his capacity with the previous sub-adviser, Wells Fargo Asset Management (WFAM), since 2017. Prior to joining WFAM, Mr. Vasquez was a trader at Susquehanna International Group, where he traded mortgage- backed securities in a proprietary relative-value strategy and was an equity options specialist on the Philadelphia Stock Exchange.
Long-Term U.S. Government Bond Portfolio
Michael Cudzil is a Managing Director and Generalist Portfolio Manager based in the Newport Beach. He is a rotating member of the PIMCO Investment Committee and co-chair of
155 Northwestern Mutual Series Fund, Inc. Prospectus
the Americas Portfolio Committee. As a portfolio manager across multi-sector fixed income mandates, Mr. Cudzil serves as co-lead of the liability-driven investment (LDI) portfolio management team, a senior member of the Total Return portfolio management team, and lead of the U.S. inflation portfolio management team. Prior to joining PIMCO in 2012, he worked as a managing director and head of pass-through trading at Nomura.
Tim Crowley is an Executive Vice President based in the Newport Beach office and a portfolio manager on the U.S. rates desk. Previously, he was a portfolio associate focusing on interest rate derivatives and volatility and an analyst in PIMCO’s trade compliance group. He joined PIMCO in 2008.
Inflation Managed Portfolio
American Century Investments uses teams of portfolio managers and analysts, organized by broad investment categories such as money markets, corporate bonds, government bonds and municipal bonds, to manage fixed-income funds (such as the Portfolio). The listed portfolio managers are members of the team that manages the Inflation Managed Portfolio and are ultimately responsible for the day-to-day management of the Portfolio within its strategic investment parameters, which includes security selection and portfolio construction, as well as compliance with stated investment objectives.
James E. Platz, CFA, Vice President and Portfolio Manager, joined American Century Investments in 2003 as a portfolio manager.
Miguel Castillo, Vice President and Portfolio Manager, joined American Century Investments in February 2008 as a portfolio research analyst, served as a fixed income trader from 2008 to 2014, and has served as a Portfolio Manager on American Century Investment’s portfolio management team since 2014. He has served as a portfolio manager of the Portfolio since 2015.
Stephen Bartolini, CFA, Vice President, Senior Portfolio Manager, has served American Century as a portfolio manager since 2024. Prior to joining American Century, Mr. Bartolini was a portfolio manager at T. Rowe Price and the co-head of the Global Interest Rate and Currency strategy team from 2010 to 2024. He has managed the Portfolio since 2024.
High Yield Bond Portfolio
Mark E. Durbiano, CFA, Senior Portfolio Manager and Senior Vice President of Federated, has managed the Portfolio since 2014. Mr. Durbiano joined Federated in 1982 and has been Senior Portfolio Manager and Senior Vice President since 1996. From 1988 to 1995, Mr. Durbiano was a Portfolio Manager and Vice President of Federated.
Kathryn Glass, CFA, Portfolio Manager and Vice President of Federated, has managed the Portfolio since 2024. Ms. Glass joined Federated in 1999 and has been Portfolio Manager since 2016 and Vice President since 2014.
Thomas Scherr, CFA, Portfolio Manager and Vice President of Federated, has managed the Portfolio since 2024. Mr. Scherr joined Federated in 2006 and has been Portfolio Manager since 2015 and Vice President since 2016.
Randal Stuckwish, CFA, Portfolio Manager and Vice President of Federated, has managed the Portfolio since 2024. Mr. Stuckwish joined Federated in 2013 and has been Portfolio Manager and Vice President since 2022.
Multi-Sector Bond Portfolio
Sonali Pier, a Managing Director and portfolio manager in PIMCO’s Newport Beach Office, co-manages the Portfolio. She focuses on high yield and multi-sector credit opportunities. She contributes to PIMCO’s Diversified Income, Crossover and Global Credit Opportunities and High Yield Funds, and she has served as a rotating member on PIMCO’s Investment Committee and Americas Portfolio Committee. Prior to joining PIMCO in 2013, she was a senior credit trader at J.P. Morgan, trading cash, recovery and credit default swaps across various sectors.
Daniel J. Ivascyn, Group Chief Investment Officer and a Managing Director in PIMCO’s Newport Beach office, co-manages the Portfolio. He is lead portfolio manager for the PIMCO’s income strategies and credit hedge fund and mortgage opportunistic strategies. He is a member of PIMCO’s Executive Committee and a member of the Investment Committee. Prior to joining PIMCO in 1998, he worked at Bear Stearns in the asset-backed securities group, as well as T. Rowe Price and Fidelity Investments.
Alfred T. Murata, a Managing Director and portfolio manager in PIMCO’s Newport Beach office, co-manages the Portfolio. He focuses on income-oriented, multi-sector credit, opportunistic and securitized strategies. Prior to joining PIMCO in 2001, he researched and implemented exotic equity and interest rate derivatives at Nikko Financial Technologies.
Charles Watford, an Executive Vice President and portfolio manager in the London office, co-manages the Portfolio. He focuses on high yield and is also a research analyst focused on the European automotive and real estate sectors. Prior to joining PIMCO in 2007, Mr. Watford was a management consultant at McKinsey & Company and an investment banking analyst at Morgan Stanley. He has more than 20 years of investment experience and holds an MBA from the Wharton School of the University of Pennsylvania. He also holds a master's degree in chemistry from the University of Oxford.
Northwestern Mutual Series Fund, Inc. Prospectus 156
Regina Borromeo, Executive Vice President, portfolio manager, and a senior member of PIMCO’s global credit team, co-manages the Portfolio. She focuses on multi-sector credit as well as ESG-oriented credit and income strategies. She is a member of PIMCO’s ESG portfolio management team and PIMCO PRIDE EMEA ERG Committee. Prior to joining PIMCO in 2022, Ms. Borromeo was a senior portfolio manager and director of global fixed income at Robeco UK Limited, overseeing investments across a variety of credit and ESG-oriented strategies. Prior to that, Ms. Borromeo was a portfolio manager and head of international high yield at Brandywine Global Investment Management (Europe). She also held roles at Morgan Stanley Investment Management as vice president, senior research analyst and portfolio manager, global fixed income, and at Goldman Sachs. She has investment experience since 2001 and holds a bachelor of arts from the University of Pennsylvania.
Active/Passive Allocation Suite Portfolios
Each of the Active/Passive Allocation Suite Portfolios (Active/Passive Very Aggressive Portfolio, Active/Passive Aggressive Portfolio, Active/Passive Moderate Portfolio, Active/Passive Balanced Portfolio, and Active/Passive Conservative Portfolio) is managed by the following co-managers, who are responsible for making the allocation decisions across asset categories and among the Underlying Portfolios:
James Fleming, CFA, Portfolio Manager of Mason Street Advisors, co-manages the Portfolios. Mr. Fleming joined Mason Street Advisors in 2008. He also oversees Mason Street Advisors’ derivatives risk management and credit analysis activities. Prior to joining Mason Street Advisors, he was a Vice President and Director of Research for Cleary Gull, a Milwaukee-based Investment Consultant.
Rodney Schmucker, CFA, Senior Research & Portfolio Analyst of Mason Street Advisors, co-manages the Portfolios. He joined Mason Street Advisors in 2008. He is also the lead trader for the Portfolios and assists in the oversight of Mason Street Advisors' derivatives risk management and commercial paper credit analysis activities. Prior to joining Mason Street Advisors, he was a Business Development Manager for Thomson Transaction Services, a subsidiary of Thomson Reuters based in Brookfield, WI.
Brent G. Schutte, CFA, Chief Investment Officer and Vice President of Mason Street Advisors, co-manages the Portfolios. Mr. Schutte joined Mason Street Advisors in 2021. Mr. Schutte is also Chief Investment Officer of Northwestern Mutual Wealth Management Company (“NMWMC”), an affiliate of Mason Street Advisors, joining NMWMC in 2015.
Garrett D. Aird, CFA, Vice President of Mason Street Advisors, co-manages the Portfolios. Mr. Aird joined Mason Street Advisors in 2021. Mr. Aird is also Vice President – Investment Management & Research of NMWMC. Mr. Aird joined NMWMC in 2007 and serves as Chair of the NMWMC Investment Committee.
Advisory Fees
Each Portfolio pays a monthly fee for investment advisory services at an annual rate based on a percentage of the aggregate average daily net asset values of the Portfolios, as set forth below. Mason Street Advisors pays each sub-adviser out of its investment advisory fee. In addition to approving all advisory and sub-advisory agreements, the Fund’s Board of Directors considers the renewal of each advisory and sub-advisory agreement, including fees, at least annually. A discussion regarding the basis for approval by the Fund’s Board of Directors of each advisory and sub-advisory agreement will appear in the Fund’s report on Form N-CSR for the period-ended June 30, 2026.
Advisory Fees:
The following table shows the advisory fees for each of the Portfolios for the fiscal year/period ended December 31, 2025 as a percentage of the average net assets of the Portfolios based on 2025 operations and reflecting contractual waivers, limitations and reimbursements:
| Portfolio |
Investment Advisory Fee |
| Growth Stock |
0.41% |
| Focused Appreciation |
0.60% |
| Large Cap Core Stock |
0.41% |
| Large Cap Blend |
0.64% |
| Index 500 Stock |
0.19% |
| Large Company Value |
0.65% |
| Domestic Equity |
0.48% |
| Equity Income |
0.55% |
| Mid Cap Growth Stock |
0.52% |
| Index 400 Stock |
0.22% |
| Mid Cap Value |
0.68% |
| Small Cap Growth Stock |
0.53% |
| Index 600 Stock |
0.22% |
| Small Cap Value |
0.84% |
| International Growth |
0.58% |
| Research International Core |
0.67% |
| International Equity |
0.65% |
| Emerging Markets Equity |
0.79% |
| Government Money Market |
0.30% |
| Short-Term Bond |
0.32% |
| Select Bond |
0.29% |
| Long-Term U.S. Government Bond |
0.50% |
| Inflation Managed |
0.40% |
| High Yield Bond |
0.42% |
| Multi-Sector Bond |
0.67% |
| Active/Passive Very Aggressive1 |
-0.15% |
| Active/Passive Aggressive1 |
-0.12% |
| Active/Passive Moderate |
0.10% |
| Active/Passive Balanced |
0.10% |
| Active/Passive Conservative1 |
-0.27% |
157 Northwestern Mutual Series Fund, Inc. Prospectus
1 Computed on an annualized basis, based on the period from July 1, 2025, the Portfolio’s inception date, to December 31, 2025. Reflects reimbursement by the investment adviser of certain expenses above the amount of the investment advisory fee charged.
Expense Limitation and Advisory Fee Waiver Agreements:
Expense Limitation Agreements
Mason Street Advisors has contractually agreed to waive its investment advisory fee and/or reimburse certain expenses for the Portfolios referenced below to the extent necessary so that each Portfolio’s total operating expenses (excluding taxes, brokerage, other investment-related costs, interest and dividend expenses and charges, acquired fund fees and expenses, fees for class action, other passive securities litigation and anti-trust claim filing services and such non-recurring and extra ordinary expenses as they may arise) on an annualized basis do not exceed, after the waiver, the percentage of average net assets specified below (the “Expense Cap”):
| Portfolio |
Expense Cap |
Expiration |
| Focused Appreciation |
0.90% |
April 30, 2027 |
| Large Cap Blend |
0.85% |
April 30, 2027 |
| Large Company Value |
0.80% |
April 30, 2027 |
| Domestic Equity |
0.75% |
April 30, 2027 |
| Equity Income |
0.75% |
April 30, 2027 |
| Mid Cap Value |
1.00% |
April 30, 2027 |
| Index 600 Stock |
0.35% |
April 30, 2027 |
| Small Cap Value |
1.00% |
April 30, 2027 |
| International Growth |
1.10% |
April 30, 2027 |
| Research International Core |
1.15% |
April 30, 2027 |
| Emerging Markets Equity |
1.50% |
April 30, 2027 |
| Short-Term Bond |
0.45% |
April 30, 2027 |
| Long-Term U.S. Government Bond |
0.65% |
April 30, 2027 |
| Inflation Managed |
0.65% |
April 30, 2027 |
| Multi-Sector Bond |
0.90% |
April 30, 2027 |
| Active/Passive Very Aggressive |
0.27% |
April 30, 2027 |
| Active/Passive Aggressive |
0.27% |
April 30, 2027 |
| Active/Passive Moderate |
0.75% |
April 30, 2027 |
| Active/Passive Conservative |
0.27% |
April 30, 2027 |
Advisory Fee Waiver Agreements
Growth Stock Portfolio. Mason Street Advisors has agreed to waive a portion of its management fee relating to the Growth Stock Portfolio such that the management fee is 0.60% on the Portfolio’s first $50 million of average net assets, 0.50% on the next $50 million, 0.40% on the next $900 million, and 0.38% on average net assets in excess of $1 billion. This fee waiver agreement may not be terminated prior to April 30, 2027 without action by the Board of Directors.
Focused Appreciation Portfolio. Mason Street Advisors has agreed to waive a portion of its management fee relating to the Focused Appreciation Portfolio such that the management fee is
0.62% on the first $100 million of the Portfolio’s average net assets, 0.57% on the next $900 million, and 0.54% on average net assets in excess of $1 billion. This fee waiver agreement may not be terminated prior to April 30, 2027 without action by the Board of Directors.
Large Cap Core Stock Portfolio. Mason Street Advisors has agreed to waive a portion of its management fee relating to the Large Cap Core Stock Portfolio such that the management fee is 0.60% on the first $50 million of the Portfolio’s average net assets, 0.50% on the next $50 million, 0.40% on the next $400 million, and 0.37% on average net assets in excess of $500 million. This fee waiver agreement may not be terminated prior to April 30, 2027 without action by the Board of Directors.
Large Cap Blend Portfolio. Mason Street Advisors has agreed to waive a portion of its management fee relating to the Large Cap Blend Portfolio such that the management fee is 0.65% on the first $150 million of the Portfolio’s average net assets, 0.55% on the next $150 million, 0.55% on the next $200 million, and 0.52% on average net assets in excess of $500 million. This fee waiver agreement may not be terminated prior to April 30, 2027 without action by the Board of Directors.
Index 500 Stock Portfolio. Mason Street Advisors has agreed to waive a portion of its management fee relating to the Index 500 Stock Portfolio such that the management fee is 0.20% on the Portfolio’s first $2 billion of average net assets and 0.18% on average net assets in excess of $2 billion. This fee waiver agreement may not be terminated prior to April 30, 2027 without action by the Board of Directors.
Large Company Value Portfolio. Mason Street Advisors has agreed to waive a portion of its management fee relating to the Large Company Value Portfolio such that the management fee is 0.67% on the first $100 million of the Portfolio’s average net assets, 0.62% on the next $150 million, 0.59% on the next $250 million, and 0.57% on average net assets in excess of $500 million. This fee waiver agreement may not be terminated prior to April 30, 2027 without action by the Board of Directors.
Domestic Equity Portfolio. Mason Street Advisors has agreed to waive a portion of its management fee relating to the Domestic Equity Portfolio such that the management fee is 0.65% on the Portfolio’s first $100 million of average net assets, 0.55% of the next $150 million, 0.50% of the next $250 million, 0.43% of the next $500 million, and 0.41% on average net assets in excess of $1 billion. This fee waiver agreement may not be terminated prior to April 30, 2027 without action by the Board of Directors.
Equity Income Portfolio. Mason Street Advisors has agreed to waive a portion of its management fee relating to the Equity Income Portfolio such that the management fee is 0.56% on the Portfolio’s first $500 million of average net assets, 0.53% on the next $1 billion, and 0.52% on average net assets in excess of $1.5 billion. This fee waiver agreement may not be terminated prior to April 30, 2027 without action by the Board of Directors.
Northwestern Mutual Series Fund, Inc. Prospectus 158
Mid Cap Growth Stock Portfolio. Mason Street Advisors has agreed to waive a portion of its management fee relating to the Mid Cap Growth Stock Portfolio such that the management fee is 0.80% on the Portfolio’s first $50 million of average net assets, 0.65% on the next $50 million, 0.50% on the next $900 million, and 0.49% on average net assets in excess of $1 billion. This fee waiver agreement may not be terminated prior to April 30, 2027 without action by the Board of Directors.
Index 400 Stock Portfolio. Mason Street Advisors has agreed to waive a portion of its management fee relating to the Index 400 Stock Portfolio such that the management fee is 0.25% on the first $500 million of the Portfolio’s average net assets and 0.20% on average net assets in excess of $500 million. This fee waiver agreement may not be terminated prior to April 30, 2027 without action by the Board of Directors.
Mid Cap Value Portfolio. Mason Street Advisors has agreed to waive a portion of its management fee relating to the Mid Cap Value Portfolio such that the management fee is 0.78% on the first $150 million of the Portfolio’s average net assets, 0.66% on the next $350 million, and 0.63% on average net assets in excess of $500 million. This fee waiver agreement may not be terminated prior to April 30, 2027 without action by the Board of Directors.
Small Cap Value Portfolio. Mason Street Advisors has agreed to waive a portion of its management fee relating to the Small Cap Value Portfolio such that the management fee is 0.85% on the first $500 million of average net assets and 0.80% on average net assets in excess of $500 million. This fee waiver agreement may not be terminated prior to April 30, 2027 without action by the Board of Directors.
International Growth Portfolio. Mason Street Advisors has agreed to waive a portion of its management fee relating to the International Growth Portfolio such that its management fee is 0.75% on the Portfolio’s first $100 million of average net assets, 0.65% of the next $150 million, 0.55% on the next $750 million, and 0.54% on average net assets in excess of $1 billion. This fee waiver agreement may not be terminated prior to April 30, 2027 without action by the Board of Directors.
Research International Core Portfolio. Mason Street Advisors has agreed to waive a portion of its management fee relating to the Research International Core Portfolio such that the management fee is 0.54% on the Portfolio’s first $1.5 billion of average net assets and 0.52% on average net assets in excess of $1.5 billion. This fee waiver agreement may not be terminated prior to April 30, 2027 without action by the Board of Directors.
International Equity Portfolio. Mason Street Advisors has agreed to waive a portion of its management fee relating to the International Equity Portfolio such that its management fee is 0.85% on the Portfolio’s first $50 million of average net assets, 0.65% on the next $1.95 billion, and 0.63% on average net
assets in excess of $2 billion. This fee waiver agreement may not be terminated prior to April 30, 2027 without action by the Board of Directors.
Emerging Markets Equity Portfolio. Mason Street Advisors has agreed to waive a portion of its management fee relating to the Emerging Markets Equity Portfolio such that its management fee is 0.84% on the Portfolio’s first $250 million of average net assets, 0.76% on the next $250 million, and 0.68% on average net assets in excess of $500 million. This fee waiver agreement may not be terminated prior to April 30, 2027 without action by the Board of Directors.
Government Money Market Portfolio. Mason Street Advisors has agreed to waive a portion of its management fee relating to the Government Money Market Portfolio such that the management fee is 0.30% on the Portfolio’s first $500 million of average net assets, 0.29% on the next $500 million, and 0.28% on average net assets in excess of $1 billion. This fee waiver agreement may not be terminated prior to April 30, 2027 without action by the Board of Directors. In addition, Mason Street Advisors has voluntarily agreed to waive its advisory fee and/or reimburse expenses in excess of the Government Money Market Portfolio’s daily yield so as to maintain a zero or positive yield for the Portfolio. This voluntary waiver is reviewed periodically by Mason Street Advisors in light of market and economic developments and may be revised or discontinued at any time without advance notice.
Short-Term Bond Portfolio. Mason Street Advisors has agreed to waive a portion of its management fee relating to the Short-Term Bond Portfolio such that the management fee is 0.35% on the Portfolio’s first $100 million of average net assets, 0.33% on the next $150 million, 0.30% on the next $250 million, and 0.28% on average net assets in excess of $500 million. This fee waiver agreement may not be terminated prior to April 30, 2027 without action by the Board of Directors.
Select Bond Portfolio. Mason Street Advisors has agreed to waive a portion of its management fee relating to the Select Bond Portfolio such that the management fee is 0.30% on the first $2 billion of average net assets and 0.28% on average net assets in excess of $2 billion. This fee waiver agreement may not be terminated prior to April 30, 2027 without action by the Board of Directors.
Long-Term U.S. Government Bond Portfolio. Mason Street Advisors has agreed to waive a portion of its management fee relating to the Long-Term U.S. Government Bond Portfolio such that the management fee is 0.555% on the Portfolio’s first $100 million of average net assets, 0.515% on the next $150 million, 0.495% on the next $250 million, and 0.445% on average net assets in excess of $500 million. This fee waiver agreement may not be terminated prior to April 30, 2027 without action by the Board of Directors.
159 Northwestern Mutual Series Fund, Inc. Prospectus
Inflation Managed Portfolio. Mason Street Advisors has agreed to waive a portion of its management fee relating to the Inflation Managed Portfolio such that the management fee is 0.42% on the Portfolio’s first $100 million of average net assets, 0.40% on the next $150 million, and 0.38% on average net assets in excess of $250 million. This fee waiver agreement may not be terminated prior to April 30, 2027 without action by the Board of Directors.
High Yield Bond Portfolio. Mason Street Advisors has agreed to waive a portion of its management fee relating to the High Yield Bond Portfolio such that the management fee is 0.60% on the Portfolio’s first $50 million of average net assets, 0.50% on the next $50 million, 0.40% on the next $900 million, and 0.30% on average net assets in excess of $1 billion. This fee waiver agreement may not be terminated prior to April 30, 2027 without action by the Board of Directors.
Multi-Sector Bond Portfolio. Mason Street Advisors has agreed to waive a portion of its management fee relating to the Multi-Sector Bond Portfolio such that the management fee is 0.73% on the Portfolio’s first $100 million of average net assets, 0.72% on the next $150 million, 0.69% on the next $250 million, and 0.64% on average net assets in excess of $500 million. This fee waiver agreement may not be terminated prior to April 30, 2027 without action by the Board of Directors.
Active/Passive Very Aggressive Portfolio. With respect to the Active/Passive Very Aggressive Portfolio, Mason Street Advisors has agreed to waive a portion of its management fee such that the management fee is 0.10% of the Portfolio’s average net assets. This fee waiver agreement may not be terminated prior to April 30, 2027 without action by the Board of Directors.
Active/Passive Aggressive Portfolio. With respect to the Active/Passive Aggressive Portfolio, Mason Street Advisors has agreed to waive a portion of its management fee such that the management fee is 0.10% of the Portfolio’s average net assets. This fee waiver agreement may not be terminated prior to April 30, 2027 without action by the Board of Directors.
Active/Passive Moderate Portfolio. With respect to the Active/Passive Balanced Portfolio, Mason Street Advisors has agreed to waive a portion of its management fee such that the management fee is 0.10% of the Portfolio’s average net assets. This fee waiver agreement may not be terminated prior to April 30, 2027 without action by the Board of Directors.
Active/Passive Balanced Portfolio. With respect to the Active/Passive Moderate Portfolio, Mason Street Advisors has agreed to waive a portion of its management fee such that the management fee is 0.10% of the Portfolio’s average net assets. This fee waiver agreement may not be terminated prior to April 30, 2027 without action by the Board of Directors.
Active/Passive Conservative Portfolio. With respect to the Active/Passive Conservative Portfolio, Mason Street Advisors has agreed to waive a portion of its management fee such that
the management fee is 0.10% of the Portfolio’s average net assets. This fee waiver agreement may not be terminated prior to April 30, 2027 without action by the Board of Directors.
In periods of market volatility, a Portfolio’s average net assets may decline significantly, causing operating expenses to increase relative to a Portfolio’s average net assets. There are currently no arrangements in place pursuant to which the Portfolios would be required to reimburse Mason Street Advisors for any fee amounts waived or expenses reimbursed to the Portfolios pursuant to the Expense Limitation and Advisory Fee Waiver Agreements described above.
Manager of Managers Structure
The Fund and Mason Street Advisors have received an exemptive order from the Securities and Exchange Commission that permits the Fund to employ a “manager of managers” structure. Under this structure, Mason Street Advisors, with the approval of the Board may hire, terminate or replace unaffiliated sub-advisers without shareholder approval, including, without limitation, the replacement or reinstatement of any unaffiliated sub-advisers with respect to which a sub-advisory agreement has automatically terminated as a result of an assignment. Under the manager of managers structure, Mason Street Advisors has the ultimate responsibility to oversee sub-advisers and recommend their hiring, termination and replacement to the Board.
Shareholders will be notified in the event the Fund hires or replaces an unaffiliated sub-adviser. The order also permits the Fund to disclose to shareholders the aggregate fees paid to the sub-adviser(s) by each Portfolio. The manager of managers’ structure does not alter the right of shareholders of a Portfolio to terminate a sub-advisory agreement with an unaffiliated sub-adviser at any time by a vote of the majority of the outstanding voting securities of such Portfolio, nor does it alter the right of shareholders of a Portfolio to approve any change in the management fee structure that increases the management fee paid by the Portfolio to Mason Street Advisors.
Legal Proceedings
There are currently no material pending legal proceedings, other than ordinary routine litigation incidental to the business, to which the Fund, the Fund’s Portfolios, or Mason Street Advisers is a party.
From time to time, each Sub-Adviser may be subject to certain routine legal and regulatory proceedings.
Northwestern Mutual Series Fund, Inc. Prospectus 160
ABOUT YOUR INVESTMENT
How Shares Are Priced
Shares of capital stock of each Portfolio of the Fund are offered and redeemed at their net asset value (“NAV”) as next determined following receipt of a purchase order or tender for redemption without the addition of any selling commission or “sales load” or any redemption charge. The redemption price may be more or less than the shareholder’s cost. A Portfolio’s NAV is determined as of the close of trading on the New York Stock Exchange (typically 4:00 p.m., Eastern time) on each day on which the Exchange is open for trading. To the extent a Portfolio holds securities that are primarily listed on foreign exchanges that trade on weekends or other days when the Portfolio does not price its shares, the value of these investments may change on days when shareholders will not be able to purchase or redeem the Portfolio’s shares.
For purposes of valuing securities held by a Portfolio, Section 2(a)(41) of the Investment Company Act of 1940, as amended, and Rule 2a-4 thereunder provide that securities for which market quotations are readily available are to be valued at market value and all other securities and assets are to be valued at fair value as determined in good faith by the Fund’s Board of Directors. Rule 2a-5 under the Investment Company Act of 1940, as amended, provides that a market quotation is readily available only when that quotation is a quoted price (unadjusted) in active markets for identical investments that a fund can access at the measurement date, provided that a quotation will not be readily available if it is not reliable. Securities and other Portfolio assets with readily available market quotations are priced at such market quotations, and all other securities and assets are fair valued in accordance with the requirements of Rule 2a-5.
Securities for which Market Quotations are Readily Available
Equity securities for which market quotations are readily available are valued at the last sale or official closing price on the primary market or exchange on which they are traded as reported by a third-party pricing service. In the event there were no sales during the day or closing prices are not available, securities are generally valued at the last quoted bid price.
Futures contracts are valued at the closing settlement price on the exchange. Options contracts are valued at the last quoted sales price or, if there is no such reported sale, long positions are valued at the most recent quoted bid price, and short positions at the most recent quoted ask price.
With respect to any portion of a Portfolio’s assets that are invested in one or more open-end management investment companies that are registered under the Investment Company Act of 1940, as amended, (other than ETFs), the Portfolio’s NAV is calculated based on the NAVs of the registered open-end management companies in which the Portfolio invests. The
prospectuses for these companies explain the circumstances under which those companies will use fair value pricing and the effects of using fair value pricing. ETFs are valued at the last sale price as reported by a third-party pricing service on the primary exchange on which they are traded.
Fair Value Pricing
All Portfolio securities and other assets for which market quotations are not readily available, as defined by Rule 2a-5, are valued at their fair value as determined in good faith. The Board of Directors has designated the Adviser as the Board’s valuation designee under Rule 2a-5. As such, the Adviser will execute the fair valuation process on the Board’s behalf, subject to oversight by the Board.
Debt securities are generally valued using evaluated prices based on accepted industry conventions obtained from third-party pricing services. The pricing service may value a debt security by employing methods that utilize a market model that takes into consideration actual market transactions, broker-dealer supplied valuations, and/or other methodologies designed to identify the market value for such securities. Fair valuation procedures may be used under certain circumstances when pricing service valuations are not available or when the valuation designee determines the valuation does not reflect the debt security’s fair value. On any day a price is not available for a debt security with a remaining maturity of sixty days or less, such security may be fair valued by reference to the security’s amortized cost. All debt securities of the Government Money Market Portfolio are valued on an amortized cost basis or, if the current market value differs substantially from the amortized cost, by marking to market.
Swap contracts and other derivatives are valued at evaluated prices provided by the respective exchange, a pricing service or, if a pricing service is unable to supply a price for a particular swap, pursuant to fair value pricing procedures.
The possibility of fair value pricing means that changes in a Portfolio’s NAV may not always correspond to changes in quoted prices of a Portfolio’s investments. Fair value procedures may be widely used to value foreign securities.
Many securities markets and exchanges outside the United States close prior to the close of the New York Stock Exchange and therefore the closing prices for securities in such markets or on such exchanges may not fully reflect events that occur after such close but before the close of the New York Stock Exchange. Certain securities listed or traded on foreign securities exchanges are fair valued using a pricing model furnished by a third-party pricing service. The pricing service’s daily pricing model provides a security specific factor that is applied to the closing price of a security on the foreign market or exchange.
161 Northwestern Mutual Series Fund, Inc. Prospectus
A more detailed discussion of asset valuation methods is included in the Statement of Additional Information.
Taxes And Dividends
Shares of the Portfolios are offered only for funding Annuity Contracts and Life Insurance Policies offered by Northwestern Mutual through separate accounts. Insurance company separate accounts generally do not pay tax on dividends or capital gain distributions. Investors in Annuity Contracts and Life Insurance Policies should refer to the prospectuses for the variable products for a discussion of the tax considerations that affect the insurance company and its separate accounts and the tax consequences to investors in those products.
Each Portfolio is qualified or intends to qualify as a regulated investment company under Subchapter M of the Internal Revenue Code of 1986, as amended (the “Code”) and intends to satisfy the diversification requirements of Section 817(h) of the Code and the Treasury Regulations promulgated thereunder, which generally prohibit a Portfolio from investing more than 55% of the value of its assets in any one investment, more than 70% of the value of its assets in any two investments, more than 80% of the value of its assets in any three investments, and more than 90% of the value of its assets in any four investments. For this purpose, all securities issued by the same issuer are treated as a single investment and each U.S. government agency or instrumentality is treated as a separate issuer. It is the Fund’s policy to comply with the provisions of the Code regarding distribution of investment income and capital gains so as to relieve each Portfolio from all, or substantially all, Federal income taxes. Each Portfolio expects to distribute all or substantially all net investment income and net capital gains, if any, from the sale of investments.
Shareholders of each Portfolio are entitled to receive such dividends from net investment income and distributions of net capital gains as the Board of Directors of the Fund may declare. Dividends from net investment income and net capital gains will be declared for the Government Money Market Portfolio on each business day and annually for each of the other Portfolios. All dividends and capital gain distributions will be automatically reinvested in additional shares of a Portfolio at the NAV of such shares on the payment date unless the separate account is permitted to hold cash and elects to receive payment in cash. From time to time, a portion of a Portfolio’s dividends may constitute a return of capital.
Net investment income of each Portfolio will be determined at the close of trading on the New York Stock Exchange (the “Exchange”) on each day during which the Exchange is open for trading. Net investment income of each Portfolio consists of:
all dividends, interest income and discount earned by the Portfolio (including original issue and market discount);
net short-term capital gain; less
all expenses of the Portfolio.
The Statement of Additional Information contains further information about tax matters.
THE TAX STATUS OF YOUR INVESTMENT IN A PORTFOLIO DEPENDS UPON THE FEATURES OF YOUR ANNUITY CONTRACT OR LIFE INSURANCE POLICY. FOR FURTHER INFORMATION, PLEASE REFER TO THE PROSPECTUS FOR THE CONTRACT OR POLICY.
INVESTING IN THE PORTFOLIOS
Buying and Selling Shares
All of the outstanding shares of the Portfolios are owned either directly or indirectly by Northwestern Mutual. Shares of the Portfolios may be purchased and redeemed by Northwestern Mutual for its separate accounts that fund Annuity Contracts and Life Insurance Policies. Variable product owners, who own interests in the separate accounts, may not directly purchase and redeem shares of the Portfolios. Terms governing the purchase and sale of a variable product owner’s interest in a separate account are included in the variable product prospectus.
The Fund typically expects to pay out redemption proceeds requested by Northwestern Mutual within one day following receipt of a redemption request from Northwestern Mutual. Redemption requests are generally paid to Northwestern Mutual in cash, and transmitted by wire transfer. The Fund
typically expects to meet redemption requests through reliance on its holdings in cash or cash equivalents, and will employ this method of meeting redemption requests on a regular basis. The Fund reserves the right in its sole discretion to determine whether to satisfy redemption requests by making payment in securities (known as a redemption in kind). In such case, the Fund may pay all or part of the redemption in securities of equal value selected by the Fund in its sole discretion as permitted under the Investment Company Act of 1940, as amended, and the rules thereunder, and the redeeming shareholder will be responsible for disposing of securities and bearing any associated costs.
Pursuant to Rule 22e-3 adopted by the Securities and Exchange Commission, the Government Money Market Portfolio may suspend redemptions and postpone payment of redemption proceeds for longer than the seven-day limit set forth in Section
Northwestern Mutual Series Fund, Inc. Prospectus 162
22(e) of the Investment Company Act of 1940, as amended, pending a liquidation of the Portfolio which has been approved by the Fund’s Board in accordance with the conditions of the Rule.
Short Term and Excessive Trading
Short term and excessive trading (sometimes referred to as “market timing”) may present risks to a Portfolio’s long-term investors because it can, among other things, disrupt Portfolio investment strategies, increase Portfolio transaction and administrative costs, require higher than normal levels of cash reserves to fund unusually large or unexpected redemptions, and adversely affect investment performance. These risks may be greater for Portfolios that invest in securities that may be more vulnerable to arbitrage trading including foreign securities and thinly traded securities, such as small cap stocks and non-investment grade bonds. The International Growth Portfolio, the International Equity Portfolio, the Research International Core Portfolio and the Emerging Markets Equity Portfolio each has significant investments in foreign securities. Portfolios which may have significant investments in small cap securities include the Small Cap Growth Stock Portfolio, the Small Cap Value Portfolio and the Index 600 Stock Portfolio. Certain Portfolios, and in particular the High Yield Bond Portfolio, may have significant investments in high yield securities that are thinly traded. Please see the “Portfolio Summaries” at the beginning of this Prospectus. These types of trading activities also may dilute the value of long-term investors’ interests in a Portfolio if it calculates its net asset value using closing prices that are no longer accurate. Accordingly, we discourage market timing activities.
By their nature, insurance company separate accounts, for which purchases and sales of Portfolio shares by multiple investors are aggregated for presentation to the Fund on a net basis, conceal the identity of the individual investors from the Fund. This makes it more difficult for the Fund to identify market timing activity in the Portfolios. Consequently, to deter short term and excessive trading, the Fund’s Board of Directors has received and reviewed and determined to be reasonable policies and procedures adopted and implemented by Northwestern Mutual, which are designed to control abusive trading practices at the variable product owner level. Northwestern Mutual seeks to apply these policies and procedures uniformly to all investors, except to the extent it is prevented from doing so under applicable state or federal law or regulation. Any exceptions must be either expressly permitted by its policies and procedures or subject to an approval process described in them. Because exceptions are permitted, it is possible that investors may be treated differently and, as a result, some may be allowed to engage in trading activity that might be viewed as market timing. These policies and procedures are discussed below.
In addition, to minimize harm to the Fund and its investors, the Fund reserves the right to reject without notice any purchase order (including exchanges) from any investor who it believes has a history of abusive trading or whose trading, in its sole
judgment, has been or may be disruptive to investors in the Fund. Alternatively, the Fund reserves the right to accept purchases and exchanges in excess of Northwestern Mutual’s guidelines if it believes in its sole discretion that such transactions would not be inconsistent with the best interests of investors. In addition, the Fund seeks to deter abusive trading by using fair value pricing as described in the section “How Shares are Priced.”
Among the steps taken by Northwestern Mutual to reduce the frequency and effect of these abusive trading activities, are monitoring trading activity and imposing trading restrictions including the prohibition of more than twelve transfers among divisions under a single variable annuity contract or variable life insurance policy during a contract or policy year. A “division” is a sub-account of the separate account which corresponds to a Portfolio of the Fund. Multiple transfers with the same effective date made by the same investor will be counted as a single transfer for purposes of applying the twelve transfer limitation. Further, an investor who is identified as having made a transfer in and out of the same division, excluding the division that corresponds to the Government Money Market Portfolio (“round trip transfer”), in an amount in excess of $10,000 within fourteen calendar days will be restricted from making additional transfers after the third such round trip transfer until the next contract or policy anniversary date, and sent a letter informing him or her of the restriction. Thereafter, the same investor will be similarly restricted after the second such round trip transfer. An investor who is identified as having made one or more round trip transfers within thirty calendar days aggregating more than one percent (1%) of the total assets of the Portfolio underlying a division (excluding the division that corresponds to the Government Money Market Portfolio) will be sent a warning letter after the first such round trip transfer, and will be restricted from making additional transfers until the next contract or policy anniversary date after the second such round trip transfer. Thereafter, the same investor will be similarly restricted after the first such round trip transfer. These limitations do not apply to automatic asset transfers, scheduled or systematic transactions involving portfolio rebalancing, dollar cost averaging, or interest sweeps, or to initial allocations or changes in future allocations. Once an investor is restricted, he will be allowed one additional transfer into the division that underlies the Government Money Market Portfolio until the next contract or policy anniversary date. Additionally, in accordance with these procedures, Northwestern Mutual may modify some of these limitations to allow for transfers that would not count against the total transfer limit but only as necessary to alleviate any potential hardships to investors (e.g., in situations involving a substitution of a Portfolio as an investment option within Annuity Contracts and Life Insurance Policies).
Northwestern Mutual’s Life Insurance Policies may be purchased by a corporation or other entity as a means to informally finance the liabilities created by the entity’s employee benefit or similar plan. These policies may be aggregately managed to match liabilities under such plans.
163 Northwestern Mutual Series Fund, Inc. Prospectus
Policies sold under these circumstances may be subject to special transfer restrictions. Namely, transactions involving portfolio rebalancing programs may be exempt from the twelve transfer per contract or policy year limitation where: (1) the purpose of the portfolio rebalancing program is to match the policy to the entity’s employee benefit or similar plan; (2) the portfolio rebalancing program adequately protects against short-term or excessive trading; and (3) the portfolio rebalancing program is managed by a third party administrator that meets requirements established by Northwestern Mutual. Northwestern Mutual reserves the right to monitor or limit transactions involving portfolio rebalancing programs where it believes such transactions may be potentially harmful to a Portfolio.
If Northwestern Mutual believes an investor’s trading activity is in violation of, or inconsistent with, its policies and procedures or otherwise is potentially disruptive to the Fund or harmful to its investors’ interests, the investor may be asked to stop such activities and future purchases or exchanges by the investor may be rejected without prior notice. Because it retains discretion to determine what action is appropriate in a given situation, investors may be treated differently and some may be allowed to engage in activities that might be viewed as market timing.
These policies and procedures may change from time to time as the Fund and Northwestern Mutual determine in their sole discretion without notice; provided, however, investors would be given advance, written notice if the policies and procedures were revised to accommodate market timing.
The Fund’s Board of Directors intends to monitor events and obtain periodic reports from Northwestern Mutual on the effectiveness of its policies and procedures in order to identify whether instances of potentially abusive trading practices are occurring and what action, if any, should be taken in response. However, the Fund may not be able to identify all instances of abusive trading practices, nor completely eliminate the possibility of such activities.
Mixed Funding
The shares of each Portfolio of the Fund are offered only to Northwestern Mutual and its separate accounts that fund Annuity Contracts and Life Insurance Policies. When a Portfolio sells any of its shares to both variable annuity and variable life insurance separate accounts, it is said to engage in mixed funding. The Portfolios currently engage in mixed funding. Due to differences of tax treatment and other considerations, the interests of contract and policy owners in the Fund may conflict. The Board of Directors of the Fund will monitor events for any material irreconcilable conflicts that may arise and will determine what action, if any, should be taken in response. If a material conflict is identified, the Board may require one or more insurance separate accounts to withdraw its investment in the Fund, which may cause the Fund to sell securities at disadvantageous prices and disrupt orderly management of the Portfolio.
DISCLOSURE OF PORTFOLIO HOLDINGS
A description of the Fund’s policies and procedures with respect to the disclosure of the Fund’s portfolio securities is available in the Fund’s Statement of Additional Information. A list of the ten largest holdings for each Portfolio (other than the Government Money Market Portfolio), and the percentage of Portfolio net assets that each such holding represents as of the most recent calendar-quarter end, is normally posted on the internet at www.northwesternmutual.com. This information will be available on or before the 20th business day following the end of each calendar quarter. In addition, a list of each Portfolio’s full holdings is normally posted on or before the last day of the month following the end of each calendar quarter. The holdings information will remain on the website at least until such time as the Portfolio’s complete holdings for the calendar quarter are filed with the SEC. The Fund may from time to time withhold posting to or remove from the website any portion of this information with respect to a Portfolio. The information may be viewed by following one of the paths below and selecting the specific Portfolio you wish to view:
•
Life Insurance – https://www.northwesternmutual.com/life-insurance/variable-universal-life-insurance-vul/underlying-fund-information/prospectuses-performance-and-reports
•
Annuities – https://www.northwesternmutual.com/fixed-annuity-vs-variable-annuity/underlying-fund-information
In addition, information concerning the Government Money Market Portfolio’s holdings, as well as its dollar-weighted average maturity and weighted average life, will be posted on the website five days after the end of each month and will remain posted on the website for six months thereafter. In addition, each day, six-month historical data regarding asset flows, shadow prices, and daily and weekly liquid assets will be posted on the website. The information can be found by following either of the paths shown above and selecting the Government Money Market Portfolio.
Northwestern Mutual Series Fund, Inc. Prospectus 164
FINANCIAL HIGHLIGHTS
The financial highlights table is intended to help you understand the Portfolios’ financial performance for the past five years (or, if shorter, the period of a Portfolio’s operations). Certain information reflects financial results for a single Portfolio share. The total returns in the table represent the rate that an investor would have earned or lost on an investment in a Portfolio (assuming reinvestment of all dividends and distributions). Total returns do not reflect the fees and expenses
separately charged by Annuity Contracts or Life Insurance Policies. If such fees and expenses were reflected, the total returns in the table would be lower. This information has been derived from financial statements audited by PricewaterhouseCoopers LLP, whose report, along with the Fund’s financial statements, are incorporated by reference in the Fund’s Statement of Additional Information, both of which are available upon request.
165 Northwestern Mutual Series Fund, Inc. Prospectus
FINANCIAL HIGHLIGHTS (For a share outstanding through the period)
| |
Net Asset Value, Beginning of Period |
Net Investment Income (Loss)# |
Net Realized and Unrealized Gain (Loss) on Investments |
Total from Investment Operations |
Distributions from Net Investment Income |
Distributions from Realized Gains on Investments |
Total Distributions |
Net Asset Value, End of Period |
Total Return* |
Net Assets, End of Period (thousands) |
Ratio of Gross Expenses to Average Net Assets† |
Ratio of Net Expenses to Average Net Assets† |
Ratio of Net Investment Income (Loss) to Average Net Assets |
Portfolio Turnover Rate |
| Growth Stock Portfolio | ||||||||||||||
| 2025 |
$4.21 |
$0.00‡ |
$0.81 |
$0.81 |
$(0.00)‡ |
$(0.08) |
$(0.08) |
$4.94 |
19.40% |
$1,500,600 |
0.42% |
0.42% |
0.07% |
11% |
| 2024 |
3.06 |
0.00‡ |
1.15 |
1.15 |
(0.00)‡ |
— |
(0.00)‡ |
4.21 |
37.82 |
1,369,524 |
0.42 |
0.42 |
0.10 |
7 |
| 2023 |
2.04 |
0.00‡ |
1.02 |
1.02 |
(0.00)‡ |
— |
(0.00)‡ |
3.06 |
49.69 |
1,067,103 |
0.43 |
0.43 |
0.14 |
9 |
| 2022 |
4.04 |
0.00‡ |
(1.50) |
(1.50) |
— |
(0.50) |
(0.50) |
2.04 |
(38.70) |
750,703 |
0.43 |
0.43 |
0.04 |
14 |
| 2021 |
3.60 |
(0.00)‡ |
0.61 |
0.61 |
(0.00)‡ |
(0.17) |
(0.17) |
4.04 |
16.67 |
1,389,899 |
0.42 |
0.42 |
(0.10) |
36 |
| Focused Appreciation Portfolio | ||||||||||||||
| 2025 |
$4.73 |
$(0.00)‡ |
$0.68 |
$0.68 |
— |
$(0.68) |
$(0.68) |
$4.73 |
14.91% |
$1,548,931 |
0.73% |
0.61% |
(0.09)% |
2% |
| 2024 |
3.87 |
(0.00)‡ |
1.26 |
1.26 |
— |
(0.40) |
(0.40) |
4.73 |
34.43 |
1,493,813 |
0.74 |
0.61 |
(0.02) |
9 |
| 2023 |
2.72 |
(0.00)‡ |
1.38 |
1.38 |
— |
(0.23) |
(0.23) |
3.87 |
50.99 |
1,279,119 |
0.74 |
0.62 |
(0.10) |
7 |
| 2022 |
4.32 |
(0.00)‡ |
(1.19) |
(1.19) |
(0.00)‡ |
(0.41) |
(0.41) |
2.72 |
(27.83) |
963,929 |
0.74 |
0.62 |
(0.03) |
18 |
| 2021 |
4.02 |
(0.00)‡ |
0.76 |
0.76 |
(0.01) |
(0.45) |
(0.46) |
4.32 |
18.90 |
1,327,361 |
0.74 |
0.62 |
(0.01) |
11 |
| Large Cap Core Stock Portfolio | ||||||||||||||
| 2025 |
$1.91 |
$0.01 |
$0.29 |
$0.30 |
$(0.01) |
$(0.30) |
$(0.31) |
$1.90 |
16.59% |
$824,766 |
0.44% |
0.43% |
0.60% |
70% |
| 2024 |
1.66 |
0.01 |
0.34 |
0.35 |
(0.01) |
(0.09) |
(0.10) |
1.91 |
22.16 |
756,794 |
0.44 |
0.43 |
0.64 |
74 |
| 2023 |
1.44 |
0.01 |
0.36 |
0.37 |
(0.02) |
(0.13) |
(0.15) |
1.66 |
25.78 |
668,896 |
0.45 |
0.44 |
0.82 |
63 |
| 2022 |
2.21 |
0.02 |
(0.43) |
(0.41) |
(0.02) |
(0.34) |
(0.36) |
1.44 |
(18.88) |
566,195 |
0.44 |
0.44 |
0.94 |
55 |
| 2021 |
1.91 |
0.01 |
0.47 |
0.48 |
(0.02) |
(0.16) |
(0.18) |
2.21 |
25.10 |
842,806 |
0.44 |
0.43 |
0.70 |
56 |
| Large Cap Blend Portfolio | ||||||||||||||
| 2025 |
$1.12 |
$0.00‡ |
$0.16 |
$0.16 |
$(0.01) |
$(0.14) |
$(0.15) |
$1.13 |
14.34% |
$169,470 |
0.82% |
0.70% |
0.40% |
40% |
| 2024 |
1.19 |
0.01 |
0.25 |
0.26 |
(0.01) |
(0.32) |
(0.33) |
1.12 |
23.86 |
171,954 |
0.84 |
0.74 |
0.49 |
50 |
| 2023 |
1.08 |
0.01 |
0.21 |
0.22 |
(0.01) |
(0.10) |
(0.11) |
1.19 |
20.61 |
187,733 |
0.82 |
0.75 |
0.75 |
119 |
| 2022 |
1.39 |
0.01 |
(0.21) |
(0.20) |
(0.01) |
(0.10) |
(0.11) |
1.08 |
(13.78) |
195,927 |
0.81 |
0.76 |
0.78 |
38 |
| 2021 |
1.25 |
0.01 |
0.22 |
0.23 |
(0.01) |
(0.08) |
(0.09) |
1.39 |
18.46 |
203,126 |
0.81 |
0.78 |
0.68 |
19 |
| Index 500 Stock Portfolio | ||||||||||||||
| 2025 |
$9.55 |
$0.11 |
$1.55 |
$1.66 |
$(0.11) |
$(0.35) |
$(0.46) |
$10.75 |
17.64% |
$7,470,778 |
0.21% |
0.19% |
1.08% |
2% |
| 2024 |
7.88 |
0.11 |
1.83 |
1.94 |
(0.11) |
(0.16) |
(0.27) |
9.55 |
24.75 |
6,562,773 |
0.21 |
0.19 |
1.19 |
2 |
| 2023 |
6.38 |
0.11 |
1.54 |
1.65 |
(0.10) |
(0.05) |
(0.15) |
7.88 |
26.04 |
5,485,081 |
0.21 |
0.20 |
1.48 |
2 |
| 2022 |
8.18 |
0.10 |
(1.59) |
(1.49) |
(0.09) |
(0.22) |
(0.31) |
6.38 |
(18.28) |
4,465,914 |
0.21 |
0.20 |
1.41 |
2 |
| 2021 |
6.60 |
0.09 |
1.77 |
1.86 |
(0.09) |
(0.19) |
(0.28) |
8.18 |
28.45 |
5,504,970 |
0.21 |
0.19 |
1.19 |
3 |
| Large Company Value Portfolio | ||||||||||||||
| 2025 |
$0.84 |
$0.02 |
$0.10 |
$0.12 |
$(0.02) |
$(0.05) |
$(0.07) |
$0.89 |
14.58% |
$171,521 |
0.79% |
0.74% |
1.94% |
102% |
| 2024 |
0.80 |
0.02 |
0.07 |
0.09 |
(0.02) |
(0.03) |
(0.05) |
0.84 |
10.69 |
155,933 |
0.80 |
0.75 |
1.99 |
40 |
| 2023 |
0.92 |
0.02 |
0.01 |
0.03 |
(0.03) |
(0.12) |
(0.15) |
0.80 |
3.80 |
151,998 |
0.80 |
0.75 |
2.07 |
36 |
| 2022 |
1.19 |
0.02 |
(0.03) |
(0.01) |
(0.04) |
(0.22) |
(0.26) |
0.92 |
(0.34) |
152,414 |
0.78 |
0.74 |
1.87 |
37 |
| 2021 |
1.00 |
0.02 |
0.19 |
0.21 |
(0.01) |
(0.01) |
(0.02) |
1.19 |
21.92 |
227,560 |
0.76 |
0.74 |
1.63 |
40 |
| Domestic Equity Portfolio | ||||||||||||||
| 2025 |
$1.53 |
$0.02 |
$0.19 |
$0.21 |
$(0.03) |
$(0.14) |
$(0.17) |
$1.57 |
14.43% |
$1,173,322 |
0.54% |
0.50% |
1.54% |
105% |
| 2024 |
1.58 |
0.03 |
0.08 |
0.11 |
(0.03) |
(0.13) |
(0.16) |
1.53 |
7.07 |
1,054,496 |
0.54 |
0.50 |
1.91 |
31 |
| 2023 |
1.63 |
0.03 |
0.02 |
0.05 |
(0.03) |
(0.07) |
(0.10) |
1.58 |
3.71 |
1,057,066 |
0.54 |
0.50 |
2.04 |
23 |
| 2022 |
1.93 |
0.03 |
(0.10) |
(0.07) |
(0.03) |
(0.20) |
(0.23) |
1.63 |
(2.99) |
1,060,119 |
0.53 |
0.50 |
1.84 |
12 |
| 2021 |
1.64 |
0.03 |
0.33 |
0.36 |
(0.03) |
(0.04) |
(0.07) |
1.93 |
22.71 |
1,096,677 |
0.53 |
0.50 |
1.77 |
29 |
#
Calculated based on average shares outstanding during the period.
*
Total Return includes deductions for management and other fund expenses; excludes deductions for sales loads and account fees, not annualized for periods less than one year.
†
Expense ratios are based upon the direct and allocated expenses of the Portfolio and do not include the effect of underlying funds’ expenses. For additional information on underlying funds’ expenses, please refer to the Fee and Expense table in the Prospectus.
‡
Amount is less than $0.005.
Northwestern Mutual Series Fund, Inc. Prospectus 166
FINANCIAL HIGHLIGHTS (Continued) (For a share outstanding through the period)
| |
Net Asset Value, Beginning of Period |
Net Investment Income (Loss)# |
Net Realized and Unrealized Gain (Loss) on Investments |
Total from Investment Operations |
Distributions from Net Investment Income |
Distributions from Realized Gains on Investments |
Total Distributions |
Net Asset Value, End of Period |
Total Return* |
Net Assets, End of Period (thousands) |
Ratio of Gross Expenses to Average Net Assets† |
Ratio of Net Expenses to Average Net Assets† |
Ratio of Net Investment Income (Loss) to Average Net Assets |
Portfolio Turnover Rate |
| Equity Income Portfolio | ||||||||||||||
| 2025 |
$1.75 |
$0.03 |
$0.22 |
$0.25 |
$(0.04) |
$(0.18) |
$(0.22) |
$1.78 |
14.48% |
$771,675 |
0.65% |
0.57% |
1.86% |
28% |
| 2024 |
1.66 |
0.03 |
0.17 |
0.20 |
(0.04) |
(0.07) |
(0.11) |
1.75 |
11.88 |
722,693 |
0.66 |
0.57 |
1.89 |
24 |
| 2023 |
1.69 |
0.04 |
0.11 |
0.15 |
(0.04) |
(0.14) |
(0.18) |
1.66 |
9.68 |
717,491 |
0.66 |
0.57 |
2.24 |
18 |
| 2022 |
2.01 |
0.04 |
(0.10) |
(0.06) |
(0.04) |
(0.22) |
(0.26) |
1.69 |
(3.22) |
702,376 |
0.65 |
0.57 |
2.17 |
15 |
| 2021 |
1.63 |
0.03 |
0.39 |
0.42 |
(0.04) |
— |
(0.04) |
2.01 |
25.70 |
867,936 |
0.65 |
0.57 |
1.74 |
18 |
| Mid Cap Growth Stock Portfolio | ||||||||||||||
| 2025 |
$3.36 |
$(0.00)‡ |
$0.29 |
$0.29 |
$— |
$(0.60) |
$(0.60) |
$3.05 |
8.32% |
$1,031,872 |
0.54% |
0.54% |
(0.13)% |
64% |
| 2024 |
3.11 |
(0.00)‡ |
0.25 |
0.25 |
(0.00)‡ |
— |
(0.00)‡ |
3.36 |
8.21 |
1,027,872 |
0.54 |
0.54 |
(0.09) |
127 |
| 2023 |
2.71 |
0.00‡ |
0.41 |
0.41 |
(0.01) |
— |
(0.01) |
3.11 |
14.96 |
1,081,974 |
0.54 |
0.54 |
0.09 |
39 |
| 2022 |
3.94 |
0.01 |
(0.95) |
(0.94) |
(0.00)‡ |
(0.29) |
(0.29) |
2.71 |
(23.77) |
1,008,774 |
0.53 |
0.53 |
0.23 |
46 |
| 2021 |
4.09 |
0.01 |
0.41 |
0.42 |
(0.01) |
(0.56) |
(0.57) |
3.94 |
10.18 |
1,375,568 |
0.53 |
0.52 |
0.13 |
30 |
| Index 400 Stock Portfolio | ||||||||||||||
| 2025 |
$2.35 |
$0.03 |
$0.13 |
$0.16 |
$(0.03) |
$(0.15) |
$(0.18) |
$2.33 |
7.24% |
$1,489,285 |
0.28% |
0.24% |
1.25% |
15% |
| 2024 |
2.17 |
0.03 |
0.26 |
0.29 |
(0.03) |
(0.08) |
(0.11) |
2.35 |
13.63 |
1,402,515 |
0.28 |
0.24 |
1.26 |
16 |
| 2023 |
1.97 |
0.03 |
0.29 |
0.32 |
(0.03) |
(0.09) |
(0.12) |
2.17 |
16.15 |
1,290,814 |
0.28 |
0.25 |
1.42 |
19 |
| 2022 |
2.57 |
0.03 |
(0.38) |
(0.35) |
(0.02) |
(0.23) |
(0.25) |
1.97 |
(13.26) |
1,137,710 |
0.28 |
0.25 |
1.34 |
14 |
| 2021 |
2.15 |
0.03 |
0.49 |
0.52 |
(0.02) |
(0.08) |
(0.10) |
2.57 |
24.46 |
1,335,937 |
0.27 |
0.24 |
1.03 |
20 |
| Mid Cap Value Portfolio | ||||||||||||||
| 2025 |
$1.53 |
$0.03 |
$0.10 |
$0.13 |
$(0.04) |
$(0.10) |
$(0.14) |
$1.52 |
9.16% |
$657,101 |
0.88% |
0.71% |
2.04% |
75% |
| 2024 |
1.48 |
0.03 |
0.10 |
0.13 |
(0.03) |
(0.05) |
(0.08) |
1.53 |
8.65 |
632,435 |
0.88 |
0.72 |
2.04 |
57 |
| 2023 |
1.64 |
0.03 |
0.06 |
0.09 |
(0.04) |
(0.21) |
(0.25) |
1.48 |
6.26 |
665,543 |
0.88 |
0.72 |
2.17 |
50 |
| 2022 |
2.00 |
0.04 |
(0.08) |
(0.04) |
(0.04) |
(0.28) |
(0.32) |
1.64 |
(1.15) |
650,964 |
0.88 |
0.72 |
2.10 |
74 |
| 2021 |
1.65 |
0.03 |
0.35 |
0.38 |
(0.02) |
(0.01) |
(0.03) |
2.00 |
23.27 |
704,855 |
0.88 |
0.72 |
1.54 |
54 |
| Small Cap Growth Stock Portfolio | ||||||||||||||
| 2025 |
$2.53 |
$(0.00)‡ |
$0.16 |
$0.16 |
— |
$(0.13) |
$(0.13) |
$2.56 |
6.93% |
$758,947 |
0.56% |
0.56% |
(0.08)% |
88% |
| 2024 |
2.24 |
(0.00)‡ |
0.30 |
0.30 |
(0.01) |
— |
(0.01) |
2.53 |
13.18 |
733,031 |
0.56 |
0.56 |
(0.06) |
68 |
| 2023 |
1.89 |
0.00‡ |
0.35 |
0.35 |
(0.00)‡ |
— |
(0.00)‡ |
2.24 |
18.36 |
686,669 |
0.56 |
0.56 |
0.17 |
64 |
| 2022 |
3.22 |
0.00‡ |
(0.90) |
(0.90) |
— |
(0.43) |
(0.43) |
1.89 |
(28.49) |
594,877 |
0.56 |
0.56 |
0.05 |
52 |
| 2021 |
3.42 |
(0.00)‡ |
0.15 |
0.15 |
(0.00)‡ |
(0.35) |
(0.35) |
3.22 |
4.11 |
830,014 |
0.54 |
0.54 |
(0.06) |
43 |
| Index 600 Stock Portfolio | ||||||||||||||
| 2025 |
$1.60 |
$0.02 |
$0.07 |
$0.09 |
$(0.02) |
$(0.08) |
$(0.10) |
$1.59 |
5.78% |
$514,579 |
0.26% |
0.26% |
1.24% |
24% |
| 2024 |
1.53 |
0.02 |
0.10 |
0.12 |
(0.02) |
(0.03) |
(0.05) |
1.60 |
8.43 |
476,360 |
0.27 |
0.27 |
1.29 |
19 |
| 2023 |
1.39 |
0.02 |
0.20 |
0.22 |
(0.02) |
(0.06) |
(0.08) |
1.53 |
15.76 |
437,546 |
0.28 |
0.28 |
1.45 |
25 |
| 2022 |
1.85 |
0.02 |
(0.32) |
(0.30) |
(0.02) |
(0.14) |
(0.16) |
1.39 |
(16.37) |
371,552 |
0.28 |
0.28 |
1.12 |
16 |
| 2021 |
1.50 |
0.02 |
0.37 |
0.39 |
(0.01) |
(0.03) |
(0.04) |
1.85 |
26.22 |
434,426 |
0.27 |
0.27 |
1.28 |
22 |
| Small Cap Value Portfolio | ||||||||||||||
| 2025 |
$2.02 |
$0.01 |
$0.14 |
$0.15 |
$(0.02) |
$(0.20) |
$(0.22) |
$1.95 |
7.41% |
$575,961 |
0.88% |
0.87% |
0.68% |
40% |
| 2024 |
1.91 |
0.01 |
0.19 |
0.20 |
(0.02) |
(0.07) |
(0.09) |
2.02 |
10.36 |
578,679 |
0.88 |
0.87 |
0.73 |
32 |
| 2023 |
1.81 |
0.02 |
0.22 |
0.24 |
(0.01) |
(0.13) |
(0.14) |
1.91 |
13.85 |
575,849 |
0.88 |
0.87 |
0.82 |
29 |
| 2022 |
2.58 |
0.01 |
(0.48) |
(0.47) |
(0.01) |
(0.29) |
(0.30) |
1.81 |
(18.53) |
535,618 |
0.88 |
0.87 |
0.50 |
27 |
| 2021 |
2.20 |
0.01 |
0.49 |
0.50 |
(0.01) |
(0.11) |
(0.12) |
2.58 |
23.00 |
685,304 |
0.87 |
0.86 |
0.27 |
22 |
#
Calculated based on average shares outstanding during the period.
*
Total Return includes deductions for management and other fund expenses; excludes deductions for sales loads and account fees, not annualized for periods less than one year.
†
Expense ratios are based upon the direct and allocated expenses of the Portfolio and do not include the effect of underlying funds’ expenses. For additional information on underlying funds’ expenses, please refer to the Fee and Expense table in the Prospectus.
‡
Amount is less than $0.005.
167 Northwestern Mutual Series Fund, Inc. Prospectus
FINANCIAL HIGHLIGHTS (Continued) (For a share outstanding through the period)
| |
Net Asset Value, Beginning of Period |
Net Investment Income (Loss)# |
Net Realized and Unrealized Gain (Loss) on Investments |
Total from Investment Operations |
Distributions from Net Investment Income |
Distributions from Realized Gains on Investments |
Total Distributions |
Net Asset Value, End of Period |
Total Return* |
Net Assets, End of Period (thousands) |
Ratio of Gross Expenses to Average Net Assets† |
Ratio of Net Expenses to Average Net Assets† |
Ratio of Net Investment Income (Loss) to Average Net Assets |
Portfolio Turnover Rate |
| International Growth Portfolio | ||||||||||||||
| 2025 |
$1.94 |
$0.02 |
$0.34 |
$0.36 |
$(0.02) |
$(0.08) |
$(0.10) |
$2.20 |
18.70% |
$1,141,879 |
0.62% |
0.61% |
0.89% |
39% |
| 2024 |
1.90 |
0.02 |
0.09 |
0.11 |
(0.02) |
(0.05) |
(0.07) |
1.94 |
5.30 |
1,044,160 |
0.61 |
0.61 |
0.80 |
23 |
| 2023 |
1.63 |
0.02 |
0.31 |
0.33 |
(0.02) |
(0.04) |
(0.06) |
1.90 |
20.77 |
1,018,872 |
0.62 |
0.62 |
0.99 |
21 |
| 2022 |
2.40 |
0.02 |
(0.58) |
(0.56) |
(0.01) |
(0.20) |
(0.21) |
1.63 |
(23.13) |
893,048 |
0.62 |
0.62 |
0.84 |
15 |
| 2021 |
2.14 |
0.01 |
0.33 |
0.34 |
(0.01) |
(0.07) |
(0.08) |
2.40 |
15.92 |
1,068,232 |
0.62 |
0.61 |
0.51 |
25 |
| Research International Core Portfolio | ||||||||||||||
| 2025 |
$1.08 |
$0.03 |
$0.22 |
$0.25 |
$(0.02) |
$(0.02) |
$(0.04) |
$1.29 |
22.98% |
$996,174 |
0.79% |
0.71% |
2.10% |
42% |
| 2024 |
1.07 |
0.02 |
0.02 |
0.04 |
(0.02) |
(0.01) |
(0.03) |
1.08 |
3.25 |
858,304 |
0.79 |
0.72 |
1.77 |
21 |
| 2023 |
0.98 |
0.02 |
0.11 |
0.13 |
(0.02) |
(0.02) |
(0.04) |
1.07 |
12.95 |
828,651 |
0.80 |
0.75 |
1.87 |
15 |
| 2022 |
1.29 |
0.02 |
(0.25) |
(0.23) |
(0.02) |
(0.06) |
(0.08) |
0.98 |
(17.16) |
744,073 |
0.80 |
0.75 |
1.83 |
25 |
| 2021 |
1.18 |
0.02 |
0.12 |
0.14 |
(0.01) |
(0.02) |
(0.03) |
1.29 |
12.07 |
963,103 |
0.78 |
0.73 |
1.37 |
18 |
| International Equity Portfolio | ||||||||||||||
| 2025 |
$1.59 |
$0.05 |
$0.56 |
$0.61 |
$(0.05) |
$(0.02) |
$(0.07) |
$2.13 |
38.35% |
$2,379,012 |
0.68% |
0.68% |
2.52% |
16% |
| 2024 |
1.58 |
0.04 |
0.02 |
0.06 |
(0.05) |
— |
(0.05) |
1.59 |
3.94 |
1,877,350 |
0.68 |
0.68 |
2.52 |
19 |
| 2023 |
1.40 |
0.04 |
0.19 |
0.23 |
(0.05) |
— |
(0.05) |
1.58 |
16.09 |
1,877,275 |
0.68 |
0.68 |
2.65 |
14 |
| 2022 |
1.59 |
0.04 |
(0.15) |
(0.11) |
(0.04) |
(0.04) |
(0.08) |
1.40 |
(6.83) |
1,726,196 |
0.69 |
0.63 |
2.69 |
13 |
| 2021 |
1.55 |
0.04 |
0.04 |
0.08 |
(0.04) |
— |
(0.04) |
1.59 |
5.00 |
1,865,208 |
0.68 |
0.51 |
2.30 |
118 |
| Emerging Markets Equity Portfolio | ||||||||||||||
| 2025 |
$0.96 |
$0.02 |
$0.30 |
$0.32 |
$(0.01) |
— |
$(0.01) |
$1.27 |
34.19% |
$1,299,101 |
1.05% |
0.85% |
1.59% |
35% |
| 2024 |
0.93 |
0.02 |
0.02 |
0.04 |
(0.01) |
— |
(0.01) |
0.96 |
4.02 |
1,044,151 |
1.08 |
0.89 |
1.66 |
38 |
| 2023 |
0.89 |
0.02 |
0.04 |
0.06 |
(0.02) |
— |
(0.02) |
0.93 |
6.91 |
921,817 |
1.10 |
0.91 |
1.89 |
24 |
| 2022 |
1.32 |
0.01 |
(0.35) |
(0.34) |
(0.01) |
(0.08) |
(0.09) |
0.89 |
(25.28) |
854,238 |
1.09 |
0.91 |
1.29 |
33 |
| 2021 |
1.39 |
0.02 |
(0.08) |
(0.06) |
(0.01) |
— |
(0.01) |
1.32 |
(4.55) |
993,493 |
1.06 |
0.91 |
1.14 |
33 |
| Government Money Market Portfolio | ||||||||||||||
| 2025 |
$1.00 |
$0.04 |
$0.00‡ |
$0.04 |
$(0.04) |
$(0.00)‡ |
$(0.04) |
$1.00 |
4.03% |
$500,032 |
0.33% |
0.33% |
3.95% |
—% |
| 2024 |
1.00 |
0.05 |
— |
0.05 |
(0.05) |
(0.00)‡ |
(0.05) |
1.00 |
4.99 |
504,732 |
0.33 |
0.33 |
4.87 |
— |
| 2023 |
1.00 |
0.05 |
— |
0.05 |
(0.05) |
(0.00)‡ |
(0.05) |
1.00 |
4.83 |
526,384 |
0.33 |
0.33 |
4.72 |
— |
| 2022 |
1.00 |
0.01 |
— |
0.01 |
(0.01) |
(0.00)‡ |
(0.01) |
1.00 |
1.36 |
542,517 |
0.33 |
0.28 ** |
1.40 |
— |
| 2021 |
1.00 |
0.00‡ |
— |
0.00‡ |
(0.00)‡ |
(0.00)‡ |
(0.00)‡ |
1.00 |
— |
488,858 |
0.33 |
0.08 ** |
0.00 |
— |
| Short-Term Bond Portfolio | ||||||||||||||
| 2025 |
$1.04 |
$0.04 |
$0.01 |
$0.05 |
$(0.04) |
— |
$(0.04) |
$1.05 |
5.70% |
$402,401 |
0.40% |
0.40% |
4.23% |
113%§ |
| 2024 |
1.02 |
0.04 |
0.02 |
0.06 |
(0.04) |
— |
(0.04) |
1.04 |
5.04 |
390,253 |
0.40 |
0.40 |
4.13 |
116 § |
| 2023 |
0.99 |
0.03 |
0.02 |
0.05 |
(0.02) |
— |
(0.02) |
1.02 |
5.26 |
385,232 |
0.38 |
0.38 |
3.38 |
56 § |
| 2022 |
1.05 |
0.02 |
(0.07) |
(0.05) |
(0.01) |
(0.00)‡ |
(0.01) |
0.99 |
(4.52) |
382,738 |
0.38 |
0.38 |
1.90 |
54 § |
| 2021 |
1.08 |
0.01 |
(0.02) |
(0.01) |
(0.02) |
(0.00)‡ |
(0.02) |
1.05 |
(0.10) |
412,284 |
0.38 |
0.38 |
1.27 |
46 § |
| Select Bond Portfolio | ||||||||||||||
| 2025 |
$1.08 |
$0.05 |
$0.03 |
$0.08 |
$(0.05) |
— |
$(0.05) |
$1.11 |
7.45% |
$2,854,677 |
0.32% |
0.31% |
4.37% |
234%§ |
| 2024 |
1.10 |
0.05 |
(0.03) |
0.02 |
(0.04) |
— |
(0.04) |
1.08 |
1.76 |
2,804,436 |
0.31 |
0.31 |
4.33 |
234 § |
| 2023 |
1.07 |
0.04 |
0.02 |
0.06 |
(0.03) |
— |
(0.03) |
1.10 |
6.19 |
2,903,697 |
0.31 |
0.31 |
3.86 |
248 § |
| 2022 |
1.26 |
0.03 |
(0.20) |
(0.17) |
(0.02) |
(0.00)‡ |
(0.02) |
1.07 |
(13.33) |
2,786,616 |
0.31 |
0.31 |
2.30 |
275 § |
| 2021 |
1.37 |
0.02 |
(0.04) |
(0.02) |
(0.03) |
(0.06) |
(0.09) |
1.26 |
(1.59) |
3,428,416 |
0.31 |
0.30 |
1.15 |
272 § |
#
Calculated based on average shares outstanding during the period.
*
Total Return includes deductions for management and other fund expenses; excludes deductions for sales loads and account fees, not annualized for periods less than one year.
†
Expense ratios are based upon the direct and allocated expenses of the Portfolio and do not include the effect of underlying funds’ expenses. For additional information on underlying funds’ expenses, please refer to the Fee and Expense table in the Prospectus.
‡
Amount is less than $0.005.
**
During the years ended December 31, 2022 and 2021, MSA voluntarily agreed to waive a portion of its advisory fee to maintain a positive yield in the Government Money Market Portfolio. The Government Money Market Portfolio's net expense ratio would increase by an amount of 0.04% and 0.25%, respectively, if such voluntary waiver were excluded for the years ended December 31, 2022 and 2021.
§
Portfolio Turnover Rate excludes the impact of TBA transactions.
Northwestern Mutual Series Fund, Inc. Prospectus 168
FINANCIAL HIGHLIGHTS (Continued) (For a share outstanding through the period)
| |
Net Asset Value, Beginning of Period |
Net Investment Income (Loss)# |
Net Realized and Unrealized Gain (Loss) on Investments |
Total from Investment Operations |
Distributions from Net Investment Income |
Distributions from Realized Gains on Investments |
Total Distributions |
Net Asset Value, End of Period |
Total Return* |
Net Assets, End of Period (thousands) |
Ratio of Gross Expenses to Average Net Assets† |
Ratio of Net Expenses to Average Net Assets† |
Ratio of Net Investment Income (Loss) to Average Net Assets |
Portfolio Turnover Rate |
| Long-Term U.S. Government Bond Portfolio | ||||||||||||||
| 2025 |
$0.60 |
$0.02 |
$0.01 |
$0.03 |
$(0.02) |
— |
$(0.02) |
$0.61 |
6.15% |
$121,075 |
2.50%** |
2.45%** |
3.38% |
14%§ |
| 2024 |
0.66 |
0.02 |
(0.06) |
(0.04) |
(0.02) |
— |
(0.02) |
0.60 |
(5.78) |
114,458 |
2.73 ** |
2.68 ** |
2.76 |
44 § |
| 2023 |
0.65 |
0.02 |
0.01 |
0.03 |
(0.02) |
— |
(0.02) |
0.66 |
3.33 |
121,049 |
2.21 ** |
2.16 ** |
2.67 |
32 § |
| 2022 |
0.94 |
0.02 |
(0.30) |
(0.28) |
(0.01) |
— |
(0.01) |
0.65 |
(29.53) |
100,157 |
1.02 ** |
0.98 ** |
2.49 |
27 § |
| 2021 |
1.21 |
0.02 |
(0.08) |
(0.06) |
(0.01) |
(0.20) |
(0.21) |
0.94 |
(5.37) |
138,869 |
0.67 ** |
0.67 ** |
1.73 |
28 § |
| Inflation Managed Portfolio | ||||||||||||||
| 2025 |
$1.02 |
$0.04 |
$0.03 |
$0.07 |
$(0.05) |
— |
$(0.05) |
$1.04 |
6.51% |
$419,511 |
0.59% |
0.46% |
3.90% |
42%§ |
| 2024 |
1.04 |
0.03 |
(0.02) |
0.01 |
(0.03) |
— |
(0.03) |
1.02 |
1.96 |
408,498 |
0.59 |
0.45 |
3.22 |
50 |
| 2023 |
1.05 |
0.03 |
0.01 |
0.04 |
(0.05) |
— |
(0.05) |
1.04 |
3.90 |
417,289 |
0.58 |
0.52 |
3.06 |
41 § |
| 2022 |
1.28 |
0.05 |
(0.21) |
(0.16) |
(0.04) |
(0.03) |
(0.07) |
1.05 |
(12.96) |
423,548 |
0.57 |
0.54 |
4.44 |
51 |
| 2021 |
1.21 |
0.04 |
0.04 |
0.08 |
(0.01) |
(0.00)‡ |
(0.01) |
1.28 |
6.61 |
513,931 |
0.56 |
0.53 |
3.17 |
78 |
| High Yield Bond Portfolio | ||||||||||||||
| 2025 |
$0.67 |
$0.04 |
$0.01 |
$0.05 |
$(0.04) |
— |
$(0.04) |
$0.68 |
8.49% |
$712,641 |
0.46% |
0.46% |
5.86% |
35% |
| 2024 |
0.67 |
0.04 |
— |
0.04 |
(0.04) |
— |
(0.04) |
0.67 |
6.38 |
695,777 |
0.46 |
0.46 |
5.91 |
26 |
| 2023 |
0.63 |
0.04 |
0.04 |
0.08 |
(0.04) |
— |
(0.04) |
0.67 |
13.24 |
744,344 |
0.45 |
0.45 |
6.12 |
17 |
| 2022 |
0.75 |
0.04 |
(0.12) |
(0.08) |
(0.04) |
— |
(0.04) |
0.63 |
(11.33) |
689,405 |
0.45 |
0.45 |
5.54 |
19 |
| 2021 |
0.75 |
0.04 |
— |
0.04 |
(0.04) |
— |
(0.04) |
0.75 |
5.31 |
842,332 |
0.44 |
0.44 |
4.87 |
35 |
| Multi-Sector Bond Portfolio | ||||||||||||||
| 2025 |
$0.99 |
$0.05 |
$0.05 |
$0.10 |
$(0.06) |
— |
$(0.06) |
$1.03 |
10.00% |
$1,378,284 |
0.85%** |
0.75%** |
5.17% |
36%§ |
| 2024 |
0.97 |
0.05 |
0.02 |
0.07 |
(0.05) |
— |
(0.05) |
0.99 |
6.42 |
1,305,012 |
0.86 ** |
0.75 ** |
5.13 |
34 § |
| 2023 |
0.91 |
0.04 |
0.04 |
0.08 |
(0.02) |
— |
(0.02) |
0.97 |
9.71 |
1,199,679 |
0.83 ** |
0.73 ** |
4.53 |
26 § |
| 2022 |
1.13 |
0.03 |
(0.21) |
(0.18) |
(0.04) |
(0.00)‡ |
(0.04) |
0.91 |
(15.39) |
1,112,579 |
0.81 ** |
0.72 ** |
3.48 |
18 |
| 2021 |
1.16 |
0.03 |
(0.03) |
0.00 ‡ |
(0.02) |
(0.01) |
(0.03) |
1.13 |
(0.08) |
1,316,651 |
0.81 ** |
0.71 ** |
2.90 |
21 |
| Active/Passive Very Aggressive Portfolio | ||||||||||||||
| 2025 *** |
$1.00 |
$0.02 |
$0.07 |
$0.09 |
$(0.01) |
$(0.02) |
$(0.03) |
$1.06 |
9.81% |
$49,716 |
0.45%+ |
0.27%+ |
2.99%+ |
25%++ |
| Active/Passive Aggressive Portfolio | ||||||||||||||
| 2025 *** |
$1.00 |
$0.02 |
$0.07 |
$0.09 |
$(0.02) |
$(0.02) |
$(0.04) |
$1.05 |
8.22% |
$53,272 |
0.43%+ |
0.27%+ |
4.01%+ |
28%++ |
| Active/Passive Moderate Portfolio | ||||||||||||||
| 2025 |
$1.12 |
$0.03 |
$0.13 |
$0.16 |
$(0.03) |
$(0.03) |
$(0.06) |
$1.22 |
14.46% |
$298,981 |
0.32% |
0.15% |
2.58% |
22% |
| 2024 |
1.08 |
0.03 |
0.07 |
0.10 |
(0.02) |
(0.04) |
(0.06) |
1.12 |
9.72 |
272,773 |
0.58 |
0.13 |
2.29 |
26 |
| 2023 |
1.01 |
0.02 |
0.14 |
0.16 |
(0.02) |
(0.07) |
(0.09) |
1.08 |
15.24 |
273,823 |
0.58 |
0.10 |
1.95 |
11 |
| 2022 |
1.33 |
0.02 |
(0.23) |
(0.21) |
(0.03) |
(0.08) |
(0.11) |
1.01 |
(14.83) |
257,699 |
0.57 |
0.09 |
1.46 |
35 |
| 2021 |
1.29 |
0.02 |
0.12 |
0.14 |
(0.03) |
(0.07) |
(0.10) |
1.33 |
10.45 |
320,737 |
0.55 |
0.09 |
1.37 |
18 |
#
Calculated based on average shares outstanding during the period.
*
Total Return includes deductions for management and other fund expenses; excludes deductions for sales loads and account fees, not annualized for periods less than one year.
†
Expense ratios are based upon the direct and allocated expenses of the Portfolio and do not include the effect of underlying funds’ expenses. For additional information on underlying funds’ expenses, please refer to the Fee and Expense table in the Prospectus.
**
The ratios of gross expenses to average net assets and net expenses to average net assets include interest expense. Excluding interest expense, the ratios for the Long-Term U.S. Government Portfolio would be be 0.70% and 0.65% respectively in 2025, 0.70% and 0.65% respectively in 2024, 0.69% and 0.65% respectively in 2023, 0.68% and 0.65% respectively in 2022, and 0.65% and 0.65% respectively in 2021. The ratios for the Multi-Sector Bond Portfolio would be 0.83% and 0.72% respectively for 2025, 0.82% and 0.72% respectively in 2024, 0.83% and 0.73% respectively in 2023, 0.81% and 0.71% respectively in 2022, and 0.80% and 0.71% respectively in 2021.
§
Portfolio Turnover Rate excludes the impact of TBA transactions.
‡
Amount is less than $0.005.
***
For the period June 30, 2025 (commencement of operations) to December 31, 2025.
+
Computed on an annualized basis.
++
Not annualized for periods less than one year.
169 Northwestern Mutual Series Fund, Inc. Prospectus
FINANCIAL HIGHLIGHTS (Continued) (For a share outstanding through the period)
| |
Net Asset Value, Beginning of Period |
Net Investment Income (Loss)# |
Net Realized and Unrealized Gain (Loss) on Investments |
Total from Investment Operations |
Distributions from Net Investment Income |
Distributions from Realized Gains on Investments |
Total Distributions |
Net Asset Value, End of Period |
Total Return* |
Net Assets, End of Period (thousands) |
Ratio of Gross Expenses to Average Net Assets† |
Ratio of Net Expenses to Average Net Assets† |
Ratio of Net Investment Income (Loss) to Average Net Assets |
Portfolio Turnover Rate |
| Active/Passive Balanced Portfolio | ||||||||||||||
| 2025 |
$1.33 |
$0.04 |
$0.12 |
$0.16 |
$(0.04) |
$(0.04) |
$(0.08) |
$1.41 |
12.19% |
$1,968,661 |
0.21% |
0.11% |
3.11% |
16% |
| 2024 |
1.29 |
0.04 |
0.06 |
0.10 |
(0.03) |
(0.03) |
(0.06) |
1.33 |
7.43 |
1,915,820 |
0.31 |
0.09 |
2.73 |
29 |
| 2023 |
1.21 |
0.03 |
0.13 |
0.16 |
(0.03) |
(0.05) |
(0.08) |
1.29 |
13.07 |
1,962,442 |
0.31 |
0.06 |
2.15 |
9 |
| 2022 |
1.57 |
0.02 |
(0.24) |
(0.22) |
(0.05) |
(0.09) |
(0.14) |
1.21 |
(14.14) |
1,883,127 |
0.31 |
0.06 |
1.54 |
30 |
| 2021 |
1.57 |
0.02 |
0.10 |
0.12 |
(0.04) |
(0.08) |
(0.12) |
1.57 |
7.56 |
2,381,573 |
0.31 |
0.06 |
1.51 |
20 |
| Active/Passive Conservative Portfolio | ||||||||||||||
| 2025 *** |
$1.00 |
$0.03 |
$0.02 |
$0.05 |
$(0.03) |
$(0.01) |
$(0.04) |
$1.01 |
4.81% |
$29,544 |
0.54%+ |
0.27%+ |
5.79%+ |
9%++ |
#
Calculated based on average shares outstanding during the period.
*
Total Return includes deductions for management and other fund expenses; excludes deductions for sales loads and account fees, not annualized for periods less than one year.
†
Expense ratios are based upon the direct and allocated expenses of the Portfolio and do not include the effect of underlying funds’ expenses. For additional information on underlying funds’ expenses, please refer to the Fee and Expense table in the Prospectus.
***
For the period June 30, 2025 (commencement of operations) to December 31, 2025.
+
Computed on an annualized basis.
++
Not annualized for periods less than one year.
Northwestern Mutual Series Fund, Inc. Prospectus 170
APPENDIX A
DESCRIPTIONS OF BENCHMARKS AND OTHER INDICES
The following indices are used to illustrate investment market, sector or style performance or to serve as Portfolio performance comparisons for the various Portfolios. Unlike the Portfolios, the indices are not professionally managed and do not incur fees or expenses. It is not possible to invest directly in an index.
1∕3 each: Bloomberg® Global Aggregate—Credit Component ex Emerging Markets, Hedged USD; ICE BofA Global High-Yield BB-B Rated Constrained Developed Markets Index, Hedged USD; and JPMorgan® EMBI Global—The benchmark is an equally weighted blend of the following three indices: Bloomberg® Global Aggregate—Credit Component ex Emerging Markets, Hedged USD; ICE BofA Global High Yield BB-B Rated Constrained Developed Markets Index, Hedged USD; and JPMorgan® EMBI Global. The Bloomberg® Global Aggregate—Credit Component ex Emerging Markets, Hedged USD Index provides a broad-based measure of the global developed markets investment-grade fixed income markets. The ICE BofA Global High Yield BB-B Rated Constrained Developed Markets Index, Hedged USD tracks the performance of below investment-grade bonds of corporate issuers domiciled in developed market countries rated BB1 through B3, based on an average of Moody’s, S&P and Fitch. Qualifying bonds are capitalization-weighted provided the total allocation to an individual issuer (defined by Bloomberg tickers) does not exceed 2%. Issuers that exceed the limit are reduced to 2% and the face value of each of their bonds is adjusted on a pro-rata basis. Similarly, the face value of bonds of all other issuers that fall below the 2% cap are increased on a pro-basis. The index is re-balanced on the last calendar day of the month. The JPMorgan® EMBI Global tracks total returns for U.S. dollar-denominated debt instruments issued by emerging market sovereign and quasi-sovereign entities, Brady bonds, loans, Eurobonds and local market instruments. It is not possible to invest in an unmanaged index.
Active/Passive Balanced Portfolio Blended Composite Benchmark—The Active/Passive Balanced Portfolio Blended Composite Benchmark is an unmanaged, hypothetical combination of unmanaged indices that correspond to the Active/Passive Balanced Portfolio’s model allocation and consists of the S&P 500® Index (17%), S&P MidCap 400® Index (5%), S&P SmallCap 600® Index (3%), MSCI® EAFE Index (10%), MSCI® Emerging Markets Index (5%), Dow Jones U.S. Select REIT Index (4%), Bloomberg® Commodity IndexSM (4%), Bloomberg® Barclays U.S. Aggregate Bond Index (50%) and ICE BofA® US 3-Month Treasury Bill Index (2%).
Active/Passive Moderate Portfolio Blended Composite Benchmark—The Active/Passive Moderate Portfolio Blended Composite Benchmark is an unmanaged, hypothetical combination of unmanaged indices that correspond to the
Active/Passive Moderate Portfolio’s model allocation and consists of the S&P 500® Index (28%), S&P 400® MidCap Index (7%), S&P SmallCap 600 Index (3%), MSCI® EAFE Index (15%), MSCI® Emerging Markets Index (6%), Dow Jones U.S. Select REIT Index (4%), Bloomberg® Commodity IndexSM (5%), Bloomberg® Barclays U.S. Aggregate Bond Index (30%) and ICE BofA® US 3-Month Treasury Bill Index (2%).
Bloomberg® 1-3 Year U.S. Government/Credit Bond Index—The Bloomberg® 1-3 Year U.S. Government/Credit Bond Index is an unmanaged index of publicly issued medium and larger issues of U.S. government, investment-grade corporate, and investment-grade international dollar-denominated bonds that have maturities of between 1 and 3 years.
Bloomberg® U.S. Aggregate Bond Index—The Bloomberg® U.S. Aggregate Bond Index is an unmanaged index of publicly issued investment-grade fixed-rate debt securities including corporate, U.S. Treasury and government agency securities, mortgage pass-through and asset-backed securities with remaining maturities of at least one year regardless of call features.
Bloomberg® U.S. Corporate High Yield 2% Issuer Capped Index—The Bloomberg® U. S. Corporate High Yield 2% Issuer Capped Index is an unmanaged index of U.S. Dollar-denominated, non-convertible, fixed-rate, noninvestment-grade debt. Issuers are capped at 2% of the Index. Index holdings must have at least one year to final maturity, at least $150 million par amount outstanding, and be publicly issued with a rating of Ba1 or lower.
Bloomberg® Global Aggregate Index— The Bloomberg® Global Aggregate Index is an unmanaged index that measures global investment grade debt, composed of government, government-related, and corporate bonds, as well as asset-backed, mortgage-backed and commercial mortgage-backed securities from both developed and emerging markets issuers.
Bloomberg® Long-Term U.S. Treasury Index—The Bloomberg® Long-Term U.S. Treasury Index is an unmanaged index comprised of fixed-income securities with various maturities greater than 10 years.
Bloomberg® U.S. Treasury Inflation Protected Securities (TIPS) Index—The Bloomberg® U.S. Treasury Inflation Protected Securities (TIPS) Index is an unmanaged index of inflation-protected public obligations of the U.S. Treasury. The index is market capitalization weighted and includes all publicly-issued U.S. Treasury Inflation-Protected Securities that have at least one year remaining to maturity and have $250 million or more of outstanding face value.
ICE BofA US 3-Month Treasury Bill Index—The ICE BofA US 3-Month Treasury Bill Index is comprised of a single issue purchased at the beginning of the month and held for a full
171 Northwestern Mutual Series Fund, Inc. Prospectus
month. At the end of the month that issue is sold and rolled into a newly selected issue. The issue selected at each month-end rebalancing is the outstanding Treasury Bill that matures closest to, but not beyond, three months from the rebalancing date. To qualify for selection, an issue must have settled on or before the month-end rebalancing date.
MSCI® All Country World (ex-US) Index—The MSCI® All Country World (ex-US) Index is an unmanaged, free float-adjusted market capitalization-weighted index that is designed to measure equity performance of companies in the developed and emerging markets, excluding the U.S.
MSCI® All Country World (ex-US) Value Index—The MSCI® All Country World (ex-US) Value Index is an unmanaged, free float-adjusted market capitalization-weighted index that is designed to measure equity performance of companies in the developed and emerging markets, excluding the U.S., which captures large and mid cap securities exhibiting overall value style characteristics.
MSCI EAFE® (Europe-Australasia-Far-East) Index—The MSCI EAFE® (“Europe-Australasia-Far East”) Index is an unmanaged, free float-adjusted, market capitalization-weighted index that is designed to measure developed market equity performance, excluding the U.S. & Canada.
MSCI EAFE® (Europe-Australasia-Far-East) Growth Index—The MSCI EAFE® (“Europe-Australasia-Far East”) Index is an unmanaged, free float-adjusted, market capitalization-weighted index that is designed to measure equity performance of companies in the developed markets, excluding the U.S. & Canada, with higher historical and forecasted growth characteristics.
MSCI® Emerging Markets Index—The MSCI® Emerging Markets Index is an unmanaged, free float-adjusted, market capitalization-weighted index that is designed to measure equity market performance in the global emerging markets.
Russell 1000® Growth Index—The Russell 1000® Growth Index is an unmanaged index that measures the performance of those companies in the Russell 1000® Index with higher price-to-book ratios and higher forecasted growth values.
Russell 1000® Value Index—The Russell 1000® Value Index is an unmanaged index that measures the performance of those companies in the Russell 1000® Index with lower price-to-book ratios and lower forecasted growth values.
Russell 2000® Growth Index—The Russell 2000® Growth Index is an unmanaged index that measures the performance of those companies in the Russell 2000® Index with higher price-to-book ratios and higher forecasted growth values.
Russell 2000® Value Index—The Russell 2000® Value Index is an unmanaged index that measures the performance of those companies in the Russell 2000® Index with lower price-to-book ratios and lower forecasted growth values.
Russell MidCap® Growth Index—The Russell MidCap® Growth Index is an unmanaged index that measures the performance of the Russell MidCap® companies with higher price-to-book ratios and higher forecasted growth values.
Russell MidCap® Value Index—The Russell MidCap® Value Index is an unmanaged index that measures the performance of the Russell MidCap® companies with lower price-to-book and lower forecasted growth values.
S&P 500® Index—The S&P 500® Composite Stock Price Index is an unmanaged, capitalization-weighted index of 500 selected common stocks designed to measure the performance of the broad domestic economy.
S&P MidCap 400® Index—The S&P MidCap 400® Index is an unmanaged, capitalization-weighted index that measures the performance of the mid-range sector of the U.S. stock market.
S&P SmallCap 600® Index—The S&P SmallCap 600® Index is an unmanaged index of 600 selected common stocks of U.S.-based companies with small market capitalizations.
Northwestern Mutual Series Fund, Inc. Prospectus 172
More information about Northwestern Mutual Series Fund, Inc. is included in the Fund’s Statement of Additional Information (SAI), incorporated by reference in this Prospectus, which is available free of charge.
More information about the Fund’s investments is included in the Fund’s annual and semi-annual reports to shareholders and in Form N-CSR. In the Fund’s annual report, you will find a discussion of the market conditions and investment strategies that significantly impacted the Fund’s performance during the last fiscal year. In Form N-CSR, you will find the Fund’s annual and semi-annual financial statements.
To request a free copy of the Fund’s SAI, or current annual or semi-annual report, to request other information about the Fund and to make shareholder inquiries, call us at (866) 910-1232. In addition, the Fund’s SAI and current annual or semi-annual report, and other information about the Fund, are available free of charge at www.nmseriesfund.com. Reports and other information about the Fund are available on the EDGAR Database on the SEC’s Internet site at http://www.sec.gov. Copies of this information may be obtained, upon payment of a duplicating fee, by electronic request at publicinfo@sec.gov.
Investment Company Act File No. 811-3990