Index 500 Stock Portfolio
SUMMARY PROSPECTUS
MAY 1, 2026
Before you invest, you may want to review the Portfolio’s prospectus, which contains more information about the Portfolio and its risks. You can find the Portfolio’s prospectus, reports to shareholders, and other information about the Portfolio online at www.nmseriesfund.com. You can also get this information at no cost by calling (866) 910-1232 or by sending an e-mail request to sfprospectus@northwesternmutual.com. The current prospectus and statement of additional information, each dated May 1, 2026, along with the Portfolio’s most recent annual report dated December 31, 2025, are incorporated by reference into this Summary Prospectus. The Portfolio’s statement of additional information and annual report may be obtained, free of charge, in the same manner as the prospectus.
The Securities and Exchange Commission has not approved or disapproved these securities or passed upon the adequacy of this prospectus. Any representation to the contrary is a criminal offense.
INVESTMENT OBJECTIVE
The investment objective of the Portfolio is to achieve investment results that approximate the performance of the Standard & Poor’s 500 Composite Stock Price Index (“S&P 500® Index”).
FEES AND EXPENSES OF THE PORTFOLIO
The table below describes the fees and expenses that you may pay when you buy, hold, and sell interests in a separate account that invests in shares of the Portfolio as a result of your purchase of a variable annuity contract or variable life insurance policy. The fees and expenses shown in the table and Example do not reflect fees and expenses separately charged by variable annuity contracts or variable life insurance policies. If the fees and expenses separately charged by variable annuity contracts and variable life insurance policies were included, the fees and expenses shown in the table and the Example would be higher.
| Shareholder Fees
(fees paid directly from your investment) |
N/A |
| Annual Portfolio Operating
Expenses (expenses that you pay each year as a percentage
of the value of your investment) |
|
| Management Fee |
0.20% |
| Distribution and Service (12b-1) Fees |
None |
| Other Expenses |
0.01% |
| Total Annual Portfolio Operating Expenses |
0.21% |
| Fee Waiver(1) |
(0.02)% |
| Total Annual Portfolio Operating Expenses After
Fee Waiver(1) |
0.19% |
(1)
The Portfolio's investment adviser has contractually agreed to waive a portion of its management fee. This contractual agreement will continue through at
least April 30, 2027 and may not be terminated prior to that date without action by the Board of Directors.
Example
This Example is intended to help you compare the cost of investing
in the Portfolio with the cost of investing in other mutual funds. The Example assumes that you invest $10,000 in the Portfolio for the time periods indicated and then redeem or hold
all of your shares at the end of those periods. The Example also assumes that your investment has a 5% return each year and that the Portfolio’s operating expenses remain the same.
The Example reflects adjustments made to the Portfolio’s operating expenses due to the fee waiver agreement with the
investment adviser for the first year only. Although your actual costs may be higher or lower, based on these assumptions your costs would
be:
| 1 Year |
3 Years |
5 Years |
10 Years |
| $19 |
$66 |
$116 |
$266 |
Portfolio Turnover
The Portfolio pays transaction costs, such as commissions, when it buys and sells securities (or “turns over” its portfolio). A higher portfolio turnover may indicate higher transaction costs. These costs, which are not reflected in Annual Portfolio Operating Expenses or in the Example, affect the Portfolio’s performance. During the most recent fiscal year, the Portfolio’s portfolio turnover rate was 2% of
the average value of its portfolio.
PRINCIPAL
INVESTMENT STRATEGIES
The Portfolio employs a “passive
management,” or indexing, investment approach designed to track the performance of the S&P 500® Index. The S&P 500® Index is composed of the stocks of primarily large capitalization
companies that represent a broad spectrum of the U.S. economy and a substantial part of the U.S. stock market’s total capitalization. As of March
31, 2026, the market capitalization range of the S&P 500® Index was approximately $6.64 billion to $4.24 trillion. Normally,
the Portfolio invests at least 80% of net assets (plus any borrowings for investment purposes) in stocks included in the underlying index. Further, the
Portfolio attempts to achieve its objective by investing all, or substantially all, of its assets in the stocks that make up the S&P 500® Index, holding each stock in approximately the same proportion as its weighting in the Index. This is known as a full replication strategy. The Portfolio may also invest in equity index futures and exchange traded funds for cash management and liquidity purposes and to help achieve full replication.
NMSF-SP1Northwestern Mutual Series
Fund, Inc.
Index 500 Stock Portfolio – Summary
Standard & Poor’s constructs the Index by first identifying major industry
categories and then allocating a representative sample of the larger and more liquid stocks in those industries to the index. S&P weights each stock
according to its float-adjusted market value. For example, the 50 largest companies in the index may account for over 50% of its value.
The approach employed by the Portfolio with respect to
reconstitution and rebalancing aligns with the process followed generally by the S&P 500® Index. Changes to the underlying company constituents of the
S&P 500® Index are made on an as-needed basis and
are usually announced several days before they are scheduled to be implemented. The S&P 500® Index typically makes weightings adjustments based on changes in the amount of a constituent company’s shares outstanding on a quarterly basis. The constituent and share-based weightings changes made by the S&P
500® Index will be made in a parallel fashion by the
Portfolio on substantially the same timeline.
Because the Portfolio pursues an investment
strategy of full replication of the underlying S&P 500® Index, investments in the Portfolio will be concentrated in a particular industry
only to the extent that the S&P 500® Index is also
concentrated in that industry. Similarly, to the extent that the underlying S&P 500® Index has a relatively high percentage of its assets invested in a
particular sector, such as the information technology sector, the Portfolio may also hold a relatively high percentage of its assets in that particular sector, as well.
The Portfolio also intends to be diversified in
approximately the same proportion as the underlying index is diversified. The Portfolio may become “non-diversified,” as defined in the
Investment Company Act of 1940, as amended, solely as a result of a change in relative market capitalization or index weighting of one or more
constituents of the underlying index. A “non-diversified” fund generally invests a greater proportion of its assets in the securities of one
or more issuers and invests overall in a smaller number of issuers than a diversified fund. Shareholder approval will not be sought if the Portfolio
becomes non-diversified due solely to a change in the relative market capitalization or index weighting of one or more constituents of the underlying
index.
Additionally, the Portfolio
utilizes cash equitization instruments, and rebalancing occurs as necessary to maintain balances within established target ranges for these instruments.
Cash equitization as employed by the Portfolio is a strategy pursuant to which the Portfolio will acquire certain derivative instruments, such as equity
index futures, whereby the futures will be utilized to replicate index returns and enable the Portfolio to be fully invested, while still maintaining
cash balances as needed by the Portfolio. This strategy works to limit the extent to which uninvested cash will weigh negatively on overall Portfolio returns when
markets go up.
The Index 500 Stock
Portfolio’s ability to match the performance of the S&P 500® Index will be affected to some extent by the size and timing of cash flows into
and out of the Index 500 Stock Portfolio. The Portfolio will be managed with a view to reducing such effects.
PRINCIPAL RISKS
Portfolio shares will rise and fall in value and there is a risk you could lose money by
investing in the Portfolio. There can be no assurance that the Portfolio will achieve its objective. The main risks of investing in this Portfolio are identified below.
•
Derivatives Risk – The value of a derivative generally depends upon, or is derived from, an underlying asset, reference rate or index. The primary risks associated with the Portfolio’s use of derivatives are the risk that changes in the value of the derivatives may not correlate as intended with the underlying asset, rate or index and the risk of adverse price movements in the market. Certain derivatives involve leverage, which could cause the Portfolio to lose more than the principal amount invested. Other risks include counterparty and liquidity risks. The Portfolio’s purchase of futures contracts may involve risks related to imperfect correlation between the prices of such instruments and the price of the underlying asset, as well as leverage, liquidity and volatility risks.
•
Equity Securities Risk – The value of equity securities, such as the stocks in which the Portfolio invests, could decline if the financial condition of the companies the Portfolio is invested in declines or if overall market and economic conditions deteriorate. Equity securities generally have greater price volatility than fixed income securities.
•
Exchange Traded Funds Risk – Investing in exchange traded funds (ETFs) may expose the Portfolio to greater risk of loss and
price fluctuation than investing directly in a comparable portfolio of stocks comprising the index due to lack of liquidity, the additional expenses incurred as a shareholder in another investment company, and tracking error. ETFs are also subject to the risk that their market prices may trade at a premium or discount to their net asset value, which means the Portfolio will overpay for an ETF’s assets if it is trading at a premium and will get less than the value of the ETF’s assets when selling if it is trading at a discount. An active market for an ETF may not be developed or maintained. Trading of an ETF’s shares may be halted by the exchange, in which case the Portfolio would be unable to sell its ETF shares unless and until trading is resumed. To the extent that authorized participants do not place sufficient creation and redemption orders, an ETF's shares may trade at a premium or discount or may face a trading halt or delisting.
•
Indexing Strategy Risk – A Portfolio using a passive management strategy is
not “actively” managed, and therefore does not engage in shifting portfolio assets to take advantage of market opportunity, and does not attempt to manage
market volatility, use defensive strategies or reduce the effects of any long-term periods of poor stock performance. Since the Portfolio implements a full replication strategy with respect to the index which it tracks, to the extent the index has a significant allocation to a particular sector, industry, or group of industries, or to a single issuer or small number of issuers, the Portfolio will exhibit a significant
NMSF-SP2Northwestern Mutual Series Fund, Inc. Prospectus
Index 500 Stock Portfolio – Summary
investment level in that industry, group of industries, sector, issuer or small number of issuers. Portfolio performance may be adversely affected by a significant investment in a sector, industry, or group of industries, or an issuer or small number of issuers, and may be more susceptible to adverse economic, market, political or regulatory developments affecting the sector, industry, group of industries, or issuer(s) subject to a significant level of investment. Information about the Portfolio’s exposure to a particular sector, industry, or group of industries (as applicable) is available in the Portfolio’s Annual and Semi-Annual Reports to Shareholders and on required forms filed with the SEC.
Information Technology Sector Risk
– Companies in the information technology sector face risks associated with intense competition, both domestically and internationally, as well as
product obsolescence due to rapid technology developments, frequent new product introduction, unpredictable changes in growth rates, competition for the
services of qualified personnel, and changing consumer preferences.
•
Large Cap Company Risk – Investing in large cap stocks could cause the Portfolio to underperform in markets favoring faster
growing companies. Large cap stocks tend to be more mature with fewer opportunities to grow and may not have the same growth potential as stocks with smaller capitalizations.
•
Market Risk – The risk that the market price of securities owned by the Portfolio may go up or down, sometimes rapidly or unpredictably. The value of a security may decline due to changes in general market conditions, economic trends or events that are not specifically related to the issuer of the security, or factors that affect a particular issuer or issuers, exchange, country, group of countries, region, market, industry, group of industries, sector or asset class. Global economies and financial markets are increasingly interconnected, which magnifies the potential that conditions in one country or region might adversely impact issuers in, or foreign exchange rates with, a different country or region. Geopolitical and other events, including war, terrorism, economic uncertainty, trade disputes, tariffs, public health crises (such as epidemics and pandemics), and related events have led, and in the future may lead, to increased market volatility, which may disrupt U.S. and world economies and markets and may have significant adverse direct or indirect effects on the Portfolio and its investments.
•
Non-Diversification Risk – In pursuing a full replication strategy with respect to the underlying index, the Portfolio may
become non-diversified as a result of a change in relative market capitalization or index weighting of one or more constituents of the underlying index. In such circumstances, an increase or decrease in the value of a single security held by the Portfolio may have a greater impact on the Portfolio’s net asset value and total return, and the Portfolio’s performance could be more volatile than a diversified fund.
•
Tracking Error Risk – The Portfolio may be subject to tracking error, which is the divergence of the Portfolio’s performance from that of the underlying index. Tracking error may occur due to a number of factors, including differences between the securities held in the Portfolio and those included in the underlying index, and based upon the fact that the Portfolio incurs fees and expenses, while the underlying index does not. Tracking error risk may be heightened during times of increased market volatility or other unusual market conditions.
•
Underlying Portfolio Risk – The Portfolio may serve as an investment option, or “Underlying Portfolio,” for other portfolios of Northwestern Mutual Series Fund, Inc. that are managed as “fund of funds.” As a result, from time to time, the Portfolio may experience relatively large investments or redemptions from those other portfolios and could be required to invest cash or sell securities at a time when it is not advantageous to do so.
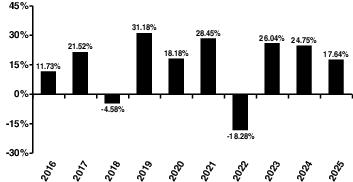
PERFORMANCE
The following bar chart illustrates the risks of investing in the Portfolio by showing
how the performance of the Portfolio has varied from year to year. The table to the right of the bar chart shows the Portfolio’s average annual
total return over certain time periods and compares the Portfolio's returns with those of an index that has characteristics relevant to
the Portfolio's investment strategy and that represents the overall securities market (Broad-Based Index). Prior to February 1, 2021, the Portfolio was managed by Mason Street Advisors, LLC.
Performance shown may have been different if the current strategy, and the current sub-adviser, had been in place during the periods shown. Returns are based on past results and are not an indication of future performance. Neither the bar chart nor the table reflects the fees and
expenses separately charged by the variable annuity contract or variable life insurance policy separate account that invests in the Portfolio and returns would be
lower if those fees and expenses were reflected.
NMSF-SP3Northwestern Mutual Series Fund, Inc. Prospectus
Index 500 Stock Portfolio – Summary
| |
Quarter/Year |
Return |
| Best Quarter |
2nd quarter, 2020 |
20.47% |
| Worst Quarter |
1st quarter, 2020 |
-19.62% |
Average Annual Total Return
(for periods ended December 31, 2025)
(for periods ended December 31, 2025)
| |
|
1 Yr |
5 Yr |
10 Yr |
| Portfolio: |
Index 500 Stock Portfolio |
17.64% |
14.19% |
14.58% |
| Broad-Based Index: |
S&P 500® Index
(reflects no deduction for fees,
expenses or taxes) |
17.88% |
14.42% |
14.82% |
PORTFOLIO MANAGEMENT
Investment Adviser: Mason Street Advisors, LLC
Sub-Adviser: BlackRock Advisors, LLC (BlackRock)
Portfolio Managers: Peter Sietsema, CFA, Director, joined BlackRock in 2007 and has managed the Portfolio since 2022.
Jennifer Hsui, CFA, Managing Director and Co-head and Chief Investment Officer of Global Index Equity, joined BlackRock in 2006 and has managed the Portfolio since 2021.
Steven White, Director and Head of the Active Risk Index ETF team in the Americas, and co-CIO for Index Equity Investments within BlackRock Global Markets & Index Investments, joined BlackRock in 2011 and has managed the Portfolio since 2025.
TAX INFORMATION
Shares of the Portfolio are offered only for funding variable annuity contracts
and variable life insurance policies offered by The Northwestern Mutual Life Insurance Company through separate accounts. Insurance company separate
accounts generally do not pay tax on dividends or capital gain distributions. Investors in variable annuity contracts and variable life insurance
policies should refer to the prospectuses for the variable products for a discussion of the tax considerations that affect the insurance company and its
separate accounts and the tax consequences to investors of owning such products.
COMPENSATION TO BROKER-DEALERS AND OTHER FINANCIAL INTERMEDIARIES
Neither the Portfolio nor any related companies pay compensation to broker-dealers or
other financial intermediaries for the sale of Portfolio shares or related services. Investors in variable annuity contracts and variable life insurance
policies should refer to the prospectuses for the variable products for important information about compensation paid to financial intermediaries for
sales of variable annuity contracts and variable life insurance policies.
NMSF-SP4Northwestern Mutual Series
Fund, Inc. Prospectus