Pay Versus Performance
The following table (our “Pay-for-Performance Table”) reports the compensation of our principal executive officer (“PEO”) and the average compensation of our other Named Executive Officers (for purposes of this “Pay Versus Performance” section, the “NEOs”) for the past two fiscal years as reported in our Summary Compensation Table. The information reported in the Pay-for-Performance Table is meant to reflect the relationship between the executive compensation that the Company actually paid and certain measures of the Company’s financial performance. For information regarding the Company’s pay-for-performance philosophy and how we align executive compensation with the Company’s financial performance, refer to our Narrative Disclosure Regarding Compensation. In accordance with the reduced disclosure requirements for smaller reporting companies, we have not included a tabular list of financial performance measures, a “Company-Selected Measure,” or executive compensation data for any peer group of the Company, and we have reported the required pay-versus-performance information for two instead of three years.
|
Value of |
||||||||||||||||||||||||
|
Average |
Initial |
|||||||||||||||||||||||
|
Summary |
Fixed $100 |
|||||||||||||||||||||||
|
Compensation |
Average |
Investment |
||||||||||||||||||||||
|
Table Total |
Compensation |
Based |
||||||||||||||||||||||
|
Summary |
Compensation |
for |
Actually Paid |
On Total |
Net |
|||||||||||||||||||
|
Compensation |
Actually Paid |
Non-PEO |
to Non-PEO |
Shareholder |
Income |
|||||||||||||||||||
|
Table Total for |
to |
NEOs |
NEOs |
Return |
($) |
|||||||||||||||||||
|
Year |
PEO ($) (1) |
PEO ($) (3) |
($) (2) |
($) (3) |
($) (4) |
(5) |
||||||||||||||||||
|
2025 |
$ | 526,400 | $ | 523,250 | $ | 385,943 | $ | 330,675 | 71 | (1,553,000 | ) | |||||||||||||
|
2024 |
$ | 603,288 | $ | 666,588 | $ | 464,561 | $ | 469,998 | $ | 132 | $ | 2,186,000 | ||||||||||||
|
2023 |
$ | 626,600 | $ | 588,500 | $ | 395,001 | $ | 366,522 | $ | 81 | $ | 610,000 | ||||||||||||
|
(1) |
Raymond C. Stachowiak, our PEO, was our Executive Chairman for each of the years presented. |
|
(2) |
During 2025, our non-PEO NEOs were Gary Delanois and R. Scott Frech. During 2024, our non-PEO NEOs were Craig K. Tagawa and Gary Delanois. During 2023, our non-PEO NEOs were Craig K. Tagawa and Peter Gaccione. |
|
(3) |
Compensation “actually paid” is calculated in accordance with Item 402(v) of Regulation S-K. The table below sets forth each adjustment to the equity awards granted to our NEOs during each year presented in the table to calculate the compensation actually paid to our NEOs each year. Values reported in the table below are roundest to the nearest dollar. |
|
Adjustments to Equity Awards to Determine |
PEO |
Non-PEO NEOs |
||||||||||||||||||||||
|
Compensation “Actually Paid” |
2025 |
2024 |
2023 |
2025 |
2024 |
2023 |
||||||||||||||||||
|
Average Summary Compensation Table Total |
$ | 526,400 | $ | 603,288 | $ | 626,600 | $ | 385,943 | $ | 464,561 | $ | 395,001 | ||||||||||||
|
Minus amounts reported in the “Stock Awards” and "Option Awards" columns of the Summary Compensation Table. |
$ | (264,000 | ) | $ | (316,800 | ) | $ | (351,600 | ) | $ | 39,468 | $ | (178,463 | ) | $ | (64,408 | ) | |||||||
|
Plus fair value as of the end of the covered year of awards granted during the covered year that are outstanding and unvested as of the end of the covered year. |
$ | 52,750 | 95,700 | $ | 72,000 | $ | 0 | $ | 191,400 | $ | 40,658 | |||||||||||||
|
Plus fair value as of the vesting date for awards granted during the covered year that vested during the covered year. |
$ | 208,100 | $ | 284,400 | $ | 241,500 | --- | --- | — | |||||||||||||||
|
Plus the change in fair value as of the vesting date (compared to as of the prior year end) of awards granted prior to the covered year that vested during the covered year. |
— | — | — | $ | (15,800 | ) | $ | (7,500 | ) | (4,729 | ) | |||||||||||||
|
Total Adjustments |
(3,150 | ) | 63,300 | (38,100 | ) | $ | (55,268 | ) | $ | 5,437 | $ | (28,479 | ) | |||||||||||
|
Compensation “Actually Paid” |
$ | 523,250 | $ | 666,588 | $ | 588,500 | $ | 330,675 | $ | 469,998 | $ | 366,522 | ||||||||||||
|
(4) |
The amounts shown above represent the Company’s cumulative total shareholder return (“TSR”) on an assumed investment of $100 in shares of our Common Stock over the indicated measurement period. Cumulative TSR is calculated by dividing (i) the sum of the cumulative amount of dividends on our Common Stock for the measurement period (if any), assuming dividend reinvestment, and the difference between the Company’s share price at the end and the beginning of the measurement period, by (ii) the Company’s share price at the beginning of the measurement period. |
|
(5) |
The dollar amounts reported represent the amount of net income available to common shareholders reflected in the Company’s audited financial statements for the applicable year. |
|
(3) |
Compensation “actually paid” is calculated in accordance with Item 402(v) of Regulation S-K. The table below sets forth each adjustment to the equity awards granted to our NEOs during each year presented in the table to calculate the compensation actually paid to our NEOs each year. Values reported in the table below are roundest to the nearest dollar. |
|
Adjustments to Equity Awards to Determine |
PEO |
Non-PEO NEOs |
||||||||||||||||||||||
|
Compensation “Actually Paid” |
2025 |
2024 |
2023 |
2025 |
2024 |
2023 |
||||||||||||||||||
|
Average Summary Compensation Table Total |
$ | 526,400 | $ | 603,288 | $ | 626,600 | $ | 385,943 | $ | 464,561 | $ | 395,001 | ||||||||||||
|
Minus amounts reported in the “Stock Awards” and "Option Awards" columns of the Summary Compensation Table. |
$ | (264,000 | ) | $ | (316,800 | ) | $ | (351,600 | ) | $ | 39,468 | $ | (178,463 | ) | $ | (64,408 | ) | |||||||
|
Plus fair value as of the end of the covered year of awards granted during the covered year that are outstanding and unvested as of the end of the covered year. |
$ | 52,750 | 95,700 | $ | 72,000 | $ | 0 | $ | 191,400 | $ | 40,658 | |||||||||||||
|
Plus fair value as of the vesting date for awards granted during the covered year that vested during the covered year. |
$ | 208,100 | $ | 284,400 | $ | 241,500 | --- | --- | — | |||||||||||||||
|
Plus the change in fair value as of the vesting date (compared to as of the prior year end) of awards granted prior to the covered year that vested during the covered year. |
— | — | — | $ | (15,800 | ) | $ | (7,500 | ) | (4,729 | ) | |||||||||||||
|
Total Adjustments |
(3,150 | ) | 63,300 | (38,100 | ) | $ | (55,268 | ) | $ | 5,437 | $ | (28,479 | ) | |||||||||||
|
Compensation “Actually Paid” |
$ | 523,250 | $ | 666,588 | $ | 588,500 | $ | 330,675 | $ | 469,998 | $ | 366,522 | ||||||||||||
|
(4) |
The amounts shown above represent the Company’s cumulative total shareholder return (“TSR”) on an assumed investment of $100 in shares of our Common Stock over the indicated measurement period. Cumulative TSR is calculated by dividing (i) the sum of the cumulative amount of dividends on our Common Stock for the measurement period (if any), assuming dividend reinvestment, and the difference between the Company’s share price at the end and the beginning of the measurement period, by (ii) the Company’s share price at the beginning of the measurement period. |
|
(5) |
The dollar amounts reported represent the amount of net income available to common shareholders reflected in the Company’s audited financial statements for the applicable year. |
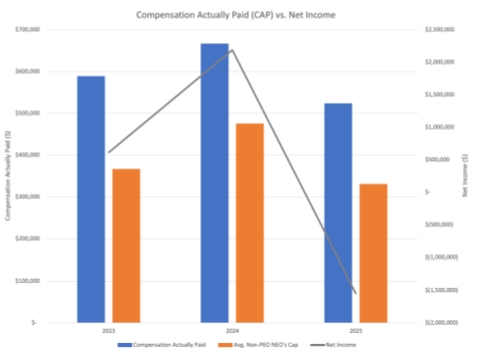
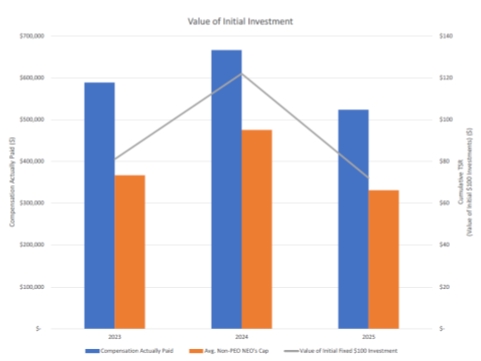
Relationship Between “Compensation Actually Paid” and Performance
The following graphs address the relationship between the compensation “actually paid” by the Company to our NEOs as disclosed in the Pay-for-Performance table and the Company’s (i) cumulative total shareholder return, assuming an initial fixed investment of $100, and (ii) net income (loss), in each case, for the years ended December 31, 2023, 2024 and 2025.
PEO and Average Non-PEO NEOs Compensation Actually Paid vs. Company TSR
PEO and Average Other NEOs Compensation Actually Paid vs. GAAP Net Income