Shareholder Report
Feb. 28, 2026
USD ($)
$ / shares
WHAT
WERE THE FUND COSTS FOR THE LAST YEAR? (based
on a hypothetical $10,000 investment)
|
Class
Name |
Costs
of a $10,000 investment
|
Costs
paid as a percentage of a $10,000
investment*
|
|
Class
A |
$92
|
0.90%
|
HOW
DID THE FUND PERFORM LAST YEAR AND WHAT AFFECTED ITS PERFORMANCE?
For the twelve months ended February
28, 2026, Class A shares of
Franklin Alabama Tax-Free Income Fund returned 3.83%.
The Fund compares its performance
to the Bloomberg Municipal Bond Index, which returned 4.96% for the same period.
PERFORMANCE
HIGHLIGHTS
|
Top
contributors to performance: | |
|
↑
|
Overweight
to bonds with no external credit rating |
|
↑
|
Security
selection in A rated bonds |
|
↑
|
Overweight
to bonds with 20 years to maturity |
|
Top
detractors from performance: | |
|
↓
|
Underweight
to bonds with five and 10 years to maturity |
|
↓
|
Security
selection in AA rated bonds |
|
↓
|
Security
selection in BBB rated bonds |

AVERAGE
ANNUAL TOTAL RETURNS (%) Period
Ended February 28, 2026
|
|
1
Year |
5
Year |
10
Year |
|
Class
A |
3.83
|
0.83
|
1.77
|
|
Class
A (with sales charge) |
-0.07
|
0.06
|
1.38
|
|
Bloomberg
Municipal Bond Index |
4.96
|
1.44
|
2.43
|
For current month-end performance,
please call Franklin Templeton at (800)
DIAL BEN/342-5236 or visit
https://www.franklintempleton.com/investments/options/mutual-funds.
https://www.franklintempleton.com/investments/options/mutual-funds.
Important data provider notices
and terms available at www.franklintempletondatasources.com.
KEY
FUND STATISTICS (as
of February 28, 2026)
|
Total
Net Assets |
$171,084,319
|
|
Total
Number of Portfolio Holdings |
101
|
|
Total
Management Fee Paid |
$851,391
|
|
Portfolio
Turnover Rate |
15.17%
|
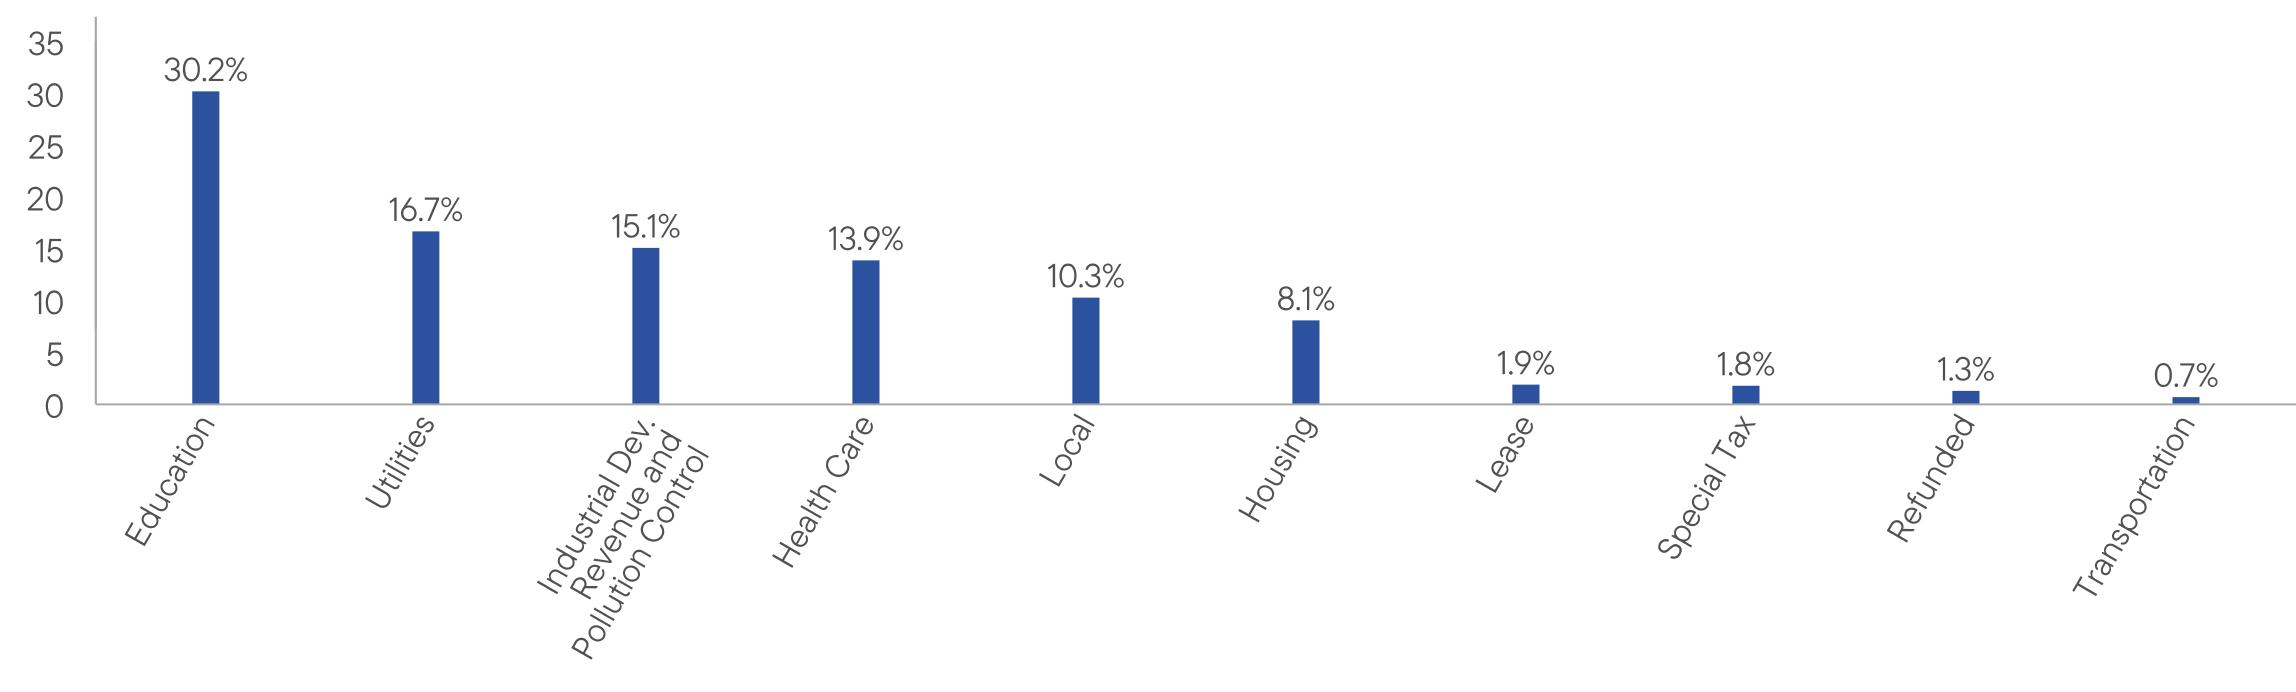
WHAT
DID THE FUND INVEST IN? (as
of February 28, 2026)
Portfolio Composition*
(% of Total Investments)

WHAT
WERE THE FUND COSTS FOR THE LAST YEAR? (based
on a hypothetical $10,000 investment)
|
Class
Name |
Costs
of a $10,000 investment
|
Costs
paid as a percentage of a $10,000
investment*
|
|
Class
A1 |
$77
|
0.75%
|
HOW
DID THE FUND PERFORM LAST YEAR AND WHAT AFFECTED ITS PERFORMANCE?
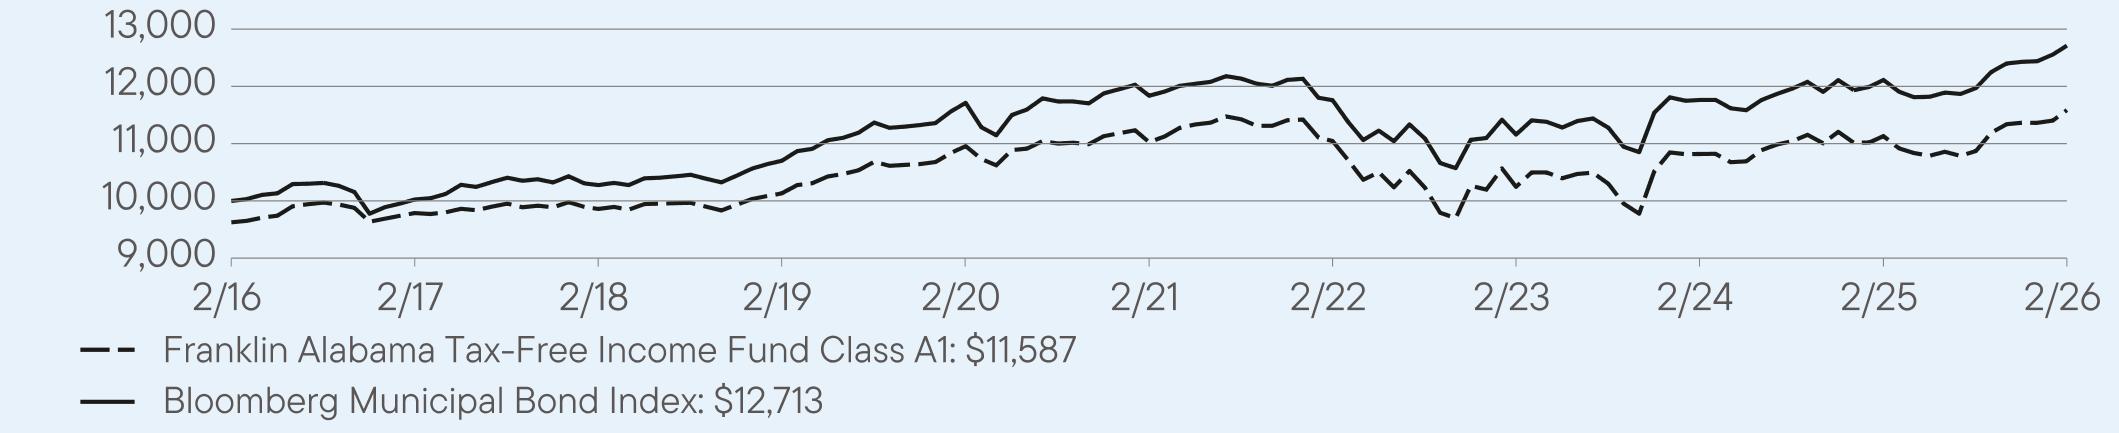
For the twelve months ended February
28, 2026, Class A1 shares of
Franklin Alabama Tax-Free Income Fund returned 4.09%.
The Fund compares its performance
to the Bloomberg Municipal Bond Index, which returned 4.96% for the same period.
PERFORMANCE
HIGHLIGHTS
|
Top
contributors to performance: | |
|
↑
|
Overweight
to bonds with no external credit rating |
|
↑
|
Security
selection in A rated bonds |
|
↑
|
Overweight
to bonds with 20 years to maturity |
|
Top
detractors from performance: | |
|
↓
|
Underweight
to bonds with five and 10 years to maturity |
|
↓
|
Security
selection in AA rated bonds |
|
↓
|
Security
selection in BBB rated bonds |
AVERAGE
ANNUAL TOTAL RETURNS (%) Period
Ended February 28, 2026
|
|
1
Year |
5
Year |
10
Year |
|
Class
A1 |
4.09
|
1.00
|
1.87
|
|
Class
A1 (with sales charge) |
0.16
|
0.24
|
1.49
|
|
Bloomberg
Municipal Bond Index |
4.96
|
1.44
|
2.43
|
For current month-end performance,
please call Franklin Templeton at (800)
DIAL BEN/342-5236 or visit
https://www.franklintempleton.com/investments/options/mutual-funds.
https://www.franklintempleton.com/investments/options/mutual-funds.
Important data provider notices
and terms available at www.franklintempletondatasources.com.
KEY
FUND STATISTICS (as
of February 28, 2026)
|
Total
Net Assets |
$171,084,319
|
|
Total
Number of Portfolio Holdings |
101
|
|
Total
Management Fee Paid |
$851,391
|
|
Portfolio
Turnover Rate |
15.17%
|
WHAT
DID THE FUND INVEST IN? (as
of February 28, 2026)
Portfolio Composition*
(% of Total Investments)

WHAT
WERE THE FUND COSTS FOR THE LAST YEAR? (based
on a hypothetical $10,000 investment)
|
Class
Name |
Costs
of a $10,000 investment
|
Costs
paid as a percentage of a $10,000
investment*
|
|
Class
C |
$131
|
1.29%
|
HOW
DID THE FUND PERFORM LAST YEAR AND WHAT AFFECTED ITS PERFORMANCE?
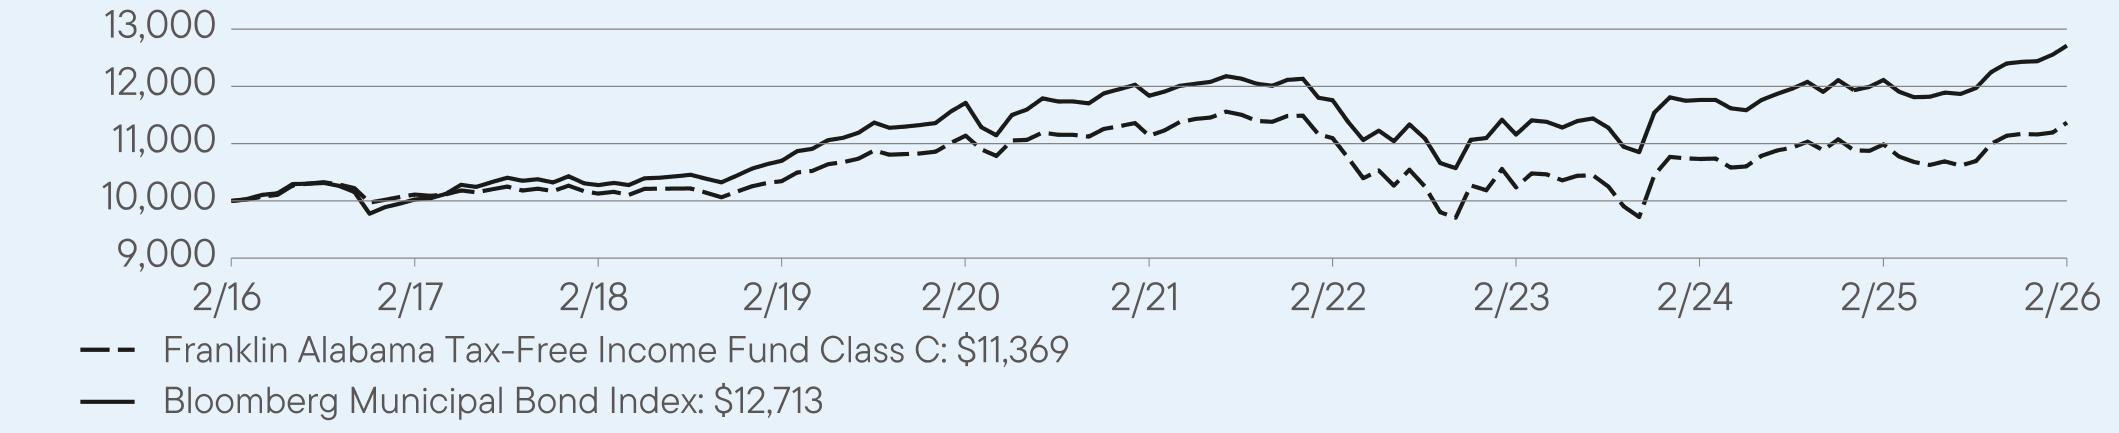
For the twelve months ended February
28, 2026, Class C shares of
Franklin Alabama Tax-Free Income Fund returned 3.46%.
The Fund compares its performance
to the Bloomberg Municipal Bond Index, which returned 4.96% for the same period.
PERFORMANCE
HIGHLIGHTS
|
Top
contributors to performance: | |
|
↑
|
Overweight
to bonds with no external credit rating |
|
↑
|
Security
selection in A rated bonds |
|
↑
|
Overweight
to bonds with 20 years to maturity |
|
Top
detractors from performance: | |
|
↓
|
Underweight
to bonds with five and 10 years to maturity |
|
↓
|
Security
selection in AA rated bonds |
|
↓
|
Security
selection in BBB rated bonds |
AVERAGE
ANNUAL TOTAL RETURNS (%) Period
Ended February 28, 2026
|
|
1
Year |
5
Year |
10
Year |
|
Class
C |
3.46
|
0.41
|
1.29
|
|
Class
C (with sales charge) |
2.46
|
0.41
|
1.29
|
|
Bloomberg
Municipal Bond Index |
4.96
|
1.44
|
2.43
|
For current month-end performance,
please call Franklin Templeton at (800)
DIAL BEN/342-5236 or visit
https://www.franklintempleton.com/investments/options/mutual-funds.
https://www.franklintempleton.com/investments/options/mutual-funds.
Important data provider notices
and terms available at www.franklintempletondatasources.com.
KEY
FUND STATISTICS (as
of February 28, 2026)
|
Total
Net Assets |
$171,084,319
|
|
Total
Number of Portfolio Holdings |
101
|
|
Total
Management Fee Paid |
$851,391
|
|
Portfolio
Turnover Rate |
15.17%
|
WHAT
DID THE FUND INVEST IN? (as
of February 28, 2026)
Portfolio Composition*
(% of Total Investments)
WHAT
WERE THE FUND COSTS FOR THE LAST YEAR? (based
on a hypothetical $10,000 investment)
|
Class
Name |
Costs
of a $10,000 investment
|
Costs
paid as a percentage of a $10,000
investment*
|
|
Class
R6 |
$63
|
0.62%
|
HOW
DID THE FUND PERFORM LAST YEAR AND WHAT AFFECTED ITS PERFORMANCE?
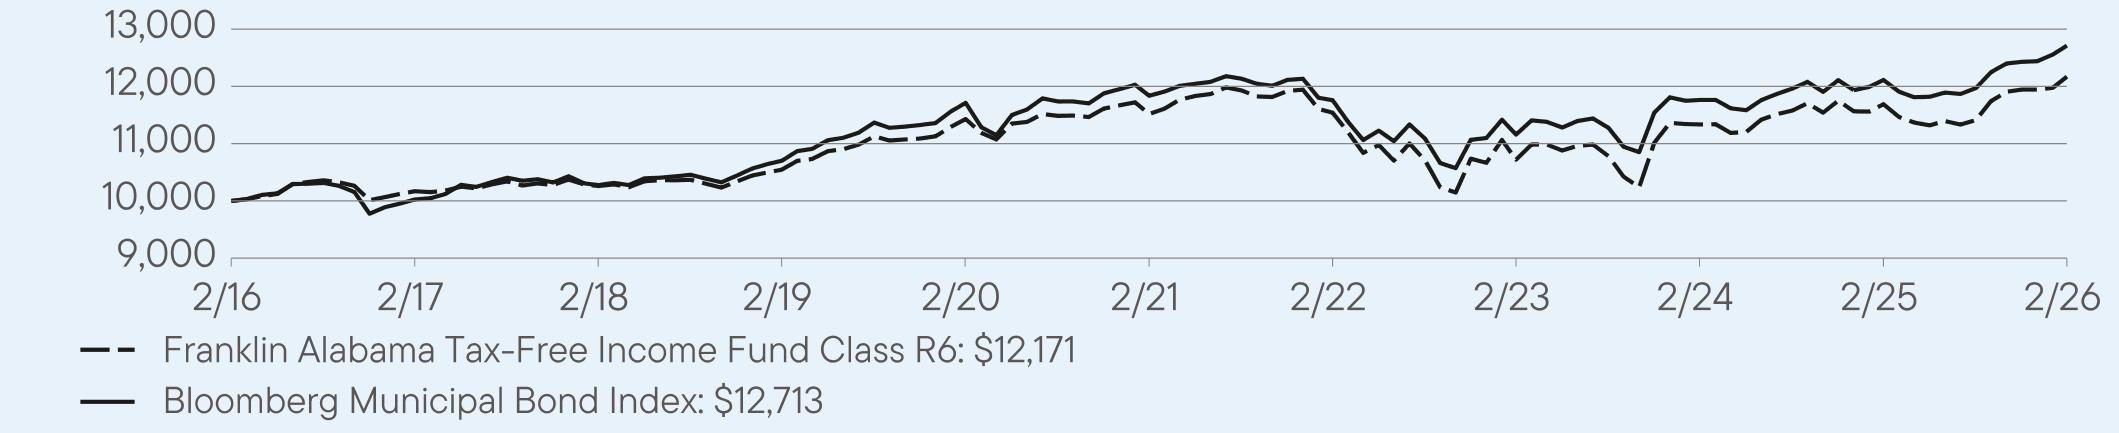
For the twelve months ended February
28, 2026, Class R6 shares of
Franklin Alabama Tax-Free Income Fund returned 4.12%.
The Fund compares its performance
to the Bloomberg Municipal Bond Index, which returned 4.96% for the same period.
PERFORMANCE
HIGHLIGHTS
|
Top
contributors to performance: | |
|
↑
|
Overweight
to bonds with no external credit rating |
|
↑
|
Security
selection in A rated bonds |
|
↑
|
Overweight
to bonds with 20 years to maturity |
|
Top
detractors from performance: | |
|
↓
|
Underweight
to bonds with five and 10 years to maturity |
|
↓
|
Security
selection in AA rated bonds |
|
↓
|
Security
selection in BBB rated bonds |
AVERAGE
ANNUAL TOTAL RETURNS (%) Period
Ended February 28, 2026
|
|
1
Year |
5
Year |
10
Year |
|
Class
R6 |
4.12
|
1.11
|
1.99
|
|
Bloomberg
Municipal Bond Index |
4.96
|
1.44
|
2.43
|
For current month-end performance,
please call Franklin Templeton at (800)
DIAL BEN/342-5236 or visit
https://www.franklintempleton.com/investments/options/mutual-funds.
https://www.franklintempleton.com/investments/options/mutual-funds.
Important data provider notices
and terms available at www.franklintempletondatasources.com.
KEY
FUND STATISTICS (as
of February 28, 2026)
|
Total
Net Assets |
$171,084,319
|
|
Total
Number of Portfolio Holdings |
101
|
|
Total
Management Fee Paid |
$851,391
|
|
Portfolio
Turnover Rate |
15.17%
|
WHAT
DID THE FUND INVEST IN? (as
of February 28, 2026)
Portfolio Composition*
(% of Total Investments)

WHAT
WERE THE FUND COSTS FOR THE LAST YEAR? (based
on a hypothetical $10,000 investment)
|
Class
Name |
Costs
of a $10,000 investment
|
Costs
paid as a percentage of a $10,000
investment*
|
|
Advisor
Class |
$66
|
0.65%
|
HOW
DID THE FUND PERFORM LAST YEAR AND WHAT AFFECTED ITS PERFORMANCE?
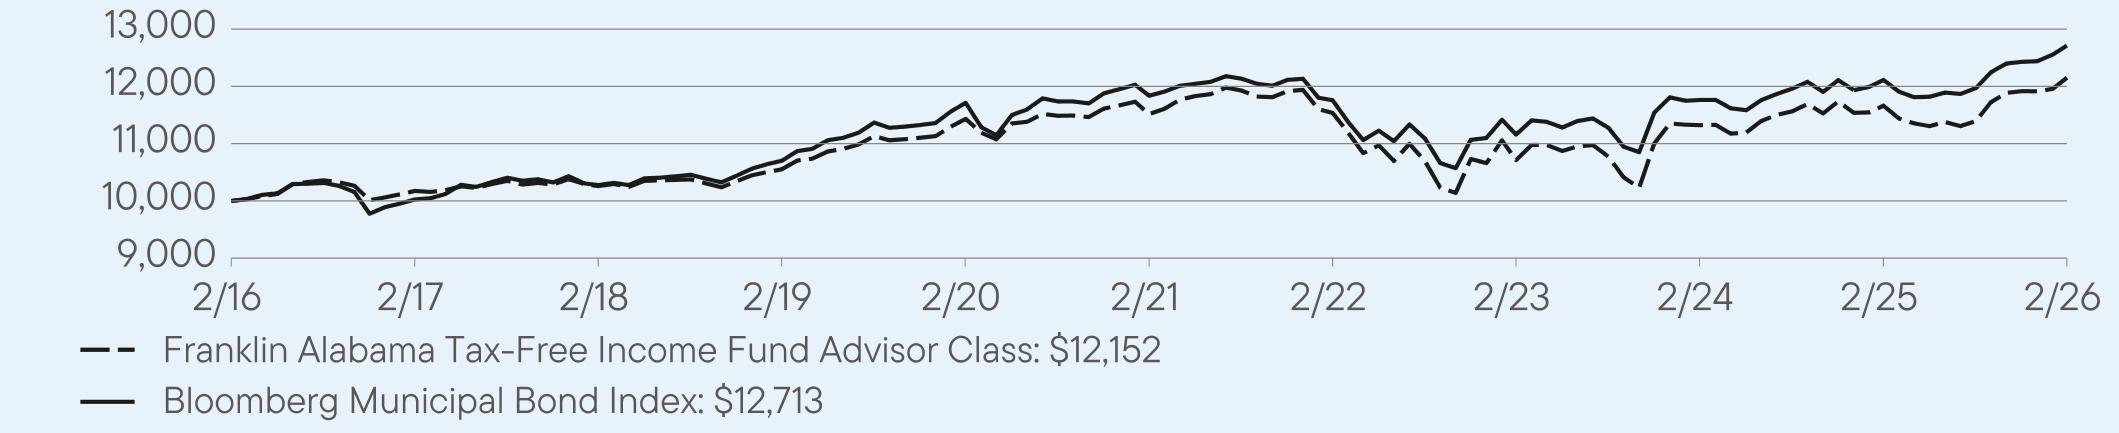
For the twelve months ended February
28, 2026, Advisor Class shares
of Franklin Alabama Tax-Free Income Fund returned 4.19%.
The Fund compares its performance
to the Bloomberg Municipal Bond Index, which returned 4.96% for the same period.
PERFORMANCE
HIGHLIGHTS
|
Top
contributors to performance: | |
|
↑
|
Overweight
to bonds with no external credit rating |
|
↑
|
Security
selection in A rated bonds |
|
↑
|
Overweight
to bonds with 20 years to maturity |
|
Top
detractors from performance: | |
|
↓
|
Underweight
to bonds with five and 10 years to maturity |
|
↓
|
Security
selection in AA rated bonds |
|
↓
|
Security
selection in BBB rated bonds |
AVERAGE
ANNUAL TOTAL RETURNS (%) Period
Ended February 28, 2026
|
|
1
Year |
5
Year |
10
Year |
|
Advisor
Class |
4.19
|
1.08
|
1.97
|
|
Bloomberg
Municipal Bond Index |
4.96
|
1.44
|
2.43
|
For current month-end performance,
please call Franklin Templeton at (800)
DIAL BEN/342-5236 or visit
https://www.franklintempleton.com/investments/options/mutual-funds.
https://www.franklintempleton.com/investments/options/mutual-funds.
Important data provider notices
and terms available at www.franklintempletondatasources.com.
KEY
FUND STATISTICS (as
of February 28, 2026)
|
Total
Net Assets |
$171,084,319
|
|
Total
Number of Portfolio Holdings |
101
|
|
Total
Management Fee Paid |
$851,391
|
|
Portfolio
Turnover Rate |
15.17%
|
WHAT
DID THE FUND INVEST IN? (as
of February 28, 2026)
Portfolio Composition*
(% of Total Investments)

WHAT
WERE THE FUND COSTS FOR THE LAST YEAR? (based
on a hypothetical $10,000 investment)
|
Class
Name |
Costs
of a $10,000 investment
|
Costs
paid as a percentage of a $10,000
investment*
|
|
Class
A |
$85
|
0.83%
|
HOW
DID THE FUND PERFORM LAST YEAR AND WHAT AFFECTED ITS PERFORMANCE?
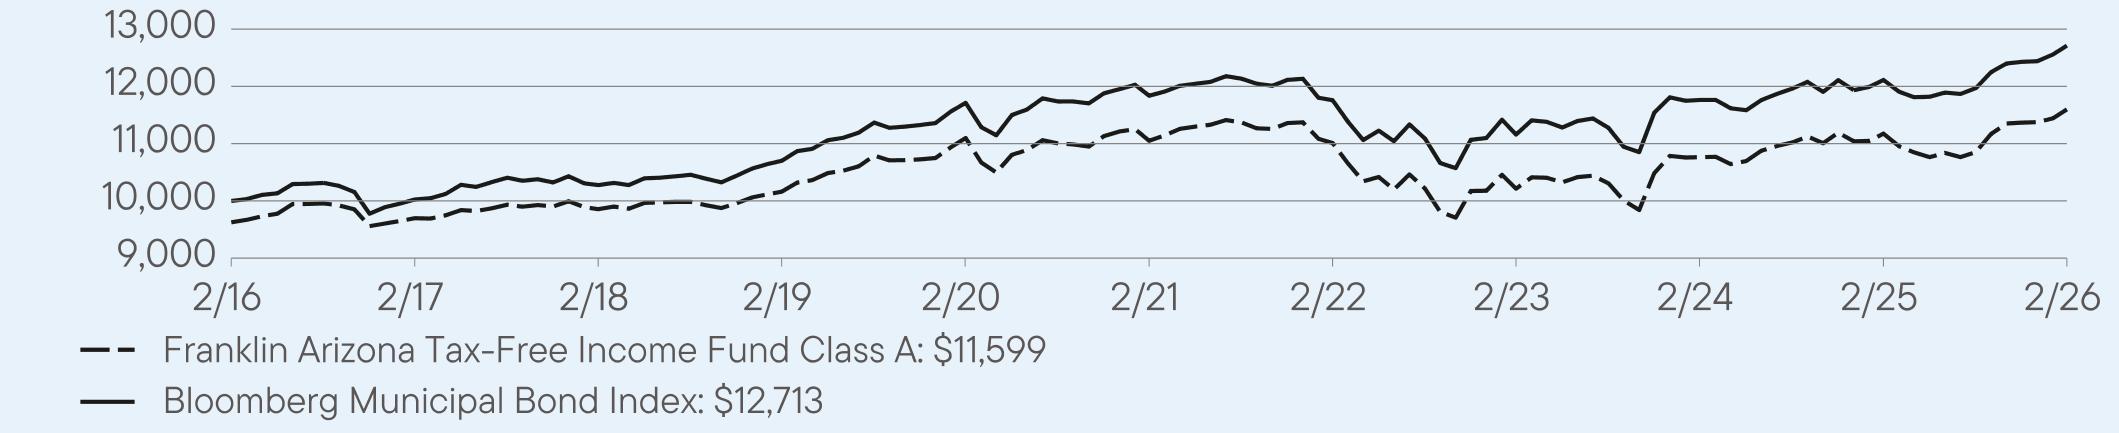
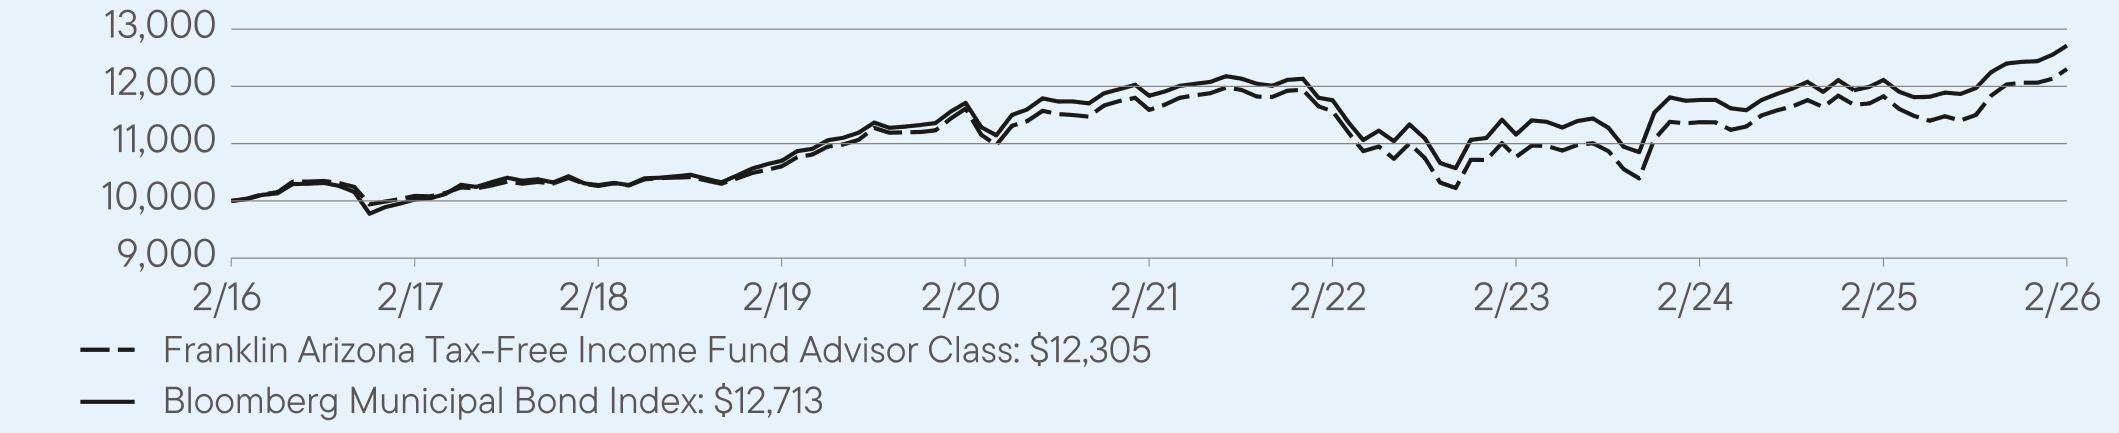
For the twelve months ended February
28, 2026, Class A shares of
Franklin Arizona Tax-Free Income
Fund returned 3.79%. The
Fund compares its performance
to the Bloomberg Municipal Bond Index, which returned 4.96% for the same period.
PERFORMANCE
HIGHLIGHTS
|
Top
contributors to performance: | |
|
↑
|
Overweight
to bonds with 10 years to maturity |
|
↑
|
Overweight
to bonds with no external credit rating |
|
↑
|
Overweight
to bonds with 20 years to maturity |
|
Top
detractors from performance: | |
|
↓
|
Underweight
to bonds with five years to maturity |
|
↓
|
Security
selection in AA rated bonds |
|
↓
|
Security
selection in BBB rated bonds |
AVERAGE
ANNUAL TOTAL RETURNS (%) Period
Ended February 28, 2026
|
|
1
Year |
5
Year |
10
Year |
|
Class
A |
3.79
|
0.97
|
1.90
|
|
Class
A (with sales charge) |
-0.11
|
0.20
|
1.51
|
|
Bloomberg
Municipal Bond Index |
4.96
|
1.44
|
2.43
|
For current month-end performance,
please call Franklin Templeton at (800)
DIAL BEN/342-5236 or visit
https://www.franklintempleton.com/investments/options/mutual-funds.
https://www.franklintempleton.com/investments/options/mutual-funds.
Important data provider notices
and terms available at www.franklintempletondatasources.com.
KEY
FUND STATISTICS (as
of February 28, 2026)
|
Total
Net Assets |
$609,841,154
|
|
Total
Number of Portfolio Holdings |
158
|
|
Total
Management Fee Paid |
$3,146,546
|
|
Portfolio
Turnover Rate |
17.42%
|
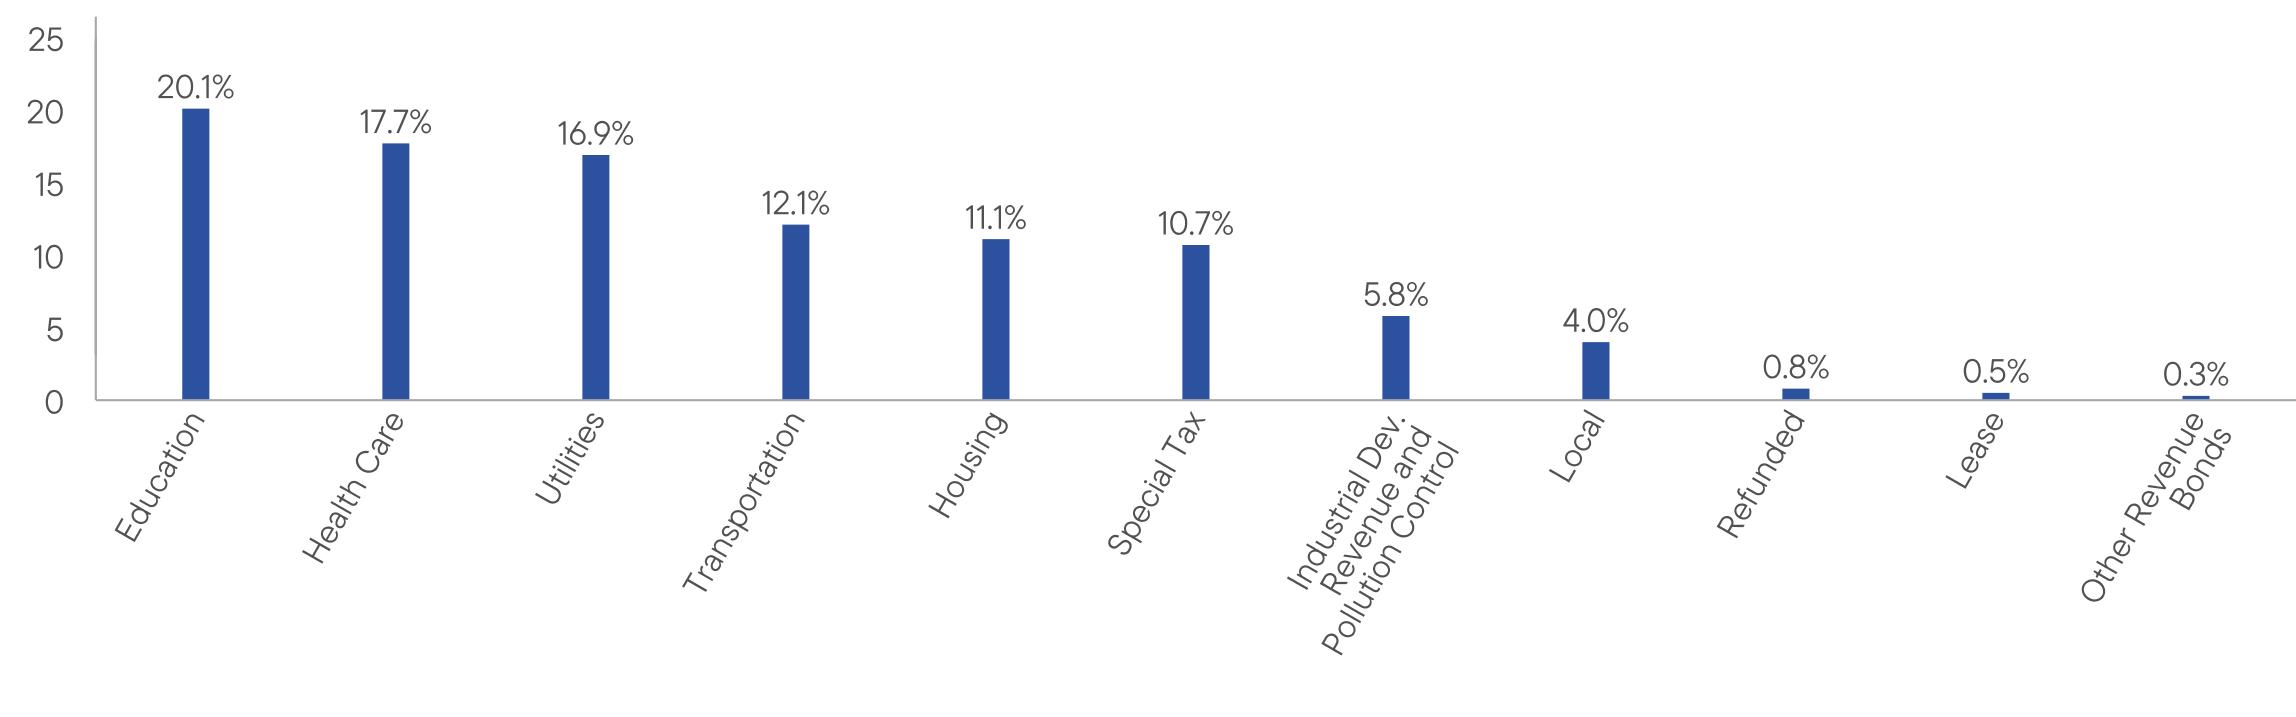
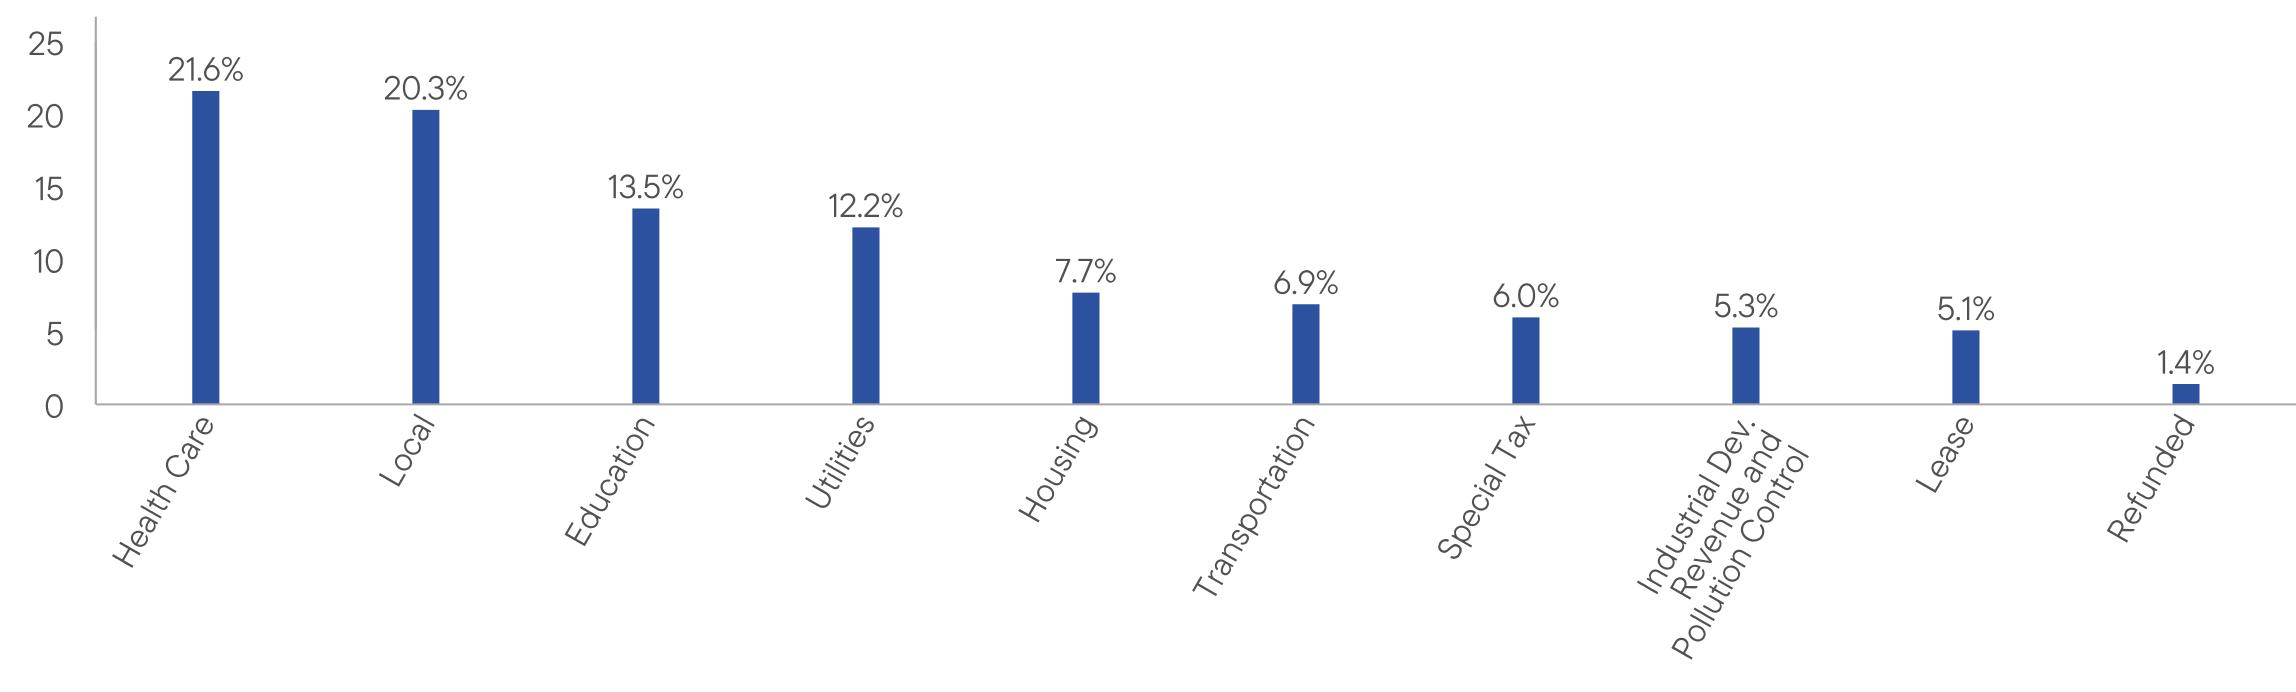
WHAT
DID THE FUND INVEST IN? (as
of February 28, 2026)
Portfolio Composition* (%
of Total Investments)

WHAT
WERE THE FUND COSTS FOR THE LAST YEAR? (based
on a hypothetical $10,000 investment)
|
Class
Name |
Costs
of a $10,000 investment
|
Costs
paid as a percentage of a $10,000
investment*
|
|
Class
A1 |
$69
|
0.68%
|
HOW
DID THE FUND PERFORM LAST YEAR AND WHAT AFFECTED ITS PERFORMANCE?
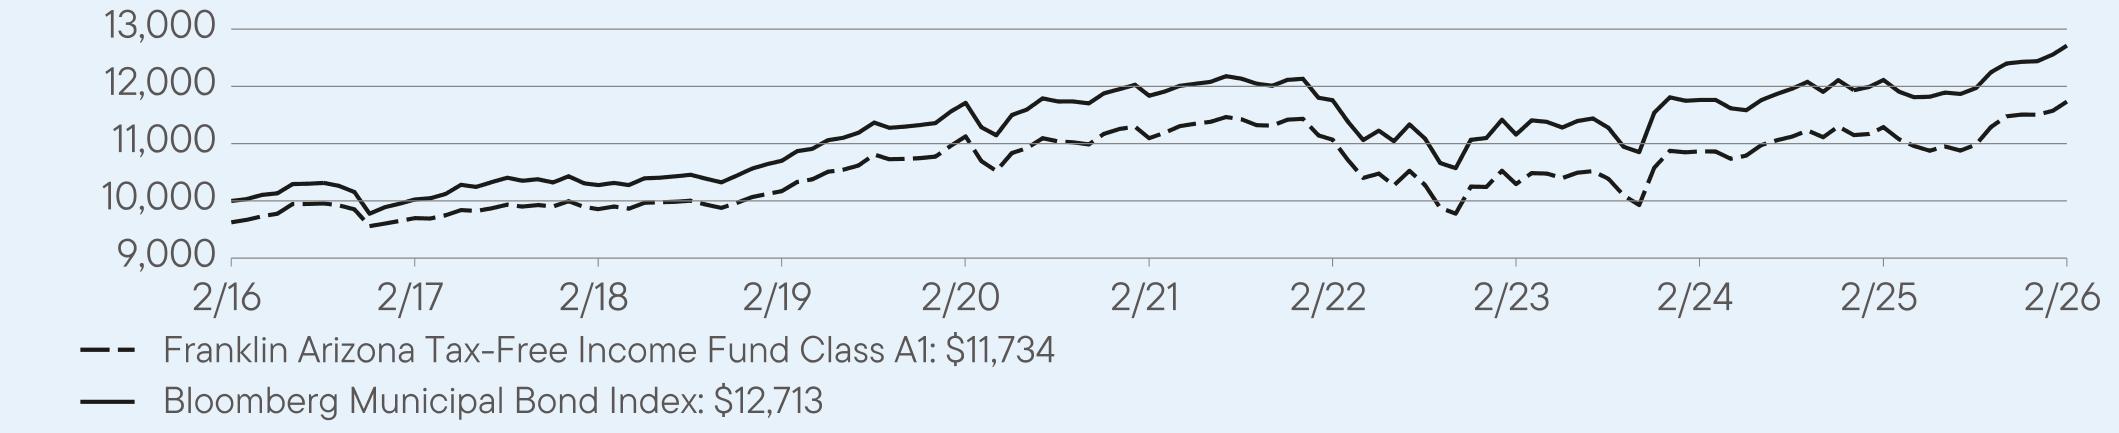
For the twelve months ended February
28, 2026, Class A1 shares of
Franklin Arizona Tax-Free Income
Fund returned 3.95%. The
Fund compares its performance
to the Bloomberg Municipal Bond Index, which returned 4.96% for the same period.
PERFORMANCE
HIGHLIGHTS
|
Top
contributors to performance: | |
|
↑
|
Overweight
to bonds with 10 years to maturity |
|
↑
|
Overweight
to bonds with no external credit rating |
|
↑
|
Overweight
to bonds with 20 years to maturity |
|
Top
detractors from performance: | |
|
↓
|
Underweight
to bonds with five years to maturity |
|
↓
|
Security
selection in AA rated bonds |
|
↓
|
Security
selection in BBB rated bonds |
AVERAGE
ANNUAL TOTAL RETURNS (%) Period
Ended February 28, 2026
|
|
1
Year |
5
Year |
10
Year |
|
Class
A1 |
3.95
|
1.13
|
2.00
|
|
Class
A1 (with sales charge) |
0.09
|
0.36
|
1.61
|
|
Bloomberg
Municipal Bond Index |
4.96
|
1.44
|
2.43
|
For current month-end performance,
please call Franklin Templeton at (800)
DIAL BEN/342-5236 or visit
https://www.franklintempleton.com/investments/options/mutual-funds.
https://www.franklintempleton.com/investments/options/mutual-funds.
Important data provider notices
and terms available at www.franklintempletondatasources.com.
KEY
FUND STATISTICS (as
of February 28, 2026)
|
Total
Net Assets |
$609,841,154
|
|
Total
Number of Portfolio Holdings |
158
|
|
Total
Management Fee Paid |
$3,146,546
|
|
Portfolio
Turnover Rate |
17.42%
|
WHAT
DID THE FUND INVEST IN? (as
of February 28, 2026)
Portfolio Composition* (%
of Total Investments)

WHAT
WERE THE FUND COSTS FOR THE LAST YEAR? (based
on a hypothetical $10,000 investment)
|
Class
Name |
Costs
of a $10,000 investment
|
Costs
paid as a percentage of a $10,000
investment*
|
|
Class
C |
$124
|
1.22%
|
HOW
DID THE FUND PERFORM LAST YEAR AND WHAT AFFECTED ITS PERFORMANCE?
For the twelve months ended February
28, 2026, Class C shares of
Franklin Arizona Tax-Free Income
Fund returned 3.41%. The
Fund compares its performance
to the Bloomberg Municipal Bond Index, which returned 4.96% for the same period.
PERFORMANCE
HIGHLIGHTS
|
Top
contributors to performance: | |
|
↑
|
Overweight
to bonds with 10 years to maturity |
|
↑
|
Overweight
to bonds with no external credit rating |
|
↑
|
Overweight
to bonds with 20 years to maturity |
|
Top
detractors from performance: | |
|
↓
|
Underweight
to bonds with five years to maturity |
|
↓
|
Security
selection in AA rated bonds |
|
↓
|
Security
selection in BBB rated bonds |

AVERAGE
ANNUAL TOTAL RETURNS (%) Period
Ended February 28, 2026
|
|
1
Year |
5
Year |
10
Year |
|
Class
C |
3.41
|
0.53
|
1.42
|
|
Class
C (with sales charge) |
2.41
|
0.53
|
1.42
|
|
Bloomberg
Municipal Bond Index |
4.96
|
1.44
|
2.43
|
For current month-end performance,
please call Franklin Templeton at (800)
DIAL BEN/342-5236 or visit
https://www.franklintempleton.com/investments/options/mutual-funds.
https://www.franklintempleton.com/investments/options/mutual-funds.
Important data provider notices
and terms available at www.franklintempletondatasources.com.
KEY
FUND STATISTICS (as
of February 28, 2026)
|
Total
Net Assets |
$609,841,154
|
|
Total
Number of Portfolio Holdings |
158
|
|
Total
Management Fee Paid |
$3,146,546
|
|
Portfolio
Turnover Rate |
17.42%
|
WHAT
DID THE FUND INVEST IN? (as
of February 28, 2026)
Portfolio Composition* (%
of Total Investments)
WHAT
WERE THE FUND COSTS FOR THE LAST YEAR? (based
on a hypothetical $10,000 investment)
|
Class
Name |
Costs
of a $10,000 investment
|
Costs
paid as a percentage of a $10,000
investment |
|
Class
R6 |
$56
|
0.55%
|
HOW
DID THE FUND PERFORM LAST YEAR AND WHAT AFFECTED ITS PERFORMANCE?
For the twelve months ended February
28, 2026, Class R6 shares of
Franklin Arizona Tax-Free Income
Fund returned 4.08%. The
Fund compares its performance
to the Bloomberg Municipal Bond Index, which returned 4.96% for the same period.
PERFORMANCE
HIGHLIGHTS
|
Top
contributors to performance: | |
|
↑
|
Overweight
to bonds with 10 years to maturity |
|
↑
|
Overweight
to bonds with no external credit rating |
|
↑
|
Overweight
to bonds with 20 years to maturity |
|
Top
detractors from performance: | |
|
↓
|
Underweight
to bonds with five years to maturity |
|
↓
|
Security
selection in AA rated bonds |
|
↓
|
Security
selection in BBB rated bonds |

AVERAGE
ANNUAL TOTAL RETURNS (%) Period
Ended February 28, 2026
|
|
1
Year |
5
Year |
10
Year |
|
Class
R6 |
4.08
|
1.24
|
2.12
|
|
Bloomberg
Municipal Bond Index |
4.96
|
1.44
|
2.43
|
For current month-end performance,
please call Franklin Templeton at (800)
DIAL BEN/342-5236 or visit
https://www.franklintempleton.com/investments/options/mutual-funds.
https://www.franklintempleton.com/investments/options/mutual-funds.
Important data provider notices
and terms available at www.franklintempletondatasources.com.
KEY
FUND STATISTICS (as
of February 28, 2026)
|
Total
Net Assets |
$609,841,154
|
|
Total
Number of Portfolio Holdings |
158
|
|
Total
Management Fee Paid |
$3,146,546
|
|
Portfolio
Turnover Rate |
17.42%
|
WHAT
DID THE FUND INVEST IN? (as
of February 28, 2026)
Portfolio Composition* (%
of Total Investments)

WHAT
WERE THE FUND COSTS FOR THE LAST YEAR? (based
on a hypothetical $10,000 investment)
|
Class
Name |
Costs
of a $10,000 investment
|
Costs
paid as a percentage of a $10,000
investment*
|
|
Advisor
Class |
$59
|
0.58%
|
HOW
DID THE FUND PERFORM LAST YEAR AND WHAT AFFECTED ITS PERFORMANCE?
For the twelve months ended February
28, 2026, Advisor Class shares
of Franklin Arizona Tax-Free
Income Fund returned 4.04%.
The Fund compares its performance
to the Bloomberg Municipal Bond Index, which returned 4.96% for the same period.
PERFORMANCE
HIGHLIGHTS
|
Top
contributors to performance: | |
|
↑
|
Overweight
to bonds with 10 years to maturity |
|
↑
|
Overweight
to bonds with no external credit rating |
|
↑
|
Overweight
to bonds with 20 years to maturity |
|
Top
detractors from performance: | |
|
↓
|
Underweight
to bonds with five years to maturity |
|
↓
|
Security
selection in AA rated bonds |
|
↓
|
Security
selection in BBB rated bonds |
AVERAGE
ANNUAL TOTAL RETURNS (%) Period
Ended February 28, 2026
|
|
1
Year |
5
Year |
10
Year |
|
Advisor
Class |
4.04
|
1.20
|
2.10
|
|
Bloomberg
Municipal Bond Index |
4.96
|
1.44
|
2.43
|
For current month-end performance,
please call Franklin Templeton at (800)
DIAL BEN/342-5236 or visit
https://www.franklintempleton.com/investments/options/mutual-funds.
https://www.franklintempleton.com/investments/options/mutual-funds.
Important data provider notices
and terms available at www.franklintempletondatasources.com.
KEY
FUND STATISTICS (as
of February 28, 2026)
|
Total
Net Assets |
$609,841,154
|
|
Total
Number of Portfolio Holdings |
158
|
|
Total
Management Fee Paid |
$3,146,546
|
|
Portfolio
Turnover Rate |
17.42%
|
WHAT
DID THE FUND INVEST IN? (as
of February 28, 2026)
Portfolio Composition* (%
of Total Investments)

WHAT
WERE THE FUND COSTS FOR THE LAST YEAR? (based
on a hypothetical $10,000 investment)
|
Class
Name |
Costs
of a $10,000 investment
|
Costs
paid as a percentage of a $10,000
investment*
|
|
Class
A |
$89
|
0.87%
|
HOW
DID THE FUND PERFORM LAST YEAR AND WHAT AFFECTED ITS PERFORMANCE?
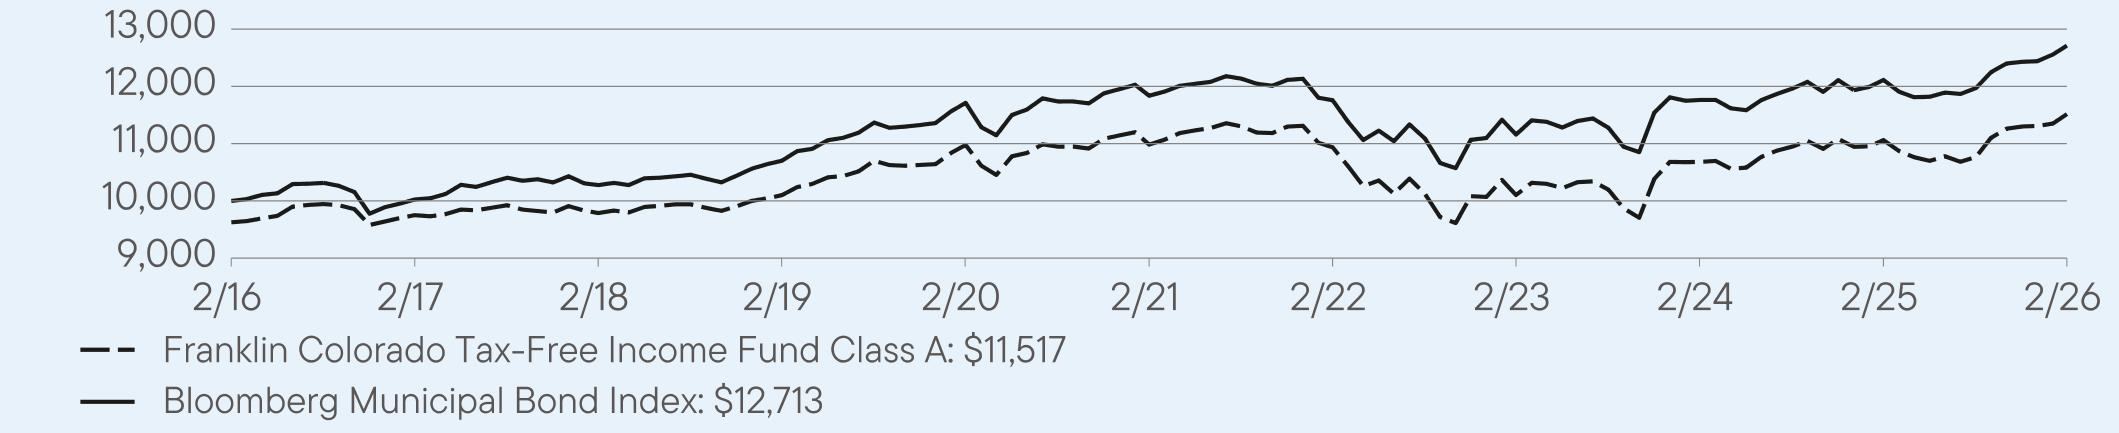
For the twelve months ended February
28, 2026, Class A shares of
Franklin Colorado Tax-Free Income Fund returned 4.11%.
The Fund compares its performance
to the Bloomberg Municipal Bond Index, which returned 4.96% for the same period.
PERFORMANCE
HIGHLIGHTS
|
Top
contributors to performance: | |
|
↑
|
Overweight
to bonds with no external credit rating |
|
↑
|
Overweight
to bonds with 20 years to maturity |
|
↑
|
Security
selection in BBB rated bonds |
|
Top
detractors from performance: | |
|
↓
|
Underweight
to bonds with two, five and 10 years to maturity |
|
↓
|
Security
selection in AA rated bonds |
|
↓
|
Overweight
to bonds with 30 years to maturity |
AVERAGE
ANNUAL TOTAL RETURNS (%) Period
Ended February 28, 2026
|
|
1
Year |
5
Year |
10
Year |
|
Class
A |
4.11
|
0.95
|
1.82
|
|
Class
A (with sales charge) |
0.21
|
0.18
|
1.43
|
|
Bloomberg
Municipal Bond Index |
4.96
|
1.44
|
2.43
|
For current month-end performance,
please call Franklin Templeton at (800)
DIAL BEN/342-5236 or visit
https://www.franklintempleton.com/investments/options/mutual-funds.
https://www.franklintempleton.com/investments/options/mutual-funds.
Important data provider notices
and terms available at www.franklintempletondatasources.com.
KEY
FUND STATISTICS (as
of February 28, 2026)
|
Total
Net Assets |
$496,980,852
|
|
Total
Number of Portfolio Holdings |
184
|
|
Total
Management Fee Paid |
$2,433,149
|
|
Portfolio
Turnover Rate |
11.43%
|
WHAT
DID THE FUND INVEST IN? (as
of February 28, 2026)
Portfolio Composition*
(% of Total Investments)

WHAT
WERE THE FUND COSTS FOR THE LAST YEAR? (based
on a hypothetical $10,000 investment)
|
Class
Name |
Costs
of a $10,000 investment
|
Costs
paid as a percentage of a $10,000
investment*
|
|
Class
A1 |
$74
|
0.72%
|
HOW
DID THE FUND PERFORM LAST YEAR AND WHAT AFFECTED ITS PERFORMANCE?
For the twelve months ended February
28, 2026, Class A1 shares of
Franklin Colorado Tax-Free Income Fund returned 4.27%.
The Fund compares its performance
to the Bloomberg Municipal Bond Index, which returned 4.96% for the same period.
PERFORMANCE
HIGHLIGHTS
|
Top
contributors to performance: | |
|
↑
|
Overweight
to bonds with no external credit rating |
|
↑
|
Overweight
to bonds with 20 years to maturity |
|
↑
|
Security
selection in BBB rated bonds |
|
Top
detractors from performance: | |
|
↓
|
Underweight
to bonds with two, five and 10 years to maturity |
|
↓
|
Security
selection in AA rated bonds |
|
↓
|
Overweight
to bonds with 30 years to maturity |

AVERAGE
ANNUAL TOTAL RETURNS (%) Period
Ended February 28, 2026
|
|
1
Year |
5
Year |
10
Year |
|
Class
A1 |
4.27
|
1.10
|
1.93
|
|
Class
A1 (with sales charge) |
0.38
|
0.33
|
1.54
|
|
Bloomberg
Municipal Bond Index |
4.96
|
1.44
|
2.43
|
For current month-end performance,
please call Franklin Templeton at (800)
DIAL BEN/342-5236 or visit
https://www.franklintempleton.com/investments/options/mutual-funds.
https://www.franklintempleton.com/investments/options/mutual-funds.
Important data provider notices
and terms available at www.franklintempletondatasources.com.
KEY
FUND STATISTICS (as
of February 28, 2026)
|
Total
Net Assets |
$496,980,852
|
|
Total
Number of Portfolio Holdings |
184
|
|
Total
Management Fee Paid |
$2,433,149
|
|
Portfolio
Turnover Rate |
11.43%
|
WHAT
DID THE FUND INVEST IN? (as
of February 28, 2026)
Portfolio Composition*
(% of Total Investments)

WHAT
WERE THE FUND COSTS FOR THE LAST YEAR? (based
on a hypothetical $10,000 investment)
|
Class
Name |
Costs
of a $10,000 investment
|
Costs
paid as a percentage of a $10,000
investment*
|
|
Class
C |
$128
|
1.26%
|
HOW
DID THE FUND PERFORM LAST YEAR AND WHAT AFFECTED ITS PERFORMANCE?
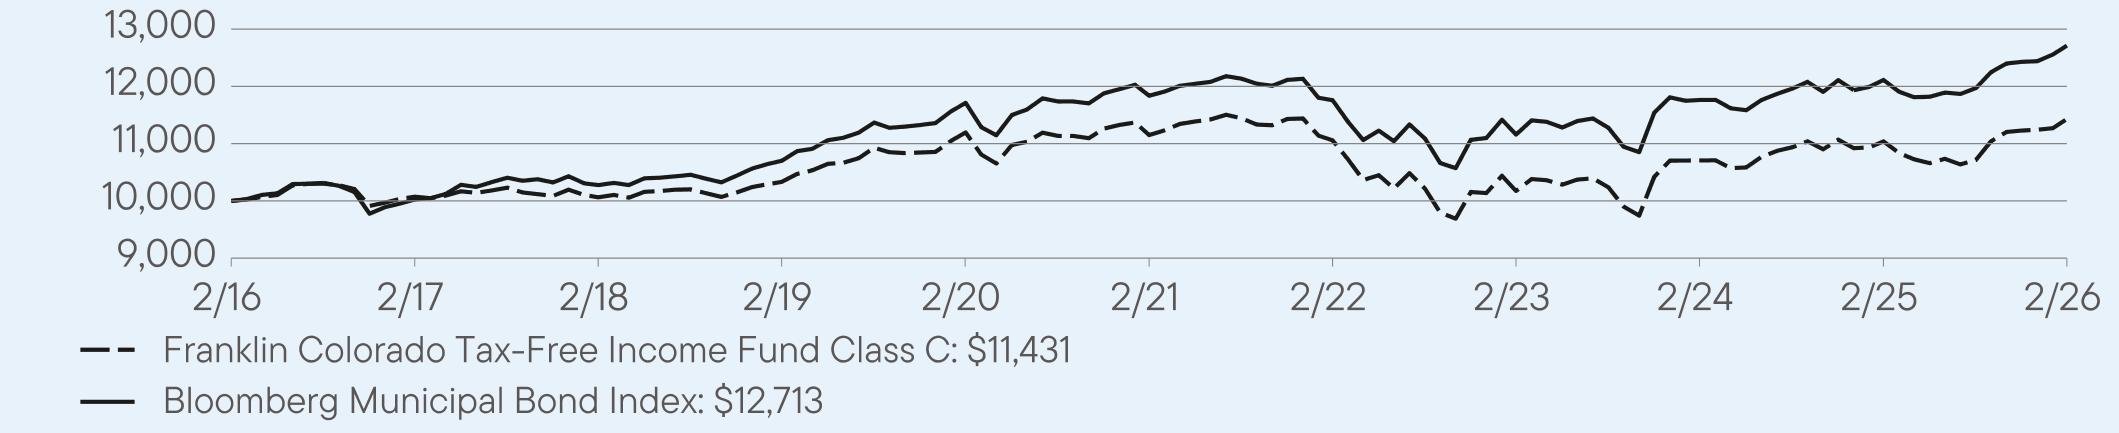
For the twelve months ended February
28, 2026, Class C shares of
Franklin Colorado Tax-Free Income Fund returned 3.55%.
The Fund compares its performance
to the Bloomberg Municipal Bond Index, which returned 4.96% for the same period.
PERFORMANCE
HIGHLIGHTS
|
Top
contributors to performance: | |
|
↑
|
Overweight
to bonds with no external credit rating |
|
↑
|
Overweight
to bonds with 20 years to maturity |
|
↑
|
Security
selection in BBB rated bonds |
|
Top
detractors from performance: | |
|
↓
|
Underweight
to bonds with two, five and 10 years to maturity |
|
↓
|
Security
selection in AA rated bonds |
|
↓
|
Overweight
to bonds with 30 years to maturity |
AVERAGE
ANNUAL TOTAL RETURNS (%) Period
Ended February 28, 2026
|
|
1
Year |
5
Year |
10
Year |
|
Class
C |
3.55
|
0.50
|
1.35
|
|
Class
C (with sales charge) |
2.55
|
0.50
|
1.35
|
|
Bloomberg
Municipal Bond Index |
4.96
|
1.44
|
2.43
|
For current month-end performance,
please call Franklin Templeton at (800)
DIAL BEN/342-5236 or visit
https://www.franklintempleton.com/investments/options/mutual-funds.
https://www.franklintempleton.com/investments/options/mutual-funds.
Important data provider notices
and terms available at www.franklintempletondatasources.com.
KEY
FUND STATISTICS (as
of February 28, 2026)
|
Total
Net Assets |
$496,980,852
|
|
Total
Number of Portfolio Holdings |
184
|
|
Total
Management Fee Paid |
$2,433,149
|
|
Portfolio
Turnover Rate |
11.43%
|
WHAT
DID THE FUND INVEST IN? (as
of February 28, 2026)
Portfolio Composition*
(% of Total Investments)

WHAT
WERE THE FUND COSTS FOR THE LAST YEAR? (based
on a hypothetical $10,000 investment)
|
Class
Name |
Costs
of a $10,000 investment
|
Costs
paid as a percentage of a $10,000
investment*
|
|
Class
R6 |
$59
|
0.58%
|
HOW
DID THE FUND PERFORM LAST YEAR AND WHAT AFFECTED ITS PERFORMANCE?
For the twelve months ended February
28, 2026, Class R6 shares of
Franklin Colorado Tax-Free Income Fund returned 4.42%.
The Fund compares its performance
to the Bloomberg Municipal Bond Index, which returned 4.96% for the same period.
PERFORMANCE
HIGHLIGHTS
|
Top
contributors to performance: | |
|
↑
|
Overweight
to bonds with no external credit rating |
|
↑
|
Overweight
to bonds with 20 years to maturity |
|
↑
|
Security
selection in BBB rated bonds |
|
Top
detractors from performance: | |
|
↓
|
Underweight
to bonds with two, five and 10 years to maturity |
|
↓
|
Security
selection in AA rated bonds |
|
↓
|
Overweight
to bonds with 30 years to maturity |

AVERAGE
ANNUAL TOTAL RETURNS (%) Period
Ended February 28, 2026
|
|
1
Year |
5
Year |
10
Year |
|
Class
R6 |
4.42
|
1.25
|
2.07
|
|
Bloomberg
Municipal Bond Index |
4.96
|
1.44
|
2.43
|
For current month-end performance,
please call Franklin Templeton at (800)
DIAL BEN/342-5236 or visit
https://www.franklintempleton.com/investments/options/mutual-funds.
https://www.franklintempleton.com/investments/options/mutual-funds.
Important data provider notices
and terms available at www.franklintempletondatasources.com.
KEY
FUND STATISTICS (as
of February 28, 2026)
|
Total
Net Assets |
$496,980,852
|
|
Total
Number of Portfolio Holdings |
184
|
|
Total
Management Fee Paid |
$2,433,149
|
|
Portfolio
Turnover Rate |
11.43%
|
WHAT
DID THE FUND INVEST IN? (as
of February 28, 2026)
Portfolio Composition*
(% of Total Investments)
WHAT
WERE THE FUND COSTS FOR THE LAST YEAR? (based
on a hypothetical $10,000 investment)
|
Class
Name |
Costs
of a $10,000 investment
|
Costs
paid as a percentage of a $10,000
investment*
|
|
Advisor
Class |
$63
|
0.62%
|
HOW
DID THE FUND PERFORM LAST YEAR AND WHAT AFFECTED ITS PERFORMANCE?
For the twelve months ended February
28, 2026, Advisor Class shares
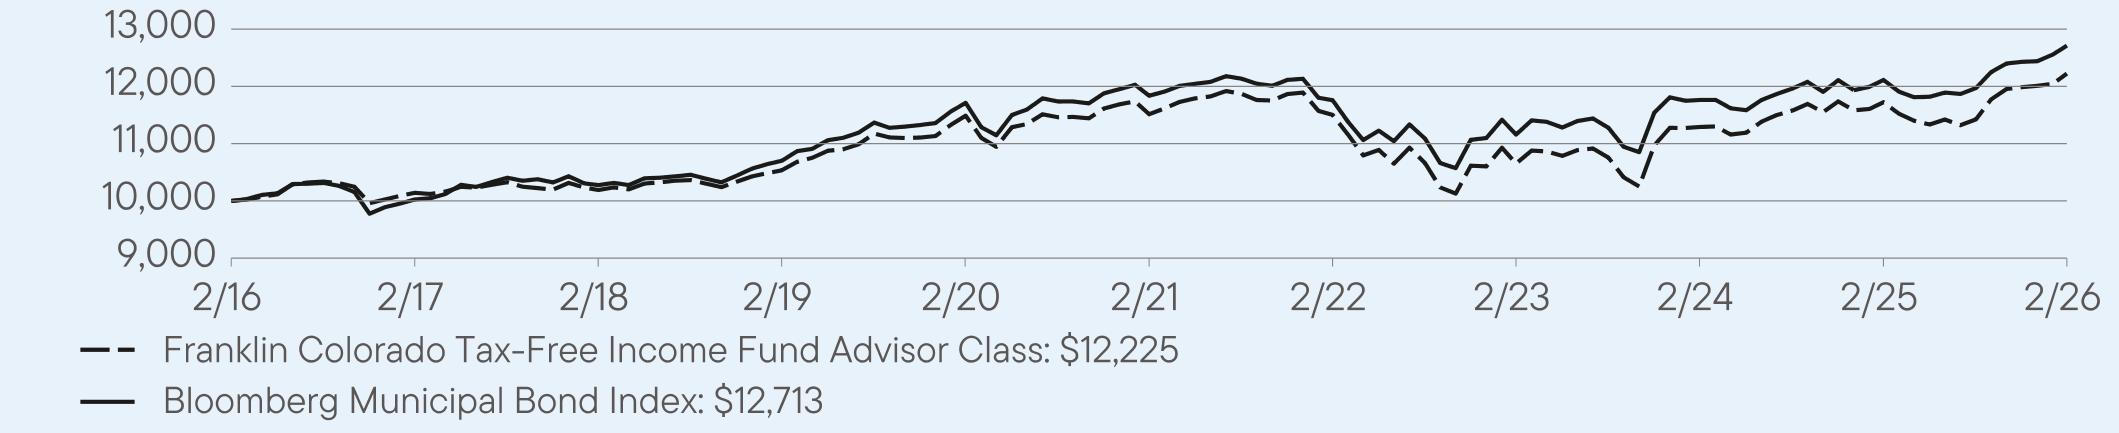
of Franklin Colorado Tax-Free Income Fund returned 4.28%.
The Fund compares its performance
to the Bloomberg Municipal Bond Index, which returned 4.96% for the same period.
PERFORMANCE
HIGHLIGHTS
|
Top
contributors to performance: | |
|
↑
|
Overweight
to bonds with no external credit rating |
|
↑
|
Overweight
to bonds with 20 years to maturity |
|
↑
|
Security
selection in BBB rated bonds |
|
Top
detractors from performance: | |
|
↓
|
Underweight
to bonds with two, five and 10 years to maturity |
|
↓
|
Security
selection in AA rated bonds |
|
↓
|
Overweight
to bonds with 30 years to maturity |
AVERAGE
ANNUAL TOTAL RETURNS (%) Period
Ended February 28, 2026
|
|
1
Year |
5
Year |
10
Year |
|
Advisor
Class |
4.28
|
1.20
|
2.03
|
|
Bloomberg
Municipal Bond Index |
4.96
|
1.44
|
2.43
|
For current month-end performance,
please call Franklin Templeton at (800)
DIAL BEN/342-5236 or visit
https://www.franklintempleton.com/investments/options/mutual-funds.
https://www.franklintempleton.com/investments/options/mutual-funds.
Important data provider notices
and terms available at www.franklintempletondatasources.com.
KEY
FUND STATISTICS (as
of February 28, 2026)
|
Total
Net Assets |
$496,980,852
|
|
Total
Number of Portfolio Holdings |
184
|
|
Total
Management Fee Paid |
$2,433,149
|
|
Portfolio
Turnover Rate |
11.43%
|
WHAT
DID THE FUND INVEST IN? (as
of February 28, 2026)
Portfolio Composition*
(% of Total Investments)

WHAT
WERE THE FUND COSTS FOR THE LAST YEAR? (based
on a hypothetical $10,000 investment)
|
Class
Name |
Costs
of a $10,000 investment
|
Costs
paid as a percentage of a $10,000
investment*
|
|
Class
A |
$92
|
0.90%
|
HOW
DID THE FUND PERFORM LAST YEAR AND WHAT AFFECTED ITS PERFORMANCE?
For the twelve months ended February
28, 2026, Class A shares of
Franklin Connecticut Tax-Free Income Fund returned 4.42%.
The Fund compares its performance
to the Bloomberg Municipal Bond Index, which returned 4.96% for the same period.
PERFORMANCE
HIGHLIGHTS
|
Top
contributors to performance: | |
|
↑
|
Overweight
to bonds with 10 years to maturity |
|
↑
|
Security
selection in A rated bonds |
|
↑
|
Security
selection in AAA rated bonds |
|
Top
detractors from performance: | |
|
↓
|
Underweight
to bonds with two and five years to maturity |
|
↓
|
Overweight
to bond with 20 years to maturity |
|
↓
|
Overweight
to BBB rated bonds |

AVERAGE
ANNUAL TOTAL RETURNS (%) Period
Ended February 28, 2026
|
|
1
Year |
5
Year |
10
Year |
|
Class
A |
4.42
|
0.73
|
1.42
|
|
Class
A (with sales charge) |
0.50
|
-0.04
|
1.03
|
|
Bloomberg
Municipal Bond Index |
4.96
|
1.44
|
2.43
|
For current month-end performance,
please call Franklin Templeton at (800)
DIAL BEN/342-5236 or visit
https://www.franklintempleton.com/investments/options/mutual-funds.
https://www.franklintempleton.com/investments/options/mutual-funds.
Important data provider notices
and terms available at www.franklintempletondatasources.com.
KEY
FUND STATISTICS (as
of February 28, 2026)
|
Total
Net Assets |
$161,019,582
|
|
Total
Number of Portfolio Holdings |
97
|
|
Total
Management Fee Paid |
$715,105
|
|
Portfolio
Turnover Rate |
10.75%
|
WHAT
DID THE FUND INVEST IN? (as
of February 28, 2026)
Portfolio Composition* (%
of Total Investments)

WHAT
WERE THE FUND COSTS FOR THE LAST YEAR? (based
on a hypothetical $10,000 investment)
|
Class
Name |
Costs
of a $10,000 investment
|
Costs
paid as a percentage of a $10,000
investment*
|
|
Class
A1 |
$77
|
0.75%
|
HOW
DID THE FUND PERFORM LAST YEAR AND WHAT AFFECTED ITS PERFORMANCE?
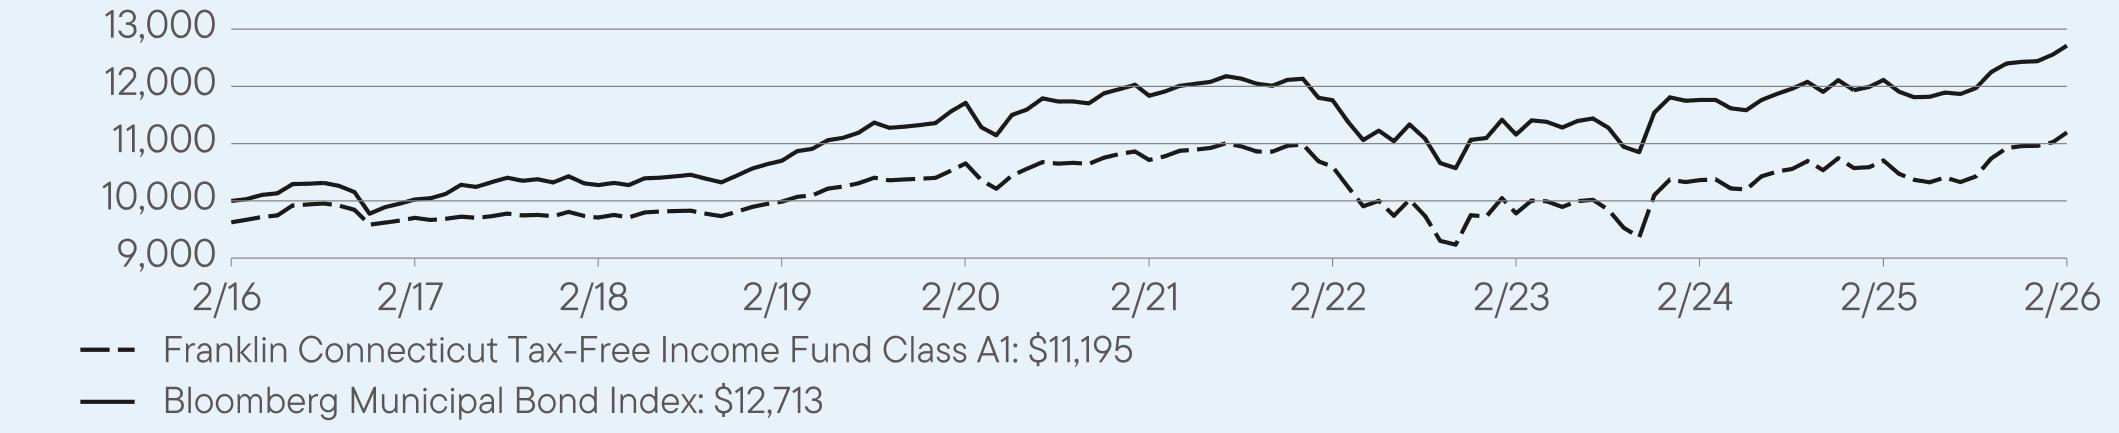
For the twelve months ended February
28, 2026, Class A1 shares of
Franklin Connecticut Tax-Free Income Fund returned 4.58%.
The Fund compares its performance
to the Bloomberg Municipal Bond Index, which returned 4.96% for the same period.
PERFORMANCE
HIGHLIGHTS
|
Top
contributors to performance: | |
|
↑
|
Overweight
to bonds with 10 years to maturity |
|
↑
|
Security
selection in A rated bonds |
|
↑
|
Security
selection in AAA rated bonds |
|
Top
detractors from performance: | |
|
↓
|
Underweight
to bonds with two and five years to maturity |
|
↓
|
Overweight
to bond with 20 years to maturity |
|
↓
|
Overweight
to BBB rated bonds |
AVERAGE
ANNUAL TOTAL RETURNS (%) Period
Ended February 28, 2026
|
|
1
Year |
5
Year |
10
Year |
|
Class
A1 |
4.58
|
0.88
|
1.52
|
|
Class
A1 (with sales charge) |
0.62
|
0.11
|
1.13
|
|
Bloomberg
Municipal Bond Index |
4.96
|
1.44
|
2.43
|
For current month-end performance,
please call Franklin Templeton at (800)
DIAL BEN/342-5236 or visit
https://www.franklintempleton.com/investments/options/mutual-funds.
https://www.franklintempleton.com/investments/options/mutual-funds.
Important data provider notices
and terms available at www.franklintempletondatasources.com.
KEY
FUND STATISTICS (as
of February 28, 2026)
|
Total
Net Assets |
$161,019,582
|
|
Total
Number of Portfolio Holdings |
97
|
|
Total
Management Fee Paid |
$715,105
|
|
Portfolio
Turnover Rate |
10.75%
|
WHAT
DID THE FUND INVEST IN? (as
of February 28, 2026)
Portfolio Composition* (%
of Total Investments)
WHAT
WERE THE FUND COSTS FOR THE LAST YEAR? (based
on a hypothetical $10,000 investment)
|
Class
Name |
Costs
of a $10,000 investment
|
Costs
paid as a percentage of a $10,000
investment*
|
|
Class
C |
$133
|
1.30%
|
HOW
DID THE FUND PERFORM LAST YEAR AND WHAT AFFECTED ITS PERFORMANCE?
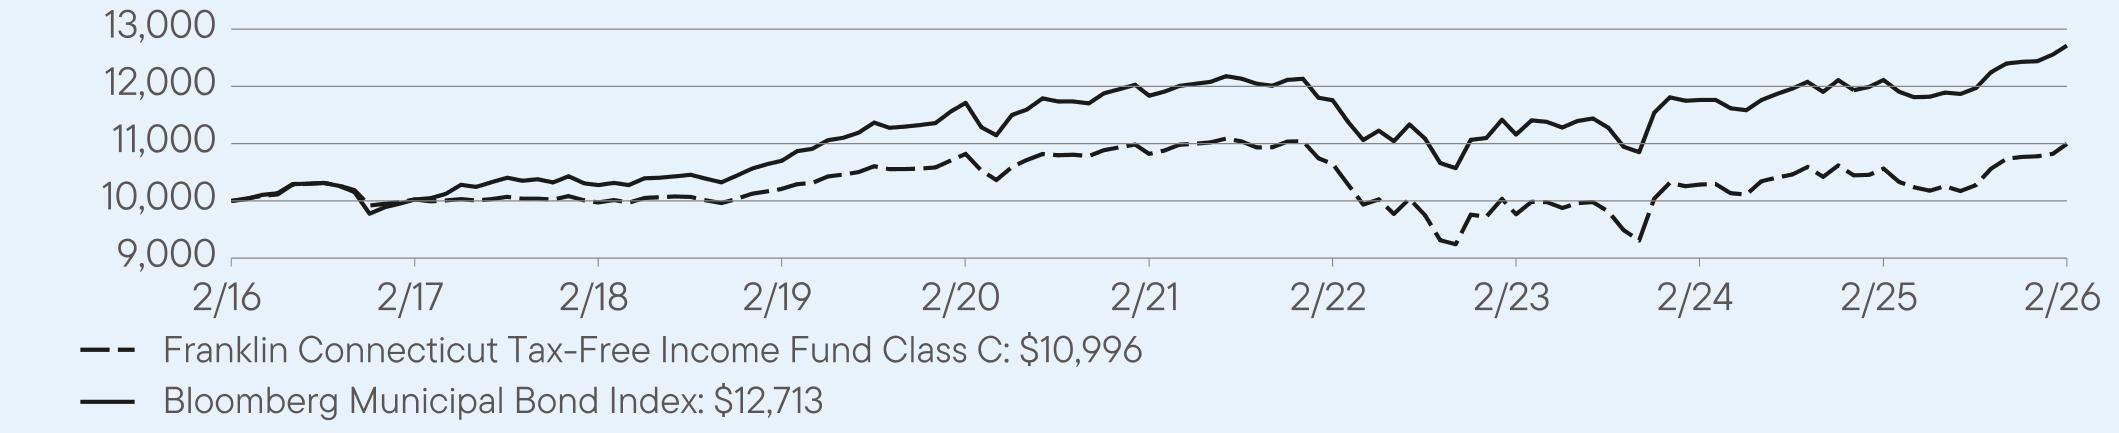
For the twelve months ended February
28, 2026, Class C shares of
Franklin Connecticut Tax-Free Income Fund returned 4.08%.
The Fund compares its performance
to the Bloomberg Municipal Bond Index, which returned 4.96% for the same period.
PERFORMANCE
HIGHLIGHTS
|
Top
contributors to performance: | |
|
↑
|
Overweight
to bonds with 10 years to maturity |
|
↑
|
Security
selection in A rated bonds |
|
↑
|
Security
selection in AAA rated bonds |
|
Top
detractors from performance: | |
|
↓
|
Underweight
to bonds with two and five years to maturity |
|
↓
|
Overweight
to bond with 20 years to maturity |
|
↓
|
Overweight
to BBB rated bonds |
AVERAGE
ANNUAL TOTAL RETURNS (%) Period
Ended February 28, 2026
|
|
1
Year |
5
Year |
10
Year |
|
Class
C |
4.08
|
0.32
|
0.96
|
|
Class
C (with sales charge) |
3.08
|
0.32
|
0.96
|
|
Bloomberg
Municipal Bond Index |
4.96
|
1.44
|
2.43
|
For current month-end performance,
please call Franklin Templeton at (800)
DIAL BEN/342-5236 or visit
https://www.franklintempleton.com/investments/options/mutual-funds.
https://www.franklintempleton.com/investments/options/mutual-funds.
Important data provider notices
and terms available at www.franklintempletondatasources.com.
KEY
FUND STATISTICS (as
of February 28, 2026)
|
Total
Net Assets |
$161,019,582
|
|
Total
Number of Portfolio Holdings |
97
|
|
Total
Management Fee Paid |
$715,105
|
|
Portfolio
Turnover Rate |
10.75%
|
WHAT
DID THE FUND INVEST IN? (as
of February 28, 2026)
Portfolio Composition* (%
of Total Investments)

WHAT
WERE THE FUND COSTS FOR THE LAST YEAR? (based
on a hypothetical $10,000 investment)
|
Class
Name |
Costs
of a $10,000 investment
|
Costs
paid as a percentage of a $10,000
investment*
|
|
Class
R6 |
$63
|
0.62%
|
HOW
DID THE FUND PERFORM LAST YEAR AND WHAT AFFECTED ITS PERFORMANCE?
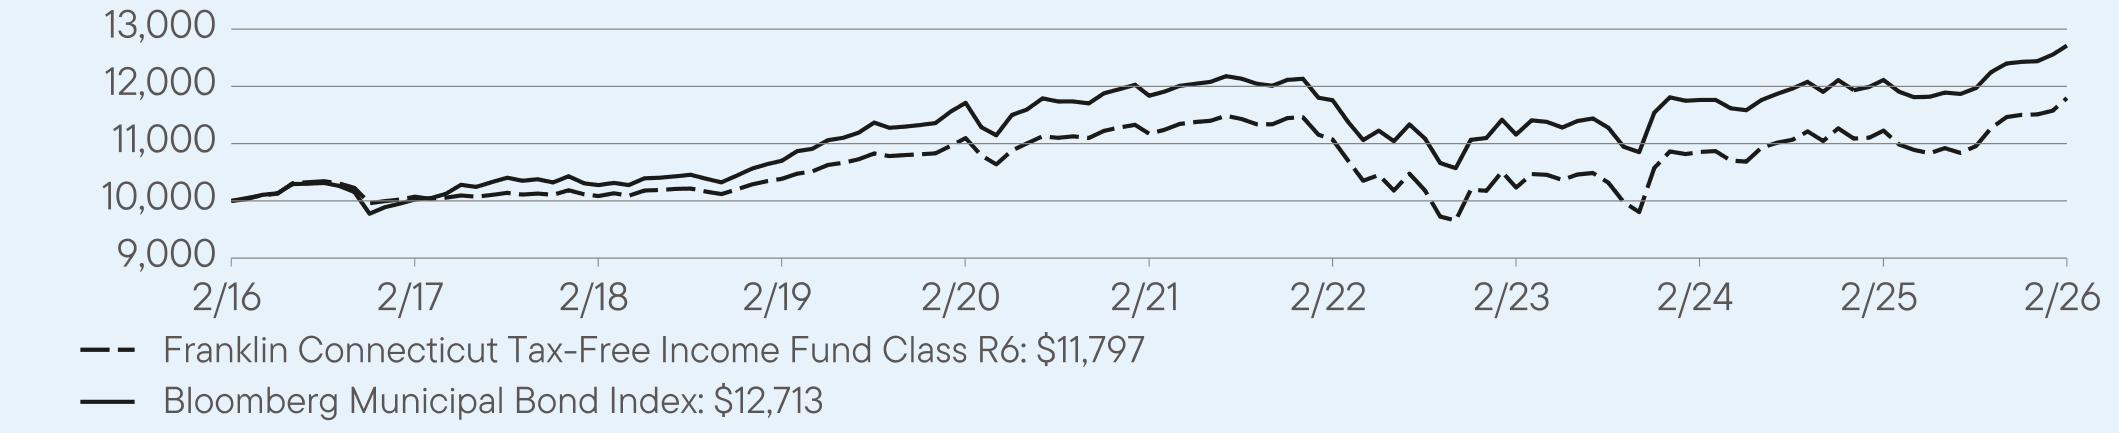
For the twelve months ended February
28, 2026, Class R6 shares of
Franklin Connecticut Tax-Free Income Fund returned 4.71%.
The Fund compares its performance
to the Bloomberg Municipal Bond Index, which returned 4.96% for the same period.
PERFORMANCE
HIGHLIGHTS
|
Top
contributors to performance: | |
|
↑
|
Overweight
to bonds with 10 years to maturity |
|
↑
|
Security
selection in A rated bonds |
|
↑
|
Security
selection in AAA rated bonds |
|
Top
detractors from performance: | |
|
↓
|
Underweight
to bonds with two and five years to maturity |
|
↓
|
Overweight
to bond with 20 years to maturity |
|
↓
|
Overweight
to BBB rated bonds |
AVERAGE
ANNUAL TOTAL RETURNS (%) Period
Ended February 28, 2026
|
|
1
Year |
5
Year |
10
Year |
|
Class
R6 |
4.71
|
1.02
|
1.67
|
|
Bloomberg
Municipal Bond Index |
4.96
|
1.44
|
2.43
|
For current month-end performance,
please call Franklin Templeton at (800)
DIAL BEN/342-5236 or visit
https://www.franklintempleton.com/investments/options/mutual-funds.
https://www.franklintempleton.com/investments/options/mutual-funds.
Important data provider notices
and terms available at www.franklintempletondatasources.com.
KEY
FUND STATISTICS (as
of February 28, 2026)
|
Total
Net Assets |
$161,019,582
|
|
Total
Number of Portfolio Holdings |
97
|
|
Total
Management Fee Paid |
$715,105
|
|
Portfolio
Turnover Rate |
10.75%
|
WHAT
DID THE FUND INVEST IN? (as
of February 28, 2026)
Portfolio Composition* (%
of Total Investments)

WHAT
WERE THE FUND COSTS FOR THE LAST YEAR? (based
on a hypothetical $10,000 investment)
|
Class
Name |
Costs
of a $10,000 investment
|
Costs
paid as a percentage of a $10,000
investment*
|
|
Advisor
Class |
$67
|
0.65%
|
HOW
DID THE FUND PERFORM LAST YEAR AND WHAT AFFECTED ITS PERFORMANCE?
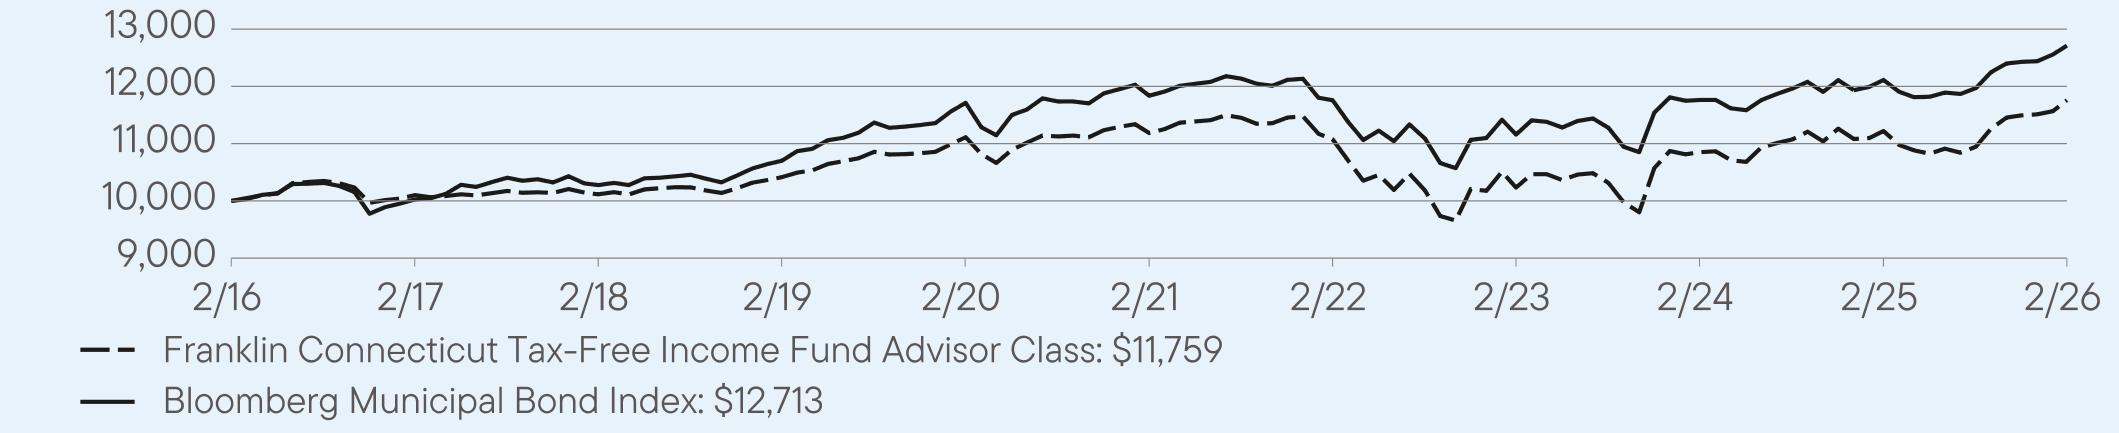
For the twelve months ended February
28, 2026, Advisor Class shares
of Franklin Connecticut Tax-Free Income Fund returned 4.80%.
The Fund compares its performance
to the Bloomberg Municipal Bond Index, which returned 4.96% for the same period.
PERFORMANCE
HIGHLIGHTS
|
Top
contributors to performance: | |
|
↑
|
Overweight
to bonds with 10 years to maturity |
|
↑
|
Security
selection in A rated bonds |
|
↑
|
Security
selection in AAA rated bonds |
|
Top
detractors from performance: | |
|
↓
|
Underweight
to bonds with two and five years to maturity |
|
↓
|
Overweight
to bond with 20 years to maturity |
|
↓
|
Overweight
to BBB rated bonds |
AVERAGE
ANNUAL TOTAL RETURNS (%) Period
Ended February 28, 2026
|
|
1
Year |
5
Year |
10
Year |
|
Advisor
Class |
4.80
|
1.00
|
1.64
|
|
Bloomberg
Municipal Bond Index |
4.96
|
1.44
|
2.43
|
For current month-end performance,
please call Franklin Templeton at (800)
DIAL BEN/342-5236 or visit
https://www.franklintempleton.com/investments/options/mutual-funds.
https://www.franklintempleton.com/investments/options/mutual-funds.
Important data provider notices
and terms available at www.franklintempletondatasources.com.
KEY
FUND STATISTICS (as
of February 28, 2026)
|
Total
Net Assets |
$161,019,582
|
|
Total
Number of Portfolio Holdings |
97
|
|
Total
Management Fee Paid |
$715,105
|
|
Portfolio
Turnover Rate |
10.75%
|
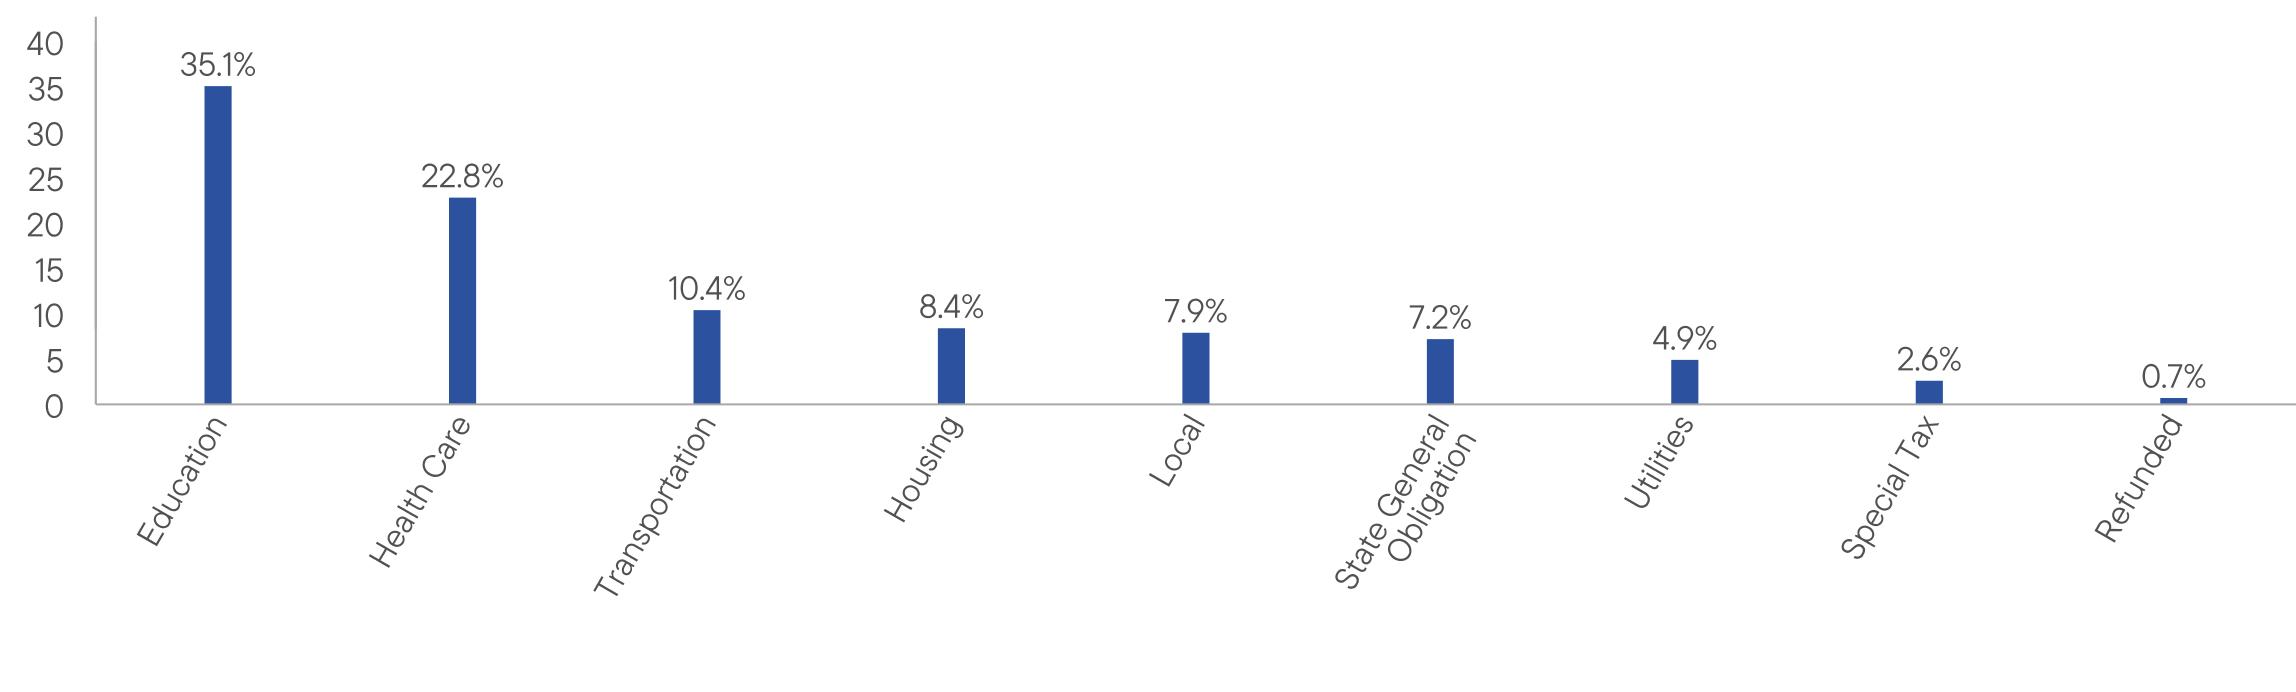
WHAT
DID THE FUND INVEST IN? (as
of February 28, 2026)
Portfolio Composition* (%
of Total Investments)

This report describes changes
to the Fund that occurred during the reporting period.
WHAT
WERE THE FUND COSTS FOR THE LAST YEAR? (based
on a hypothetical $10,000 investment)
|
Class
Name |
Costs
of a $10,000 investment
|
Costs
paid as a percentage of a $10,000
investment*
|
|
Class
A |
$73
|
0.71%
|
HOW
DID THE FUND PERFORM LAST YEAR AND WHAT AFFECTED ITS PERFORMANCE?
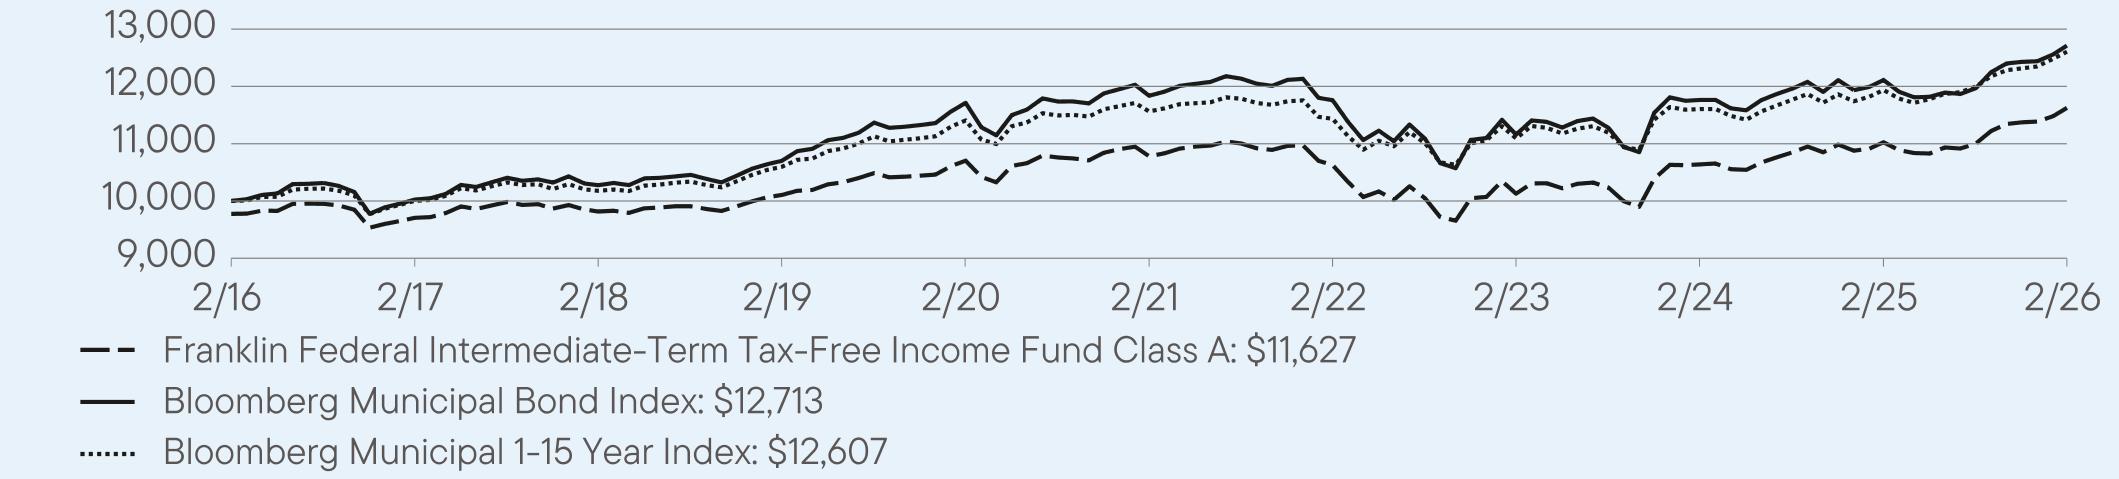
For the twelve months ended February
28, 2026, Class A shares of
Franklin Federal Intermediate-Term Tax-Free Income Fund returned
5.46%. The Fund compares
its performance to the Bloomberg Municipal 1-15 Year Index, which returned 5.61% for the same period.
PERFORMANCE
HIGHLIGHTS
|
Top
contributors to performance: | |
|
↑
|
Overweight
to bonds with 20 years to maturity |
|
↑
|
Overweight
to bonds with no external credit rating |
|
↑
|
Overweight
to BBB rated bonds |
|
Top
detractors from performance: | |
|
↓
|
Selection
in AA rated bonds |
|
↓
|
Underweight
to bonds with 10 years or less to maturity |
|
↓
|
Overweight
to bonds with 30 years to maturity |
AVERAGE
ANNUAL TOTAL RETURNS (%) Period
Ended February 28, 2026
|
|
1
Year |
5
Year |
10
Year |
|
Class
A |
5.46
|
1.52
|
1.76
|
|
Class
A (with sales charge) |
3.09
|
1.06
|
1.53
|
|
Bloomberg
Municipal Bond Index |
4.96
|
1.44
|
2.43
|
|
Bloomberg
Municipal 1-15 Year Index |
5.61
|
1.74
|
2.34
|
For current month-end performance,
please call Franklin Templeton at (800)
DIAL BEN/342-5236 or visit
https://www.franklintempleton.com/investments/options/mutual-funds.
https://www.franklintempleton.com/investments/options/mutual-funds.
Important data provider notices
and terms available at www.franklintempletondatasources.com.
KEY
FUND STATISTICS (as
of February 28, 2026)
|
Total
Net Assets |
$2,068,083,503
|
|
Total
Number of Portfolio Holdings |
576
|
|
Total
Management Fee Paid |
$6,949,299
|
|
Portfolio
Turnover Rate |
27.20%
|
WHAT
DID THE FUND INVEST IN? (as
of February 28, 2026)
Portfolio Composition*
(% of Total Investments)

HOW
HAS THE FUND CHANGED?
Effective on or about May 30,
2025, Paul M. Drury stepped down as a portfolio manager of the Fund.
This
is a summary of a change to the Fund since March
1, 2025. For
more complete information, you may review the Fund’s current prospectus
and any applicable supplements and the Fund’s next prospectus, which we expect to be available by July
1, 2026,
at https://www.franklintempleton.com/regulatory-fund-documents or upon request at (800) DIAL BEN/342-5236 or
prospectus.us.franklintempleton@fisglobal.com.
at https://www.franklintempleton.com/regulatory-fund-documents or upon request at (800) DIAL BEN/342-5236 or
prospectus.us.franklintempleton@fisglobal.com.
This report describes changes
to the Fund that occurred during the reporting period.
WHAT
WERE THE FUND COSTS FOR THE LAST YEAR? (based
on a hypothetical $10,000 investment)
|
Class
Name |
Costs
of a $10,000 investment
|
Costs
paid as a percentage of a $10,000
investment*
|
|
Class
A1 |
$58
|
0.56%
|
HOW
DID THE FUND PERFORM LAST YEAR AND WHAT AFFECTED ITS PERFORMANCE?
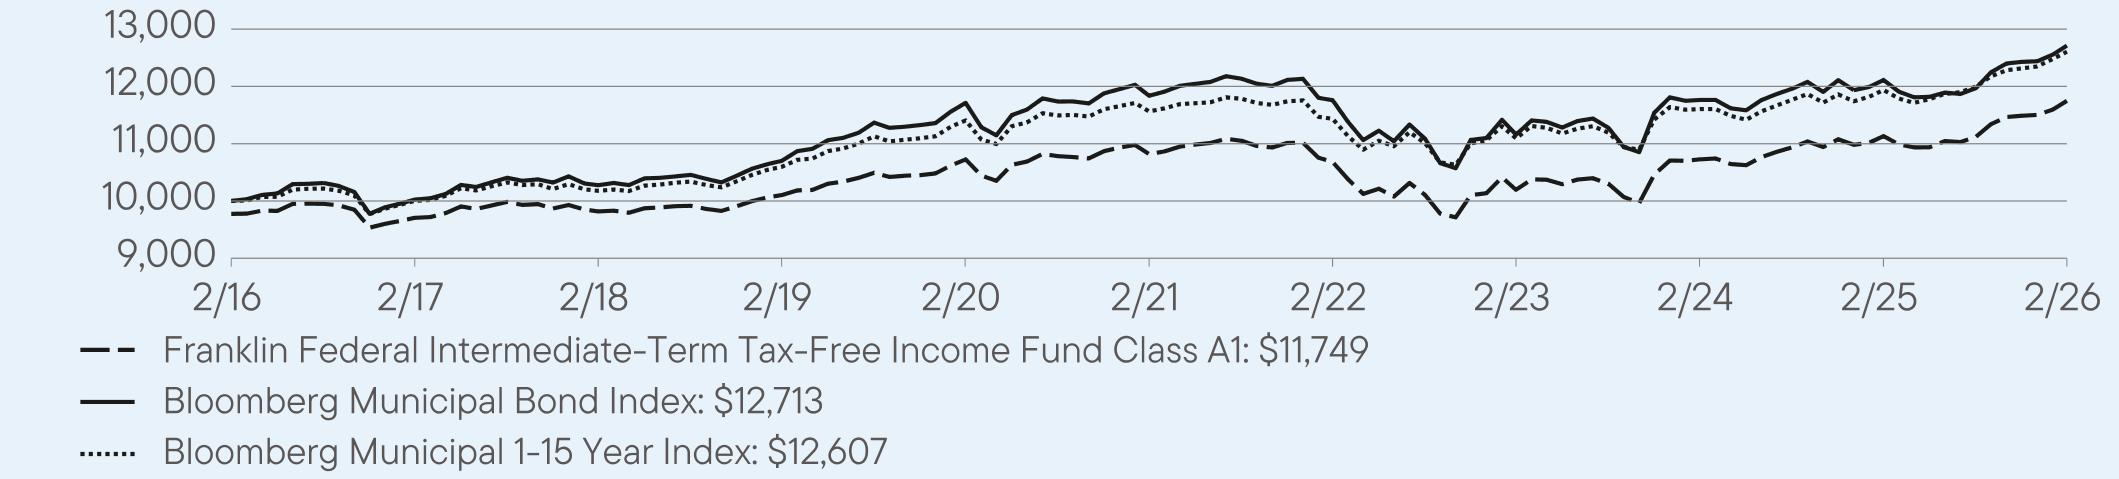
For the twelve months ended February
28, 2026, Class A1 shares of
Franklin Federal Intermediate-Term Tax-Free Income Fund returned
5.53%. The Fund compares
its performance to the Bloomberg Municipal 1-15 Year Index, which returned 5.61% for the same period.
PERFORMANCE
HIGHLIGHTS
|
Top
contributors to performance: | |
|
↑
|
Overweight
to bonds with 20 years to maturity |
|
↑
|
Overweight
to bonds with no external credit rating |
|
↑
|
Overweight
to BBB rated bonds |
|
Top
detractors from performance: | |
|
↓
|
Selection
in AA rated bonds |
|
↓
|
Underweight
to bonds with 10 years or less to maturity |
|
↓
|
Overweight
to bonds with 30 years to maturity |
AVERAGE
ANNUAL TOTAL RETURNS (%) Period
Ended February 28, 2026
|
|
1
Year |
5
Year |
10
Year |
|
Class
A1 |
5.53
|
1.66
|
1.86
|
|
Class
A1 (with sales charge) |
3.17
|
1.20
|
1.63
|
|
Bloomberg
Municipal Bond Index |
4.96
|
1.44
|
2.43
|
|
Bloomberg
Municipal 1-15 Year Index |
5.61
|
1.74
|
2.34
|
For current month-end performance,
please call Franklin Templeton at (800)
DIAL BEN/342-5236 or visit
https://www.franklintempleton.com/investments/options/mutual-funds.
https://www.franklintempleton.com/investments/options/mutual-funds.
Important data provider notices
and terms available at www.franklintempletondatasources.com.
KEY
FUND STATISTICS (as
of February 28, 2026)
|
Total
Net Assets |
$2,068,083,503
|
|
Total
Number of Portfolio Holdings |
576
|
|
Total
Management Fee Paid |
$6,949,299
|
|
Portfolio
Turnover Rate |
27.20%
|
WHAT
DID THE FUND INVEST IN? (as
of February 28, 2026)
Portfolio Composition*
(% of Total Investments)

HOW
HAS THE FUND CHANGED?
Effective on or about May 30,
2025, Paul M. Drury stepped down as a portfolio manager of the Fund.
This
is a summary of a change to the Fund since March
1, 2025. For
more complete information, you may review the Fund’s current prospectus
and any applicable supplements and the Fund’s next prospectus, which we expect to be available by July
1, 2026,
at https://www.franklintempleton.com/regulatory-fund-documents or upon request at (800) DIAL BEN/342-5236 or
prospectus.us.franklintempleton@fisglobal.com.
at https://www.franklintempleton.com/regulatory-fund-documents or upon request at (800) DIAL BEN/342-5236 or
prospectus.us.franklintempleton@fisglobal.com.
This report describes changes
to the Fund that occurred during the reporting period.
WHAT
WERE THE FUND COSTS FOR THE LAST YEAR? (based
on a hypothetical $10,000 investment)
|
Class
Name |
Costs
of a $10,000 investment
|
Costs
paid as a percentage of a $10,000
investment*
|
|
Class
C |
$114
|
1.11%
|
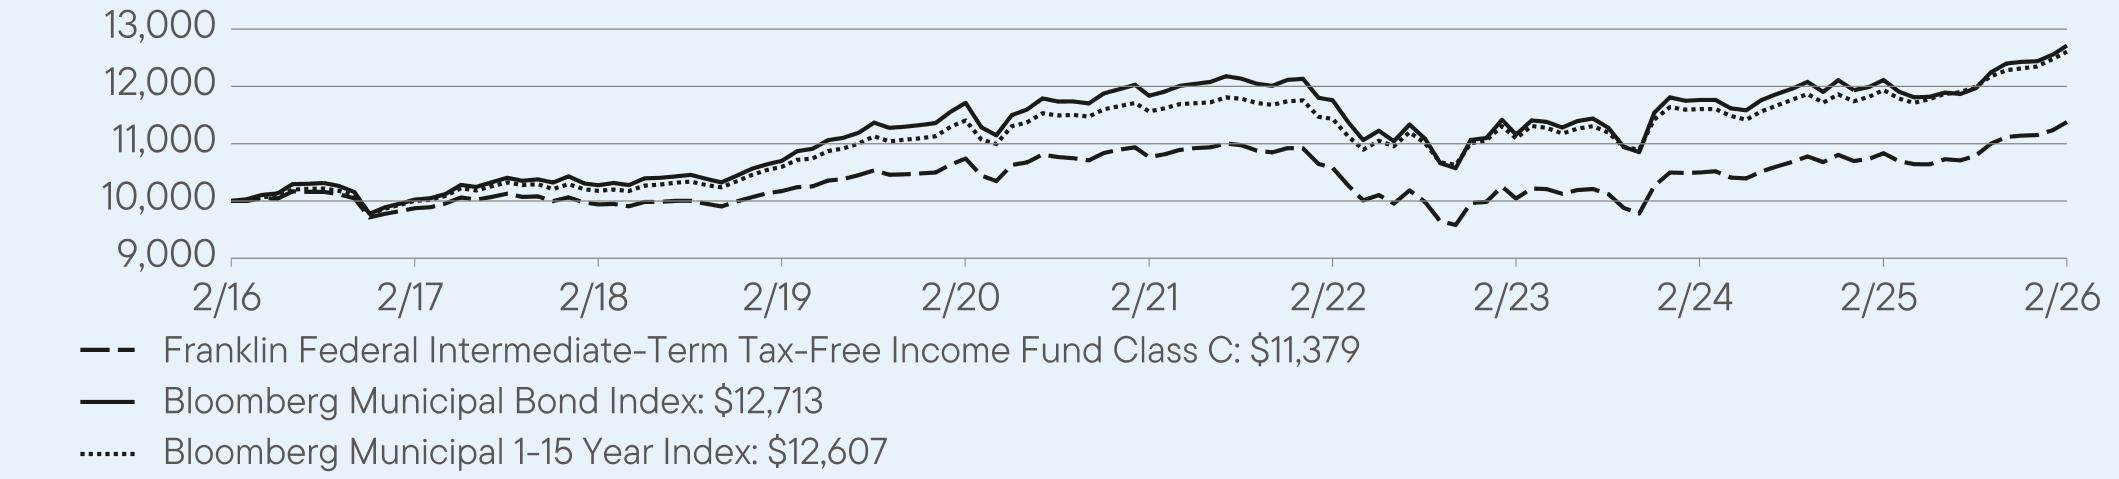
HOW
DID THE FUND PERFORM LAST YEAR AND WHAT AFFECTED ITS PERFORMANCE?
For the twelve months ended February
28, 2026, Class C shares of
Franklin Federal Intermediate-Term Tax-Free Income Fund returned
5.03%. The Fund compares
its performance to the Bloomberg Municipal 1-15 Year Index, which returned 5.61% for the same period.
PERFORMANCE
HIGHLIGHTS
|
Top
contributors to performance: | |
|
↑
|
Overweight
to bonds with 20 years to maturity |
|
↑
|
Overweight
to bonds with no external credit rating |
|
↑
|
Overweight
to BBB rated bonds |
|
Top
detractors from performance: | |
|
↓
|
Selection
in AA rated bonds |
|
↓
|
Underweight
to bonds with 10 years or less to maturity |
|
↓
|
Overweight
to bonds with 30 years to maturity |
AVERAGE
ANNUAL TOTAL RETURNS (%) Period
Ended February 28, 2026
|
|
1
Year |
5
Year |
10
Year |
|
Class
C |
5.03
|
1.11
|
1.30
|
|
Class
C (with sales charge) |
4.03
|
1.11
|
1.30
|
|
Bloomberg
Municipal Bond Index |
4.96
|
1.44
|
2.43
|
|
Bloomberg
Municipal 1-15 Year Index |
5.61
|
1.74
|
2.34
|
For current month-end performance,
please call Franklin Templeton at (800)
DIAL BEN/342-5236 or visit
https://www.franklintempleton.com/investments/options/mutual-funds.
https://www.franklintempleton.com/investments/options/mutual-funds.
Important data provider notices
and terms available at www.franklintempletondatasources.com.
KEY
FUND STATISTICS (as
of February 28, 2026)
|
Total
Net Assets |
$2,068,083,503
|
|
Total
Number of Portfolio Holdings |
576
|
|
Total
Management Fee Paid |
$6,949,299
|
|
Portfolio
Turnover Rate |
27.20%
|
WHAT
DID THE FUND INVEST IN? (as
of February 28, 2026)
Portfolio Composition*
(% of Total Investments)

HOW
HAS THE FUND CHANGED?
Effective on or about May 30,
2025, Paul M. Drury stepped down as a portfolio manager of the Fund.
This
is a summary of a change to the Fund since March
1, 2025. For
more complete information, you may review the Fund’s current prospectus
and any applicable supplements and the Fund’s next prospectus, which we expect to be available by July
1, 2026,
at https://www.franklintempleton.com/regulatory-fund-documents or upon request at (800) DIAL BEN/342-5236 or
prospectus.us.franklintempleton@fisglobal.com.
at https://www.franklintempleton.com/regulatory-fund-documents or upon request at (800) DIAL BEN/342-5236 or
prospectus.us.franklintempleton@fisglobal.com.
This report describes changes
to the Fund that occurred during the reporting period.
WHAT
WERE THE FUND COSTS FOR THE LAST YEAR? (based
on a hypothetical $10,000 investment)
|
Class
Name |
Costs
of a $10,000 investment
|
Costs
paid as a percentage of a $10,000
investment*
|
|
Class
R6 |
$41
|
0.40%
|
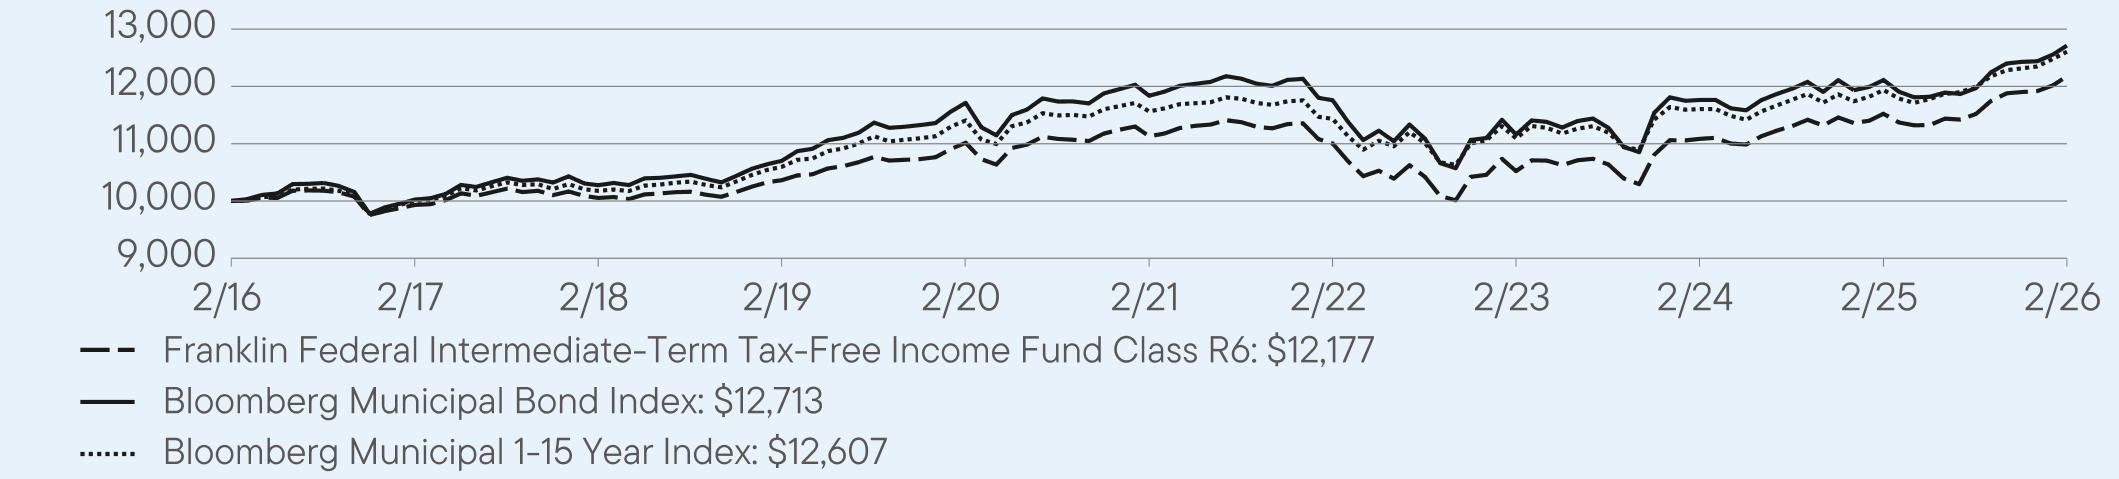
HOW
DID THE FUND PERFORM LAST YEAR AND WHAT AFFECTED ITS PERFORMANCE?
For the twelve months ended February
28, 2026, Class R6 shares of
Franklin Federal Intermediate-Term Tax-Free Income Fund returned
5.69%. The Fund compares
its performance to the Bloomberg Municipal 1-15 Year Index, which returned 5.61% for the same period.
PERFORMANCE
HIGHLIGHTS
|
Top
contributors to performance: | |
|
↑
|
Overweight
to bonds with 20 years to maturity |
|
↑
|
Overweight
to bonds with no external credit rating |
|
↑
|
Overweight
to BBB rated bonds |
|
Top
detractors from performance: | |
|
↓
|
Selection
in AA rated bonds |
|
↓
|
Underweight
to bonds with 10 years or less to maturity |
|
↓
|
Overweight
to bonds with 30 years to maturity |
AVERAGE
ANNUAL TOTAL RETURNS (%) Period
Ended February 28, 2026
|
|
1
Year |
5
Year |
10
Year |
|
Class
R6 |
5.69
|
1.81
|
2.01
|
|
Bloomberg
Municipal Bond Index |
4.96
|
1.44
|
2.43
|
|
Bloomberg
Municipal 1-15 Year Index |
5.61
|
1.74
|
2.34
|
For current month-end performance,
please call Franklin Templeton at (800)
DIAL BEN/342-5236 or visit
https://www.franklintempleton.com/investments/options/mutual-funds.
https://www.franklintempleton.com/investments/options/mutual-funds.
Important data provider notices
and terms available at www.franklintempletondatasources.com.
KEY
FUND STATISTICS (as
of February 28, 2026)
|
Total
Net Assets |
$2,068,083,503
|
|
Total
Number of Portfolio Holdings |
576
|
|
Total
Management Fee Paid |
$6,949,299
|
|
Portfolio
Turnover Rate |
27.20%
|
WHAT
DID THE FUND INVEST IN? (as
of February 28, 2026)
Portfolio Composition*
(% of Total Investments)

HOW
HAS THE FUND CHANGED?
Effective on or about May 30,
2025, Paul M. Drury stepped down as a portfolio manager of the Fund.
This
is a summary of a change to the Fund since March
1, 2025. For
more complete information, you may review the Fund’s current prospectus
and any applicable supplements and the Fund’s next prospectus, which we expect to be available by July
1, 2026,
at https://www.franklintempleton.com/regulatory-fund-documents or upon request at (800) DIAL BEN/342-5236 or
prospectus.us.franklintempleton@fisglobal.com.
at https://www.franklintempleton.com/regulatory-fund-documents or upon request at (800) DIAL BEN/342-5236 or
prospectus.us.franklintempleton@fisglobal.com.
This report describes changes
to the Fund that occurred during the reporting period.
WHAT
WERE THE FUND COSTS FOR THE LAST YEAR? (based
on a hypothetical $10,000 investment)
|
Class
Name |
Costs
of a $10,000 investment
|
Costs
paid as a percentage of a $10,000
investment*
|
|
Advisor
Class |
$47
|
0.46%
|
HOW
DID THE FUND PERFORM LAST YEAR AND WHAT AFFECTED ITS PERFORMANCE?
For the twelve months ended February
28, 2026, Advisor Class shares
of Franklin Federal Intermediate-Term Tax-Free Income Fund returned
5.62%. The Fund compares
its performance to the Bloomberg Municipal 1-15 Year Index, which returned 5.61% for the same period.
PERFORMANCE
HIGHLIGHTS
|
Top
contributors to performance: | |
|
↑
|
Overweight
to bonds with 20 years to maturity |
|
↑
|
Overweight
to bonds with no external credit rating |
|
↑
|
Overweight
to BBB rated bonds |
|
Top
detractors from performance: | |
|
↓
|
Selection
in AA rated bonds |
|
↓
|
Underweight
to bonds with 10 years or less to maturity |
|
↓
|
Overweight
to bonds with 30 years to maturity |

AVERAGE
ANNUAL TOTAL RETURNS (%) Period
Ended February 28, 2026
|
|
1
Year |
5
Year |
10
Year |
|
Advisor
Class |
5.62
|
1.76
|
1.96
|
|
Bloomberg
Municipal Bond Index |
4.96
|
1.44
|
2.43
|
|
Bloomberg
Municipal 1-15 Year Index |
5.61
|
1.74
|
2.34
|
For current month-end performance,
please call Franklin Templeton at (800)
DIAL BEN/342-5236 or visit
https://www.franklintempleton.com/investments/options/mutual-funds.
https://www.franklintempleton.com/investments/options/mutual-funds.
Important data provider notices
and terms available at www.franklintempletondatasources.com.
KEY
FUND STATISTICS (as
of February 28, 2026)
|
Total
Net Assets |
$2,068,083,503
|
|
Total
Number of Portfolio Holdings |
576
|
|
Total
Management Fee Paid |
$6,949,299
|
|
Portfolio
Turnover Rate |
27.20%
|
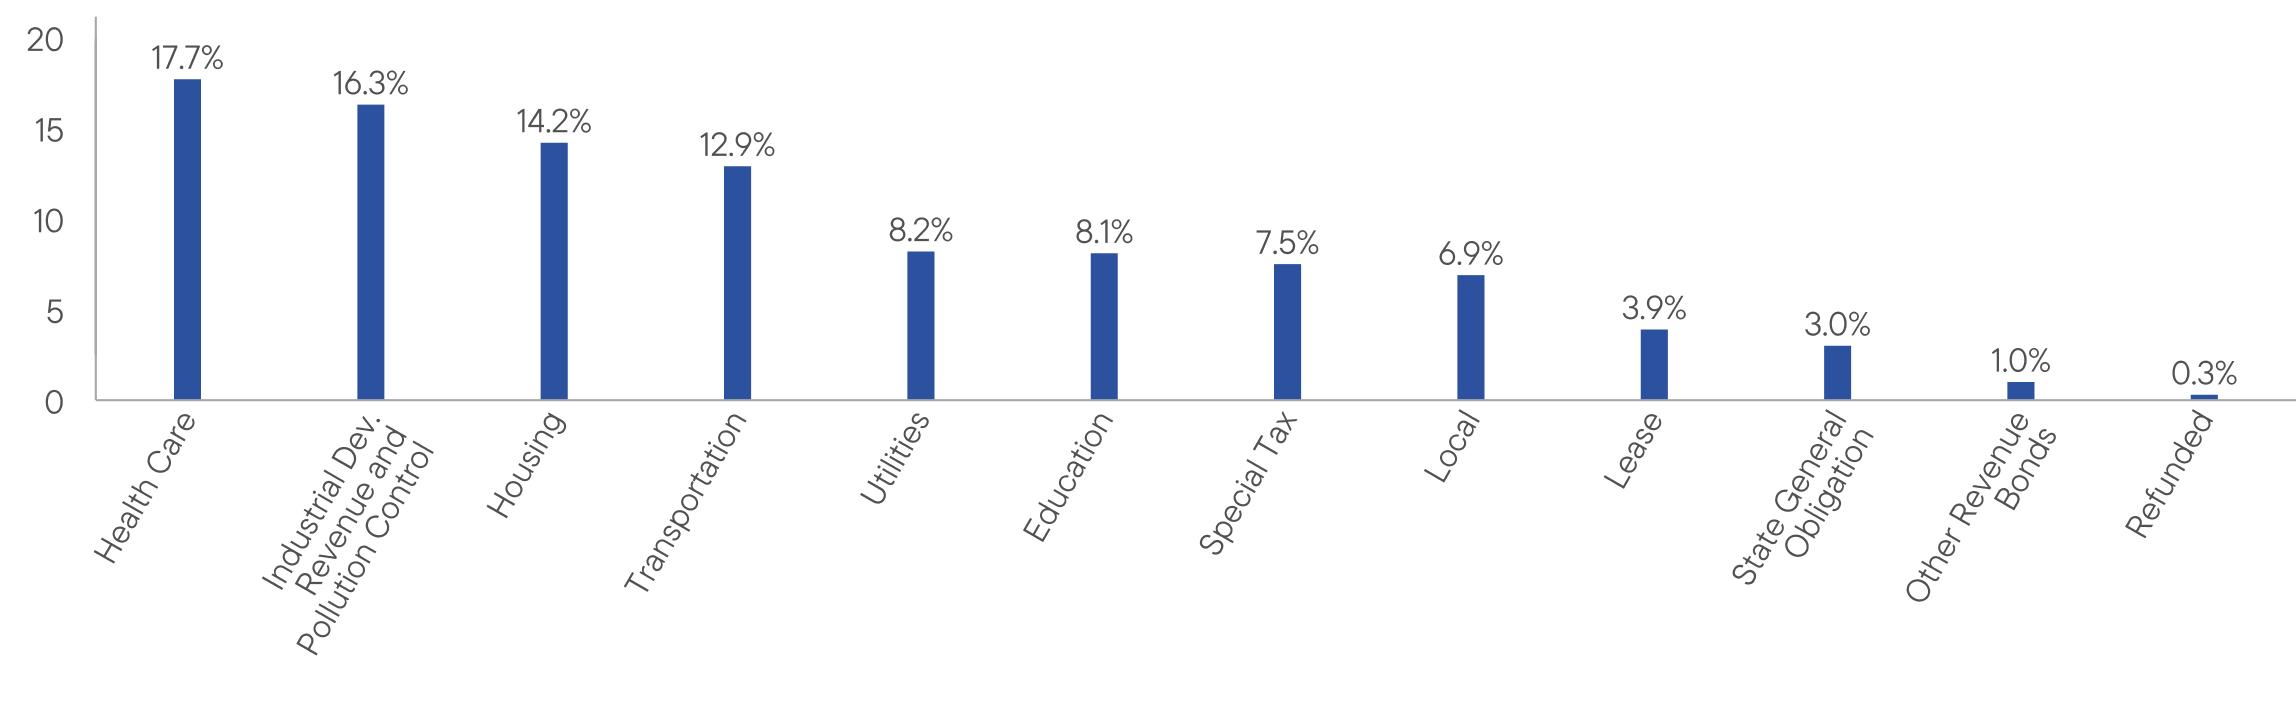
WHAT
DID THE FUND INVEST IN? (as
of February 28, 2026)
Portfolio Composition*
(% of Total Investments)
HOW
HAS THE FUND CHANGED?
Effective on or about May 30,
2025, Paul M. Drury stepped down as a portfolio manager of the Fund.
This
is a summary of a change to the Fund since March
1, 2025. For
more complete information, you may review the Fund’s current prospectus
and any applicable supplements and the Fund’s next prospectus, which we expect to be available by July
1, 2026,
at https://www.franklintempleton.com/regulatory-fund-documents or upon request at (800) DIAL BEN/342-5236 or
prospectus.us.franklintempleton@fisglobal.com.
at https://www.franklintempleton.com/regulatory-fund-documents or upon request at (800) DIAL BEN/342-5236 or
prospectus.us.franklintempleton@fisglobal.com.
This report describes changes
to the Fund that occurred during the reporting period.
WHAT
WERE THE FUND COSTS FOR THE LAST YEAR? (based
on a hypothetical $10,000 investment)
|
Class
Name |
Costs
of a $10,000 investment
|
Costs
paid as a percentage of a $10,000
investment*
|
|
Class
A |
$66
|
0.65%
|
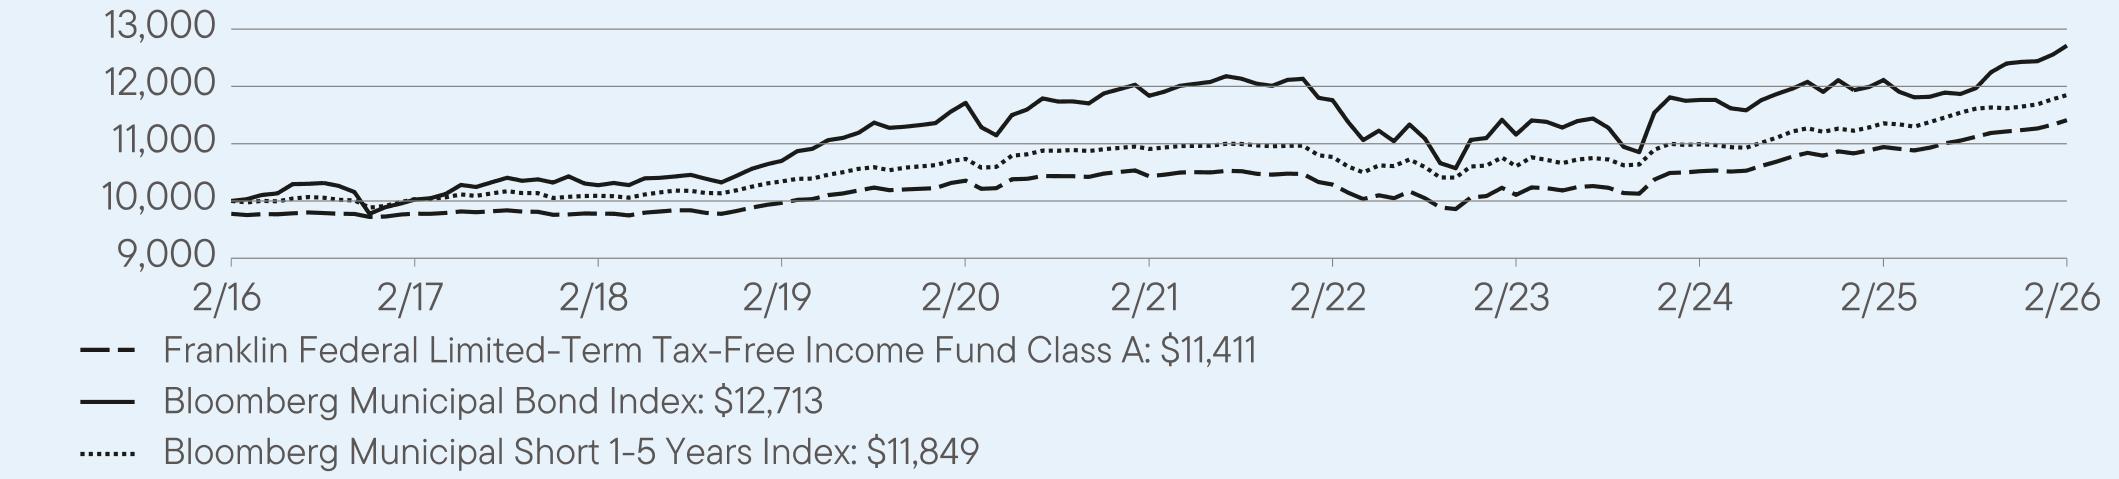
HOW
DID THE FUND PERFORM LAST YEAR AND WHAT AFFECTED ITS PERFORMANCE?
For the twelve months ended February
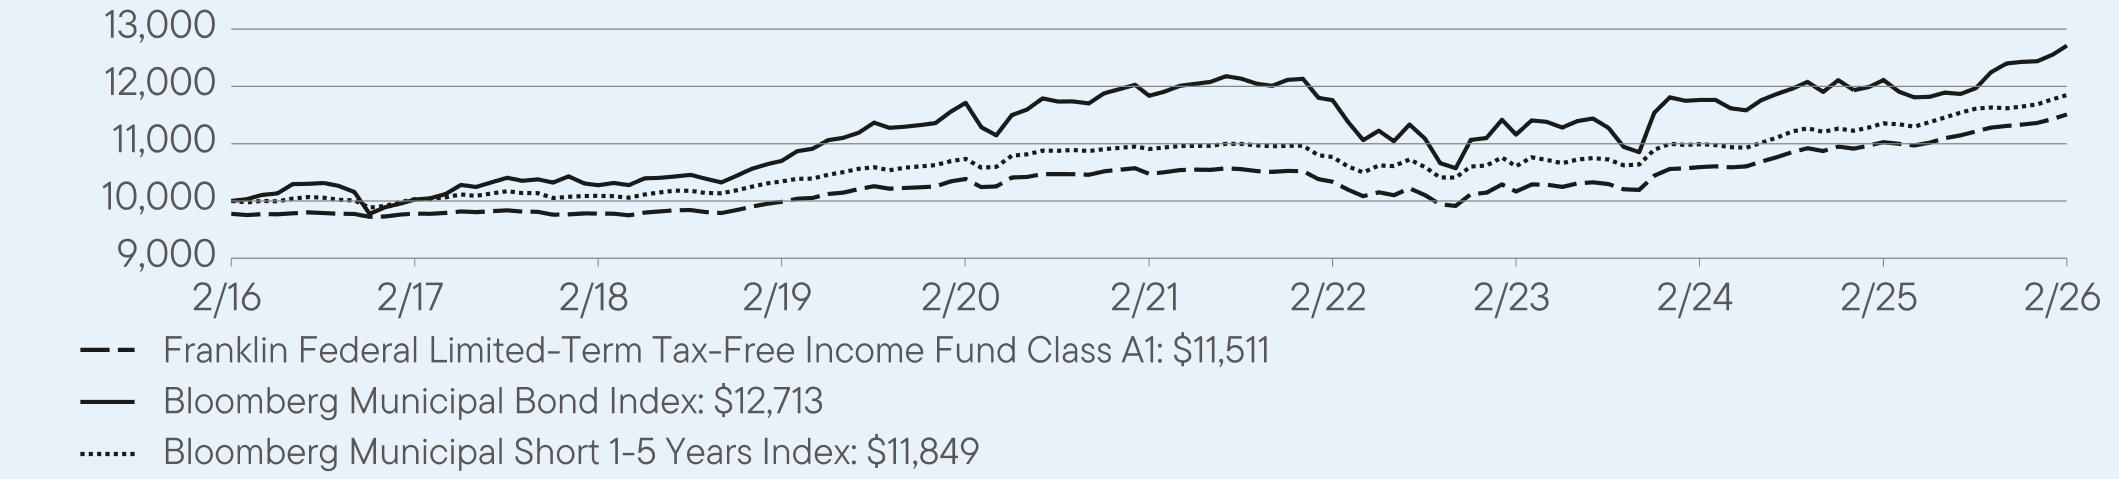
28, 2026, Class A shares of
Franklin Federal Limited-Term Tax-Free Income Fund returned 4.29%.
The Fund compares its performance to the Bloomberg Municipal Short 1-5 Years Index, which returned 4.35% for the same period.
PERFORMANCE
HIGHLIGHTS
|
Top
contributors to performance: | |
|
↑
|
Overweight
to bonds with 10 years to maturity |
|
↑
|
Overweight
to bonds with no external credit rating |
|
↑
|
Selection
in BBB rated bonds |
|
Top
detractors from performance: | |
|
↓
|
Underweight
to bonds with two and five years to maturity |
|
↓
|
Selection
in A rated bonds |
|
↓
|
Overweight
to bonds with 20 or more years to maturity |
AVERAGE
ANNUAL TOTAL RETURNS (%) Period
Ended February 28, 2026
|
|
1
Year |
5
Year |
10
Year |
|
Class
A |
4.29
|
1.81
|
1.56
|
|
Class
A (with sales charge) |
1.95
|
1.35
|
1.33
|
|
Bloomberg
Municipal Bond Index |
4.96
|
1.44
|
2.43
|
|
Bloomberg
Municipal Short 1-5 Years Index |
4.35
|
1.67
|
1.71
|
For current month-end performance,
please call Franklin Templeton at (800)
DIAL BEN/342-5236 or visit
https://www.franklintempleton.com/investments/options/mutual-funds.
https://www.franklintempleton.com/investments/options/mutual-funds.
Important data provider notices
and terms available at www.franklintempletondatasources.com.
KEY
FUND STATISTICS (as
of February 28, 2026)
|
Total
Net Assets |
$885,797,276
|
|
Total
Number of Portfolio Holdings |
360
|
|
Total
Management Fee Paid |
$2,383,342
|
|
Portfolio
Turnover Rate |
33.07%
|
WHAT
DID THE FUND INVEST IN? (as
of February 28, 2026)
Portfolio Composition*
(% of Total Investments)

HOW
HAS THE FUND CHANGED?
Effective January 31, 2026, Garrett
L. Hamilton was added as a portfolio manager of the Fund.
This
is a summary of a change to the Fund since March
1, 2025. For
more complete information, you may review the Fund’s current prospectus
and any applicable supplements and the Fund’s next prospectus, which we expect to be available by July
1, 2026,
at https://www.franklintempleton.com/regulatory-fund-documents or upon request at (800) DIAL BEN/342-5236 or
prospectus.us.franklintempleton@fisglobal.com.
at https://www.franklintempleton.com/regulatory-fund-documents or upon request at (800) DIAL BEN/342-5236 or
prospectus.us.franklintempleton@fisglobal.com.
This report describes changes
to the Fund that occurred during the reporting period.
WHAT
WERE THE FUND COSTS FOR THE LAST YEAR? (based
on a hypothetical $10,000 investment)
|
Class
Name |
Costs
of a $10,000 investment
|
Costs
paid as a percentage of a $10,000
investment*
|
|
Class
A1 |
$56
|
0.55%
|
HOW
DID THE FUND PERFORM LAST YEAR AND WHAT AFFECTED ITS PERFORMANCE?
For the twelve months ended February
28, 2026, Class A1 shares of
Franklin Federal Limited-Term Tax-Free Income Fund returned 4.39%.
The Fund compares its performance to the Bloomberg Municipal Short 1-5 Years Index, which returned 4.35% for the same period.
PERFORMANCE
HIGHLIGHTS
|
Top
contributors to performance: | |
|
↑
|
Overweight
to bonds with 10 years to maturity |
|
↑
|
Overweight
to bonds with no external credit rating |
|
↑
|
Selection
in BBB rated bonds |
|
Top
detractors from performance: | |
|
↓
|
Underweight
to bonds with two and five years to maturity |
|
↓
|
Selection
in A rated bonds |
|
↓
|
Overweight
to bonds with 20 or more years to maturity |
AVERAGE
ANNUAL TOTAL RETURNS (%) Period
Ended February 28, 2026
|
|
1
Year |
5
Year |
10
Year |
|
Class
A1 |
4.39
|
1.91
|
1.65
|
|
Class
A1 (with sales charge) |
2.02
|
1.45
|
1.42
|
|
Bloomberg
Municipal Bond Index |
4.96
|
1.44
|
2.43
|
|
Bloomberg
Municipal Short 1-5 Years Index |
4.35
|
1.67
|
1.71
|
For current month-end performance,
please call Franklin Templeton at (800)
DIAL BEN/342-5236 or visit
https://www.franklintempleton.com/investments/options/mutual-funds.
https://www.franklintempleton.com/investments/options/mutual-funds.
Important data provider notices
and terms available at www.franklintempletondatasources.com.
KEY
FUND STATISTICS (as
of February 28, 2026)
|
Total
Net Assets |
$885,797,276
|
|
Total
Number of Portfolio Holdings |
360
|
|
Total
Management Fee Paid |
$2,383,342
|
|
Portfolio
Turnover Rate |
33.07%
|
WHAT
DID THE FUND INVEST IN? (as
of February 28, 2026)
Portfolio Composition*
(% of Total Investments)

HOW
HAS THE FUND CHANGED?
Effective January 31, 2026, Garrett
L. Hamilton was added as a portfolio manager of the Fund.
This
is a summary of a change to the Fund since March
1, 2025. For
more complete information, you may review the Fund’s current prospectus
and any applicable supplements and the Fund’s next prospectus, which we expect to be available by July
1, 2026,
at https://www.franklintempleton.com/regulatory-fund-documents or upon request at (800) DIAL BEN/342-5236 or
prospectus.us.franklintempleton@fisglobal.com.
at https://www.franklintempleton.com/regulatory-fund-documents or upon request at (800) DIAL BEN/342-5236 or
prospectus.us.franklintempleton@fisglobal.com.
This report describes changes
to the Fund that occurred during the reporting period.
WHAT
WERE THE FUND COSTS FOR THE LAST YEAR? (based
on a hypothetical $10,000 investment)
|
Class
Name |
Costs
of a $10,000 investment
|
Costs
paid as a percentage of a $10,000
investment*
|
|
Class
R6 |
$38
|
0.37%
|
HOW
DID THE FUND PERFORM LAST YEAR AND WHAT AFFECTED ITS PERFORMANCE?
For the twelve months ended February
28, 2026, Class R6 shares of
Franklin Federal Limited-Term Tax-Free Income Fund returned 4.58%.
The Fund compares its performance to the Bloomberg Municipal Short 1-5 Years Index, which returned 4.35% for the same period.
PERFORMANCE
HIGHLIGHTS
|
Top
contributors to performance: | |
|
↑
|
Overweight
to bonds with 10 years to maturity |
|
↑
|
Overweight
to bonds with no external credit rating |
|
↑
|
Selection
in BBB rated bonds |
|
Top
detractors from performance: | |
|
↓
|
Underweight
to bonds with two and five years to maturity |
|
↓
|
Selection
in A rated bonds |
|
↓
|
Overweight
to bonds with 20 or more years to maturity |
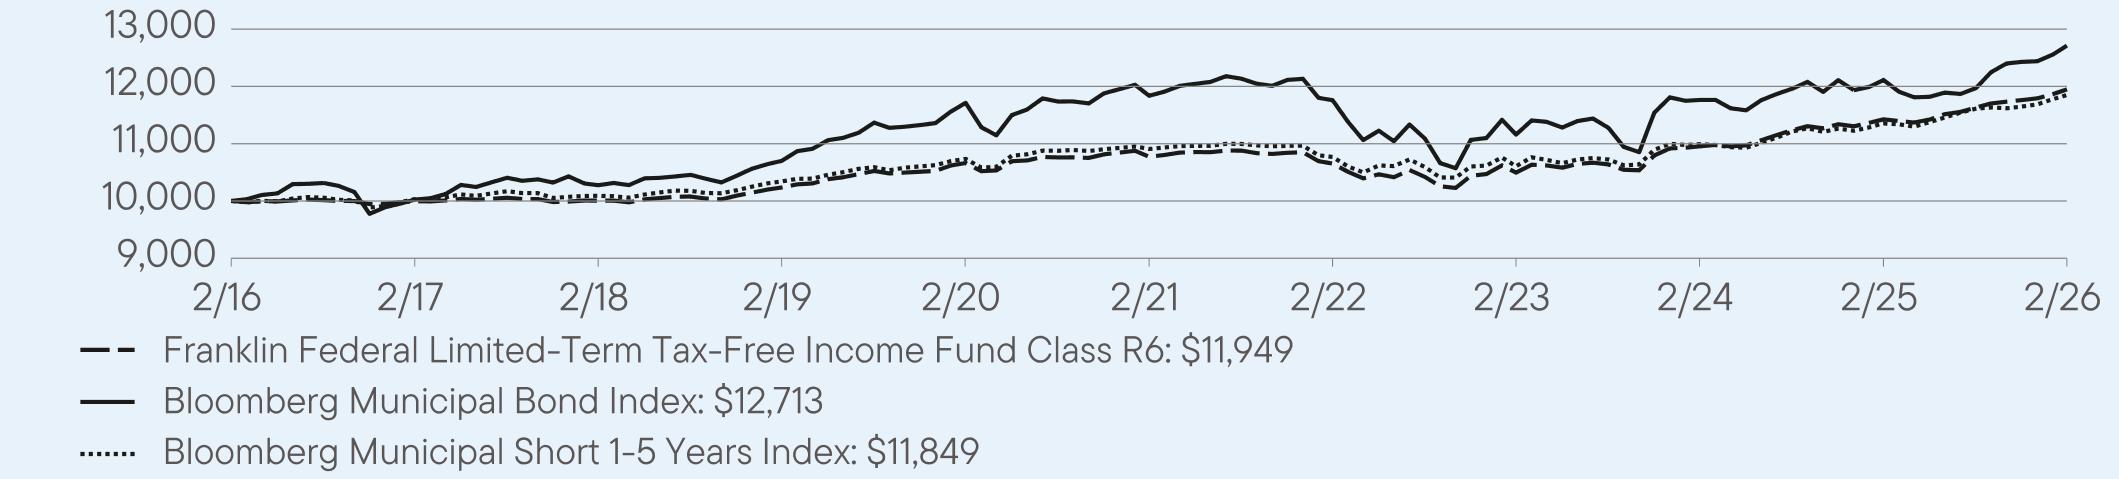
AVERAGE
ANNUAL TOTAL RETURNS (%) Period
Ended February 28, 2026
|
|
1
Year |
5
Year |
10
Year |
|
Class
R6 |
4.58
|
2.09
|
1.83
|
|
Bloomberg
Municipal Bond Index |
4.96
|
1.44
|
2.43
|
|
Bloomberg
Municipal Short 1-5 Years Index |
4.35
|
1.67
|
1.71
|
For current month-end performance,
please call Franklin Templeton at (800)
DIAL BEN/342-5236 or visit
https://www.franklintempleton.com/investments/options/mutual-funds.
https://www.franklintempleton.com/investments/options/mutual-funds.
Important data provider notices
and terms available at www.franklintempletondatasources.com.
KEY
FUND STATISTICS (as
of February 28, 2026)
|
Total
Net Assets |
$885,797,276
|
|
Total
Number of Portfolio Holdings |
360
|
|
Total
Management Fee Paid |
$2,383,342
|
|
Portfolio
Turnover Rate |
33.07%
|
WHAT
DID THE FUND INVEST IN? (as
of February 28, 2026)
Portfolio Composition*
(% of Total Investments)
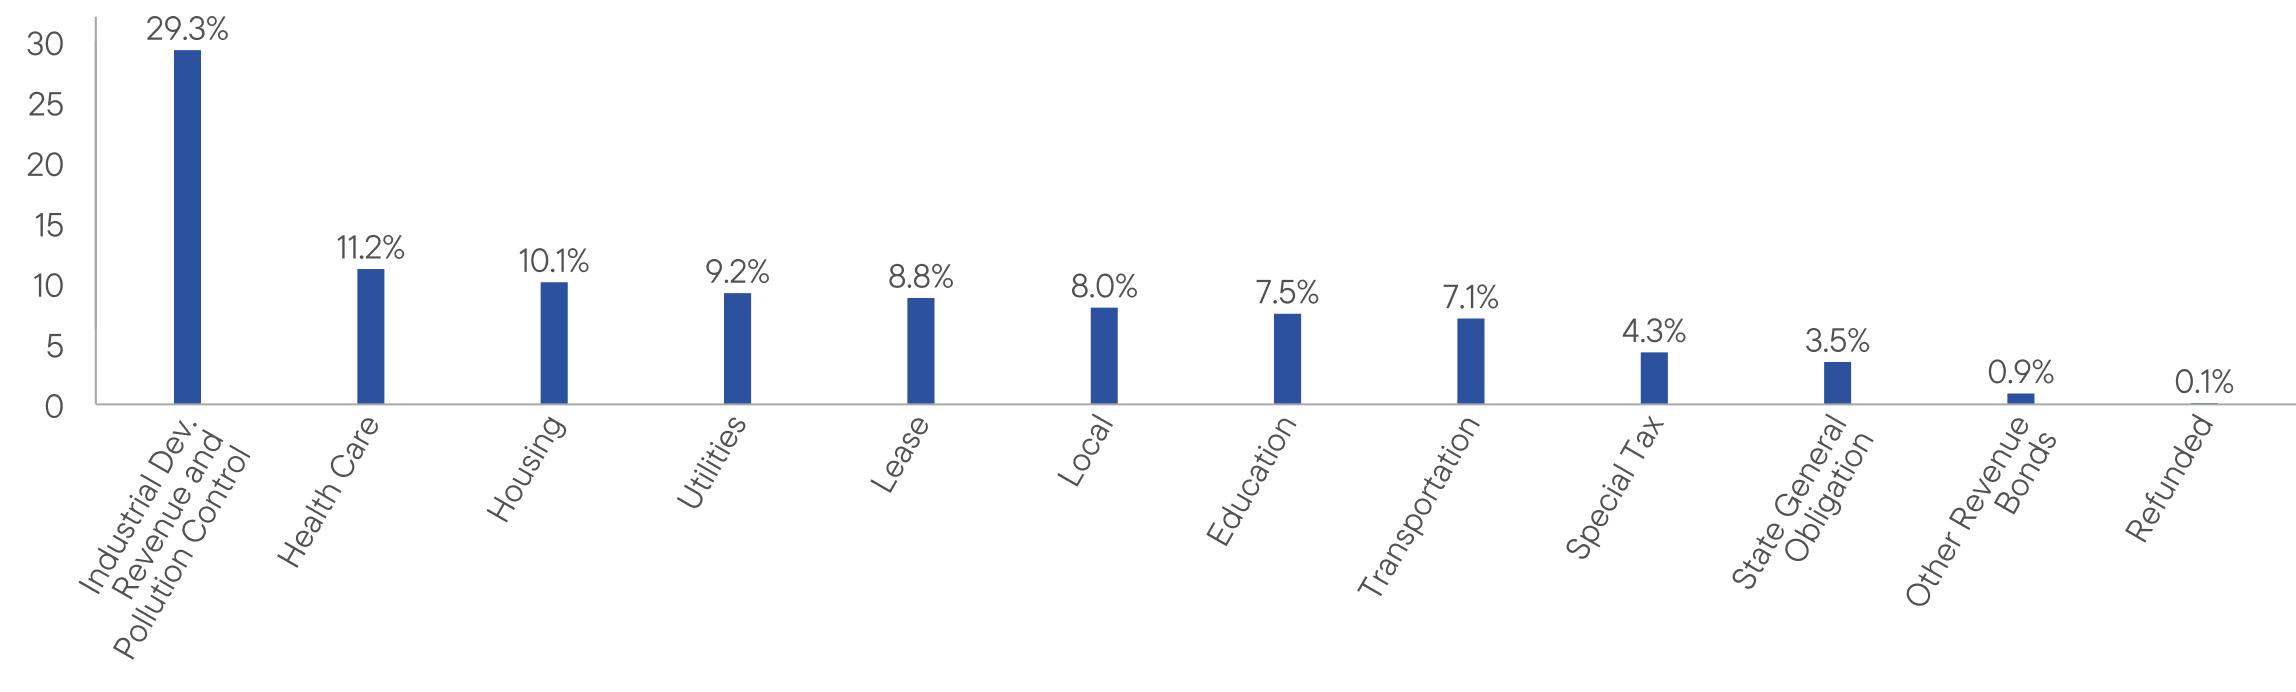
HOW
HAS THE FUND CHANGED?
Effective January 31, 2026, Garrett
L. Hamilton was added as a portfolio manager of the Fund.
This
is a summary of a change to the Fund since March
1, 2025. For
more complete information, you may review the Fund’s current prospectus
and any applicable supplements and the Fund’s next prospectus, which we expect to be available by July
1, 2026,
at https://www.franklintempleton.com/regulatory-fund-documents or upon request at (800) DIAL BEN/342-5236 or
prospectus.us.franklintempleton@fisglobal.com.
at https://www.franklintempleton.com/regulatory-fund-documents or upon request at (800) DIAL BEN/342-5236 or
prospectus.us.franklintempleton@fisglobal.com.
This report describes changes
to the Fund that occurred during the reporting period.
WHAT
WERE THE FUND COSTS FOR THE LAST YEAR? (based
on a hypothetical $10,000 investment)
|
Class
Name |
Costs
of a $10,000 investment
|
Costs
paid as a percentage of a $10,000
investment*
|
|
Advisor
Class |
$41
|
0.40%
|
HOW
DID THE FUND PERFORM LAST YEAR AND WHAT AFFECTED ITS PERFORMANCE?
For the twelve months ended February
28, 2026, Advisor Class shares
of Franklin Federal Limited-Term Tax-Free Income Fund returned
4.45%. The Fund compares
its performance to the Bloomberg Municipal Short 1-5 Years Index, which returned 4.35% for the same
period.
PERFORMANCE
HIGHLIGHTS
|
Top
contributors to performance: | |
|
↑
|
Overweight
to bonds with 10 years to maturity |
|
↑
|
Overweight
to bonds with no external credit rating |
|
↑
|
Selection
in BBB rated bonds |
|
Top
detractors from performance: | |
|
↓
|
Underweight
to bonds with two and five years to maturity |
|
↓
|
Selection
in A rated bonds |
|
↓
|
Overweight
to bonds with 20 or more years to maturity |
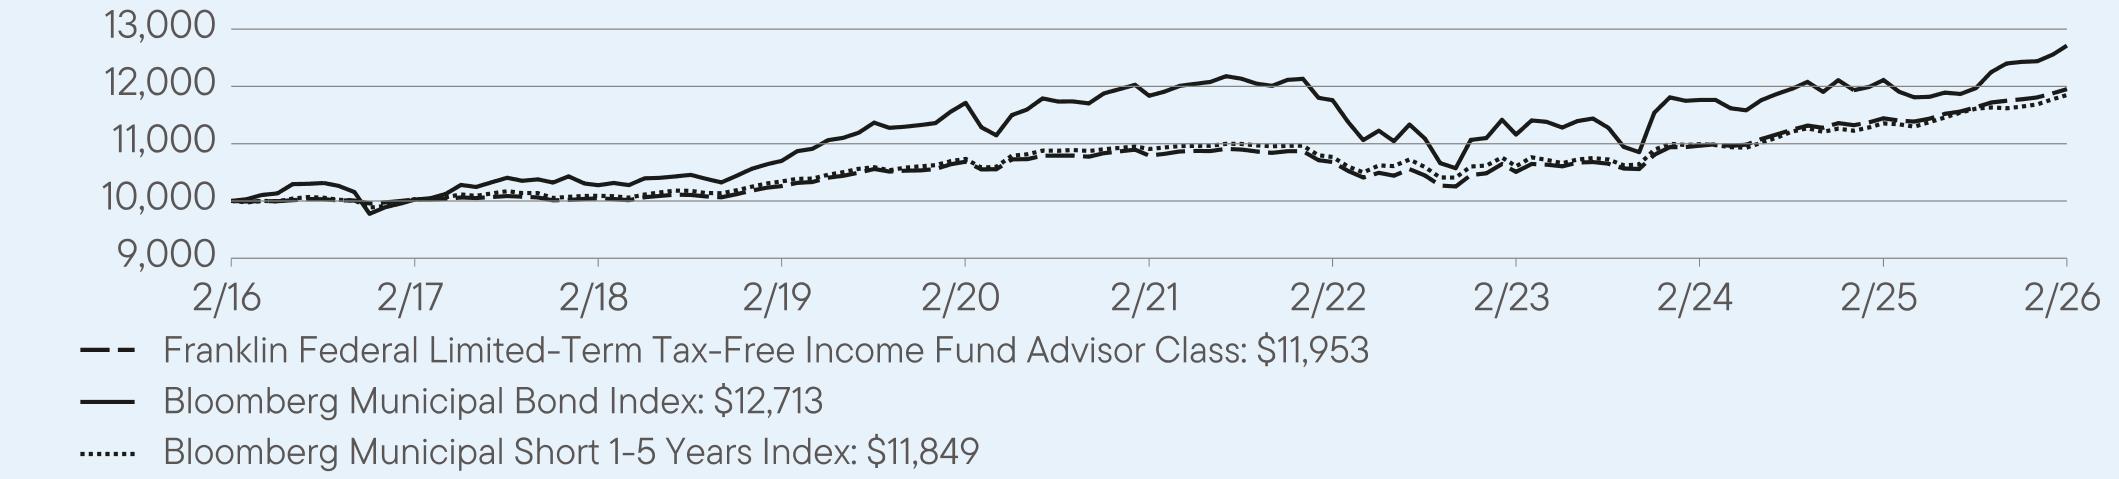
AVERAGE
ANNUAL TOTAL RETURNS (%) Period
Ended February 28, 2026
|
|
1
Year |
5
Year |
10
Year |
|
Advisor
Class |
4.45
|
2.06
|
1.80
|
|
Bloomberg
Municipal Bond Index |
4.96
|
1.44
|
2.43
|
|
Bloomberg
Municipal Short 1-5 Years Index |
4.35
|
1.67
|
1.71
|
For current month-end performance,
please call Franklin Templeton at (800)
DIAL BEN/342-5236 or visit
https://www.franklintempleton.com/investments/options/mutual-funds.
https://www.franklintempleton.com/investments/options/mutual-funds.
Important data provider notices
and terms available at www.franklintempletondatasources.com.
KEY
FUND STATISTICS (as
of February 28, 2026)
|
Total
Net Assets |
$885,797,276
|
|
Total
Number of Portfolio Holdings |
360
|
|
Total
Management Fee Paid |
$2,383,342
|
|
Portfolio
Turnover Rate |
33.07%
|
WHAT
DID THE FUND INVEST IN? (as
of February 28, 2026)
Portfolio Composition*
(% of Total Investments)

HOW
HAS THE FUND CHANGED?
Effective January 31, 2026, Garrett
L. Hamilton was added as a portfolio manager of the Fund.
This
is a summary of a change to the Fund since March
1, 2025. For
more complete information, you may review the Fund’s current prospectus
and any applicable supplements and the Fund’s next prospectus, which we expect to be available by July
1, 2026,
at https://www.franklintempleton.com/regulatory-fund-documents or upon request at (800) DIAL BEN/342-5236 or
prospectus.us.franklintempleton@fisglobal.com.
at https://www.franklintempleton.com/regulatory-fund-documents or upon request at (800) DIAL BEN/342-5236 or
prospectus.us.franklintempleton@fisglobal.com.
WHAT
WERE THE FUND COSTS FOR THE LAST YEAR? (based
on a hypothetical $10,000 investment)
|
Class
Name |
Costs
of a $10,000 investment
|
Costs
paid as a percentage of a $10,000
investment*
|
|
Class
A |
$92
|
0.90%
|
HOW
DID THE FUND PERFORM LAST YEAR AND WHAT AFFECTED ITS PERFORMANCE?
For the twelve months ended February
28, 2026, Class A shares of
Franklin Georgia Tax-Free Income Fund returned 3.81%.
The Fund compares its performance
to the Bloomberg Municipal Bond Index, which returned 4.96% for the same period.
PERFORMANCE
HIGHLIGHTS
|
Top
contributors to performance: | |
|
↑
|
Overweight
to bonds with no external credit rating |
|
↑
|
Overweight
to bonds with 20 years to maturity |
|
↑
|
Security
selection in BBB rated bonds |
|
Top
detractors from performance: | |
|
↓
|
Underweight
to bonds with two, five and 10 years to maturity |
|
↓
|
Security
selection in A rated bonds |
|
↓
|
Overweight
to bonds with 30 years to maturity |
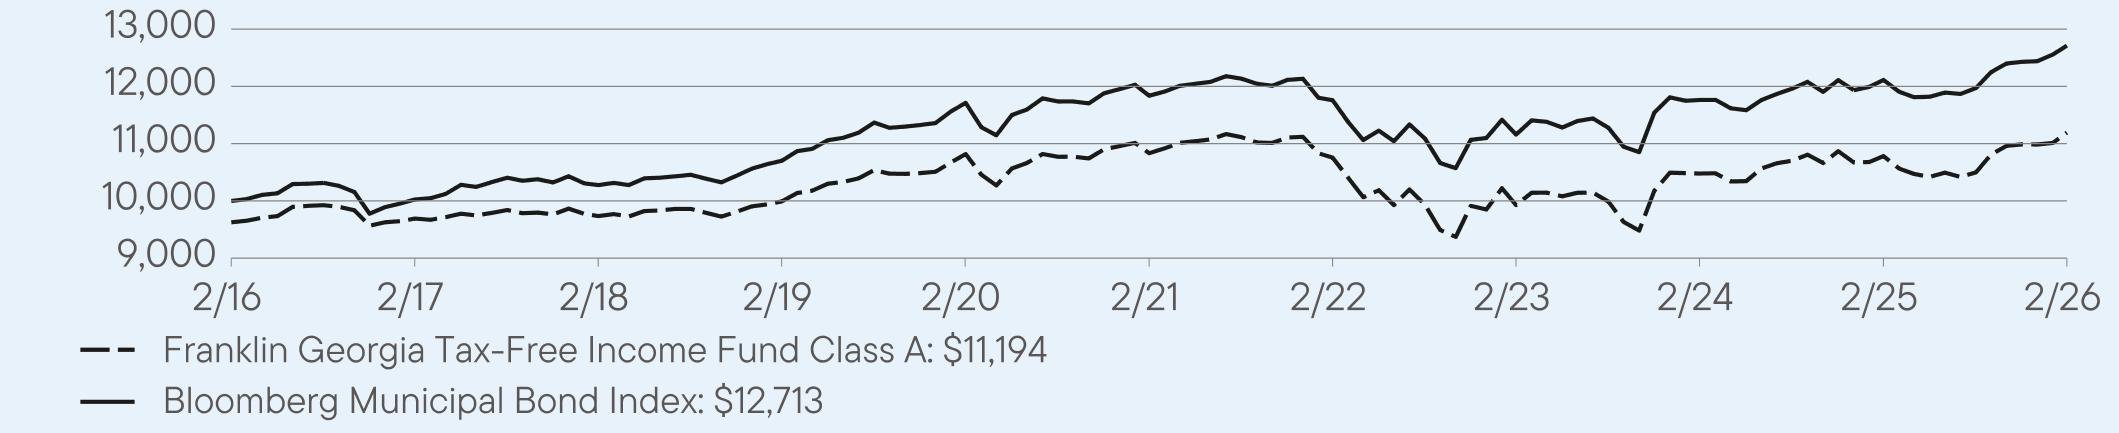
AVERAGE
ANNUAL TOTAL RETURNS (%) Period
Ended February 28, 2026
|
|
1
Year |
5
Year |
10
Year |
|
Class
A |
3.81
|
0.66
|
1.53
|
|
Class
A (with sales charge) |
-0.08
|
-0.11
|
1.15
|
|
Bloomberg
Municipal Bond Index |
4.96
|
1.44
|
2.43
|
For current month-end performance,
please call Franklin Templeton at (800)
DIAL BEN/342-5236 or visit
https://www.franklintempleton.com/investments/options/mutual-funds.
https://www.franklintempleton.com/investments/options/mutual-funds.
Important data provider notices
and terms available at www.franklintempletondatasources.com.
KEY
FUND STATISTICS (as
of February 28, 2026)
|
Total
Net Assets |
$269,687,009
|
|
Total
Number of Portfolio Holdings |
103
|
|
Total
Management Fee Paid |
$1,432,185
|
|
Portfolio
Turnover Rate |
10.73%
|
WHAT
DID THE FUND INVEST IN? (as
of February 28, 2026)
Portfolio Composition*
(% of Total Investments)

WHAT
WERE THE FUND COSTS FOR THE LAST YEAR? (based
on a hypothetical $10,000 investment)
|
Class
Name |
Costs
of a $10,000 investment
|
Costs
paid as a percentage of a $10,000
investment*
|
|
Class
A1 |
$76
|
0.75%
|
HOW
DID THE FUND PERFORM LAST YEAR AND WHAT AFFECTED ITS PERFORMANCE?
For the twelve months ended February
28, 2026, Class A1 shares of
Franklin Georgia Tax-Free Income Fund returned 3.97%.
The Fund compares its performance
to the Bloomberg Municipal Bond Index, which returned 4.96% for the same period.
PERFORMANCE
HIGHLIGHTS
|
Top
contributors to performance: | |
|
↑
|
Overweight
to bonds with no external credit rating |
|
↑
|
Overweight
to bonds with 20 years to maturity |
|
↑
|
Security
selection in BBB rated bonds |
|
Top
detractors from performance: | |
|
↓
|
Underweight
to bonds with two, five and 10 years to maturity |
|
↓
|
Security
selection in A rated bonds |
|
↓
|
Overweight
to bonds with 30 years to maturity |
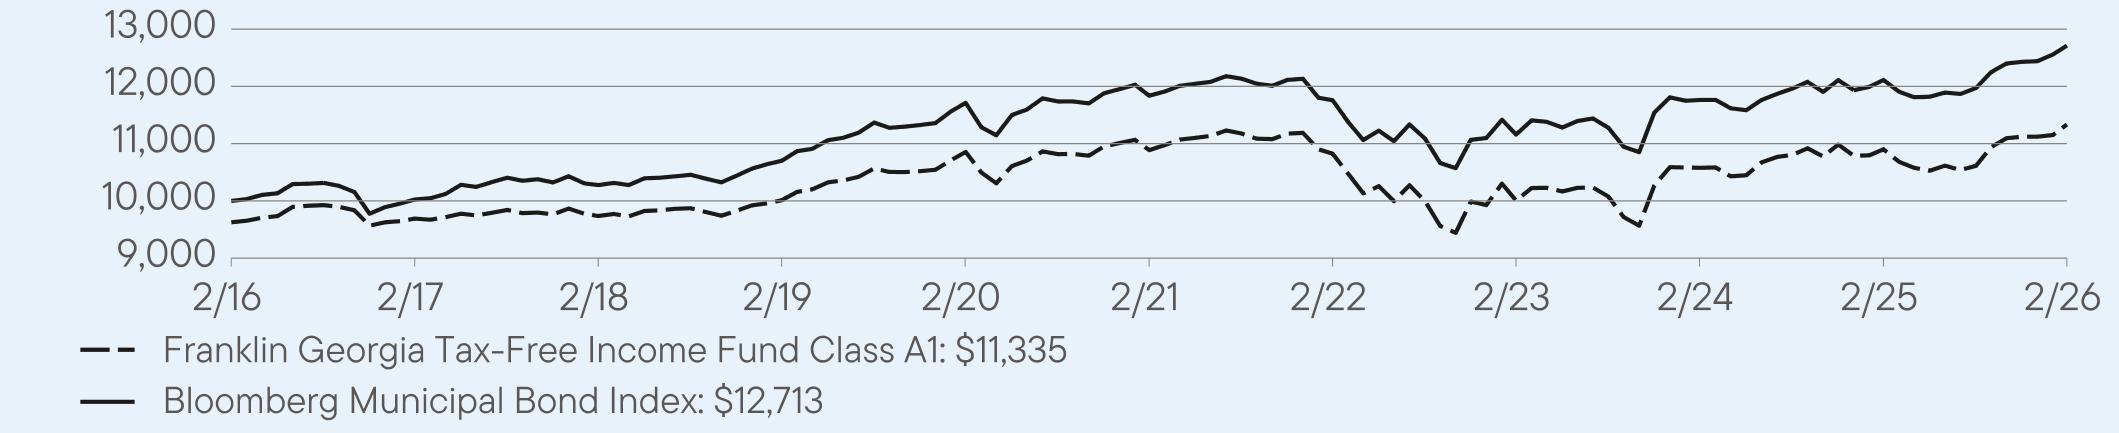
AVERAGE
ANNUAL TOTAL RETURNS (%) Period
Ended February 28, 2026
|
|
1
Year |
5
Year |
10
Year |
|
Class
A1 |
3.97
|
0.81
|
1.65
|
|
Class
A1 (with sales charge) |
0.04
|
0.05
|
1.26
|
|
Bloomberg
Municipal Bond Index |
4.96
|
1.44
|
2.43
|
For current month-end performance,
please call Franklin Templeton at (800)
DIAL BEN/342-5236 or visit
https://www.franklintempleton.com/investments/options/mutual-funds.
https://www.franklintempleton.com/investments/options/mutual-funds.
Important data provider notices
and terms available at www.franklintempletondatasources.com.
KEY
FUND STATISTICS (as
of February 28, 2026)
|
Total
Net Assets |
$269,687,009
|
|
Total
Number of Portfolio Holdings |
103
|
|
Total
Management Fee Paid |
$1,432,185
|
|
Portfolio
Turnover Rate |
10.73%
|
WHAT
DID THE FUND INVEST IN? (as
of February 28, 2026)
Portfolio Composition*
(% of Total Investments)

WHAT
WERE THE FUND COSTS FOR THE LAST YEAR? (based
on a hypothetical $10,000 investment)
|
Class
Name |
Costs
of a $10,000 investment
|
Costs
paid as a percentage of a $10,000
investment*
|
|
Class
C |
$131
|
1.29%
|
HOW
DID THE FUND PERFORM LAST YEAR AND WHAT AFFECTED ITS PERFORMANCE?
For the twelve months ended February
28, 2026, Class C shares of
Franklin Georgia Tax-Free Income Fund returned 3.34%.
The Fund compares its performance
to the Bloomberg Municipal Bond Index, which returned 4.96% for the same period.
PERFORMANCE
HIGHLIGHTS
|
Top
contributors to performance: | |
|
↑
|
Overweight
to bonds with no external credit rating |
|
↑
|
Overweight
to bonds with 20 years to maturity |
|
↑
|
Security
selection in BBB rated bonds |
|
Top
detractors from performance: | |
|
↓
|
Underweight
to bonds with two, five and 10 years to maturity |
|
↓
|
Security
selection in A rated bonds |
|
↓
|
Overweight
to bonds with 30 years to maturity |

AVERAGE
ANNUAL TOTAL RETURNS (%) Period
Ended February 28, 2026
|
|
1
Year |
5
Year |
10
Year |
|
Class
C |
3.34
|
0.21
|
1.06
|
|
Class
C (with sales charge) |
2.34
|
0.21
|
1.06
|
|
Bloomberg
Municipal Bond Index |
4.96
|
1.44
|
2.43
|
For current month-end performance,
please call Franklin Templeton at (800)
DIAL BEN/342-5236 or visit
https://www.franklintempleton.com/investments/options/mutual-funds.
https://www.franklintempleton.com/investments/options/mutual-funds.
Important data provider notices
and terms available at www.franklintempletondatasources.com.
KEY
FUND STATISTICS (as
of February 28, 2026)
|
Total
Net Assets |
$269,687,009
|
|
Total
Number of Portfolio Holdings |
103
|
|
Total
Management Fee Paid |
$1,432,185
|
|
Portfolio
Turnover Rate |
10.73%
|
WHAT
DID THE FUND INVEST IN? (as
of February 28, 2026)
Portfolio Composition*
(% of Total Investments)

WHAT
WERE THE FUND COSTS FOR THE LAST YEAR? (based
on a hypothetical $10,000 investment)
|
Class
Name |
Costs
of a $10,000 investment
|
Costs
paid as a percentage of a $10,000
investment*
|
|
Class
R6 |
$63
|
0.62%
|
HOW
DID THE FUND PERFORM LAST YEAR AND WHAT AFFECTED ITS PERFORMANCE?
For the twelve months ended February
28, 2026, Class R6 shares of
Franklin Georgia Tax-Free Income Fund returned 4.10%.
The Fund compares its performance
to the Bloomberg Municipal Bond Index, which returned 4.96% for the same period.
PERFORMANCE
HIGHLIGHTS
|
Top
contributors to performance: | |
|
↑
|
Overweight
to bonds with no external credit rating |
|
↑
|
Overweight
to bonds with 20 years to maturity |
|
↑
|
Security
selection in BBB rated bonds |
|
Top
detractors from performance: | |
|
↓
|
Underweight
to bonds with two, five and 10 years to maturity |
|
↓
|
Security
selection in A rated bonds |
|
↓
|
Overweight
to bonds with 30 years to maturity |
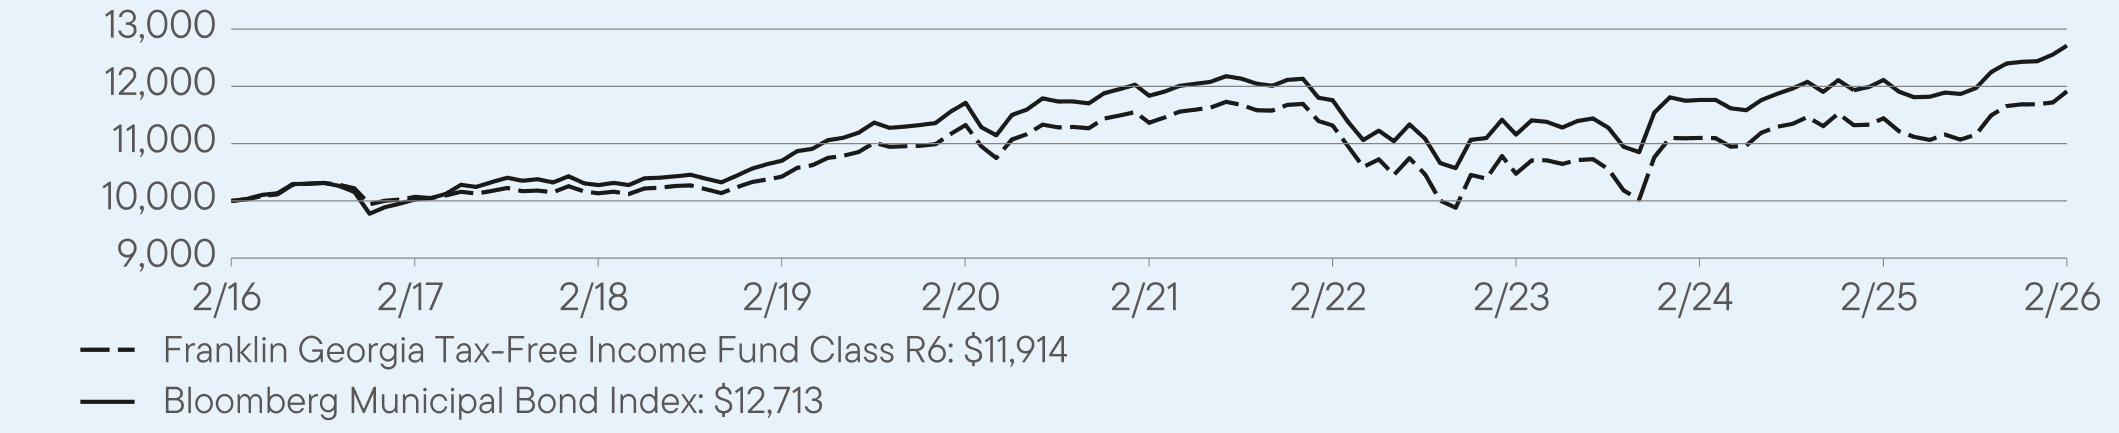
AVERAGE
ANNUAL TOTAL RETURNS (%) Period
Ended February 28, 2026
|
|
1
Year |
5
Year |
10
Year |
|
Class
R6 |
4.10
|
0.95
|
1.78
|
|
Bloomberg
Municipal Bond Index |
4.96
|
1.44
|
2.43
|
For current month-end performance,
please call Franklin Templeton at (800)
DIAL BEN/342-5236 or visit
https://www.franklintempleton.com/investments/options/mutual-funds.
https://www.franklintempleton.com/investments/options/mutual-funds.
Important data provider notices
and terms available at www.franklintempletondatasources.com.
KEY
FUND STATISTICS (as
of February 28, 2026)
|
Total
Net Assets |
$269,687,009
|
|
Total
Number of Portfolio Holdings |
103
|
|
Total
Management Fee Paid |
$1,432,185
|
|
Portfolio
Turnover Rate |
10.73%
|
WHAT
DID THE FUND INVEST IN? (as
of February 28, 2026)
Portfolio Composition*
(% of Total Investments)

WHAT
WERE THE FUND COSTS FOR THE LAST YEAR? (based
on a hypothetical $10,000 investment)
|
Class
Name |
Costs
of a $10,000 investment
|
Costs
paid as a percentage of a $10,000
investment*
|
|
Advisor
Class |
$66
|
0.65%
|
HOW
DID THE FUND PERFORM LAST YEAR AND WHAT AFFECTED ITS PERFORMANCE?
For the twelve months ended February
28, 2026, Advisor Class shares
of Franklin Georgia Tax-Free Income Fund returned 4.07%.
The Fund compares its performance
to the Bloomberg Municipal Bond Index, which returned 4.96% for the same period.
PERFORMANCE
HIGHLIGHTS
|
Top
contributors to performance: | |
|
↑
|
Overweight
to bonds with no external credit rating |
|
↑
|
Overweight
to bonds with 20 years to maturity |
|
↑
|
Security
selection in BBB rated bonds |
|
Top
detractors from performance: | |
|
↓
|
Underweight
to bonds with two, five and 10 years to maturity |
|
↓
|
Security
selection in A rated bonds |
|
↓
|
Overweight
to bonds with 30 years to maturity |
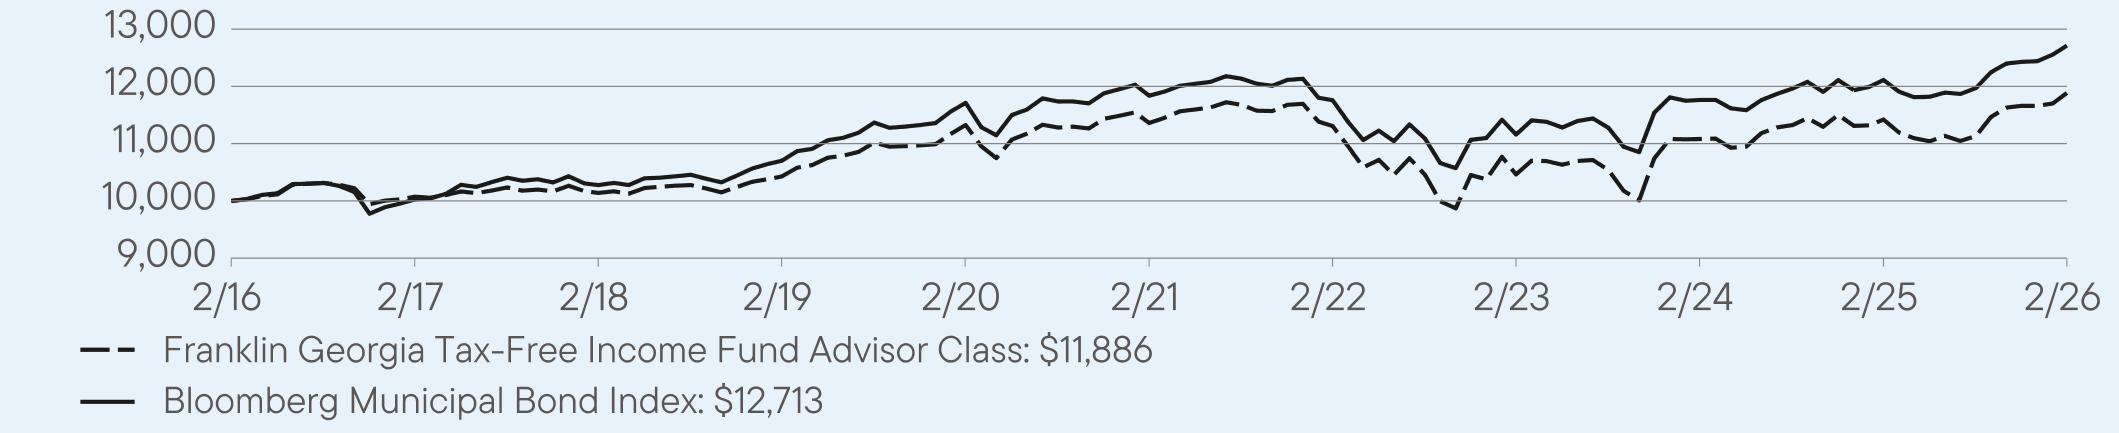
AVERAGE
ANNUAL TOTAL RETURNS (%) Period
Ended February 28, 2026
|
|
1
Year |
5
Year |
10
Year |
|
Advisor
Class |
4.07
|
0.91
|
1.74
|
|
Bloomberg
Municipal Bond Index |
4.96
|
1.44
|
2.43
|
For current month-end performance,
please call Franklin Templeton at (800)
DIAL BEN/342-5236 or visit
https://www.franklintempleton.com/investments/options/mutual-funds.
https://www.franklintempleton.com/investments/options/mutual-funds.
Important data provider notices
and terms available at www.franklintempletondatasources.com.
KEY
FUND STATISTICS (as
of February 28, 2026)
|
Total
Net Assets |
$269,687,009
|
|
Total
Number of Portfolio Holdings |
103
|
|
Total
Management Fee Paid |
$1,432,185
|
|
Portfolio
Turnover Rate |
10.73%
|
WHAT
DID THE FUND INVEST IN? (as
of February 28, 2026)
Portfolio Composition*
(% of Total Investments)
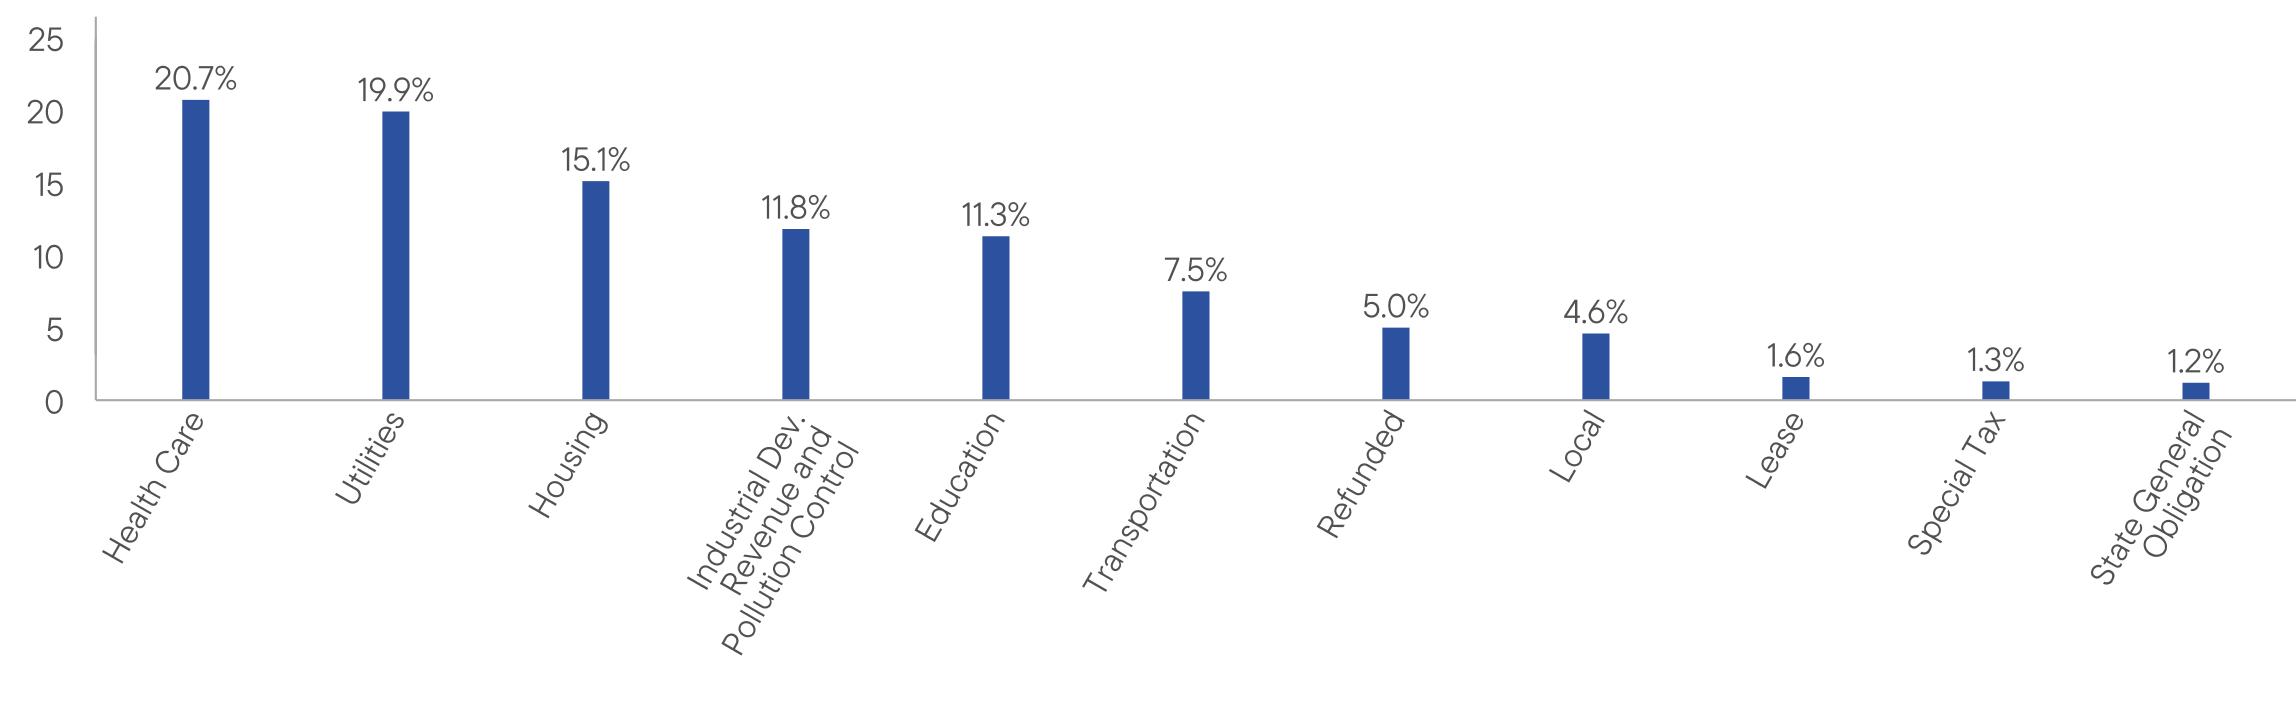
This report describes changes
to the Fund that occurred during the reporting period.
WHAT
WERE THE FUND COSTS FOR THE LAST YEAR? (based
on a hypothetical $10,000 investment)
|
Class
Name |
Costs
of a $10,000 investment
|
Costs
paid as a percentage of a $10,000
investment |
|
Class
A |
$83
|
0.81%
|
HOW
DID THE FUND PERFORM LAST YEAR AND WHAT AFFECTED ITS PERFORMANCE?
For the twelve months ended February
28, 2026, Class A shares of
Franklin High Yield Tax-Free Income Fund returned 4.41%.
The Fund compares its performance
to the Bloomberg Municipal Bond Index, which returned 4.96% for the same period.
PERFORMANCE
HIGHLIGHTS
|
Top
contributors to performance: | |
|
↑
|
Overweight
to bonds with no external credit rating |
|
↑
|
Selection
of BB rated bonds |
|
↑
|
Selection
of BBB rated bonds |
|
Top
detractors from performance: | |
|
↓
|
Underweight
to bonds with five years or less to maturity |
|
↓
|
Overweight
to BB rated bonds |
|
↓
|
Overweight
duration to bonds with 30 years to maturity |
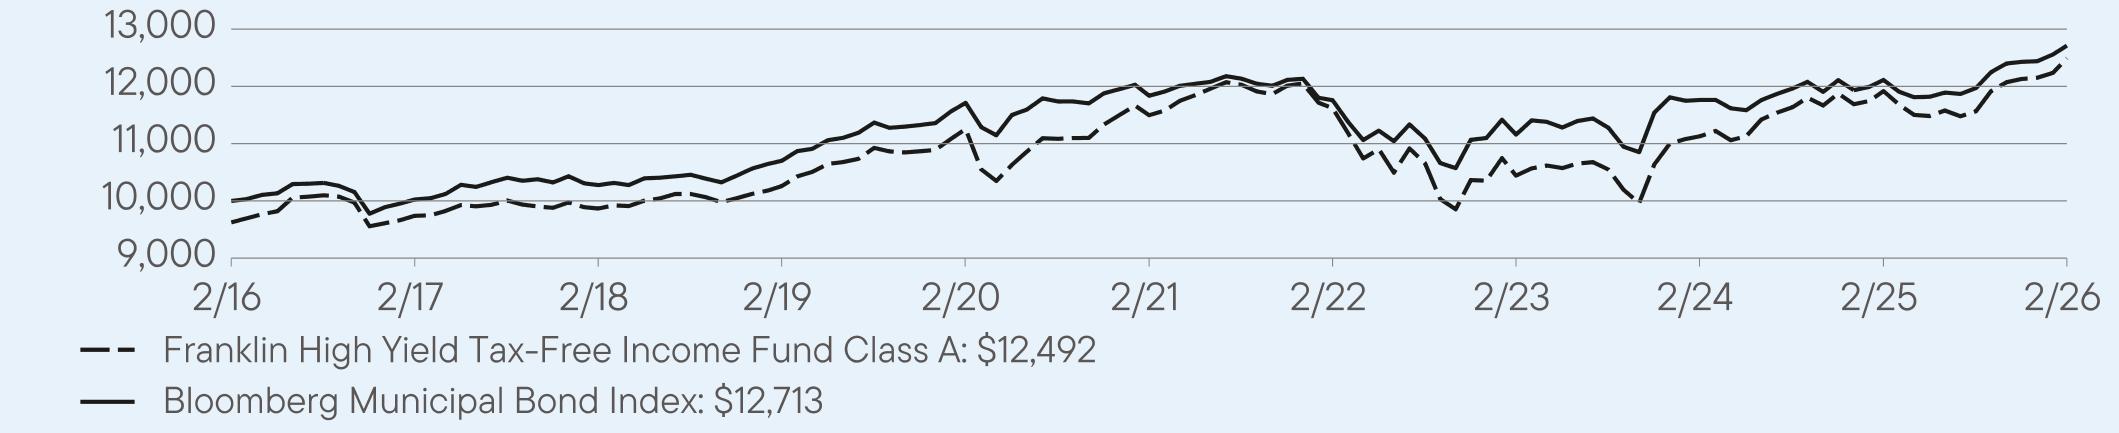
AVERAGE
ANNUAL TOTAL RETURNS (%) Period
Ended February 28, 2026
|
|
1
Year |
5
Year |
10
Year |
|
Class
A |
4.41
|
1.59
|
2.64
|
|
Class
A (with sales charge) |
0.49
|
0.82
|
2.25
|
|
Bloomberg
Municipal Bond Index |
4.96
|
1.44
|
2.43
|
For current month-end performance,
please call Franklin Templeton at (800)
DIAL BEN/342-5236 or visit
https://www.franklintempleton.com/investments/options/mutual-funds.
https://www.franklintempleton.com/investments/options/mutual-funds.
Important data provider notices
and terms available at www.franklintempletondatasources.com.
KEY
FUND STATISTICS (as
of February 28, 2026)
|
Total
Net Assets |
$4,808,286,091
|
|
Total
Number of Portfolio Holdings |
1,880
|
|
Total
Management Fee Paid |
$21,329,933
|
|
Portfolio
Turnover Rate |
12.16%
|
WHAT
DID THE FUND INVEST IN? (as
of February 28, 2026)
Portfolio Composition*
(% of Total Investments)

HOW
HAS THE FUND CHANGED?
Effective on or about May 30,
2025, Paul M. Drury stepped down as a portfolio manager of the Fund.
This
is a summary of a change to the Fund since March
1, 2025. For
more complete information, you may review the Fund’s current prospectus
and any applicable supplements and the Fund’s next prospectus, which we expect to be available by July
1, 2026,
at https://www.franklintempleton.com/regulatory-fund-documents or upon request at (800) DIAL BEN/342-5236 or
prospectus.us.franklintempleton@fisglobal.com.
at https://www.franklintempleton.com/regulatory-fund-documents or upon request at (800) DIAL BEN/342-5236 or
prospectus.us.franklintempleton@fisglobal.com.
This report describes changes
to the Fund that occurred during the reporting period.
WHAT
WERE THE FUND COSTS FOR THE LAST YEAR? (based
on a hypothetical $10,000 investment)
|
Class
Name |
Costs
of a $10,000 investment
|
Costs
paid as a percentage of a $10,000
investment |
|
Class
A1 |
$68
|
0.66%
|
HOW
DID THE FUND PERFORM LAST YEAR AND WHAT AFFECTED ITS PERFORMANCE?
For the twelve months ended February
28, 2026, Class A1 shares of
Franklin High Yield Tax-Free Income Fund returned 4.68%.
The Fund compares its performance
to the Bloomberg Municipal Bond Index, which returned 4.96% for the same period.
PERFORMANCE
HIGHLIGHTS
|
Top
contributors to performance: | |
|
↑
|
Overweight
to bonds with no external credit rating |
|
↑
|
Selection
of BB rated bonds |
|
↑
|
Selection
of BBB rated bonds |
|
Top
detractors from performance: | |
|
↓
|
Underweight
to bonds with five years or less to maturity |
|
↓
|
Overweight
to BB rated bonds |
|
↓
|
Overweight
duration to bonds with 30 years to maturity |
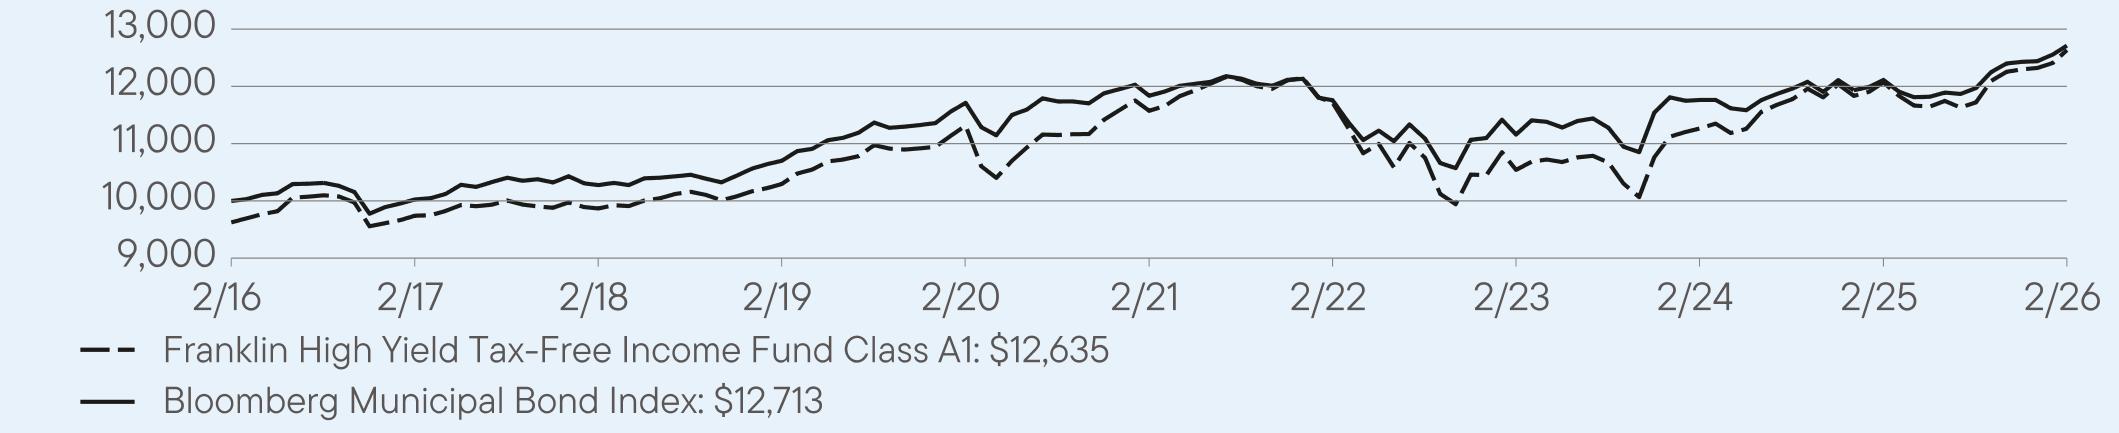
AVERAGE
ANNUAL TOTAL RETURNS (%) Period
Ended February 28, 2026
|
|
1
Year |
5
Year |
10
Year |
|
Class
A1 |
4.68
|
1.77
|
2.76
|
|
Class
A1 (with sales charge) |
0.78
|
1.00
|
2.37
|
|
Bloomberg
Municipal Bond Index |
4.96
|
1.44
|
2.43
|
For current month-end performance,
please call Franklin Templeton at (800)
DIAL BEN/342-5236 or visit
https://www.franklintempleton.com/investments/options/mutual-funds.
https://www.franklintempleton.com/investments/options/mutual-funds.
Important data provider notices
and terms available at www.franklintempletondatasources.com.
KEY
FUND STATISTICS (as
of February 28, 2026)
|
Total
Net Assets |
$4,808,286,091
|
|
Total
Number of Portfolio Holdings |
1,880
|
|
Total
Management Fee Paid |
$21,329,933
|
|
Portfolio
Turnover Rate |
12.16%
|
WHAT
DID THE FUND INVEST IN? (as
of February 28, 2026)
Portfolio Composition*
(% of Total Investments)

HOW
HAS THE FUND CHANGED?
Effective on or about May 30,
2025, Paul M. Drury stepped down as a portfolio manager of the Fund.
This
is a summary of a change to the Fund since March
1, 2025. For
more complete information, you may review the Fund’s current prospectus
and any applicable supplements and the Fund’s next prospectus, which we expect to be available by July
1, 2026,
at https://www.franklintempleton.com/regulatory-fund-documents or upon request at (800) DIAL BEN/342-5236 or
prospectus.us.franklintempleton@fisglobal.com.
at https://www.franklintempleton.com/regulatory-fund-documents or upon request at (800) DIAL BEN/342-5236 or
prospectus.us.franklintempleton@fisglobal.com.
This report describes changes
to the Fund that occurred during the reporting period.
WHAT
WERE THE FUND COSTS FOR THE LAST YEAR? (based
on a hypothetical $10,000 investment)
|
Class
Name |
Costs
of a $10,000 investment
|
Costs
paid as a percentage of a $10,000
investment |
|
Class
C |
$122
|
1.20%
|
HOW
DID THE FUND PERFORM LAST YEAR AND WHAT AFFECTED ITS PERFORMANCE?
For the twelve months ended February
28, 2026, Class C shares of
Franklin High Yield Tax-Free Income Fund returned 3.90%.
The Fund compares its performance
to the Bloomberg Municipal Bond Index, which returned 4.96% for the same period.
PERFORMANCE
HIGHLIGHTS
|
Top
contributors to performance: | |
|
↑
|
Overweight
to bonds with no external credit rating |
|
↑
|
Selection
of BB rated bonds |
|
↑
|
Selection
of BBB rated bonds |
|
Top
detractors from performance: | |
|
↓
|
Underweight
to bonds with five years or less to maturity |
|
↓
|
Overweight
to BB rated bonds |
|
↓
|
Overweight
duration to bonds with 30 years to maturity |
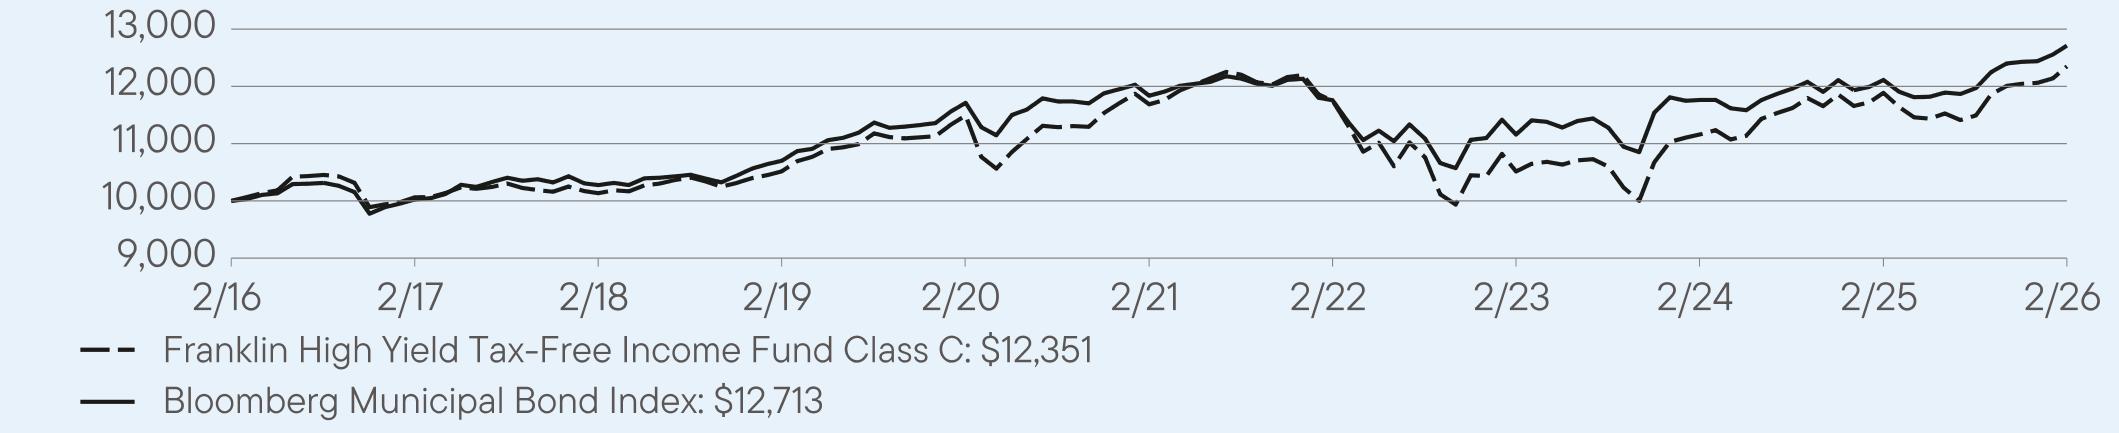
AVERAGE
ANNUAL TOTAL RETURNS (%) Period
Ended February 28, 2026
|
|
1
Year |
5
Year |
10
Year |
|
Class
C |
3.90
|
1.11
|
2.14
|
|
Class
C (with sales charge) |
2.90
|
1.11
|
2.14
|
|
Bloomberg
Municipal Bond Index |
4.96
|
1.44
|
2.43
|
For current month-end performance,
please call Franklin Templeton at (800)
DIAL BEN/342-5236 or visit
https://www.franklintempleton.com/investments/options/mutual-funds.
https://www.franklintempleton.com/investments/options/mutual-funds.
Important data provider notices
and terms available at www.franklintempletondatasources.com.
KEY
FUND STATISTICS (as
of February 28, 2026)
|
Total
Net Assets |
$4,808,286,091
|
|
Total
Number of Portfolio Holdings |
1,880
|
|
Total
Management Fee Paid |
$21,329,933
|
|
Portfolio
Turnover Rate |
12.16%
|
WHAT
DID THE FUND INVEST IN? (as
of February 28, 2026)
Portfolio Composition*
(% of Total Investments)
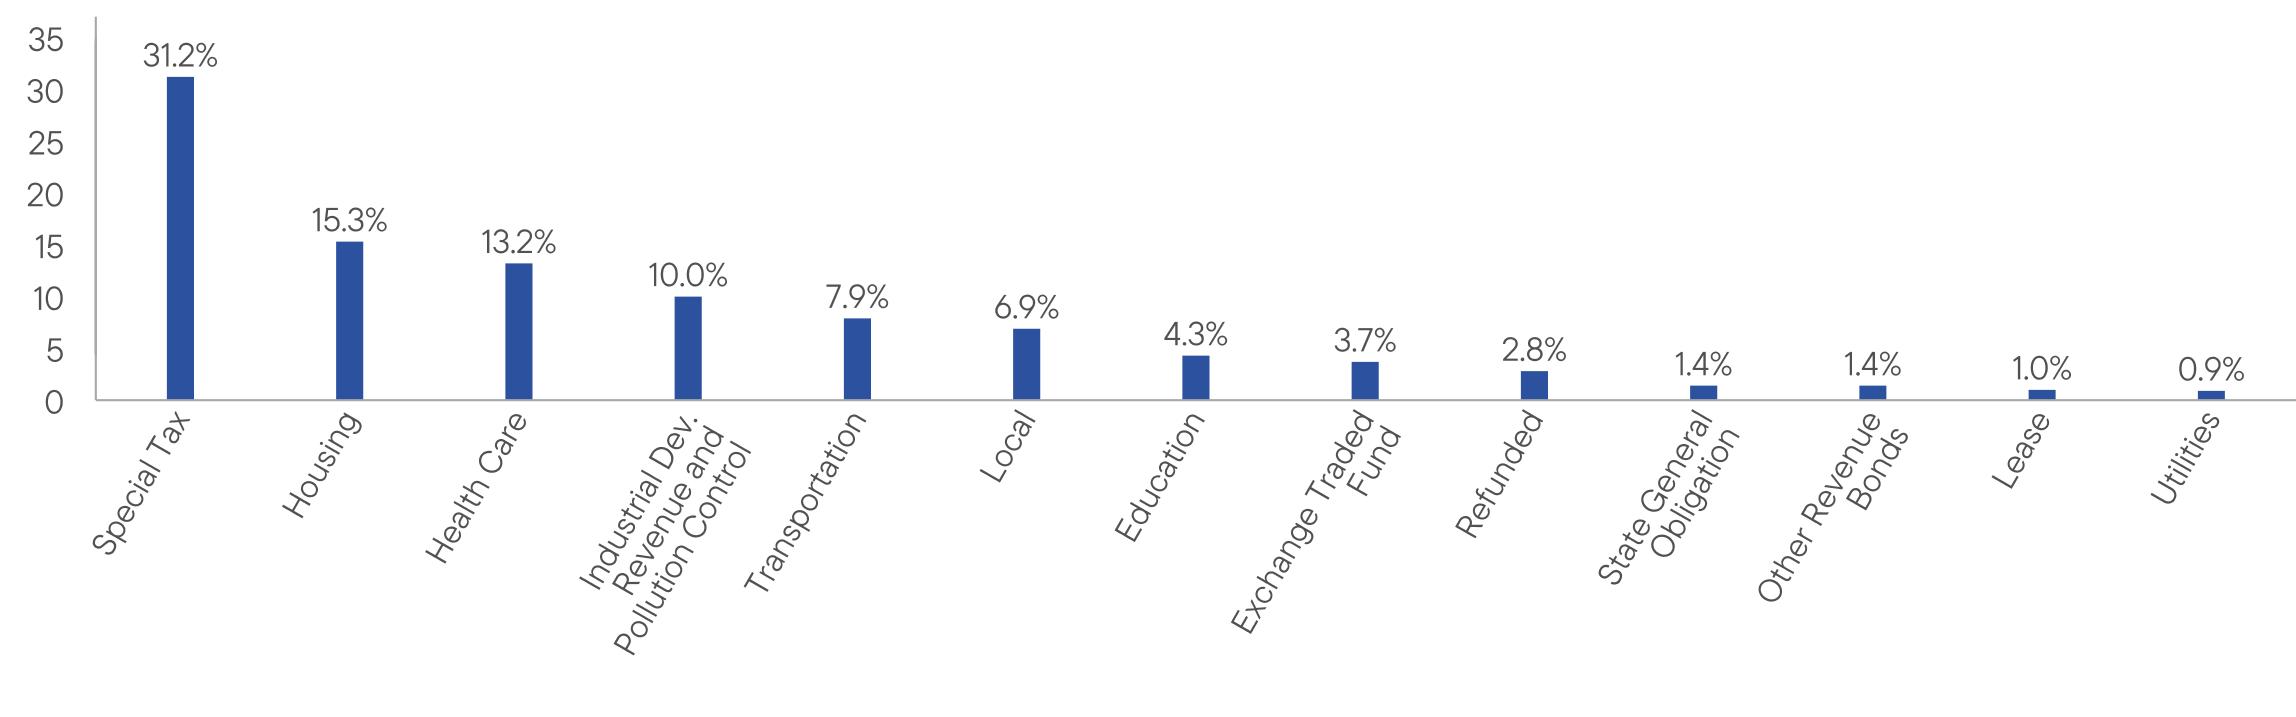
HOW
HAS THE FUND CHANGED?
Effective on or about May 30,
2025, Paul M. Drury stepped down as a portfolio manager of the Fund.
This
is a summary of a change to the Fund since March
1, 2025. For
more complete information, you may review the Fund’s current prospectus
and any applicable supplements and the Fund’s next prospectus, which we expect to be available by July
1, 2026,
at https://www.franklintempleton.com/regulatory-fund-documents or upon request at (800) DIAL BEN/342-5236 or
prospectus.us.franklintempleton@fisglobal.com.
at https://www.franklintempleton.com/regulatory-fund-documents or upon request at (800) DIAL BEN/342-5236 or
prospectus.us.franklintempleton@fisglobal.com.
This report describes changes
to the Fund that occurred during the reporting period.
WHAT
WERE THE FUND COSTS FOR THE LAST YEAR? (based
on a hypothetical $10,000 investment)
|
Class
Name |
Costs
of a $10,000 investment
|
Costs
paid as a percentage of a $10,000
investment |
|
Class
R6 |
$52
|
0.51%
|
HOW
DID THE FUND PERFORM LAST YEAR AND WHAT AFFECTED ITS PERFORMANCE?
For the twelve months ended February
28, 2026, Class R6 shares of
Franklin High Yield Tax-Free Income Fund returned 4.69%.
The Fund compares its performance
to the Bloomberg Municipal Bond Index, which returned 4.96% for the same period.
PERFORMANCE
HIGHLIGHTS
|
Top
contributors to performance: | |
|
↑
|
Overweight
to bonds with no external credit rating |
|
↑
|
Selection
of BB rated bonds |
|
↑
|
Selection
of BBB rated bonds |
|
Top
detractors from performance: | |
|
↓
|
Underweight
to bonds with five years or less to maturity |
|
↓
|
Overweight
to BB rated bonds |
|
↓
|
Overweight
duration to bonds with 30 years to maturity |
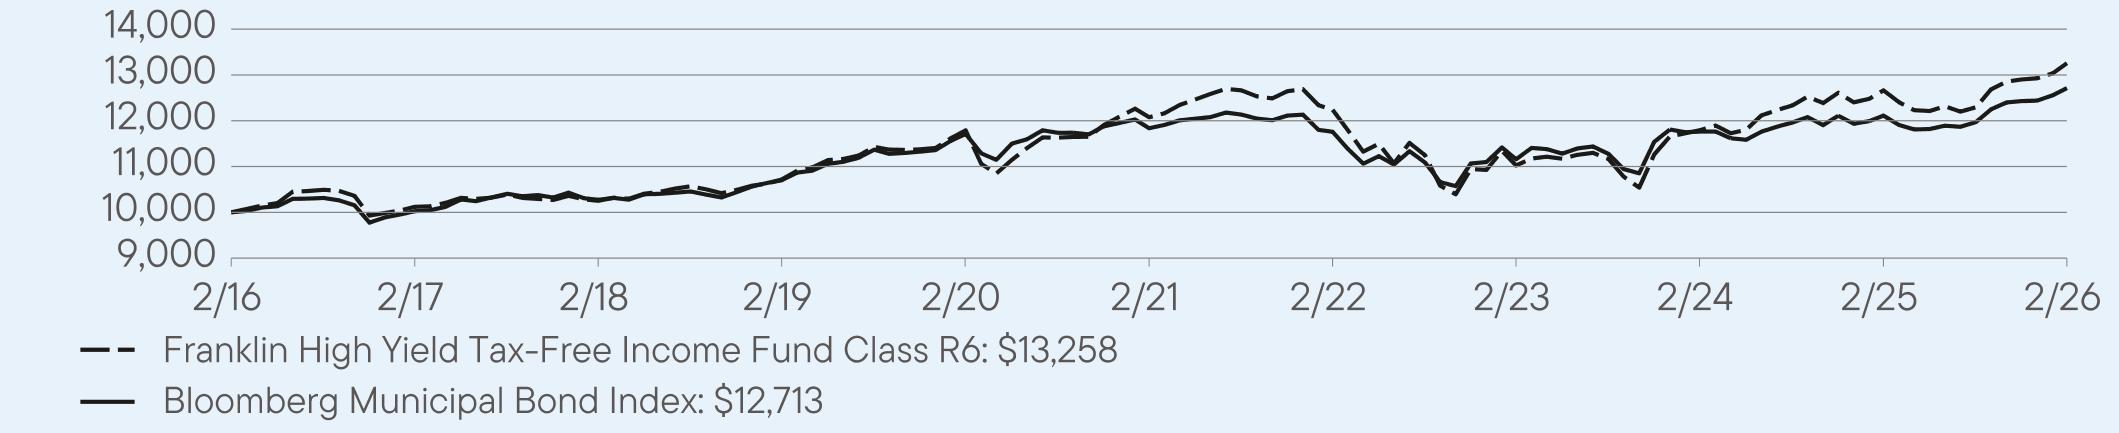
AVERAGE
ANNUAL TOTAL RETURNS (%) Period
Ended February 28, 2026
|
|
1
Year |
5
Year |
10
Year |
|
Class
R6 |
4.69
|
1.88
|
2.88
|
|
Bloomberg
Municipal Bond Index |
4.96
|
1.44
|
2.43
|
For current month-end performance,
please call Franklin Templeton at (800)
DIAL BEN/342-5236 or visit
https://www.franklintempleton.com/investments/options/mutual-funds.
https://www.franklintempleton.com/investments/options/mutual-funds.
Important data provider notices
and terms available at www.franklintempletondatasources.com.
KEY
FUND STATISTICS (as
of February 28, 2026)
|
Total
Net Assets |
$4,808,286,091
|
|
Total
Number of Portfolio Holdings |
1,880
|
|
Total
Management Fee Paid |
$21,329,933
|
|
Portfolio
Turnover Rate |
12.16%
|
WHAT
DID THE FUND INVEST IN? (as
of February 28, 2026)
Portfolio Composition*
(% of Total Investments)

HOW
HAS THE FUND CHANGED?
Effective on or about May 30,
2025, Paul M. Drury stepped down as a portfolio manager of the Fund.
This
is a summary of a change to the Fund since March
1, 2025. For
more complete information, you may review the Fund’s current prospectus
and any applicable supplements and the Fund’s next prospectus, which we expect to be available by July
1, 2026,
at https://www.franklintempleton.com/regulatory-fund-documents or upon request at (800) DIAL BEN/342-5236 or
prospectus.us.franklintempleton@fisglobal.com.
at https://www.franklintempleton.com/regulatory-fund-documents or upon request at (800) DIAL BEN/342-5236 or
prospectus.us.franklintempleton@fisglobal.com.
This report describes changes
to the Fund that occurred during the reporting period.
WHAT
WERE THE FUND COSTS FOR THE LAST YEAR? (based
on a hypothetical $10,000 investment)
|
Class
Name |
Costs
of a $10,000 investment
|
Costs
paid as a percentage of a $10,000
investment |
|
Advisor
Class |
$57
|
0.56%
|
HOW
DID THE FUND PERFORM LAST YEAR AND WHAT AFFECTED ITS PERFORMANCE?
For the twelve months ended February
28, 2026, Advisor Class shares
of Franklin High Yield Tax-Free Income Fund returned 4.76%.
The Fund compares its performance
to the Bloomberg Municipal Bond Index, which returned 4.96% for the same period.
PERFORMANCE
HIGHLIGHTS
|
Top
contributors to performance: | |
|
↑
|
Overweight
to bonds with no external credit rating |
|
↑
|
Selection
of BB rated bonds |
|
↑
|
Selection
of BBB rated bonds |
|
Top
detractors from performance: | |
|
↓
|
Underweight
to bonds with five years or less to maturity |
|
↓
|
Overweight
to BB rated bonds |
|
↓
|
Overweight
duration to bonds with 30 years to maturity |

AVERAGE
ANNUAL TOTAL RETURNS (%) Period
Ended February 28, 2026
|
|
1
Year |
5
Year |
10
Year |
|
Advisor
Class |
4.76
|
1.84
|
2.85
|
|
Bloomberg
Municipal Bond Index |
4.96
|
1.44
|
2.43
|
For current month-end performance,
please call Franklin Templeton at (800)
DIAL BEN/342-5236 or visit
https://www.franklintempleton.com/investments/options/mutual-funds.
https://www.franklintempleton.com/investments/options/mutual-funds.
Important data provider notices
and terms available at www.franklintempletondatasources.com.
KEY
FUND STATISTICS (as
of February 28, 2026)
|
Total
Net Assets |
$4,808,286,091
|
|
Total
Number of Portfolio Holdings |
1,880
|
|
Total
Management Fee Paid |
$21,329,933
|
|
Portfolio
Turnover Rate |
12.16%
|
WHAT
DID THE FUND INVEST IN? (as
of February 28, 2026)
Portfolio Composition*
(% of Total Investments)

HOW
HAS THE FUND CHANGED?
Effective on or about May 30,
2025, Paul M. Drury stepped down as a portfolio manager of the Fund.
This
is a summary of a change to the Fund since March
1, 2025. For
more complete information, you may review the Fund’s current prospectus
and any applicable supplements and the Fund’s next prospectus, which we expect to be available by July
1, 2026,
at https://www.franklintempleton.com/regulatory-fund-documents or upon request at (800) DIAL BEN/342-5236 or
prospectus.us.franklintempleton@fisglobal.com.
at https://www.franklintempleton.com/regulatory-fund-documents or upon request at (800) DIAL BEN/342-5236 or
prospectus.us.franklintempleton@fisglobal.com.
WHAT
WERE THE FUND COSTS FOR THE LAST YEAR? (based
on a hypothetical $10,000 investment)
|
Class
Name |
Costs
of a $10,000 investment
|
Costs
paid as a percentage of a $10,000
investment*
|
|
Class
A |
$91
|
0.90%
|
HOW
DID THE FUND PERFORM LAST YEAR AND WHAT AFFECTED ITS PERFORMANCE?
For the twelve months ended February
28, 2026, Class A shares of
Franklin Louisiana Tax-Free Income Fund returned 2.99%.
The Fund compares its performance
to the Bloomberg Municipal Bond Index, which returned 4.96% for the same period.
PERFORMANCE
HIGHLIGHTS
|
Top
contributors to performance: | |
|
An
overweight to: | |
|
↑
|
A
rated bonds |
|
↑
|
Bonds
with no external credit rating |
|
↑
|
Bonds
with 10 years to maturity |
|
Top
detractors from performance: | |
|
↓
|
Underweight
to bonds with two and five years to maturity |
|
↓
|
Security
selection in BBB rated bonds |
|
↓
|
Security
selection in A rated bonds |

AVERAGE
ANNUAL TOTAL RETURNS (%) Period
Ended February 28, 2026
|
|
1
Year |
5
Year |
10
Year |
|
Class
A |
2.99
|
0.68
|
1.68
|
|
Class
A (with sales charge) |
-0.87
|
-0.09
|
1.29
|
|
Bloomberg
Municipal Bond Index |
4.96
|
1.44
|
2.43
|
For current month-end performance,
please call Franklin Templeton at (800)
DIAL BEN/342-5236 or visit
https://www.franklintempleton.com/investments/options/mutual-funds.
https://www.franklintempleton.com/investments/options/mutual-funds.
Important data provider notices
and terms available at www.franklintempletondatasources.com.
KEY
FUND STATISTICS (as
of February 28, 2026)
|
Total
Net Assets |
$218,144,854
|
|
Total
Number of Portfolio Holdings |
101
|
|
Total
Management Fee Paid |
$1,135,775
|
|
Portfolio
Turnover Rate |
13.78%
|
WHAT
DID THE FUND INVEST IN? (as
of February 28, 2026)
Portfolio Composition*
(% of Total Investments)

WHAT
WERE THE FUND COSTS FOR THE LAST YEAR? (based
on a hypothetical $10,000 investment)
|
Class
Name |
Costs
of a $10,000 investment
|
Costs
paid as a percentage of a $10,000
investment*
|
|
Class
A1 |
$76
|
0.75%
|
HOW
DID THE FUND PERFORM LAST YEAR AND WHAT AFFECTED ITS PERFORMANCE?
For the twelve months ended February
28, 2026, Class A1 shares of
Franklin Louisiana Tax-Free Income Fund returned 3.14%.
The Fund compares its performance
to the Bloomberg Municipal Bond Index, which returned 4.96% for the same period.
PERFORMANCE
HIGHLIGHTS
|
Top
contributors to performance: | |
|
An
overweight to: | |
|
↑
|
A
rated bonds |
|
↑
|
Bonds
with no external credit rating |
|
↑
|
Bonds
with 10 years to maturity |
|
Top
detractors from performance: | |
|
↓
|
Underweight
to bonds with two and five years to maturity |
|
↓
|
Security
selection in BBB rated bonds |
|
↓
|
Security
selection in A rated bonds |
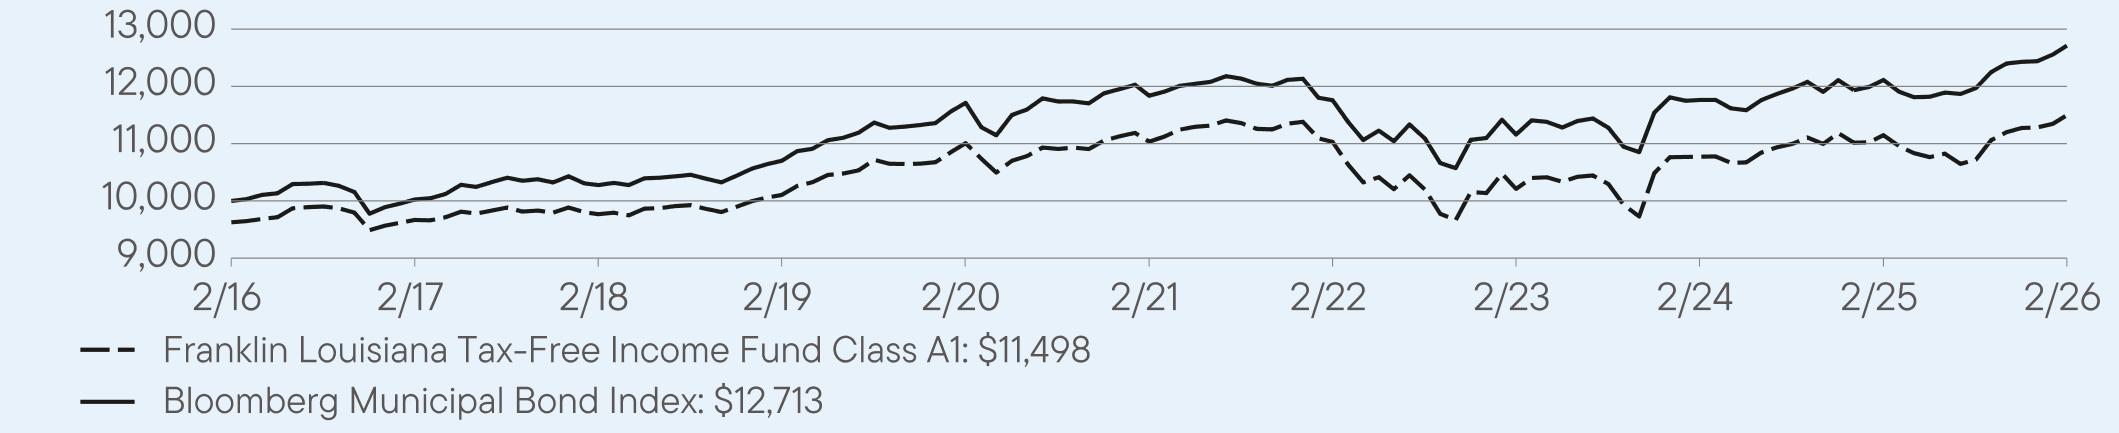
AVERAGE
ANNUAL TOTAL RETURNS (%) Period
Ended February 28, 2026
|
|
1
Year |
5
Year |
10
Year |
|
Class
A1 |
3.14
|
0.83
|
1.80
|
|
Class
A1 (with sales charge) |
-0.73
|
0.06
|
1.41
|
|
Bloomberg
Municipal Bond Index |
4.96
|
1.44
|
2.43
|
For current month-end performance,
please call Franklin Templeton at (800)
DIAL BEN/342-5236 or visit
https://www.franklintempleton.com/investments/options/mutual-funds.
https://www.franklintempleton.com/investments/options/mutual-funds.
Important data provider notices
and terms available at www.franklintempletondatasources.com.
KEY
FUND STATISTICS (as
of February 28, 2026)
|
Total
Net Assets |
$218,144,854
|
|
Total
Number of Portfolio Holdings |
101
|
|
Total
Management Fee Paid |
$1,135,775
|
|
Portfolio
Turnover Rate |
13.78%
|
WHAT
DID THE FUND INVEST IN? (as
of February 28, 2026)
Portfolio Composition*
(% of Total Investments)

WHAT
WERE THE FUND COSTS FOR THE LAST YEAR? (based
on a hypothetical $10,000 investment)
|
Class
Name |
Costs
of a $10,000 investment
|
Costs
paid as a percentage of a $10,000
investment*
|
|
Class
C |
$131
|
1.29%
|
HOW
DID THE FUND PERFORM LAST YEAR AND WHAT AFFECTED ITS PERFORMANCE?
For the twelve months ended February
28, 2026, Class C shares of
Franklin Louisiana Tax-Free Income Fund returned 2.52%.
The Fund compares its performance
to the Bloomberg Municipal Bond Index, which returned 4.96% for the same period.
PERFORMANCE
HIGHLIGHTS
|
Top
contributors to performance: | |
|
An
overweight to: | |
|
↑
|
A
rated bonds |
|
↑
|
Bonds
with no external credit rating |
|
↑
|
Bonds
with 10 years to maturity |
|
Top
detractors from performance: | |
|
↓
|
Underweight
to bonds with two and five years to maturity |
|
↓
|
Security
selection in BBB rated bonds |
|
↓
|
Security
selection in A rated bonds |
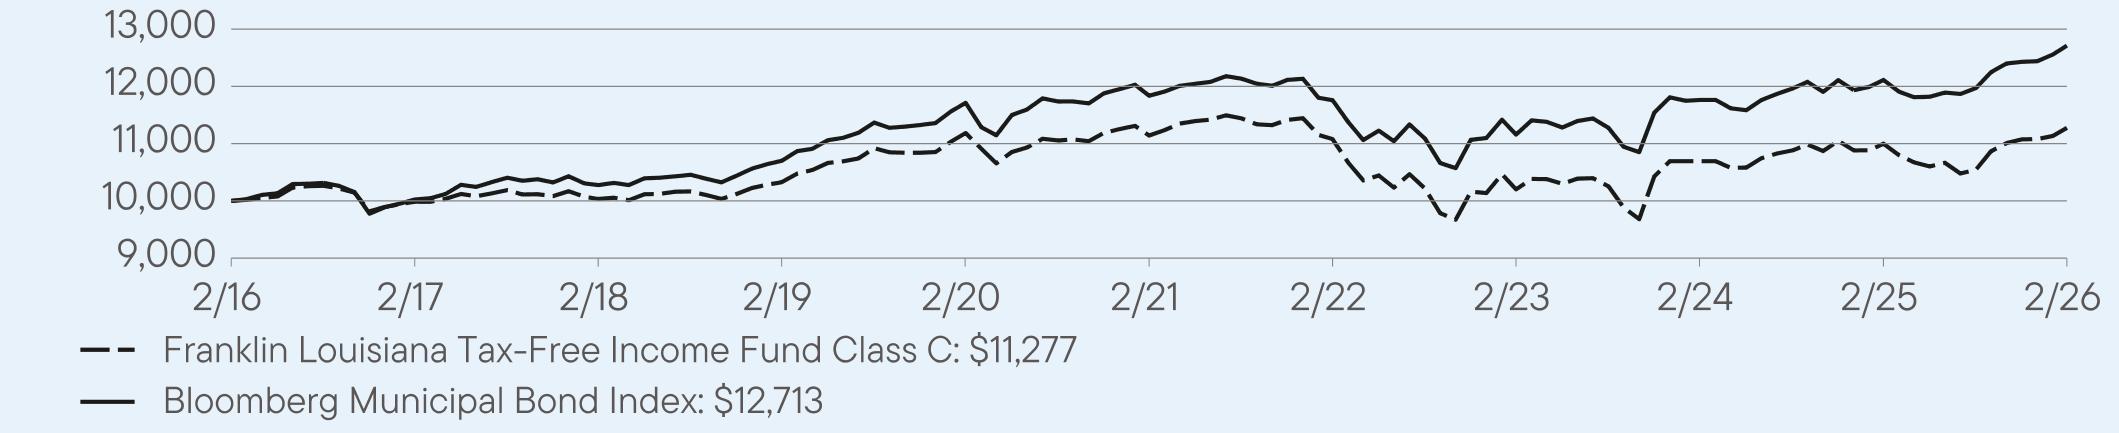
AVERAGE
ANNUAL TOTAL RETURNS (%) Period
Ended February 28, 2026
|
|
1
Year |
5
Year |
10
Year |
|
Class
C |
2.52
|
0.24
|
1.21
|
|
Class
C (with sales charge) |
1.53
|
0.24
|
1.21
|
|
Bloomberg
Municipal Bond Index |
4.96
|
1.44
|
2.43
|
For current month-end performance,
please call Franklin Templeton at (800)
DIAL BEN/342-5236 or visit
https://www.franklintempleton.com/investments/options/mutual-funds.
https://www.franklintempleton.com/investments/options/mutual-funds.
Important data provider notices
and terms available at www.franklintempletondatasources.com.
KEY
FUND STATISTICS (as
of February 28, 2026)
|
Total
Net Assets |
$218,144,854
|
|
Total
Number of Portfolio Holdings |
101
|
|
Total
Management Fee Paid |
$1,135,775
|
|
Portfolio
Turnover Rate |
13.78%
|
WHAT
DID THE FUND INVEST IN? (as
of February 28, 2026)
Portfolio Composition*
(% of Total Investments)
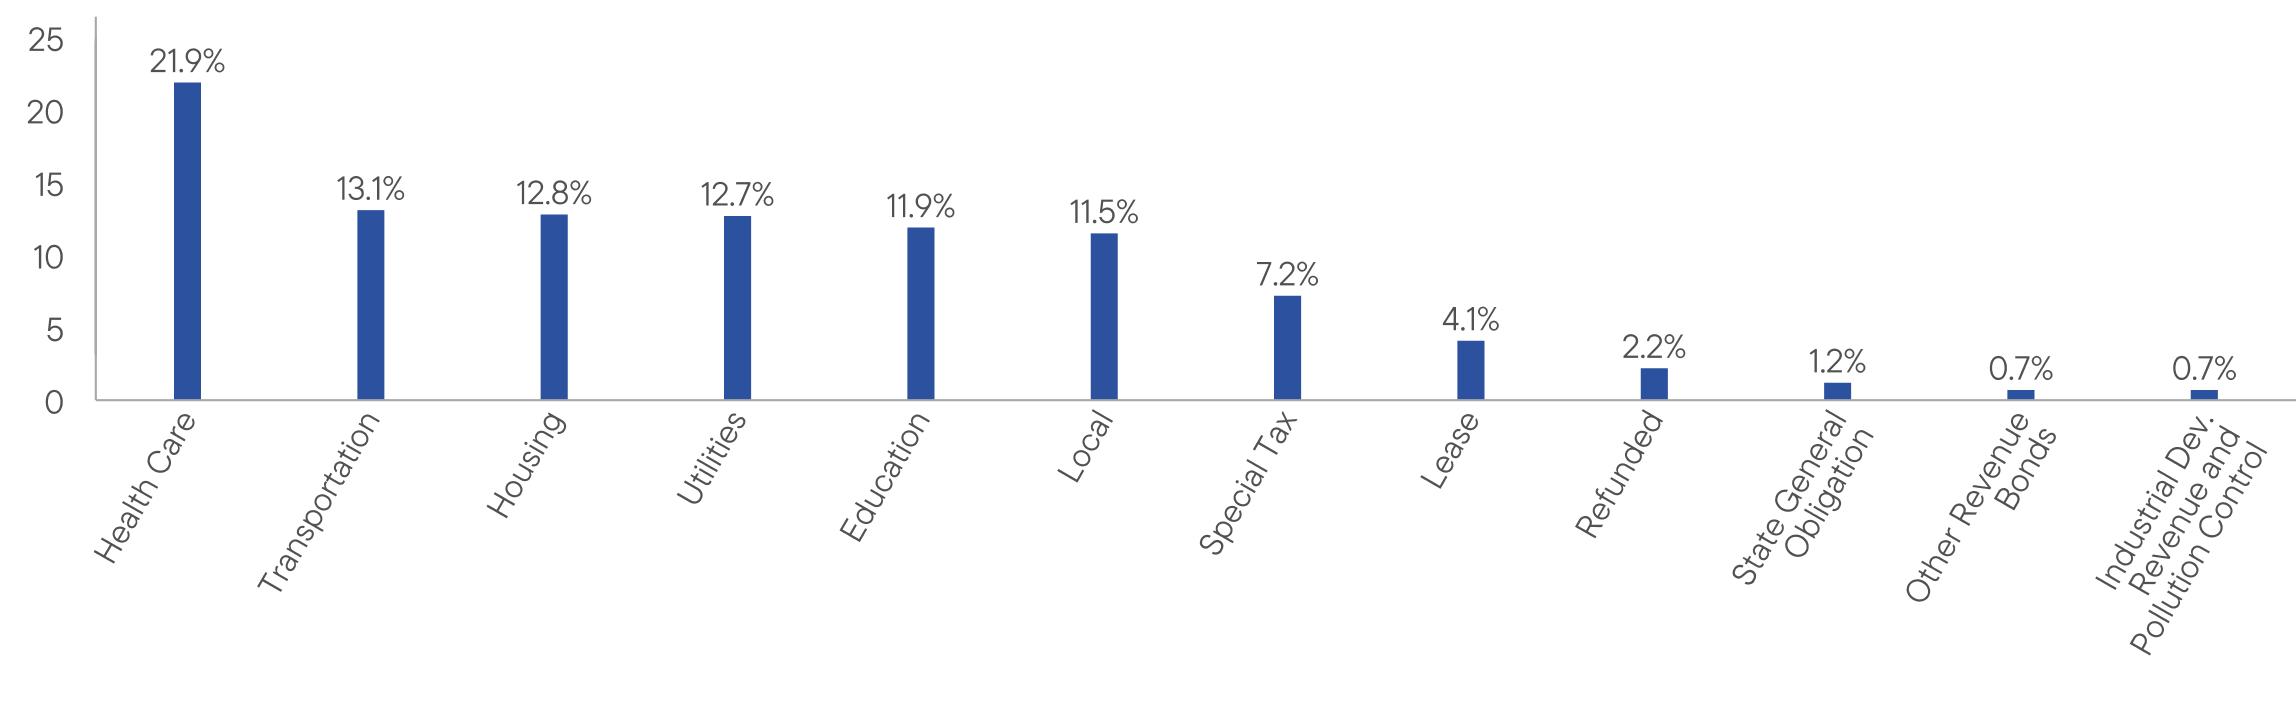
WHAT
WERE THE FUND COSTS FOR THE LAST YEAR? (based
on a hypothetical $10,000 investment)
|
Class
Name |
Costs
of a $10,000 investment
|
Costs
paid as a percentage of a $10,000
investment*
|
|
Class
R6 |
$63
|
0.62%
|
HOW
DID THE FUND PERFORM LAST YEAR AND WHAT AFFECTED ITS PERFORMANCE?
For the twelve months ended February
28, 2026, Class R6 shares of
Franklin Louisiana Tax-Free Income Fund returned 3.28%.
The Fund compares its performance
to the Bloomberg Municipal Bond Index, which returned 4.96% for the same period.
PERFORMANCE
HIGHLIGHTS
|
Top
contributors to performance: | |
|
An
overweight to: | |
|
↑
|
A
rated bonds |
|
↑
|
Bonds
with no external credit rating |
|
↑
|
Bonds
with 10 years to maturity |
|
Top
detractors from performance: | |
|
↓
|
Underweight
to bonds with two and five years to maturity |
|
↓
|
Security
selection in BBB rated bonds |
|
↓
|
Security
selection in A rated bonds |
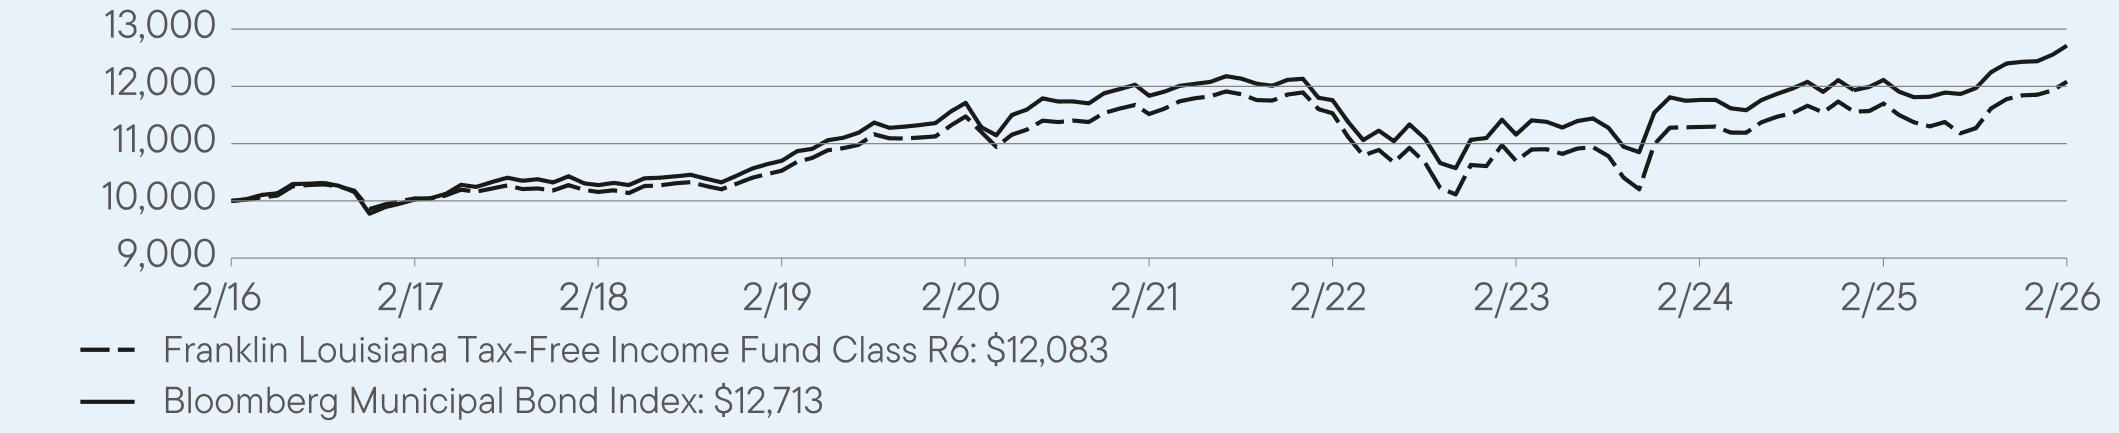
AVERAGE
ANNUAL TOTAL RETURNS (%) Period
Ended February 28, 2026
|
|
1
Year |
5
Year |
10
Year |
|
Class
R6 |
3.28
|
0.96
|
1.92
|
|
Bloomberg
Municipal Bond Index |
4.96
|
1.44
|
2.43
|
For current month-end performance,
please call Franklin Templeton at (800)
DIAL BEN/342-5236 or visit
https://www.franklintempleton.com/investments/options/mutual-funds.
https://www.franklintempleton.com/investments/options/mutual-funds.
Important data provider notices
and terms available at www.franklintempletondatasources.com.
KEY
FUND STATISTICS (as
of February 28, 2026)
|
Total
Net Assets |
$218,144,854
|
|
Total
Number of Portfolio Holdings |
101
|
|
Total
Management Fee Paid |
$1,135,775
|
|
Portfolio
Turnover Rate |
13.78%
|
WHAT
DID THE FUND INVEST IN? (as
of February 28, 2026)
Portfolio Composition*
(% of Total Investments)

WHAT
WERE THE FUND COSTS FOR THE LAST YEAR? (based
on a hypothetical $10,000 investment)
|
Class
Name |
Costs
of a $10,000 investment
|
Costs
paid as a percentage of a $10,000
investment*
|
|
Advisor
Class |
$66
|
0.65%
|
HOW
DID THE FUND PERFORM LAST YEAR AND WHAT AFFECTED ITS PERFORMANCE?
For the twelve months ended February
28, 2026, Advisor Class shares
of Franklin Louisiana Tax-Free Income Fund returned 3.24%.
The Fund compares its performance
to the Bloomberg Municipal Bond Index, which returned 4.96% for the same period.
PERFORMANCE
HIGHLIGHTS
|
Top
contributors to performance: | |
|
An
overweight to: | |
|
↑
|
A
rated bonds |
|
↑
|
Bonds
with no external credit rating |
|
↑
|
Bonds
with 10 years to maturity |
|
Top
detractors from performance: | |
|
↓
|
Underweight
to bonds with two and five years to maturity |
|
↓
|
Security
selection in BBB rated bonds |
|
↓
|
Security
selection in A rated bonds |
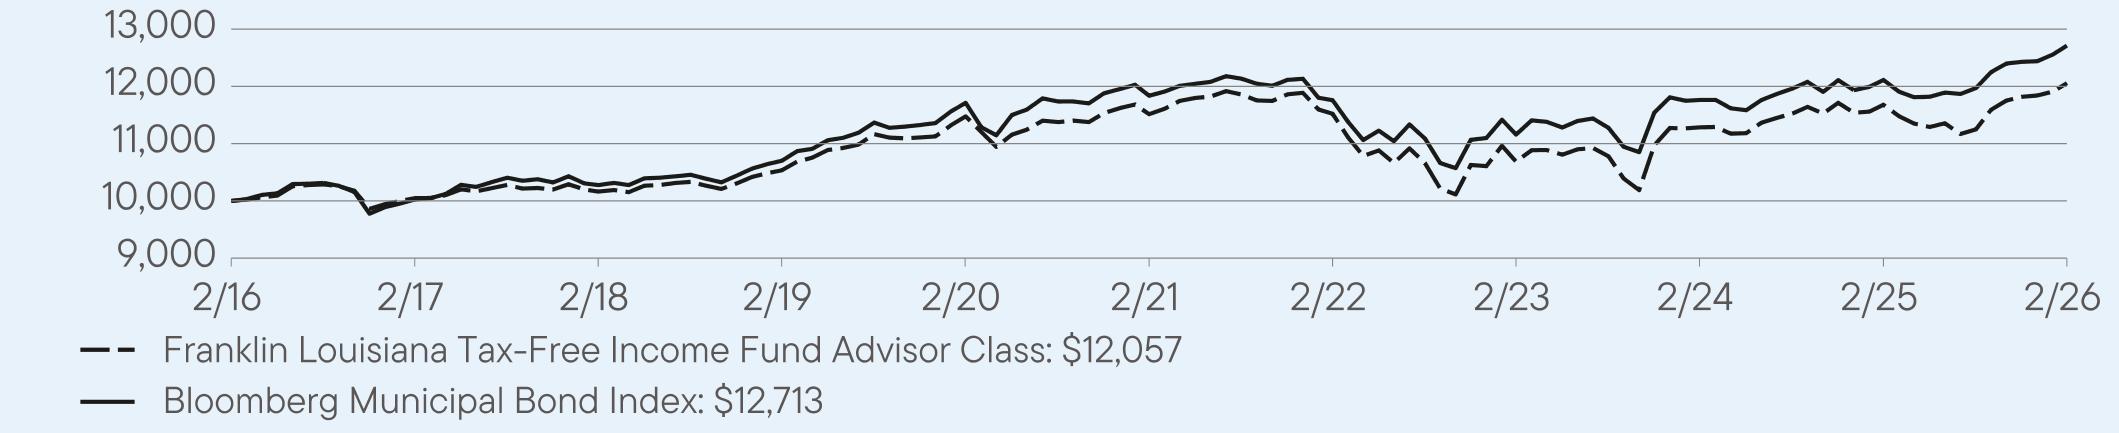
AVERAGE
ANNUAL TOTAL RETURNS (%) Period
Ended February 28, 2026
|
|
1
Year |
5
Year |
10
Year |
|
Advisor
Class |
3.24
|
0.93
|
1.89
|
|
Bloomberg
Municipal Bond Index |
4.96
|
1.44
|
2.43
|
For current month-end performance,
please call Franklin Templeton at (800)
DIAL BEN/342-5236 or visit
https://www.franklintempleton.com/investments/options/mutual-funds.
https://www.franklintempleton.com/investments/options/mutual-funds.
Important data provider notices
and terms available at www.franklintempletondatasources.com.
KEY
FUND STATISTICS (as
of February 28, 2026)
|
Total
Net Assets |
$218,144,854
|
|
Total
Number of Portfolio Holdings |
101
|
|
Total
Management Fee Paid |
$1,135,775
|
|
Portfolio
Turnover Rate |
13.78%
|
WHAT
DID THE FUND INVEST IN? (as
of February 28, 2026)
Portfolio Composition*
(% of Total Investments)

WHAT
WERE THE FUND COSTS FOR THE LAST YEAR? (based
on a hypothetical $10,000 investment)
|
Class
Name |
Costs
of a $10,000 investment
|
Costs
paid as a percentage of a $10,000
investment*
|
|
Class
A |
$91
|
0.90%
|
HOW
DID THE FUND PERFORM LAST YEAR AND WHAT AFFECTED ITS PERFORMANCE?
For the twelve months ended February
28, 2026, Class A shares of
Franklin Maryland Tax-Free Income Fund returned 3.17%.
The Fund compares its performance
to the Bloomberg Municipal Bond Index, which returned 4.96% for the same period.
PERFORMANCE
HIGHLIGHTS
|
Top
contributors to performance: | |
|
↑
|
Overweight
to bonds with no external credit rating |
|
↑
|
Overweight
to bonds with 20 years to maturity |
|
↑
|
Selection
in AAA rated bonds |
|
Top
detractors from performance: | |
|
↓
|
Underweight
to bonds with two, five and 10 years to maturity |
|
↓
|
Security
selection in BBB rated bonds |
|
↓
|
Security
selection in AA rated bonds |
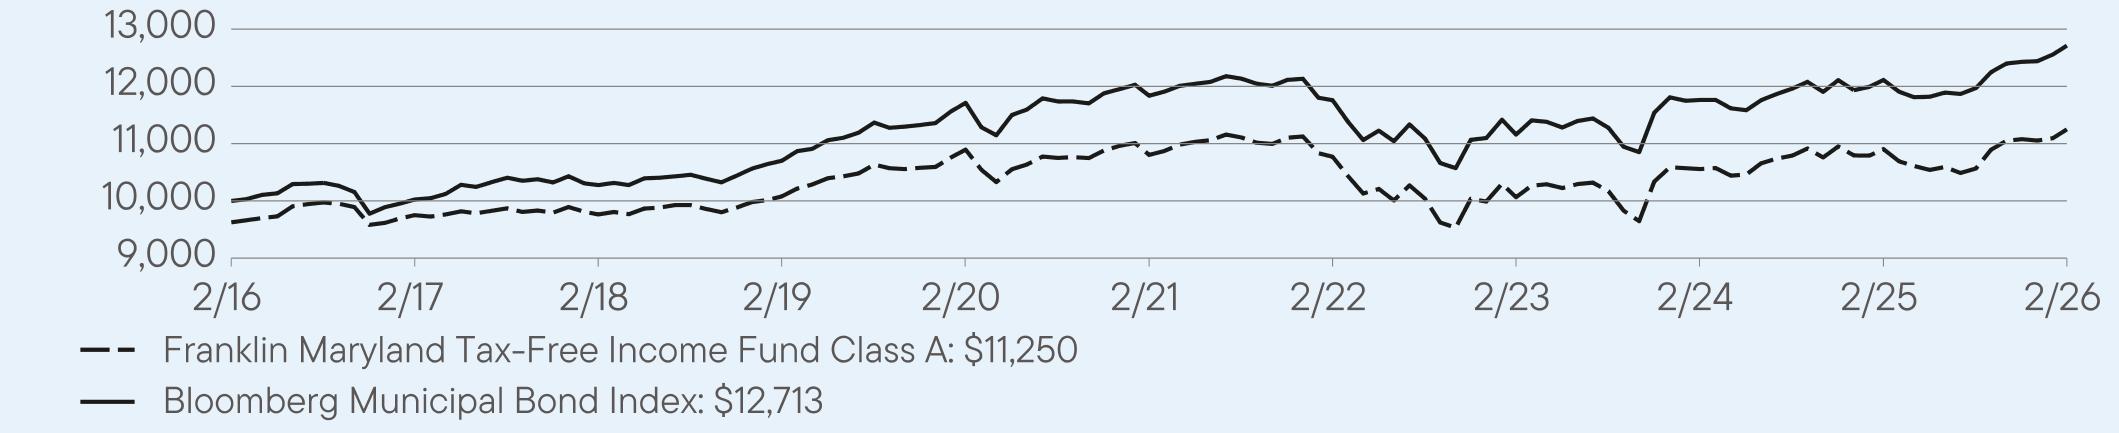
AVERAGE
ANNUAL TOTAL RETURNS (%) Period
Ended February 28, 2026
|
|
1
Year |
5
Year |
10
Year |
|
Class
A |
3.17
|
0.81
|
1.60
|
|
Class
A (with sales charge) |
-0.70
|
0.05
|
1.21
|
|
Bloomberg
Municipal Bond Index |
4.96
|
1.44
|
2.43
|
For current month-end performance,
please call Franklin Templeton at (800)
DIAL BEN/342-5236 or visit
https://www.franklintempleton.com/investments/options/mutual-funds.
https://www.franklintempleton.com/investments/options/mutual-funds.
Important data provider notices
and terms available at www.franklintempletondatasources.com.
KEY
FUND STATISTICS (as
of February 28, 2026)
|
Total
Net Assets |
$317,483,248
|
|
Total
Number of Portfolio Holdings |
104
|
|
Total
Management Fee Paid |
$1,635,104
|
|
Portfolio
Turnover Rate |
20.14%
|
WHAT
DID THE FUND INVEST IN? (as
of February 28, 2026)
Portfolio Composition*
(% of Total Investments)

WHAT
WERE THE FUND COSTS FOR THE LAST YEAR? (based
on a hypothetical $10,000 investment)
|
Class
Name |
Costs
of a $10,000 investment
|
Costs
paid as a percentage of a $10,000
investment*
|
|
Class
A1 |
$76
|
0.75%
|
HOW
DID THE FUND PERFORM LAST YEAR AND WHAT AFFECTED ITS PERFORMANCE?
For the twelve months ended February
28, 2026, Class A1 shares of
Franklin Maryland Tax-Free Income Fund returned 3.32%.
The Fund compares its performance
to the Bloomberg Municipal Bond Index, which returned 4.96% for the same period.
PERFORMANCE
HIGHLIGHTS
|
Top
contributors to performance: | |
|
↑
|
Overweight
to bonds with no external credit rating |
|
↑
|
Overweight
to bonds with 20 years to maturity |
|
↑
|
Selection
in AAA rated bonds |
|
Top
detractors from performance: | |
|
↓
|
Underweight
to bonds with two, five and 10 years to maturity |
|
↓
|
Security
selection in BBB rated bonds |
|
↓
|
Security
selection in AA rated bonds |
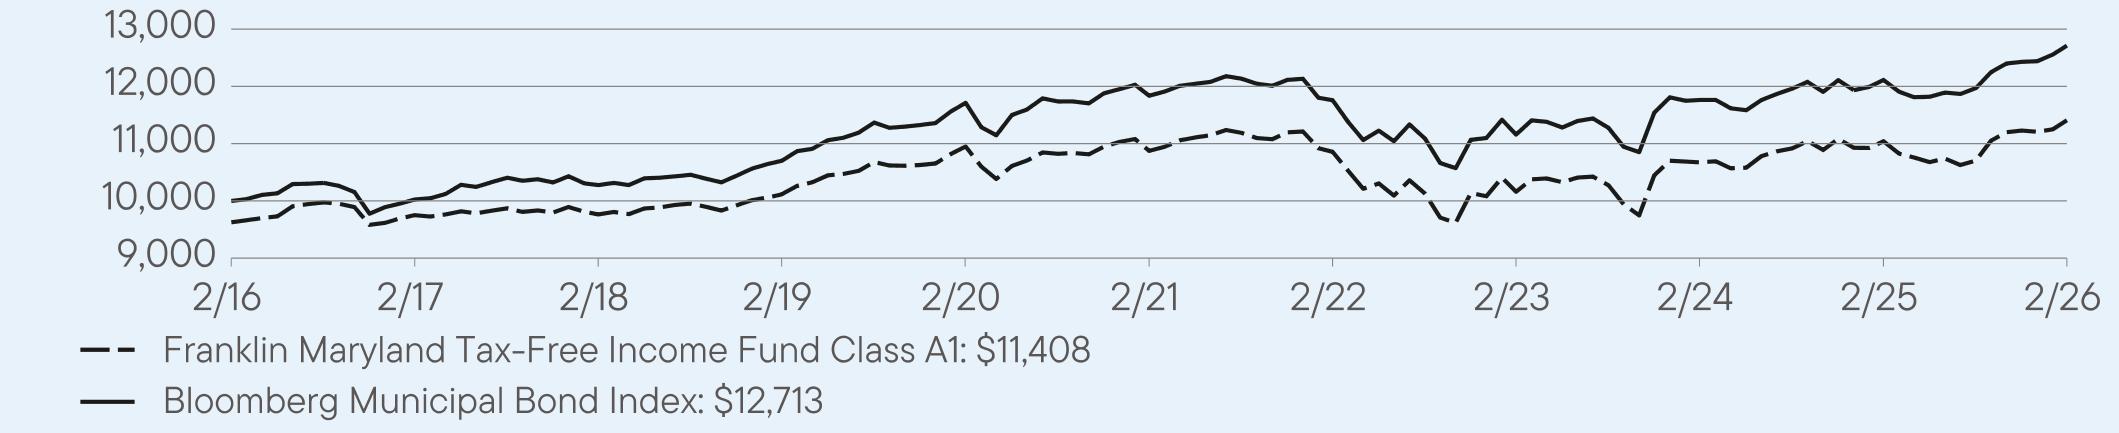
AVERAGE
ANNUAL TOTAL RETURNS (%) Period
Ended February 28, 2026
|
|
1
Year |
5
Year |
10
Year |
|
Class
A1 |
3.32
|
0.96
|
1.72
|
|
Class
A1 (with sales charge) |
-0.59
|
0.19
|
1.33
|
|
Bloomberg
Municipal Bond Index |
4.96
|
1.44
|
2.43
|
For current month-end performance,
please call Franklin Templeton at (800)
DIAL BEN/342-5236 or visit
https://www.franklintempleton.com/investments/options/mutual-funds.
https://www.franklintempleton.com/investments/options/mutual-funds.
Important data provider notices
and terms available at www.franklintempletondatasources.com.
KEY
FUND STATISTICS (as
of February 28, 2026)
|
Total
Net Assets |
$317,483,248
|
|
Total
Number of Portfolio Holdings |
104
|
|
Total
Management Fee Paid |
$1,635,104
|
|
Portfolio
Turnover Rate |
20.14%
|
WHAT
DID THE FUND INVEST IN? (as
of February 28, 2026)
Portfolio Composition*
(% of Total Investments)
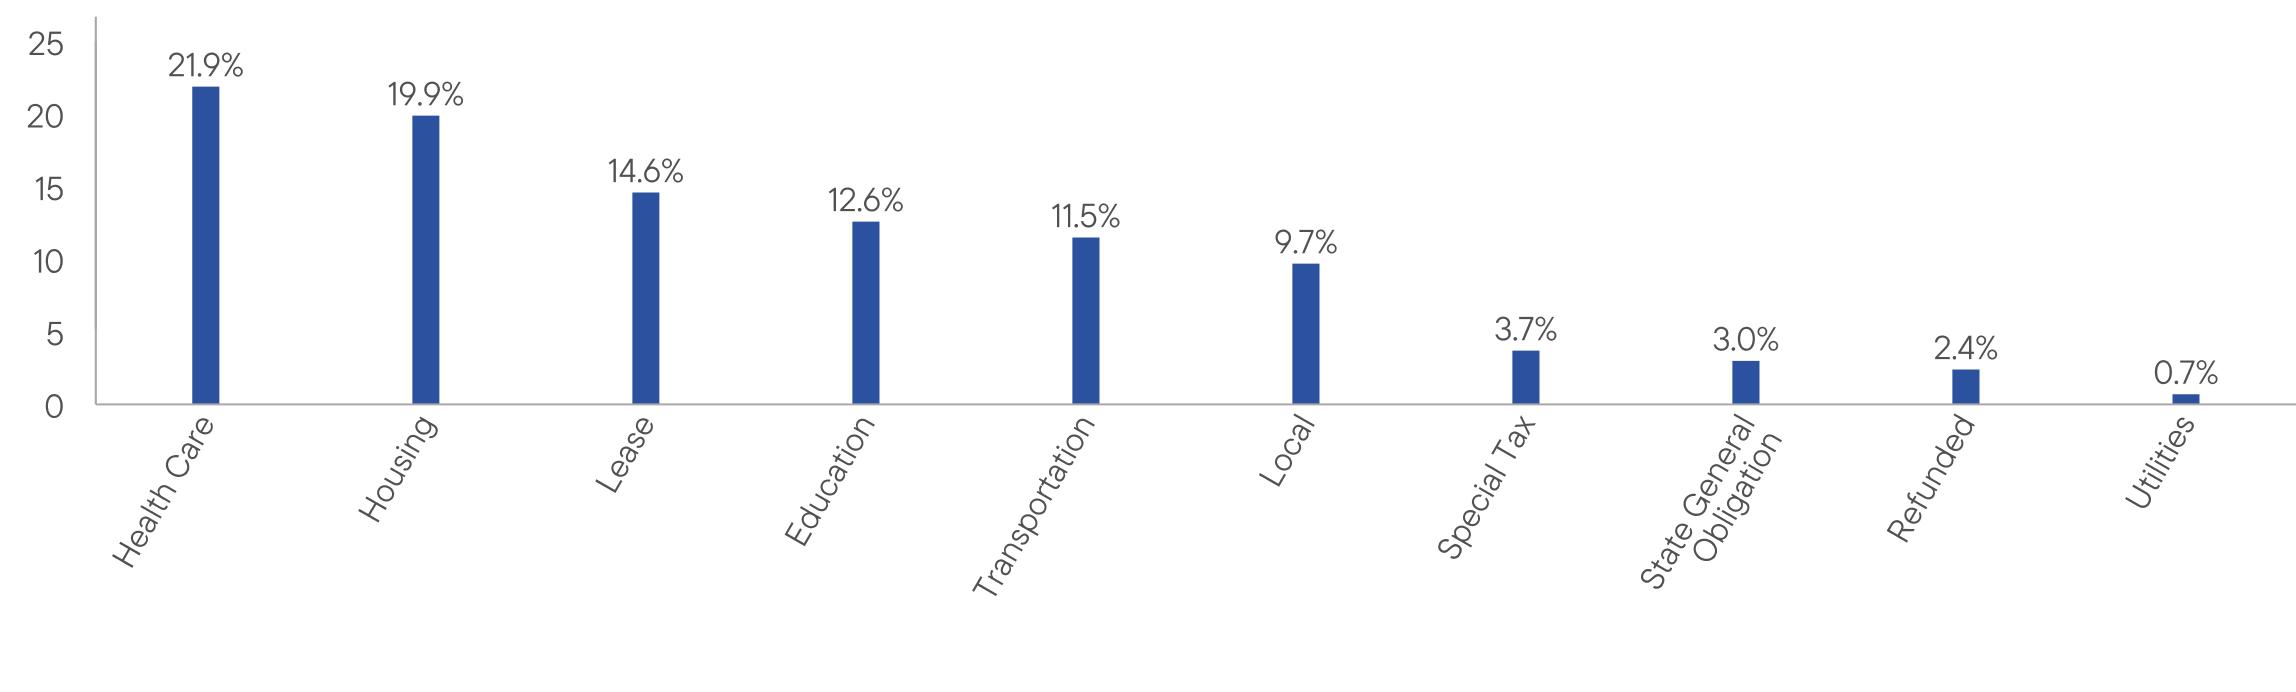
WHAT
WERE THE FUND COSTS FOR THE LAST YEAR? (based
on a hypothetical $10,000 investment)
|
Class
Name |
Costs
of a $10,000 investment
|
Costs
paid as a percentage of a $10,000
investment*
|
|
Class
C |
$131
|
1.29%
|
HOW
DID THE FUND PERFORM LAST YEAR AND WHAT AFFECTED ITS PERFORMANCE?
For the twelve months ended February
28, 2026, Class C shares of
Franklin Maryland Tax-Free Income Fund returned 2.58%.
The Fund compares its performance
to the Bloomberg Municipal Bond Index, which returned 4.96% for the same period.
PERFORMANCE
HIGHLIGHTS
|
Top
contributors to performance: | |
|
↑
|
Overweight
to bonds with no external credit rating |
|
↑
|
Overweight
to bonds with 20 years to maturity |
|
↑
|
Selection
in AAA rated bonds |
|
Top
detractors from performance: | |
|
↓
|
Underweight
to bonds with two, five and 10 years to maturity |
|
↓
|
Security
selection in BBB rated bonds |
|
↓
|
Security
selection in AA rated bonds |
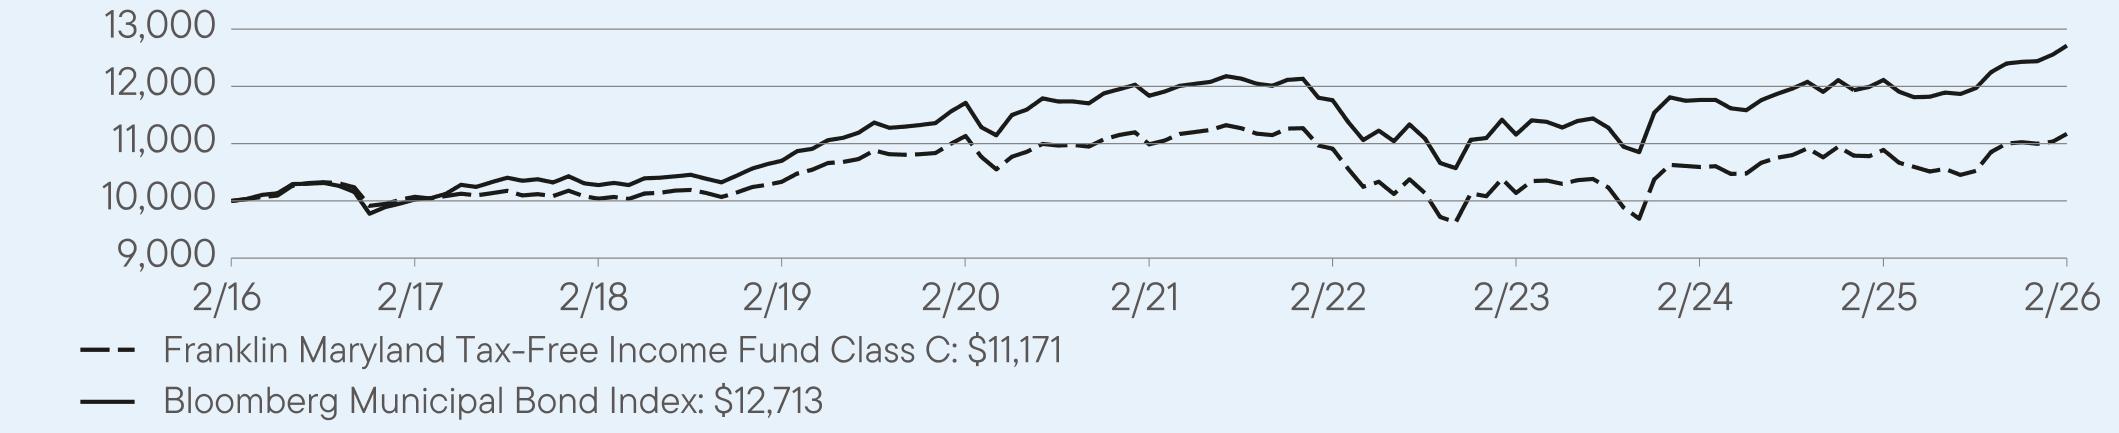
AVERAGE
ANNUAL TOTAL RETURNS (%) Period
Ended February 28, 2026
|
|
1
Year |
5
Year |
10
Year |
|
Class
C |
2.58
|
0.33
|
1.12
|
|
Class
C (with sales charge) |
1.58
|
0.33
|
1.12
|
|
Bloomberg
Municipal Bond Index |
4.96
|
1.44
|
2.43
|
For current month-end performance,
please call Franklin Templeton at (800)
DIAL BEN/342-5236 or visit
https://www.franklintempleton.com/investments/options/mutual-funds.
https://www.franklintempleton.com/investments/options/mutual-funds.
Important data provider notices
and terms available at www.franklintempletondatasources.com.
KEY
FUND STATISTICS (as
of February 28, 2026)
|
Total
Net Assets |
$317,483,248
|
|
Total
Number of Portfolio Holdings |
104
|
|
Total
Management Fee Paid |
$1,635,104
|
|
Portfolio
Turnover Rate |
20.14%
|
WHAT
DID THE FUND INVEST IN? (as
of February 28, 2026)
Portfolio Composition*
(% of Total Investments)

WHAT
WERE THE FUND COSTS FOR THE LAST YEAR? (based
on a hypothetical $10,000 investment)
|
Class
Name |
Costs
of a $10,000 investment
|
Costs
paid as a percentage of a $10,000
investment |
|
Class
R6 |
$61
|
0.60%
|
HOW
DID THE FUND PERFORM LAST YEAR AND WHAT AFFECTED ITS PERFORMANCE?
For the twelve months ended February
28, 2026, Class R6 shares of
Franklin Maryland Tax-Free Income Fund returned 3.47%.
The Fund compares its performance
to the Bloomberg Municipal Bond Index, which returned 4.96% for the same period.
PERFORMANCE
HIGHLIGHTS
|
Top
contributors to performance: | |
|
↑
|
Overweight
to bonds with no external credit rating |
|
↑
|
Overweight
to bonds with 20 years to maturity |
|
↑
|
Selection
in AAA rated bonds |
|
Top
detractors from performance: | |
|
↓
|
Underweight
to bonds with two, five and 10 years to maturity |
|
↓
|
Security
selection in BBB rated bonds |
|
↓
|
Security
selection in AA rated bonds |
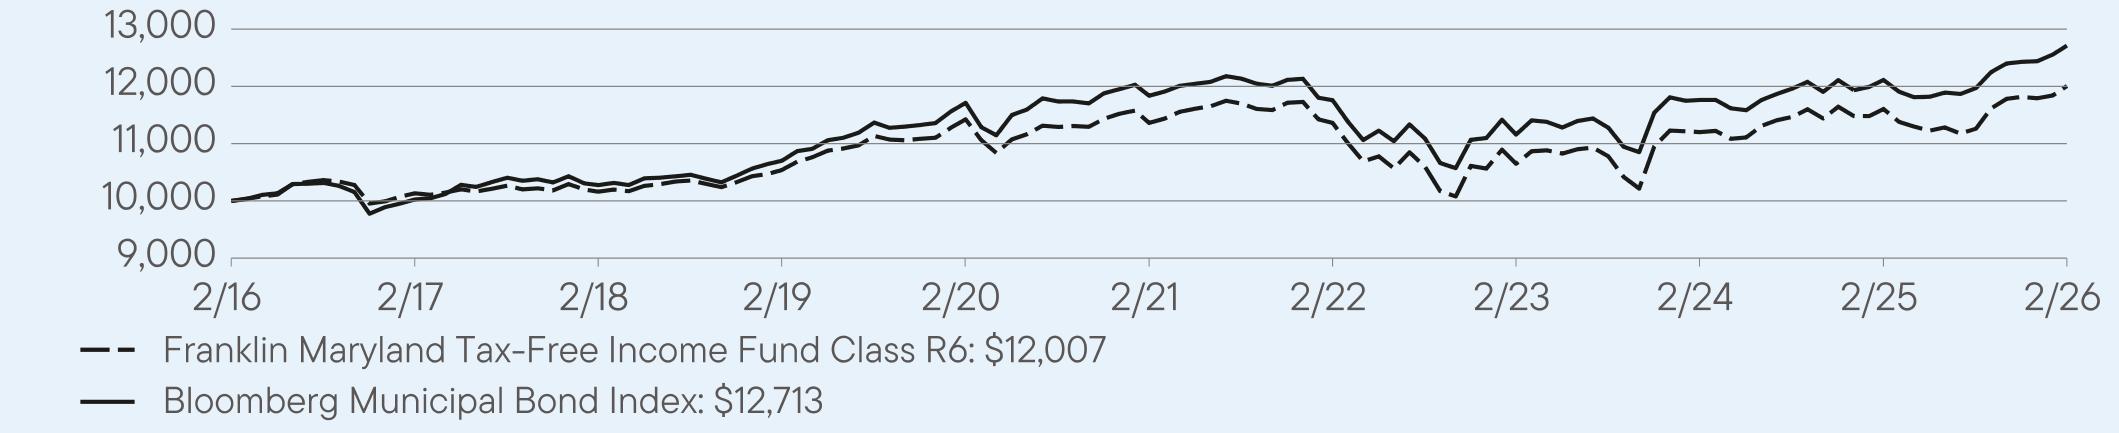
AVERAGE
ANNUAL TOTAL RETURNS (%) Period
Ended February 28, 2026
|
|
1
Year |
5
Year |
10
Year |
|
Class
R6 |
3.47
|
1.11
|
1.87
|
|
Bloomberg
Municipal Bond Index |
4.96
|
1.44
|
2.43
|
For current month-end performance,
please call Franklin Templeton at (800)
DIAL BEN/342-5236 or visit
https://www.franklintempleton.com/investments/options/mutual-funds.
https://www.franklintempleton.com/investments/options/mutual-funds.
Important data provider notices
and terms available at www.franklintempletondatasources.com.
KEY
FUND STATISTICS (as
of February 28, 2026)
|
Total
Net Assets |
$317,483,248
|
|
Total
Number of Portfolio Holdings |
104
|
|
Total
Management Fee Paid |
$1,635,104
|
|
Portfolio
Turnover Rate |
20.14%
|
WHAT
DID THE FUND INVEST IN? (as
of February 28, 2026)
Portfolio Composition*
(% of Total Investments)

WHAT
WERE THE FUND COSTS FOR THE LAST YEAR? (based
on a hypothetical $10,000 investment)
|
Class
Name |
Costs
of a $10,000 investment
|
Costs
paid as a percentage of a $10,000
investment*
|
|
Advisor
Class |
$66
|
0.65%
|
HOW
DID THE FUND PERFORM LAST YEAR AND WHAT AFFECTED ITS PERFORMANCE?
For the twelve months ended February
28, 2026, Advisor Class shares
of Franklin Maryland Tax-Free Income Fund returned 3.42%.
The Fund compares its performance
to the Bloomberg Municipal Bond Index, which returned 4.96% for the same period.
PERFORMANCE
HIGHLIGHTS
|
Top
contributors to performance: | |
|
↑
|
Overweight
to bonds with no external credit rating |
|
↑
|
Overweight
to bonds with 20 years to maturity |
|
↑
|
Selection
in AAA rated bonds |
|
Top
detractors from performance: | |
|
↓
|
Underweight
to bonds with two, five and 10 years to maturity |
|
↓
|
Security
selection in BBB rated bonds |
|
↓
|
Security
selection in AA rated bonds |

AVERAGE
ANNUAL TOTAL RETURNS (%) Period
Ended February 28, 2026
|
|
1
Year |
5
Year |
10
Year |
|
Advisor
Class |
3.42
|
1.06
|
1.82
|
|
Bloomberg
Municipal Bond Index |
4.96
|
1.44
|
2.43
|
For current month-end performance,
please call Franklin Templeton at (800)
DIAL BEN/342-5236 or visit
https://www.franklintempleton.com/investments/options/mutual-funds.
https://www.franklintempleton.com/investments/options/mutual-funds.
Important data provider notices
and terms available at www.franklintempletondatasources.com.
KEY
FUND STATISTICS (as
of February 28, 2026)
|
Total
Net Assets |
$317,483,248
|
|
Total
Number of Portfolio Holdings |
104
|
|
Total
Management Fee Paid |
$1,635,104
|
|
Portfolio
Turnover Rate |
20.14%
|
WHAT
DID THE FUND INVEST IN? (as
of February 28, 2026)
Portfolio Composition*
(% of Total Investments)

WHAT
WERE THE FUND COSTS FOR THE LAST YEAR? (based
on a hypothetical $10,000 investment)
|
Class
Name |
Costs
of a $10,000 investment
|
Costs
paid as a percentage of a $10,000
investment*
|
|
Class
A |
$92
|
0.90%
|
HOW
DID THE FUND PERFORM LAST YEAR AND WHAT AFFECTED ITS PERFORMANCE?
For the twelve months ended February
28, 2026, Class A shares of
Franklin Massachusetts Tax-Free Income Fund returned 3.61%.
The Fund compares its performance
to the Bloomberg Municipal Bond Index, which returned 4.96% for the same period.
PERFORMANCE
HIGHLIGHTS
|
Top
contributors to performance: | |
|
An
overweight allocation to: | |
|
↑
|
Bonds
with 20 years to maturity |
|
↑
|
Bonds
with no external credit rating |
|
↑
|
A
rated bonds |
|
Top
detractors from performance: | |
|
↓
|
Underweight
to bonds with 10 years or less to maturity |
|
↓
|
Overweight
duration to bonds with 30 years to maturity |
|
↓
|
Selection
in A rated bonds |

AVERAGE
ANNUAL TOTAL RETURNS (%) Period
Ended February 28, 2026
|
|
1
Year |
5
Year |
10
Year |
|
Class
A |
3.61
|
0.35
|
1.53
|
|
Class
A (with sales charge) |
-0.27
|
-0.41
|
1.14
|
|
Bloomberg
Municipal Bond Index |
4.96
|
1.44
|
2.43
|
For current month-end performance,
please call Franklin Templeton at (800)
DIAL BEN/342-5236 or visit
https://www.franklintempleton.com/investments/options/mutual-funds.
https://www.franklintempleton.com/investments/options/mutual-funds.
Important data provider notices
and terms available at www.franklintempletondatasources.com.
KEY
FUND STATISTICS (as
of February 28, 2026)
|
Total
Net Assets |
$339,450,651
|
|
Total
Number of Portfolio Holdings |
113
|
|
Total
Management Fee Paid |
$1,665,136
|
|
Portfolio
Turnover Rate |
21.12%
|
WHAT
DID THE FUND INVEST IN? (as
of February 28, 2026)
Portfolio Composition*
(% of Total Investments)

WHAT
WERE THE FUND COSTS FOR THE LAST YEAR? (based
on a hypothetical $10,000 investment)
|
Class
Name |
Costs
of a $10,000 investment
|
Costs
paid as a percentage of a $10,000
investment*
|
|
Class
A1 |
$76
|
0.75%
|
HOW
DID THE FUND PERFORM LAST YEAR AND WHAT AFFECTED ITS PERFORMANCE?
For the twelve months ended February
28, 2026, Class A1 shares of
Franklin Massachusetts Tax-Free Income Fund returned 3.77%.
The Fund compares its performance
to the Bloomberg Municipal Bond Index, which returned 4.96% for the same period.
PERFORMANCE
HIGHLIGHTS
|
Top
contributors to performance: | |
|
An
overweight allocation to: | |
|
↑
|
Bonds
with 20 years to maturity |
|
↑
|
Bonds
with no external credit rating |
|
↑
|
A
rated bonds |
|
Top
detractors from performance: | |
|
↓
|
Underweight
to bonds with 10 years or less to maturity |
|
↓
|
Overweight
duration to bonds with 30 years to maturity |
|
↓
|
Selection
in A rated bonds |
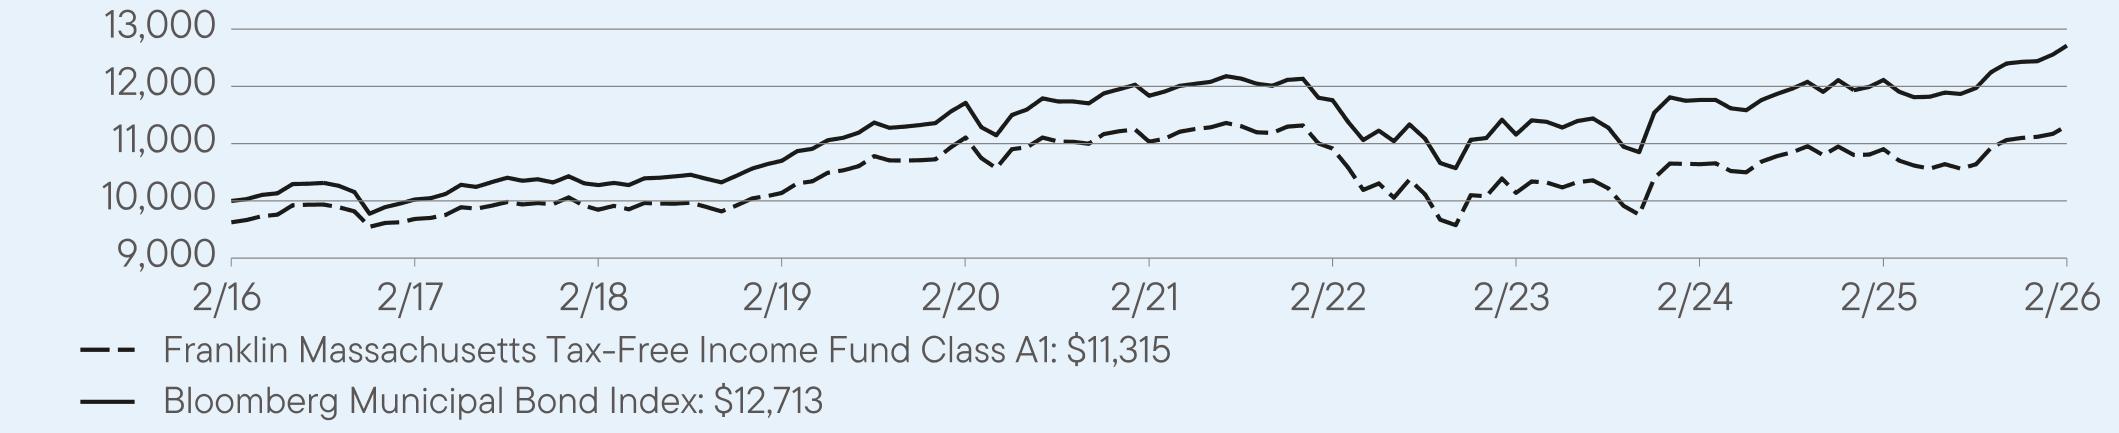
AVERAGE
ANNUAL TOTAL RETURNS (%) Period
Ended February 28, 2026
|
|
1
Year |
5
Year |
10
Year |
|
Class
A1 |
3.77
|
0.50
|
1.63
|
|
Class
A1 (with sales charge) |
-0.10
|
-0.26
|
1.24
|
|
Bloomberg
Municipal Bond Index |
4.96
|
1.44
|
2.43
|
For current month-end performance,
please call Franklin Templeton at (800)
DIAL BEN/342-5236 or visit
https://www.franklintempleton.com/investments/options/mutual-funds.
https://www.franklintempleton.com/investments/options/mutual-funds.
Important data provider notices
and terms available at www.franklintempletondatasources.com.
KEY
FUND STATISTICS (as
of February 28, 2026)
|
Total
Net Assets |
$339,450,651
|
|
Total
Number of Portfolio Holdings |
113
|
|
Total
Management Fee Paid |
$1,665,136
|
|
Portfolio
Turnover Rate |
21.12%
|
WHAT
DID THE FUND INVEST IN? (as
of February 28, 2026)
Portfolio Composition*
(% of Total Investments)

WHAT
WERE THE FUND COSTS FOR THE LAST YEAR? (based
on a hypothetical $10,000 investment)
|
Class
Name |
Costs
of a $10,000 investment
|
Costs
paid as a percentage of a $10,000
investment*
|
|
Class
C |
$131
|
1.29%
|
HOW
DID THE FUND PERFORM LAST YEAR AND WHAT AFFECTED ITS PERFORMANCE?
For the twelve months ended February
28, 2026, Class C shares of
Franklin Massachusetts Tax-Free Income Fund returned 3.15%.
The Fund compares its performance
to the Bloomberg Municipal Bond Index, which returned 4.96% for the same period.
PERFORMANCE
HIGHLIGHTS
|
Top
contributors to performance: | |
|
An
overweight allocation to: | |
|
↑
|
Bonds
with 20 years to maturity |
|
↑
|
Bonds
with no external credit rating |
|
↑
|
A
rated bonds |
|
Top
detractors from performance: | |
|
↓
|
Underweight
to bonds with 10 years or less to maturity |
|
↓
|
Overweight
duration to bonds with 30 years to maturity |
|
↓
|
Selection
in A rated bonds |
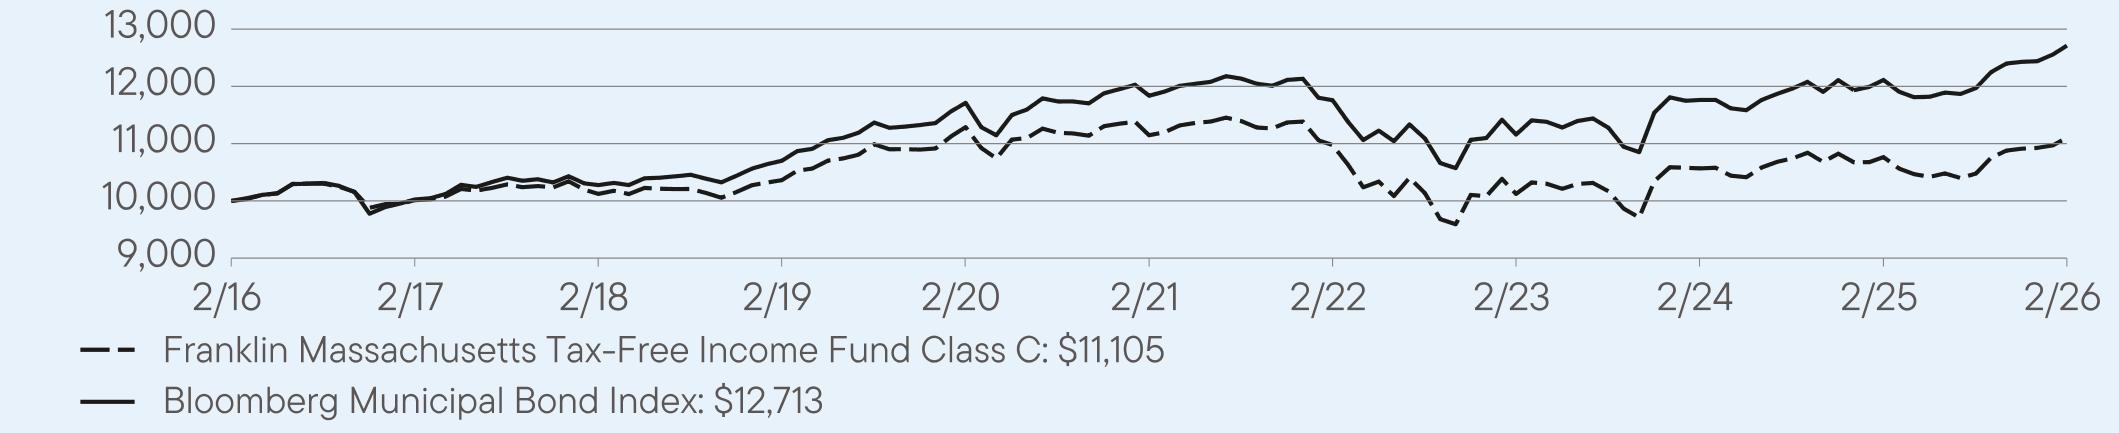
AVERAGE
ANNUAL TOTAL RETURNS (%) Period
Ended February 28, 2026
|
|
1
Year |
5
Year |
10
Year |
|
Class
C |
3.15
|
-0.07
|
1.06
|
|
Class
C (with sales charge) |
2.15
|
-0.07
|
1.06
|
|
Bloomberg
Municipal Bond Index |
4.96
|
1.44
|
2.43
|
For current month-end performance,
please call Franklin Templeton at (800)
DIAL BEN/342-5236 or visit
https://www.franklintempleton.com/investments/options/mutual-funds.
https://www.franklintempleton.com/investments/options/mutual-funds.
Important data provider notices
and terms available at www.franklintempletondatasources.com.
KEY
FUND STATISTICS (as
of February 28, 2026)
|
Total
Net Assets |
$339,450,651
|
|
Total
Number of Portfolio Holdings |
113
|
|
Total
Management Fee Paid |
$1,665,136
|
|
Portfolio
Turnover Rate |
21.12%
|
WHAT
DID THE FUND INVEST IN? (as
of February 28, 2026)
Portfolio Composition*
(% of Total Investments)

WHAT
WERE THE FUND COSTS FOR THE LAST YEAR? (based
on a hypothetical $10,000 investment)
|
Class
Name |
Costs
of a $10,000 investment
|
Costs
paid as a percentage of a $10,000
investment |
|
Class
R6 |
$61
|
0.60%
|
HOW
DID THE FUND PERFORM LAST YEAR AND WHAT AFFECTED ITS PERFORMANCE?
For the twelve months ended February
28, 2026, Class R6 shares of
Franklin Massachusetts Tax-Free Income Fund returned 3.92%.
The Fund compares its performance
to the Bloomberg Municipal Bond Index, which returned 4.96% for the same period.
PERFORMANCE
HIGHLIGHTS
|
Top
contributors to performance: | |
|
An
overweight allocation to: | |
|
↑
|
Bonds
with 20 years to maturity |
|
↑
|
Bonds
with no external credit rating |
|
↑
|
A
rated bonds |
|
Top
detractors from performance: | |
|
↓
|
Underweight
to bonds with 10 years or less to maturity |
|
↓
|
Overweight
duration to bonds with 30 years to maturity |
|
↓
|
Selection
in A rated bonds |
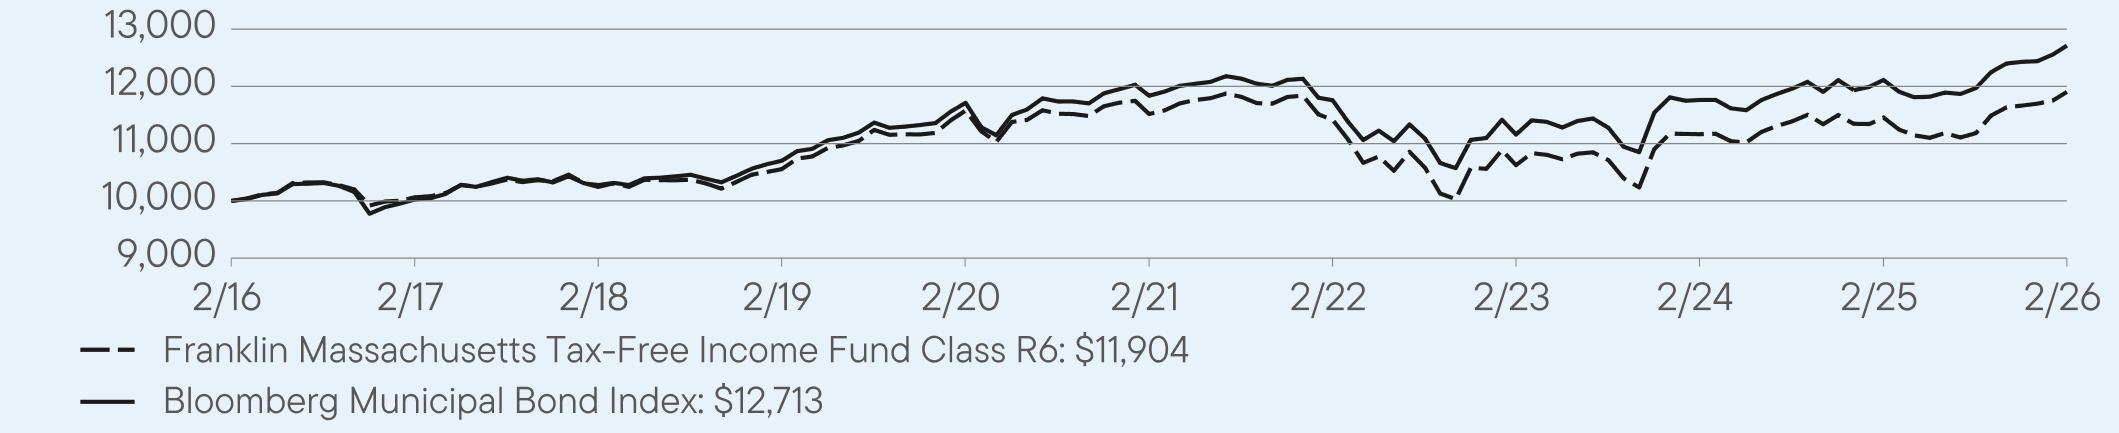
AVERAGE
ANNUAL TOTAL RETURNS (%) Period
Ended February 28, 2026
|
|
1
Year |
5
Year |
10
Year |
|
Class
R6 |
3.92
|
0.66
|
1.77
|
|
Bloomberg
Municipal Bond Index |
4.96
|
1.44
|
2.43
|
For current month-end performance,
please call Franklin Templeton at (800)
DIAL BEN/342-5236 or visit
https://www.franklintempleton.com/investments/options/mutual-funds.
https://www.franklintempleton.com/investments/options/mutual-funds.
Important data provider notices
and terms available at www.franklintempletondatasources.com.
KEY
FUND STATISTICS (as
of February 28, 2026)
|
Total
Net Assets |
$339,450,651
|
|
Total
Number of Portfolio Holdings |
113
|
|
Total
Management Fee Paid |
$1,665,136
|
|
Portfolio
Turnover Rate |
21.12%
|
WHAT
DID THE FUND INVEST IN? (as
of February 28, 2026)
Portfolio Composition*
(% of Total Investments)

WHAT
WERE THE FUND COSTS FOR THE LAST YEAR? (based
on a hypothetical $10,000 investment)
|
Class
Name |
Costs
of a $10,000 investment
|
Costs
paid as a percentage of a $10,000
investment*
|
|
Advisor
Class |
$66
|
0.65%
|
HOW
DID THE FUND PERFORM LAST YEAR AND WHAT AFFECTED ITS PERFORMANCE?
For the twelve months ended February
28, 2026, Advisor Class shares
of Franklin Massachusetts Tax-Free Income Fund returned 3.87%.
The Fund compares its performance to the Bloomberg Municipal Bond Index, which returned 4.96% for the same period.
PERFORMANCE
HIGHLIGHTS
|
Top
contributors to performance: | |
|
An
overweight allocation to: | |
|
↑
|
Bonds
with 20 years to maturity |
|
↑
|
Bonds
with no external credit rating |
|
↑
|
A
rated bonds |
|
Top
detractors from performance: | |
|
↓
|
Underweight
to bonds with 10 years or less to maturity |
|
↓
|
Overweight
duration to bonds with 30 years to maturity |
|
↓
|
Selection
in A rated bonds |
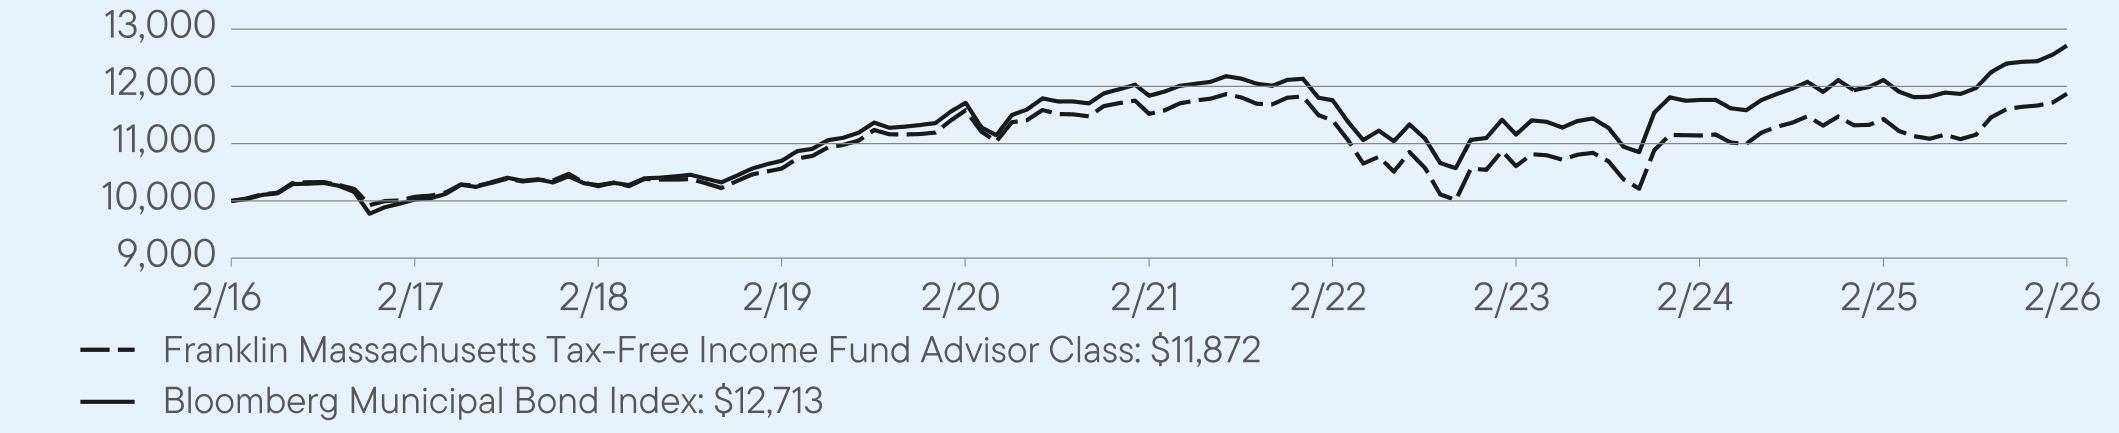
AVERAGE
ANNUAL TOTAL RETURNS (%) Period
Ended February 28, 2026
|
|
1
Year |
5
Year |
10
Year |
|
Advisor
Class |
3.87
|
0.60
|
1.73
|
|
Bloomberg
Municipal Bond Index |
4.96
|
1.44
|
2.43
|
For current month-end performance,
please call Franklin Templeton at (800)
DIAL BEN/342-5236 or visit
https://www.franklintempleton.com/investments/options/mutual-funds.
https://www.franklintempleton.com/investments/options/mutual-funds.
Important data provider notices
and terms available at www.franklintempletondatasources.com.
KEY
FUND STATISTICS (as
of February 28, 2026)
|
Total
Net Assets |
$339,450,651
|
|
Total
Number of Portfolio Holdings |
113
|
|
Total
Management Fee Paid |
$1,665,136
|
|
Portfolio
Turnover Rate |
21.12%
|
WHAT
DID THE FUND INVEST IN? (as
of February 28, 2026)
Portfolio Composition*
(% of Total Investments)
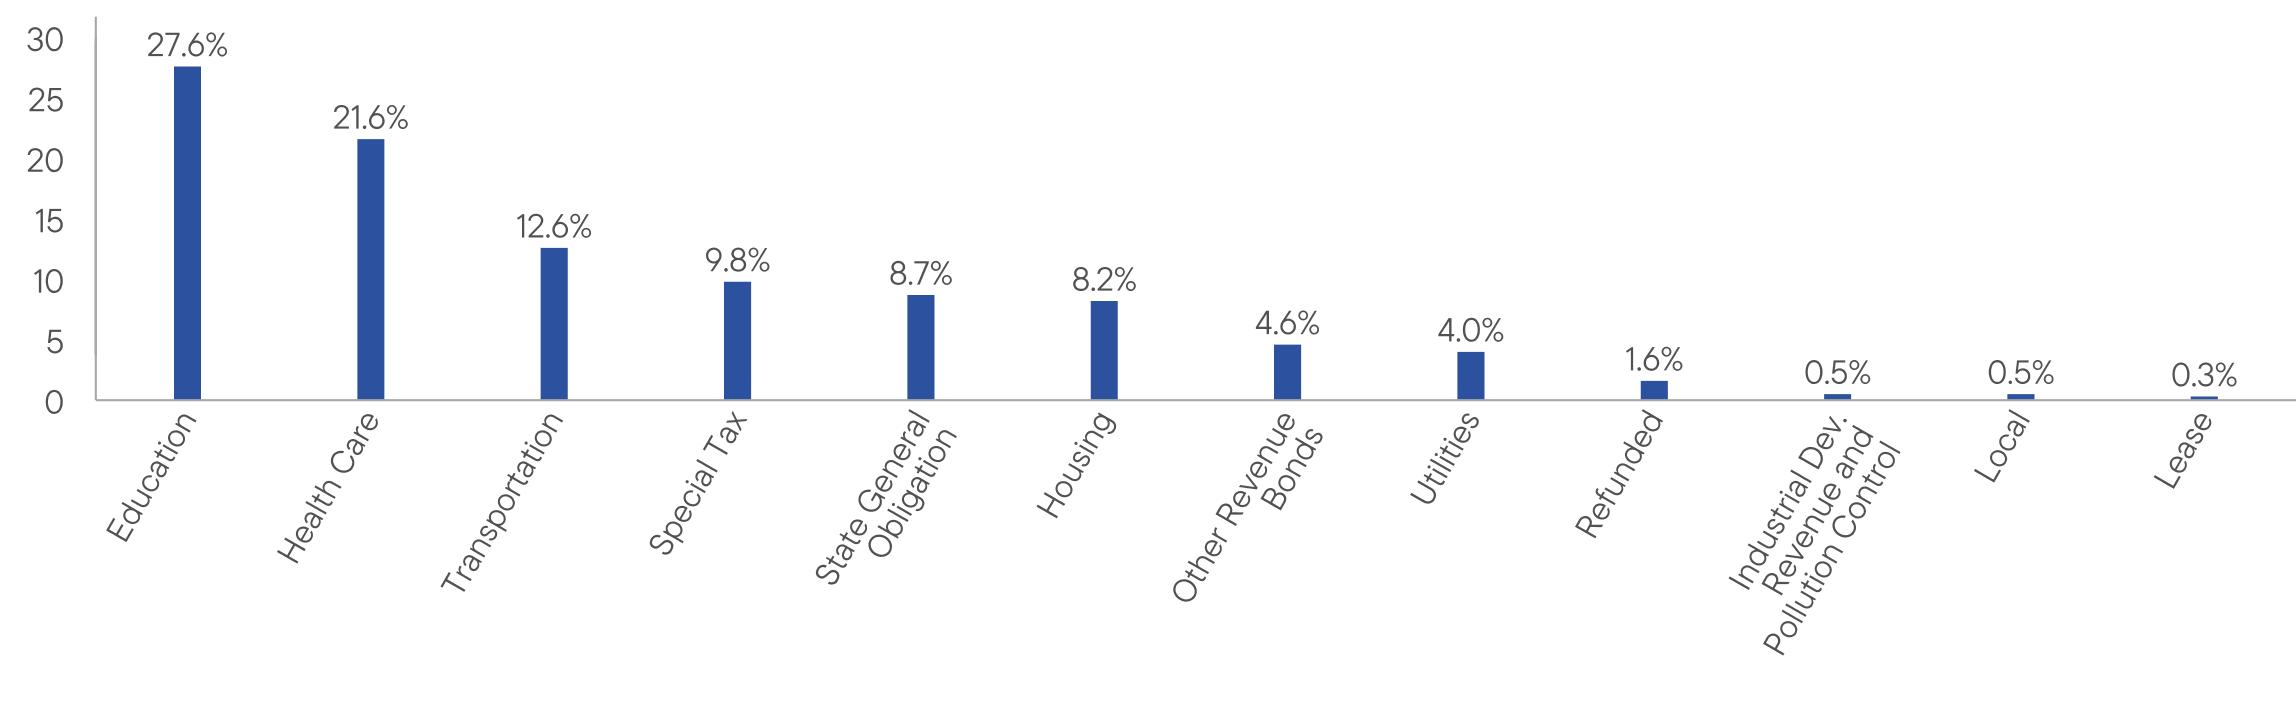
WHAT
WERE THE FUND COSTS FOR THE LAST YEAR? (based
on a hypothetical $10,000 investment)
|
Class
Name |
Costs
of a $10,000 investment
|
Costs
paid as a percentage of a $10,000
investment*
|
|
Class
A |
$86
|
0.84%
|
HOW
DID THE FUND PERFORM LAST YEAR AND WHAT AFFECTED ITS PERFORMANCE?
For the twelve months ended February
28, 2026, Class A shares of
Franklin Michigan Tax-Free
Income Fund returned 3.80%.
The Fund compares its performance
to the Bloomberg Municipal Bond Index, which returned 4.96% for the same period.
PERFORMANCE
HIGHLIGHTS
|
Top
contributors to performance: | |
|
↑
|
Overweight
to bonds with no external credit rating |
|
↑
|
Overweight
to bonds with 20 years to maturity |
|
↑
|
Selection
in BBB rated bonds |
|
Top
detractors from performance: | |
|
↓
|
Underweight
to bonds with two, five and 10 years to maturity |
|
↓
|
Security
selection in AA rated bonds |
|
↓
|
Overweight
to bonds with 30 years to maturity |
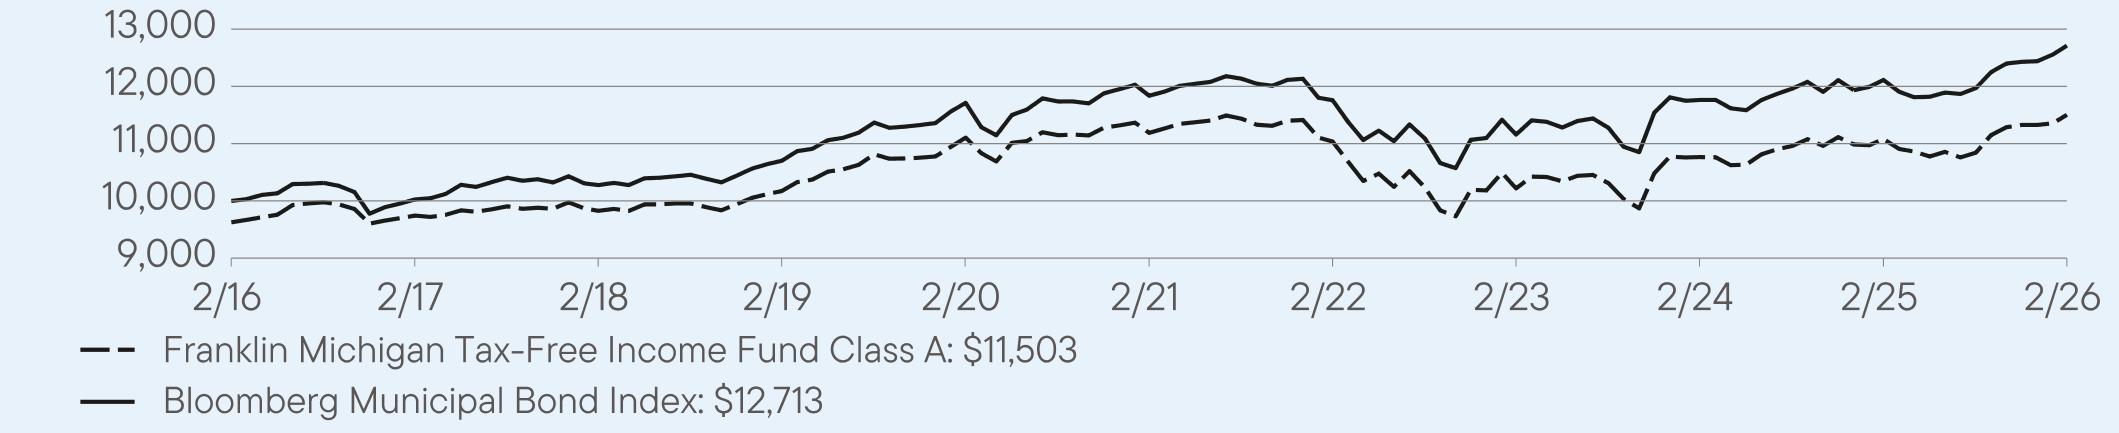
AVERAGE
ANNUAL TOTAL RETURNS (%) Period
Ended February 28, 2026
|
|
1
Year |
5
Year |
10
Year |
|
Class
A |
3.80
|
0.56
|
1.81
|
|
Class
A (with sales charge) |
-0.09
|
-0.21
|
1.42
|
|
Bloomberg
Municipal Bond Index |
4.96
|
1.44
|
2.43
|
For current month-end performance,
please call Franklin Templeton at (800)
DIAL BEN/342-5236 or visit
https://www.franklintempleton.com/investments/options/mutual-funds.
https://www.franklintempleton.com/investments/options/mutual-funds.
Important data provider notices
and terms available at www.franklintempletondatasources.com.
KEY
FUND STATISTICS (as
of February 28, 2026)
|
Total
Net Assets |
$664,251,965
|
|
Total
Number of Portfolio Holdings |
225
|
|
Total
Management Fee Paid |
$3,236,749
|
|
Portfolio
Turnover Rate |
14.13%
|
WHAT
DID THE FUND INVEST IN? (as
of February 28, 2026)
Portfolio Composition*
(% of Total Investments)

WHAT
WERE THE FUND COSTS FOR THE LAST YEAR? (based
on a hypothetical $10,000 investment)
|
Class
Name |
Costs
of a $10,000 investment
|
Costs
paid as a percentage of a $10,000
investment*
|
|
Class
A1 |
$71
|
0.70%
|
HOW
DID THE FUND PERFORM LAST YEAR AND WHAT AFFECTED ITS PERFORMANCE?
For the twelve months ended February
28, 2026, Class A1 shares of
Franklin Michigan Tax-Free
Income Fund returned 3.96%.
The Fund compares its performance
to the Bloomberg Municipal Bond Index, which returned 4.96% for the same period.
PERFORMANCE
HIGHLIGHTS
|
Top
contributors to performance: | |
|
↑
|
Overweight
to bonds with no external credit rating |
|
↑
|
Overweight
to bonds with 20 years to maturity |
|
↑
|
Selection
in BBB rated bonds |
|
Top
detractors from performance: | |
|
↓
|
Underweight
to bonds with two, five and 10 years to maturity |
|
↓
|
Security
selection in AA rated bonds |
|
↓
|
Overweight
to bonds with 30 years to maturity |
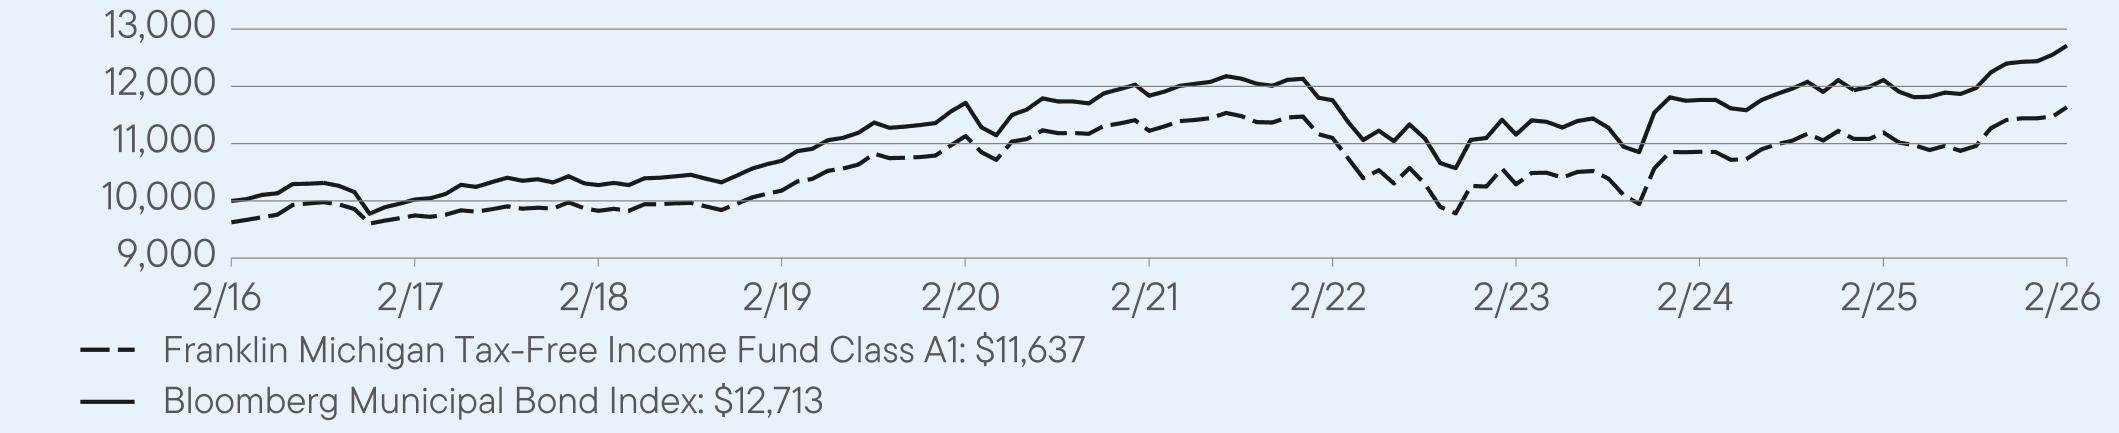
AVERAGE
ANNUAL TOTAL RETURNS (%) Period
Ended February 28, 2026
|
|
1
Year |
5
Year |
10
Year |
|
Class
A1 |
3.96
|
0.73
|
1.92
|
|
Class
A1 (with sales charge) |
0.06
|
-0.04
|
1.53
|
|
Bloomberg
Municipal Bond Index |
4.96
|
1.44
|
2.43
|
For current month-end performance,
please call Franklin Templeton at (800)
DIAL BEN/342-5236 or visit
https://www.franklintempleton.com/investments/options/mutual-funds.
https://www.franklintempleton.com/investments/options/mutual-funds.
Important data provider notices
and terms available at www.franklintempletondatasources.com.
KEY
FUND STATISTICS (as
of February 28, 2026)
|
Total
Net Assets |
$664,251,965
|
|
Total
Number of Portfolio Holdings |
225
|
|
Total
Management Fee Paid |
$3,236,749
|
|
Portfolio
Turnover Rate |
14.13%
|
WHAT
DID THE FUND INVEST IN? (as
of February 28, 2026)
Portfolio Composition*
(% of Total Investments)
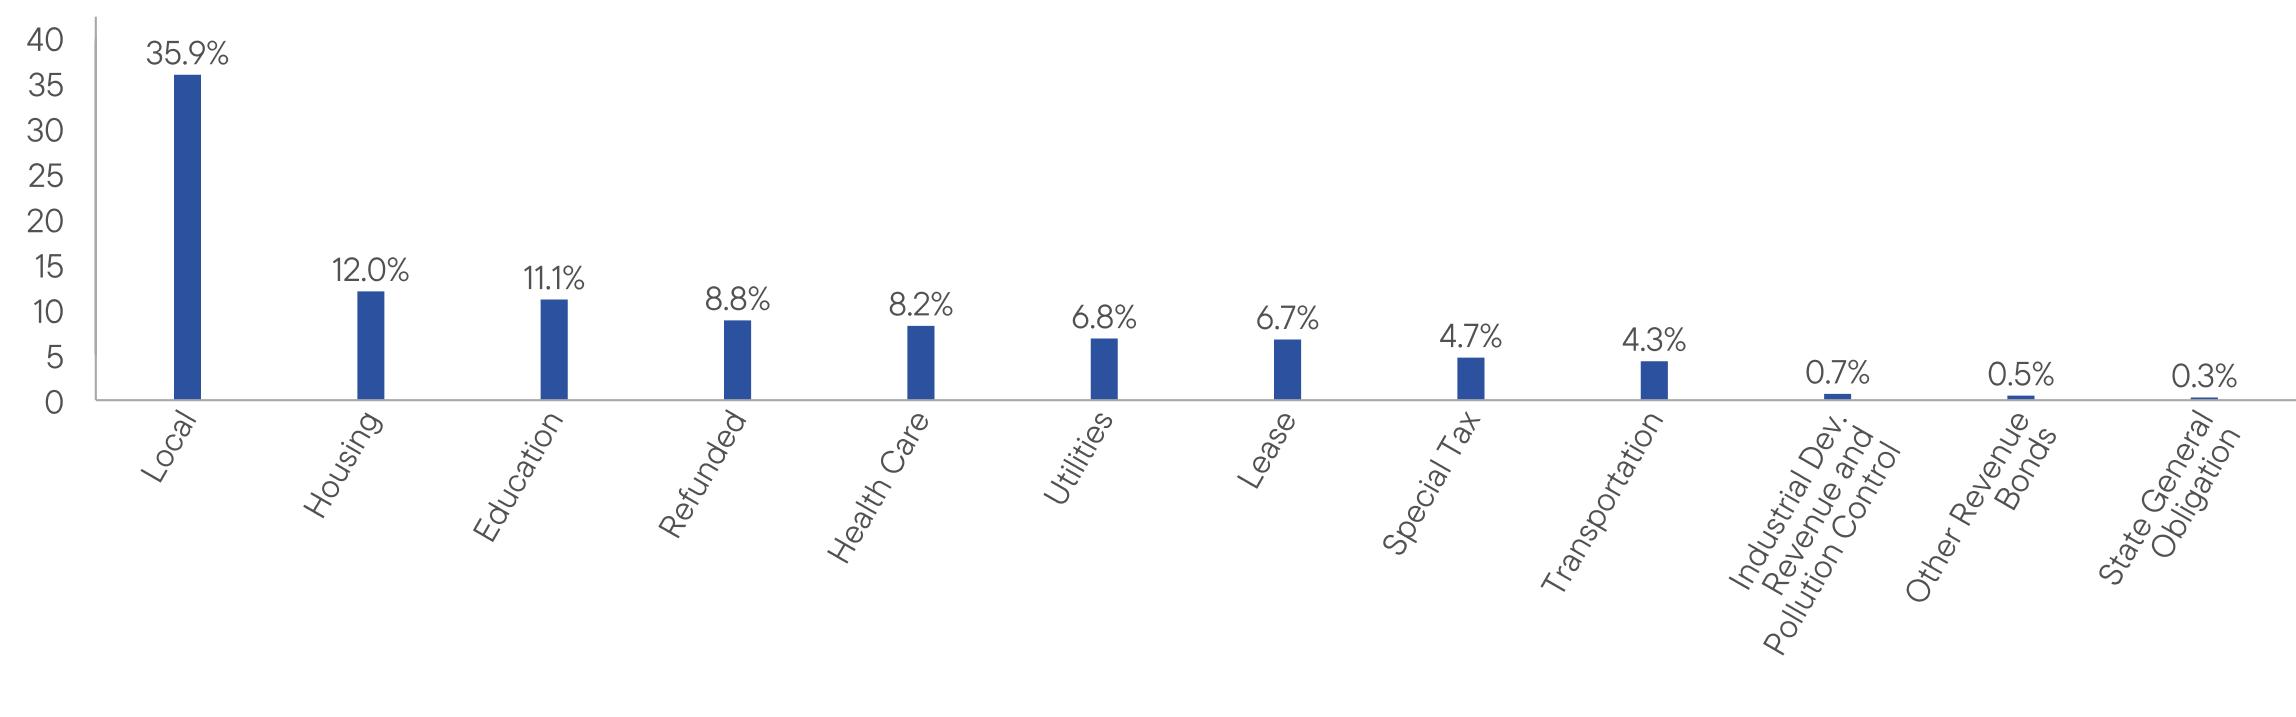
WHAT
WERE THE FUND COSTS FOR THE LAST YEAR? (based
on a hypothetical $10,000 investment)
|
Class
Name |
Costs
of a $10,000 investment
|
Costs
paid as a percentage of a $10,000
investment*
|
|
Class
C |
$126
|
1.24%
|
HOW
DID THE FUND PERFORM LAST YEAR AND WHAT AFFECTED ITS PERFORMANCE?
For the twelve months ended February
28, 2026, Class C shares of
Franklin Michigan Tax-Free
Income Fund returned 3.33%.
The Fund compares its performance
to the Bloomberg Municipal Bond Index, which returned 4.96% for the same period.
PERFORMANCE
HIGHLIGHTS
|
Top
contributors to performance: | |
|
↑
|
Overweight
to bonds with no external credit rating |
|
↑
|
Overweight
to bonds with 20 years to maturity |
|
↑
|
Selection
in BBB rated bonds |
|
Top
detractors from performance: | |
|
↓
|
Underweight
to bonds with two, five and 10 years to maturity |
|
↓
|
Security
selection in AA rated bonds |
|
↓
|
Overweight
to bonds with 30 years to maturity |
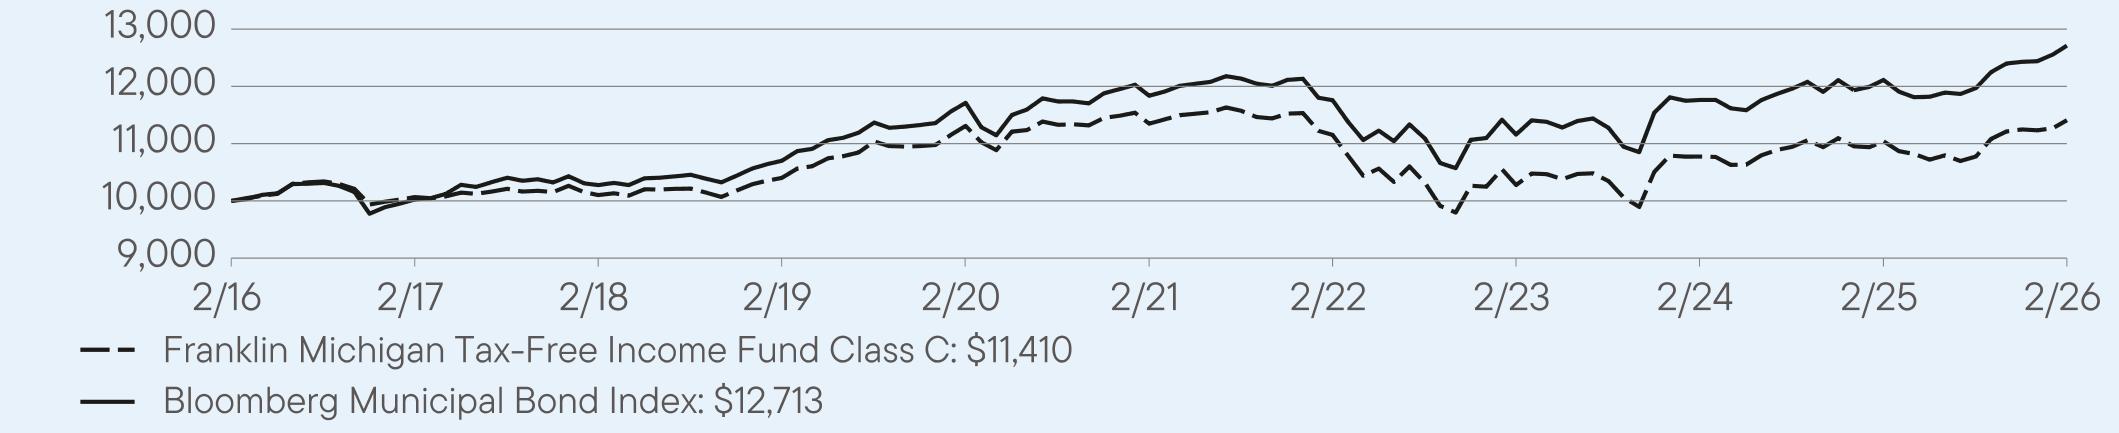
AVERAGE
ANNUAL TOTAL RETURNS (%) Period
Ended February 28, 2026
|
|
1
Year |
5
Year |
10
Year |
|
Class
C |
3.33
|
0.11
|
1.33
|
|
Class
C (with sales charge) |
2.33
|
0.11
|
1.33
|
|
Bloomberg
Municipal Bond Index |
4.96
|
1.44
|
2.43
|
For current month-end performance,
please call Franklin Templeton at (800)
DIAL BEN/342-5236 or visit
https://www.franklintempleton.com/investments/options/mutual-funds.
https://www.franklintempleton.com/investments/options/mutual-funds.
Important data provider notices
and terms available at www.franklintempletondatasources.com.
KEY
FUND STATISTICS (as
of February 28, 2026)
|
Total
Net Assets |
$664,251,965
|
|
Total
Number of Portfolio Holdings |
225
|
|
Total
Management Fee Paid |
$3,236,749
|
|
Portfolio
Turnover Rate |
14.13%
|
WHAT
DID THE FUND INVEST IN? (as
of February 28, 2026)
Portfolio Composition*
(% of Total Investments)

WHAT
WERE THE FUND COSTS FOR THE LAST YEAR? (based
on a hypothetical $10,000 investment)
|
Class
Name |
Costs
of a $10,000 investment
|
Costs
paid as a percentage of a $10,000
investment*
|
|
Class
R6 |
$56
|
0.55%
|
HOW
DID THE FUND PERFORM LAST YEAR AND WHAT AFFECTED ITS PERFORMANCE?
For the twelve months ended February
28, 2026, Class R6 shares of
Franklin Michigan Tax-Free
Income Fund returned 4.09%.
The Fund compares its performance
to the Bloomberg Municipal Bond Index, which returned 4.96% for the same period.
PERFORMANCE
HIGHLIGHTS
|
Top
contributors to performance: | |
|
↑
|
Overweight
to bonds with no external credit rating |
|
↑
|
Overweight
to bonds with 20 years to maturity |
|
↑
|
Selection
in BBB rated bonds |
|
Top
detractors from performance: | |
|
↓
|
Underweight
to bonds with two, five and 10 years to maturity |
|
↓
|
Security
selection in AA rated bonds |
|
↓
|
Overweight
to bonds with 30 years to maturity |

AVERAGE
ANNUAL TOTAL RETURNS (%) Period
Ended February 28, 2026
|
|
1
Year |
5
Year |
10
Year |
|
Class
R6 |
4.09
|
0.84
|
2.05
|
|
Bloomberg
Municipal Bond Index |
4.96
|
1.44
|
2.43
|
For current month-end performance,
please call Franklin Templeton at (800)
DIAL BEN/342-5236 or visit
https://www.franklintempleton.com/investments/options/mutual-funds.
https://www.franklintempleton.com/investments/options/mutual-funds.
Important data provider notices
and terms available at www.franklintempletondatasources.com.
KEY
FUND STATISTICS (as
of February 28, 2026)
|
Total
Net Assets |
$664,251,965
|
|
Total
Number of Portfolio Holdings |
225
|
|
Total
Management Fee Paid |
$3,236,749
|
|
Portfolio
Turnover Rate |
14.13%
|
WHAT
DID THE FUND INVEST IN? (as
of February 28, 2026)
Portfolio Composition*
(% of Total Investments)

WHAT
WERE THE FUND COSTS FOR THE LAST YEAR? (based
on a hypothetical $10,000 investment)
|
Class
Name |
Costs
of a $10,000 investment
|
Costs
paid as a percentage of a $10,000
investment*
|
|
Advisor
Class |
$60
|
0.59%
|
HOW
DID THE FUND PERFORM LAST YEAR AND WHAT AFFECTED ITS PERFORMANCE?
For the twelve months ended February
28, 2026, Advisor Class shares
of Franklin Michigan Tax-Free
Income Fund returned 4.15%.
The Fund compares its performance
to the Bloomberg Municipal Bond Index, which returned 4.96% for the same period.
PERFORMANCE
HIGHLIGHTS
|
Top
contributors to performance: | |
|
↑
|
Overweight
to bonds with no external credit rating |
|
↑
|
Overweight
to bonds with 20 years to maturity |
|
↑
|
Selection
in BBB rated bonds |
|
Top
detractors from performance: | |
|
↓
|
Underweight
to bonds with two, five and 10 years to maturity |
|
↓
|
Security
selection in AA rated bonds |
|
↓
|
Overweight
to bonds with 30 years to maturity |

AVERAGE
ANNUAL TOTAL RETURNS (%) Period
Ended February 28, 2026
|
|
1
Year |
5
Year |
10
Year |
|
Advisor
Class |
4.15
|
0.83
|
2.02
|
|
Bloomberg
Municipal Bond Index |
4.96
|
1.44
|
2.43
|
For current month-end performance,
please call Franklin Templeton at (800)
DIAL BEN/342-5236 or visit
https://www.franklintempleton.com/investments/options/mutual-funds.
https://www.franklintempleton.com/investments/options/mutual-funds.
Important data provider notices
and terms available at www.franklintempletondatasources.com.
KEY
FUND STATISTICS (as
of February 28, 2026)
|
Total
Net Assets |
$664,251,965
|
|
Total
Number of Portfolio Holdings |
225
|
|
Total
Management Fee Paid |
$3,236,749
|
|
Portfolio
Turnover Rate |
14.13%
|
WHAT
DID THE FUND INVEST IN? (as
of February 28, 2026)
Portfolio Composition*
(% of Total Investments)

WHAT
WERE THE FUND COSTS FOR THE LAST YEAR? (based
on a hypothetical $10,000 investment)
|
Class
Name |
Costs
of a $10,000 investment
|
Costs
paid as a percentage of a $10,000
investment*
|
|
Class
A |
$87
|
0.85%
|
HOW
DID THE FUND PERFORM LAST YEAR AND WHAT AFFECTED ITS PERFORMANCE?
For the twelve months ended February
28, 2026, Class A shares of
Franklin Minnesota Tax-Free Income Fund returned 4.67%.
The Fund compares its performance
to the Bloomberg Municipal Bond Index, which returned 4.96% for the same period.
PERFORMANCE
HIGHLIGHTS
|
Top
contributors to performance: | |
|
↑
|
Security
selection in AA rated bonds |
|
↑
|
Overweight
to bonds with no external credit rating |
|
↑
|
Overweight
to bonds with 10 years to maturity |
|
Top
detractors from performance: | |
|
↓
|
Underweight
to bonds with five years to maturity |
|
↓
|
Overweight
to bonds with 20 years to maturity |
|
↓
|
Security
selection in A rated bonds |
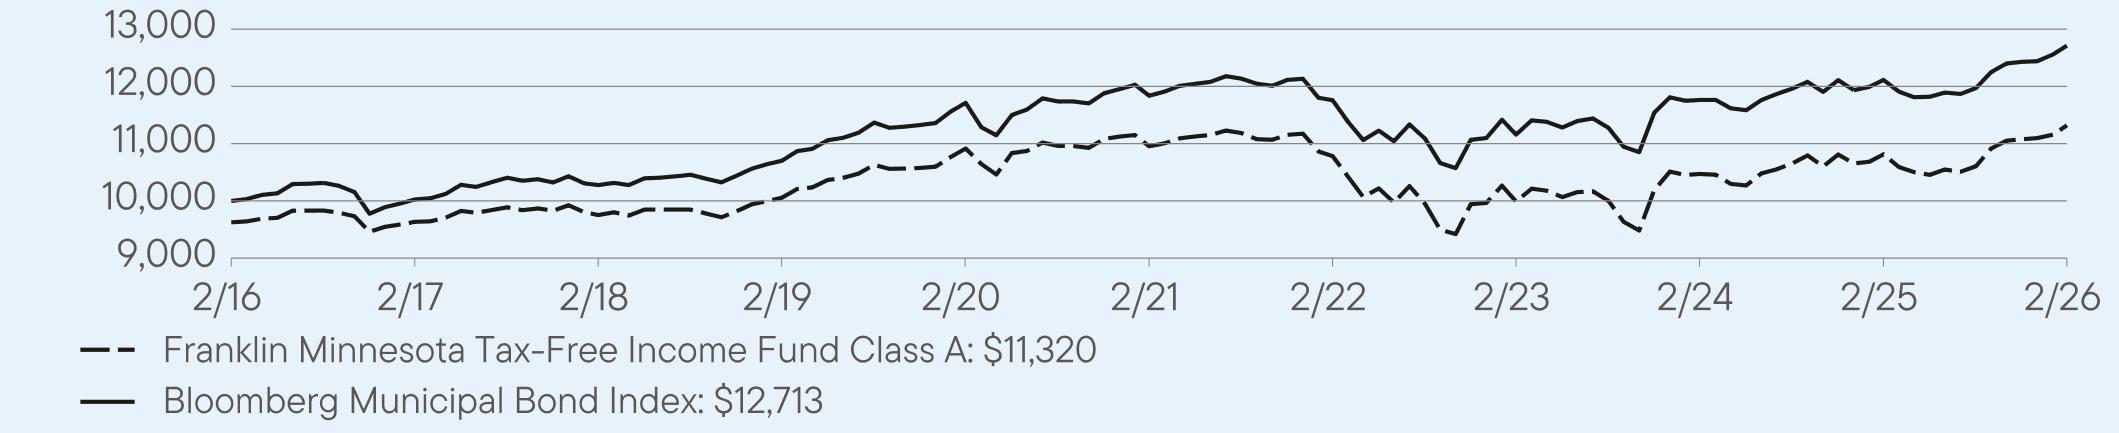
AVERAGE
ANNUAL TOTAL RETURNS (%) Period
Ended February 28, 2026
|
|
1
Year |
5
Year |
10
Year |
|
Class
A |
4.67
|
0.66
|
1.64
|
|
Class
A (with sales charge) |
0.75
|
-0.11
|
1.26
|
|
Bloomberg
Municipal Bond Index |
4.96
|
1.44
|
2.43
|
For current month-end performance,
please call Franklin Templeton at (800)
DIAL BEN/342-5236 or visit
https://www.franklintempleton.com/investments/options/mutual-funds.
https://www.franklintempleton.com/investments/options/mutual-funds.
Important data provider notices
and terms available at www.franklintempletondatasources.com.
KEY
FUND STATISTICS (as
of February 28, 2026)
|
Total
Net Assets |
$620,184,435
|
|
Total
Number of Portfolio Holdings |
195
|
|
Total
Management Fee Paid |
$3,052,108
|
|
Portfolio
Turnover Rate |
5.26%
|
WHAT
DID THE FUND INVEST IN? (as
of February 28, 2026)
Portfolio Composition*
(% of Total Investments)

WHAT
WERE THE FUND COSTS FOR THE LAST YEAR? (based
on a hypothetical $10,000 investment)
|
Class
Name |
Costs
of a $10,000 investment
|
Costs
paid as a percentage of a $10,000
investment*
|
|
Class
A1 |
$72
|
0.70%
|
HOW
DID THE FUND PERFORM LAST YEAR AND WHAT AFFECTED ITS PERFORMANCE?
For the twelve months ended February
28, 2026, Class A1 shares of
Franklin Minnesota Tax-Free Income Fund returned 4.74%.
The Fund compares its performance
to the Bloomberg Municipal Bond Index, which returned 4.96% for the same period.
PERFORMANCE
HIGHLIGHTS
|
Top
contributors to performance: | |
|
↑
|
Security
selection in AA rated bonds |
|
↑
|
Overweight
to bonds with no external credit rating |
|
↑
|
Overweight
to bonds with 10 years to maturity |
|
Top
detractors from performance: | |
|
↓
|
Underweight
to bonds with five years to maturity |
|
↓
|
Overweight
to bonds with 20 years to maturity |
|
↓
|
Security
selection in A rated bonds |

AVERAGE
ANNUAL TOTAL RETURNS (%) Period
Ended February 28, 2026
|
|
1
Year |
5
Year |
10
Year |
|
Class
A1 |
4.74
|
0.81
|
1.75
|
|
Class
A1 (with sales charge) |
0.80
|
0.04
|
1.37
|
|
Bloomberg
Municipal Bond Index |
4.96
|
1.44
|
2.43
|
For current month-end performance,
please call Franklin Templeton at (800)
DIAL BEN/342-5236 or visit
https://www.franklintempleton.com/investments/options/mutual-funds.
https://www.franklintempleton.com/investments/options/mutual-funds.
Important data provider notices
and terms available at www.franklintempletondatasources.com.
KEY
FUND STATISTICS (as
of February 28, 2026)
|
Total
Net Assets |
$620,184,435
|
|
Total
Number of Portfolio Holdings |
195
|
|
Total
Management Fee Paid |
$3,052,108
|
|
Portfolio
Turnover Rate |
5.26%
|
WHAT
DID THE FUND INVEST IN? (as
of February 28, 2026)
Portfolio Composition*
(% of Total Investments)
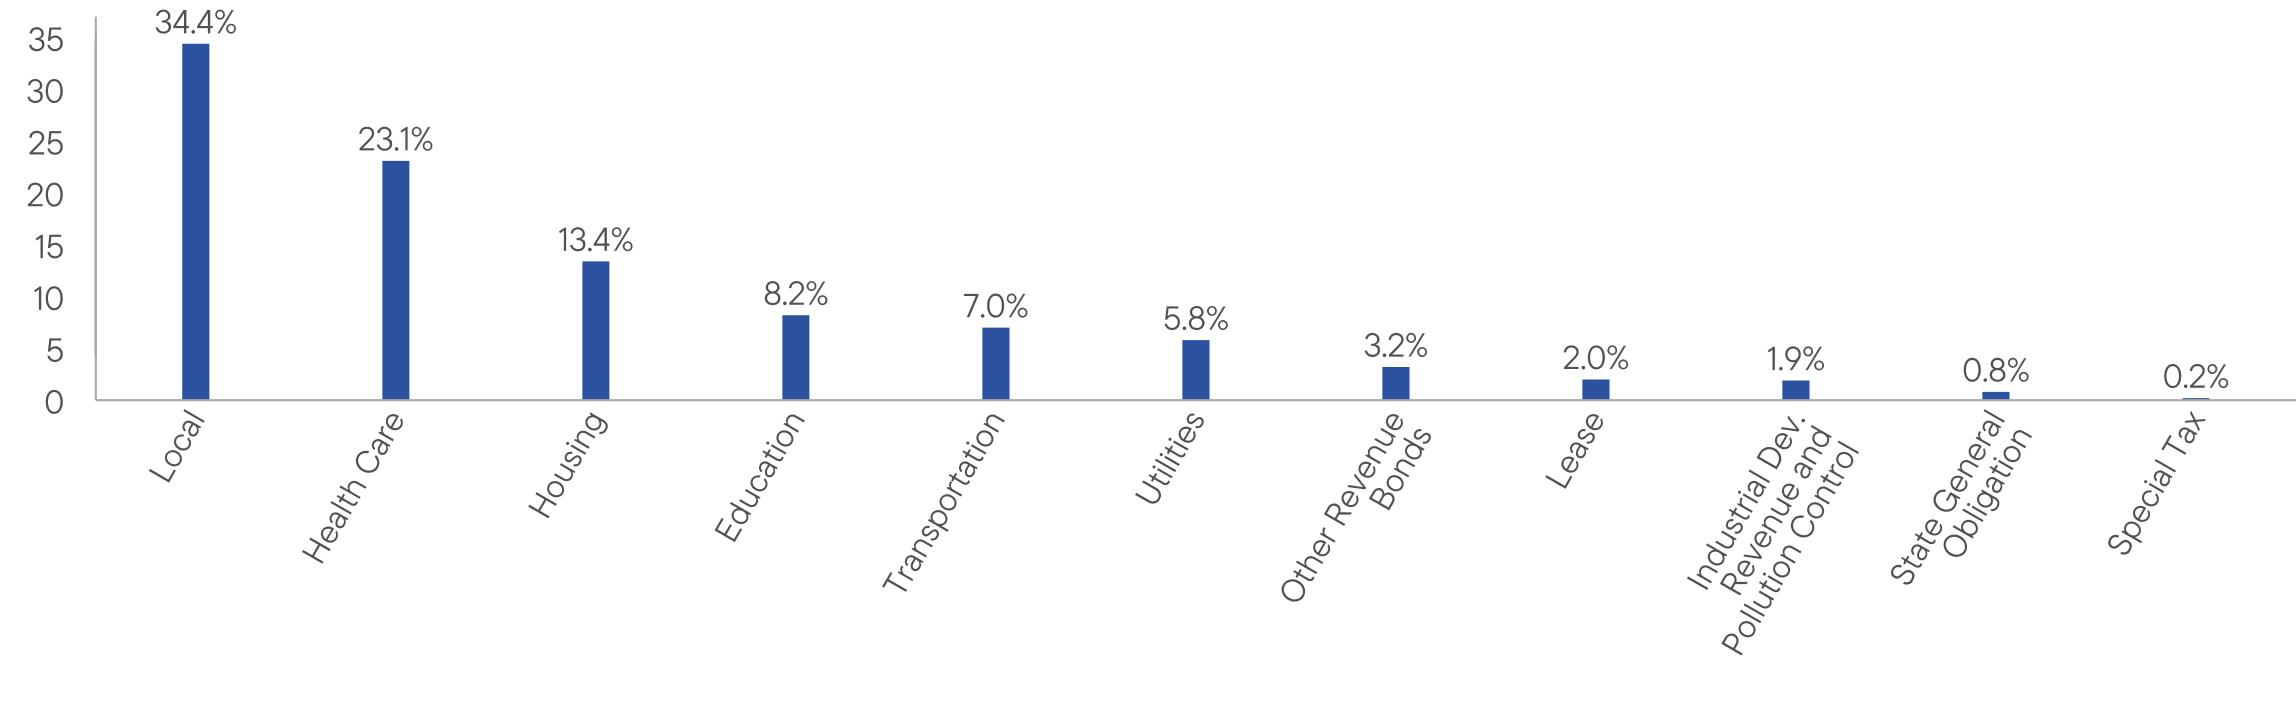
WHAT
WERE THE FUND COSTS FOR THE LAST YEAR? (based
on a hypothetical $10,000 investment)
|
Class
Name |
Costs
of a $10,000 investment
|
Costs
paid as a percentage of a $10,000
investment*
|
|
Class
C |
$128
|
1.25%
|
HOW
DID THE FUND PERFORM LAST YEAR AND WHAT AFFECTED ITS PERFORMANCE?
For the twelve months ended February
28, 2026, Class C shares of
Franklin Minnesota Tax-Free Income Fund returned 4.11%.
The Fund compares its performance
to the Bloomberg Municipal Bond Index, which returned 4.96% for the same period.
PERFORMANCE
HIGHLIGHTS
|
Top
contributors to performance: | |
|
↑
|
Security
selection in AA rated bonds |
|
↑
|
Overweight
to bonds with no external credit rating |
|
↑
|
Overweight
to bonds with 10 years to maturity |
|
Top
detractors from performance: | |
|
↓
|
Underweight
to bonds with five years to maturity |
|
↓
|
Overweight
to bonds with 20 years to maturity |
|
↓
|
Security
selection in A rated bonds |
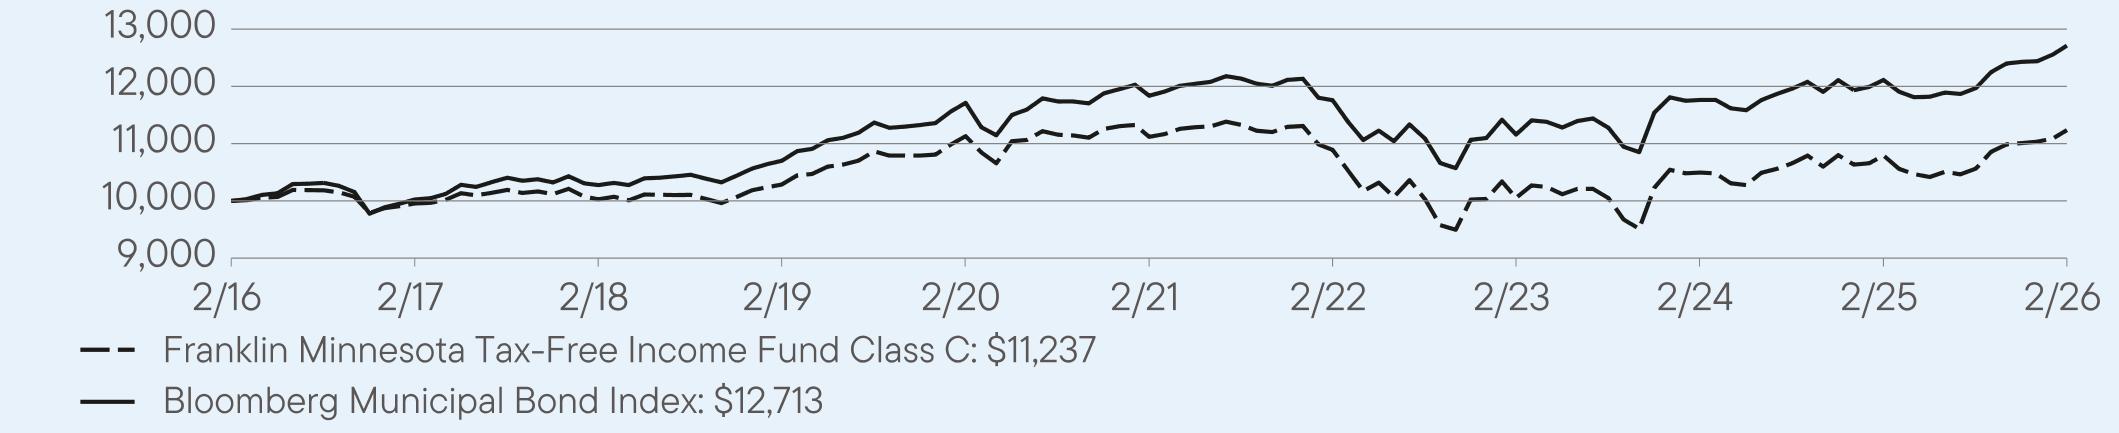
AVERAGE
ANNUAL TOTAL RETURNS (%) Period
Ended February 28, 2026
|
|
1
Year |
5
Year |
10
Year |
|
Class
C |
4.11
|
0.21
|
1.17
|
|
Class
C (with sales charge) |
3.11
|
0.21
|
1.17
|
|
Bloomberg
Municipal Bond Index |
4.96
|
1.44
|
2.43
|
For current month-end performance,
please call Franklin Templeton at (800)
DIAL BEN/342-5236 or visit
https://www.franklintempleton.com/investments/options/mutual-funds.
https://www.franklintempleton.com/investments/options/mutual-funds.
Important data provider notices
and terms available at www.franklintempletondatasources.com.
KEY
FUND STATISTICS (as
of February 28, 2026)
|
Total
Net Assets |
$620,184,435
|
|
Total
Number of Portfolio Holdings |
195
|
|
Total
Management Fee Paid |
$3,052,108
|
|
Portfolio
Turnover Rate |
5.26%
|
WHAT
DID THE FUND INVEST IN? (as
of February 28, 2026)
Portfolio Composition*
(% of Total Investments)

WHAT
WERE THE FUND COSTS FOR THE LAST YEAR? (based
on a hypothetical $10,000 investment)
|
Class
Name |
Costs
of a $10,000 investment
|
Costs
paid as a percentage of a $10,000
investment |
|
Class
R6 |
$56
|
0.55%
|
HOW
DID THE FUND PERFORM LAST YEAR AND WHAT AFFECTED ITS PERFORMANCE?
For the twelve months ended February
28, 2026, Class R6 shares of
Franklin Minnesota Tax-Free Income Fund returned 4.89%.
The Fund compares its performance
to the Bloomberg Municipal Bond Index, which returned 4.96% for the same period.
PERFORMANCE
HIGHLIGHTS
|
Top
contributors to performance: | |
|
↑
|
Security
selection in AA rated bonds |
|
↑
|
Overweight
to bonds with no external credit rating |
|
↑
|
Overweight
to bonds with 10 years to maturity |
|
Top
detractors from performance: | |
|
↓
|
Underweight
to bonds with five years to maturity |
|
↓
|
Overweight
to bonds with 20 years to maturity |
|
↓
|
Security
selection in A rated bonds |
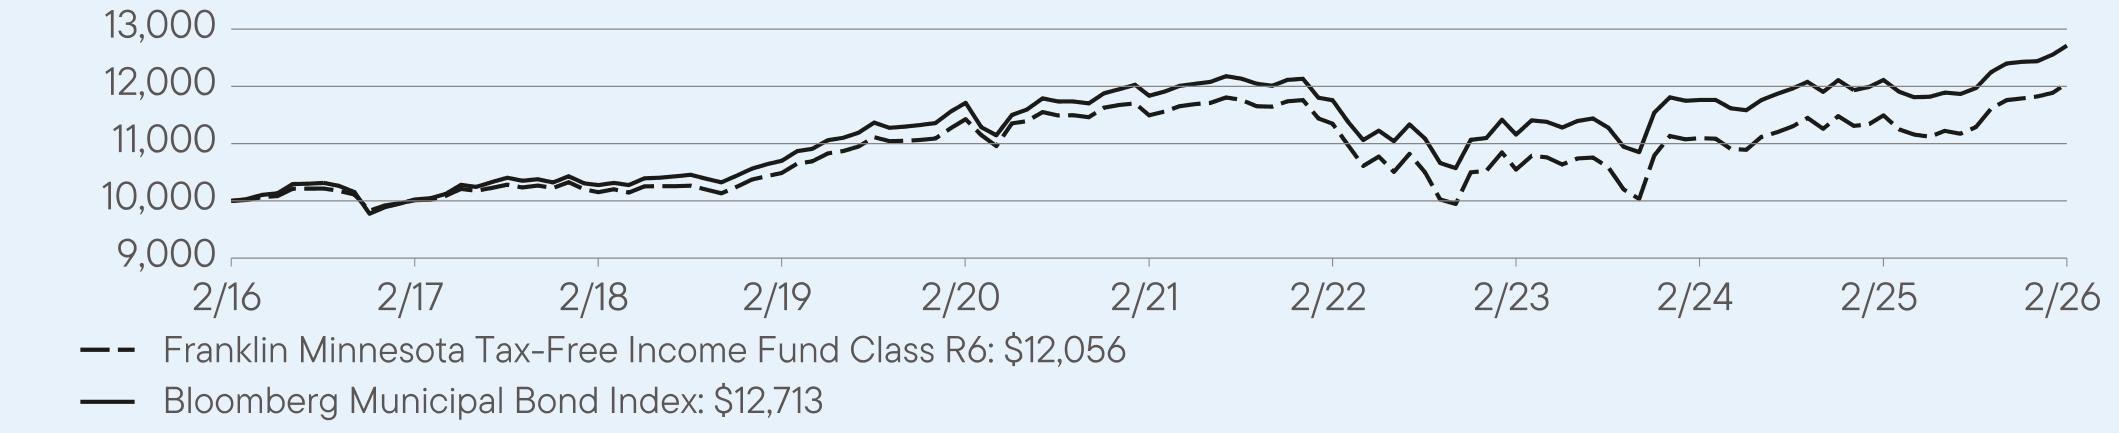
AVERAGE
ANNUAL TOTAL RETURNS (%) Period
Ended February 28, 2026
|
|
1
Year |
5
Year |
10
Year |
|
Class
R6 |
4.89
|
0.96
|
1.90
|
|
Bloomberg
Municipal Bond Index |
4.96
|
1.44
|
2.43
|
For current month-end performance,
please call Franklin Templeton at (800)
DIAL BEN/342-5236 or visit
https://www.franklintempleton.com/investments/options/mutual-funds.
https://www.franklintempleton.com/investments/options/mutual-funds.
Important data provider notices
and terms available at www.franklintempletondatasources.com.
KEY
FUND STATISTICS (as
of February 28, 2026)
|
Total
Net Assets |
$620,184,435
|
|
Total
Number of Portfolio Holdings |
195
|
|
Total
Management Fee Paid |
$3,052,108
|
|
Portfolio
Turnover Rate |
5.26%
|
WHAT
DID THE FUND INVEST IN? (as
of February 28, 2026)
Portfolio Composition*
(% of Total Investments)

WHAT
WERE THE FUND COSTS FOR THE LAST YEAR? (based
on a hypothetical $10,000 investment)
|
Class
Name |
Costs
of a $10,000 investment
|
Costs
paid as a percentage of a $10,000
investment*
|
|
Advisor
Class |
$61
|
0.60%
|
HOW
DID THE FUND PERFORM LAST YEAR AND WHAT AFFECTED ITS PERFORMANCE?
For the twelve months ended February
28, 2026, Advisor Class shares
of Franklin Minnesota Tax-Free Income Fund returned 4.93%.
The Fund compares its performance
to the Bloomberg Municipal Bond Index, which returned 4.96% for the same period.
PERFORMANCE
HIGHLIGHTS
|
Top
contributors to performance: | |
|
↑
|
Security
selection in AA rated bonds |
|
↑
|
Overweight
to bonds with no external credit rating |
|
↑
|
Overweight
to bonds with 10 years to maturity |
|
Top
detractors from performance: | |
|
↓
|
Underweight
to bonds with five years to maturity |
|
↓
|
Overweight
to bonds with 20 years to maturity |
|
↓
|
Security
selection in A rated bonds |

AVERAGE
ANNUAL TOTAL RETURNS (%) Period
Ended February 28, 2026
|
|
1
Year |
5
Year |
10
Year |
|
Advisor
Class |
4.93
|
0.91
|
1.86
|
|
Bloomberg
Municipal Bond Index |
4.96
|
1.44
|
2.43
|
For current month-end performance,
please call Franklin Templeton at (800)
DIAL BEN/342-5236 or visit
https://www.franklintempleton.com/investments/options/mutual-funds.
https://www.franklintempleton.com/investments/options/mutual-funds.
Important data provider notices
and terms available at www.franklintempletondatasources.com.
KEY
FUND STATISTICS (as
of February 28, 2026)
|
Total
Net Assets |
$620,184,435
|
|
Total
Number of Portfolio Holdings |
195
|
|
Total
Management Fee Paid |
$3,052,108
|
|
Portfolio
Turnover Rate |
5.26%
|
WHAT
DID THE FUND INVEST IN? (as
of February 28, 2026)
Portfolio Composition*
(% of Total Investments)

WHAT
WERE THE FUND COSTS FOR THE LAST YEAR? (based
on a hypothetical $10,000 investment)
|
Class
Name |
Costs
of a $10,000 investment
|
Costs
paid as a percentage of a $10,000
investment*
|
|
Class
A |
$86
|
0.84%
|
HOW
DID THE FUND PERFORM LAST YEAR AND WHAT AFFECTED ITS PERFORMANCE?
For the twelve months ended February
28, 2026, Class A shares of
Franklin Missouri Tax-Free Income Fund returned 3.82%.
The Fund compares its performance
to the Bloomberg Municipal Bond Index, which returned 4.96% for the same period.
PERFORMANCE
HIGHLIGHTS
|
Top
contributors to performance: | |
|
↑
|
Security
selection in AA rated bonds |
|
↑
|
Overweight
to bonds with no external credit rating |
|
↑
|
Overweight
to bonds with 20 years to maturity |
|
Top
detractors from performance: | |
|
↓
|
Underweight
to bonds with two, five and 10 years to maturity |
|
↓
|
Overweight
to bonds with 30 years to maturity |
|
↓
|
Security
selection in A rated bonds |

AVERAGE
ANNUAL TOTAL RETURNS (%) Period
Ended February 28, 2026
|
|
1
Year |
5
Year |
10
Year |
|
Class
A |
3.82
|
0.67
|
1.68
|
|
Class
A (with sales charge) |
-0.07
|
-0.09
|
1.29
|
|
Bloomberg
Municipal Bond Index |
4.96
|
1.44
|
2.43
|
For current month-end performance,
please call Franklin Templeton at (800)
DIAL BEN/342-5236 or visit
https://www.franklintempleton.com/investments/options/mutual-funds.
https://www.franklintempleton.com/investments/options/mutual-funds.
Important data provider notices
and terms available at www.franklintempletondatasources.com.
KEY
FUND STATISTICS (as
of February 28, 2026)
|
Total
Net Assets |
$633,628,377
|
|
Total
Number of Portfolio Holdings |
162
|
|
Total
Management Fee Paid |
$3,061,022
|
|
Portfolio
Turnover Rate |
12.36%
|
WHAT
DID THE FUND INVEST IN? (as
of February 28, 2026)
Portfolio Composition*
(% of Total Investments)
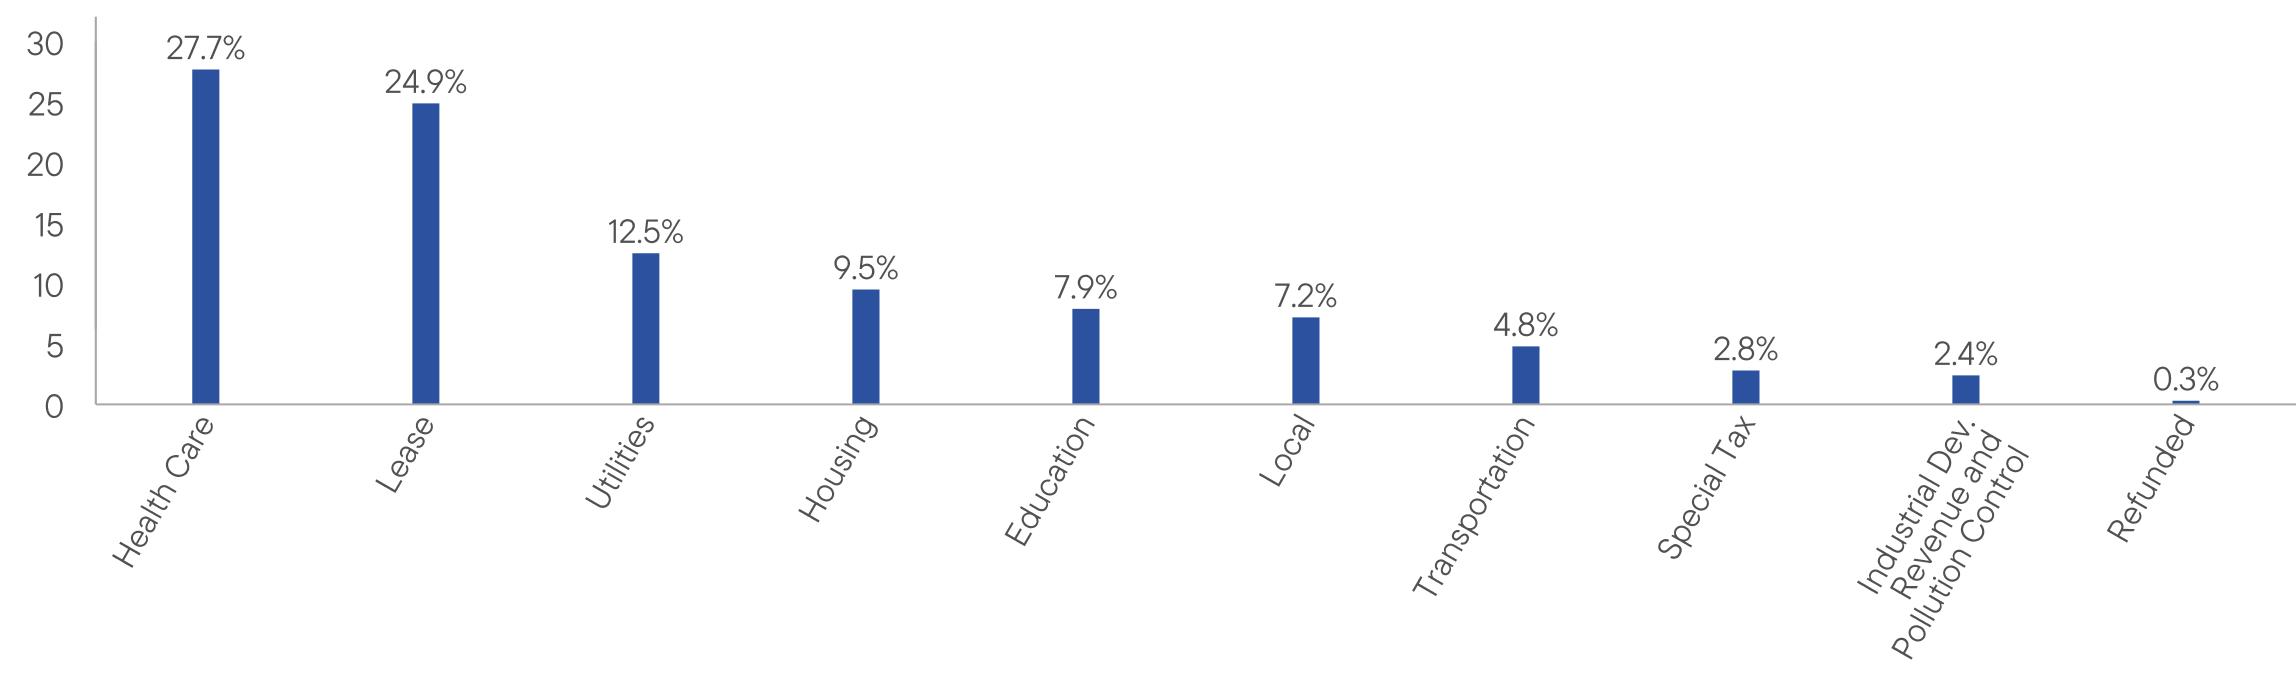
WHAT
WERE THE FUND COSTS FOR THE LAST YEAR? (based
on a hypothetical $10,000 investment)
|
Class
Name |
Costs
of a $10,000 investment
|
Costs
paid as a percentage of a $10,000
investment*
|
|
Class
A1 |
$70
|
0.69%
|
HOW
DID THE FUND PERFORM LAST YEAR AND WHAT AFFECTED ITS PERFORMANCE?
For the twelve months ended February
28, 2026, Class A1 shares of
Franklin Missouri Tax-Free Income Fund returned 3.98%.
The Fund compares its performance
to the Bloomberg Municipal Bond Index, which returned 4.96% for the same period.
PERFORMANCE
HIGHLIGHTS
|
Top
contributors to performance: | |
|
↑
|
Security
selection in AA rated bonds |
|
↑
|
Overweight
to bonds with no external credit rating |
|
↑
|
Overweight
to bonds with 20 years to maturity |
|
Top
detractors from performance: | |
|
↓
|
Underweight
to bonds with two, five and 10 years to maturity |
|
↓
|
Overweight
to bonds with 30 years to maturity |
|
↓
|
Security
selection in A rated bonds |
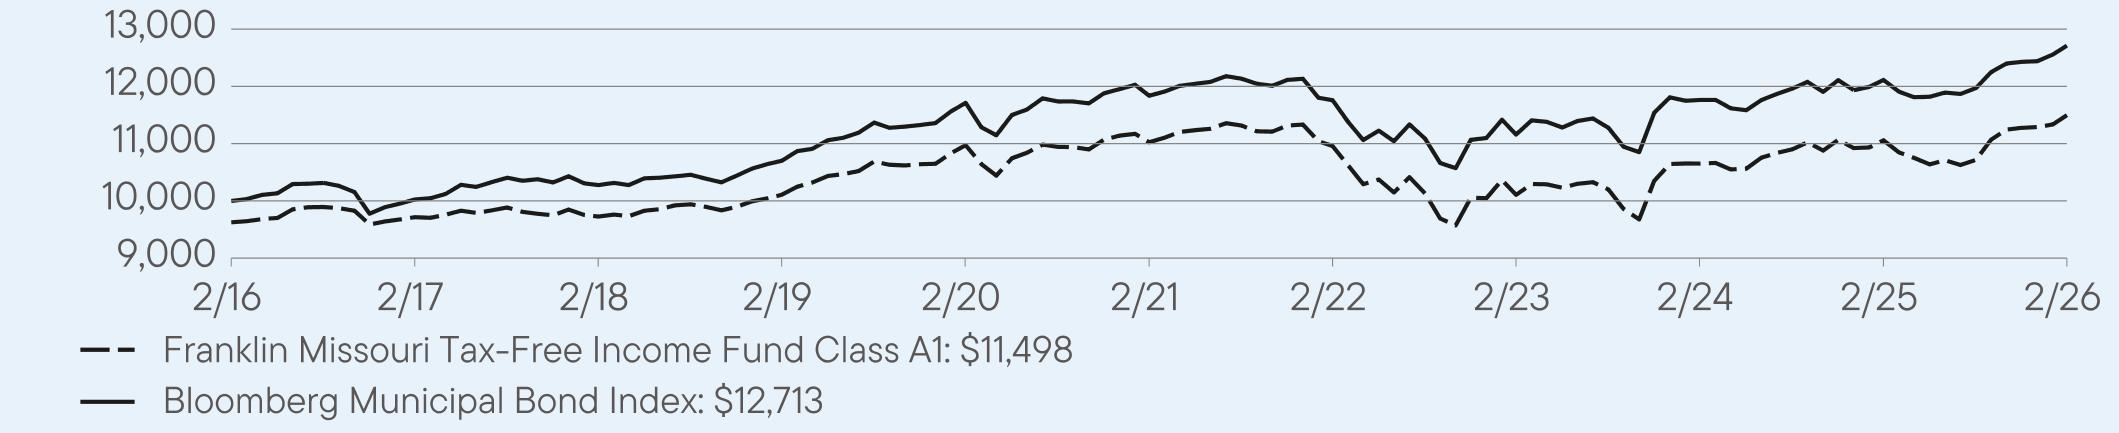
AVERAGE
ANNUAL TOTAL RETURNS (%) Period
Ended February 28, 2026
|
|
1
Year |
5
Year |
10
Year |
|
Class
A1 |
3.98
|
0.84
|
1.80
|
|
Class
A1 (with sales charge) |
0.07
|
0.08
|
1.41
|
|
Bloomberg
Municipal Bond Index |
4.96
|
1.44
|
2.43
|
For current month-end performance,
please call Franklin Templeton at (800)
DIAL BEN/342-5236 or visit
https://www.franklintempleton.com/investments/options/mutual-funds.
https://www.franklintempleton.com/investments/options/mutual-funds.
Important data provider notices
and terms available at www.franklintempletondatasources.com.
KEY
FUND STATISTICS (as
of February 28, 2026)
|
Total
Net Assets |
$633,628,377
|
|
Total
Number of Portfolio Holdings |
162
|
|
Total
Management Fee Paid |
$3,061,022
|
|
Portfolio
Turnover Rate |
12.36%
|
WHAT
DID THE FUND INVEST IN? (as
of February 28, 2026)
Portfolio Composition*
(% of Total Investments)

WHAT
WERE THE FUND COSTS FOR THE LAST YEAR? (based
on a hypothetical $10,000 investment)
|
Class
Name |
Costs
of a $10,000 investment
|
Costs
paid as a percentage of a $10,000
investment*
|
|
Class
C |
$125
|
1.23%
|
HOW
DID THE FUND PERFORM LAST YEAR AND WHAT AFFECTED ITS PERFORMANCE?
For the twelve months ended February
28, 2026, Class C shares of
Franklin Missouri Tax-Free Income Fund returned 3.27%.
The Fund compares its performance
to the Bloomberg Municipal Bond Index, which returned 4.96% for the same period.
PERFORMANCE
HIGHLIGHTS
|
Top
contributors to performance: | |
|
↑
|
Security
selection in AA rated bonds |
|
↑
|
Overweight
to bonds with no external credit rating |
|
↑
|
Overweight
to bonds with 20 years to maturity |
|
Top
detractors from performance: | |
|
↓
|
Underweight
to bonds with two, five and 10 years to maturity |
|
↓
|
Overweight
to bonds with 30 years to maturity |
|
↓
|
Security
selection in A rated bonds |
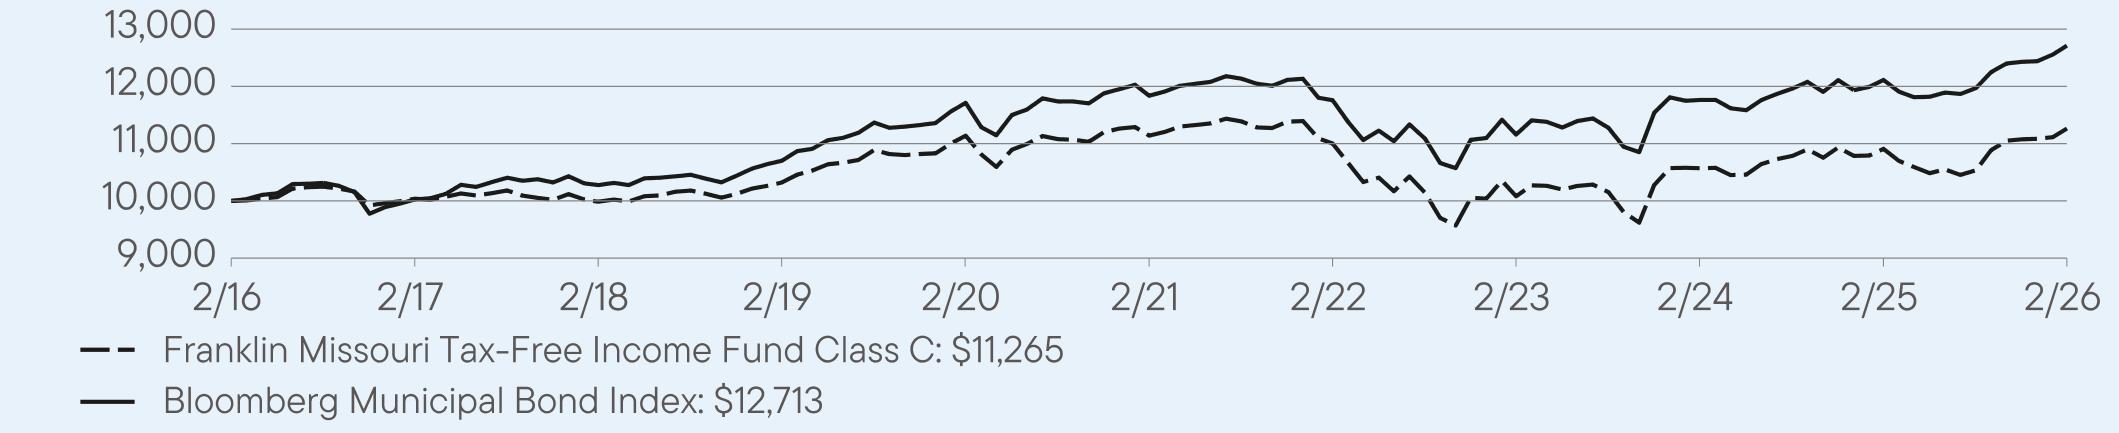
AVERAGE
ANNUAL TOTAL RETURNS (%) Period
Ended February 28, 2026
|
|
1
Year |
5
Year |
10
Year |
|
Class
C |
3.27
|
0.22
|
1.20
|
|
Class
C (with sales charge) |
2.27
|
0.22
|
1.20
|
|
Bloomberg
Municipal Bond Index |
4.96
|
1.44
|
2.43
|
For current month-end performance,
please call Franklin Templeton at (800)
DIAL BEN/342-5236 or visit
https://www.franklintempleton.com/investments/options/mutual-funds.
https://www.franklintempleton.com/investments/options/mutual-funds.
Important data provider notices
and terms available at www.franklintempletondatasources.com.
KEY
FUND STATISTICS (as
of February 28, 2026)
|
Total
Net Assets |
$633,628,377
|
|
Total
Number of Portfolio Holdings |
162
|
|
Total
Management Fee Paid |
$3,061,022
|
|
Portfolio
Turnover Rate |
12.36%
|
WHAT
DID THE FUND INVEST IN? (as
of February 28, 2026)
Portfolio Composition*
(% of Total Investments)

WHAT
WERE THE FUND COSTS FOR THE LAST YEAR? (based
on a hypothetical $10,000 investment)
|
Class
Name |
Costs
of a $10,000 investment
|
Costs
paid as a percentage of a $10,000
investment |
|
Class
R6 |
$56
|
0.55%
|
HOW
DID THE FUND PERFORM LAST YEAR AND WHAT AFFECTED ITS PERFORMANCE?
For the twelve months ended February
28, 2026, Class R6 shares of
Franklin Missouri Tax-Free Income Fund returned 4.11%.
The Fund compares its performance
to the Bloomberg Municipal Bond Index, which returned 4.96% for the same period.
PERFORMANCE
HIGHLIGHTS
|
Top
contributors to performance: | |
|
↑
|
Security
selection in AA rated bonds |
|
↑
|
Overweight
to bonds with no external credit rating |
|
↑
|
Overweight
to bonds with 20 years to maturity |
|
Top
detractors from performance: | |
|
↓
|
Underweight
to bonds with two, five and 10 years to maturity |
|
↓
|
Overweight
to bonds with 30 years to maturity |
|
↓
|
Security
selection in A rated bonds |
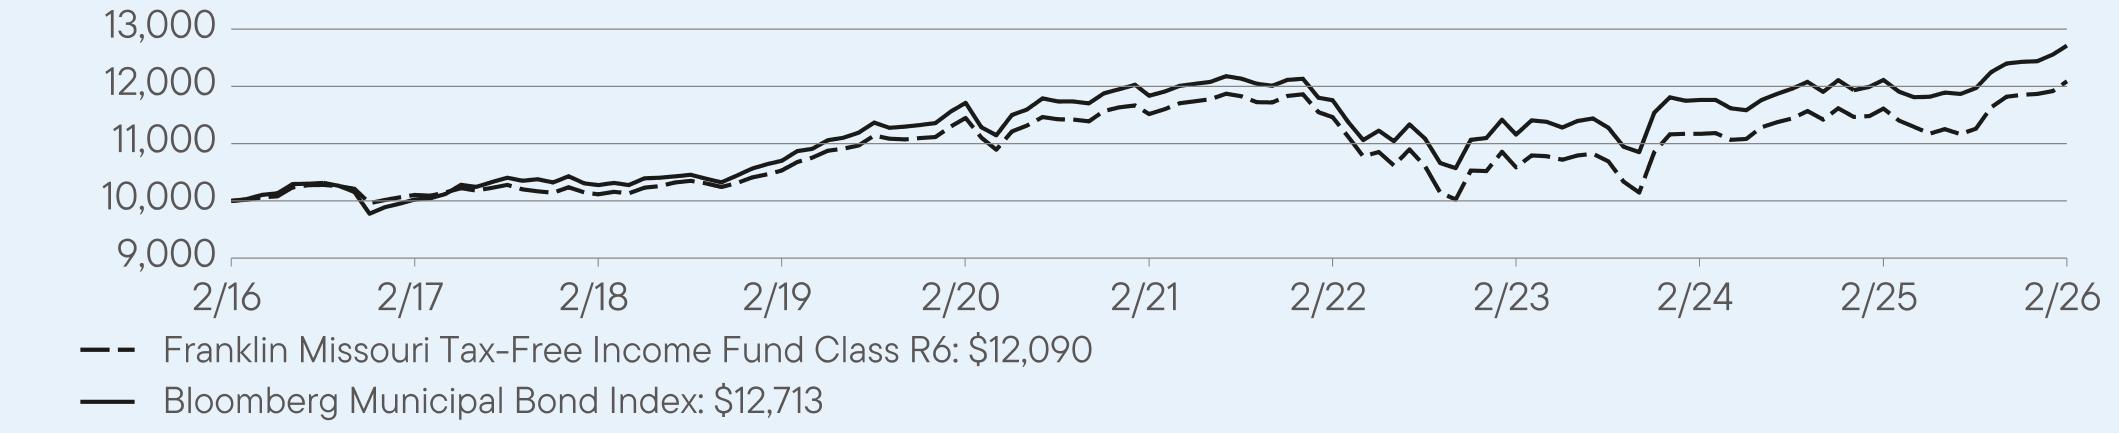
AVERAGE
ANNUAL TOTAL RETURNS (%) Period
Ended February 28, 2026
|
|
1
Year |
5
Year |
10
Year |
|
Class
R6 |
4.11
|
0.97
|
1.92
|
|
Bloomberg
Municipal Bond Index |
4.96
|
1.44
|
2.43
|
For current month-end performance,
please call Franklin Templeton at (800)
DIAL BEN/342-5236 or visit
https://www.franklintempleton.com/investments/options/mutual-funds.
https://www.franklintempleton.com/investments/options/mutual-funds.
Important data provider notices
and terms available at www.franklintempletondatasources.com.
KEY
FUND STATISTICS (as
of February 28, 2026)
|
Total
Net Assets |
$633,628,377
|
|
Total
Number of Portfolio Holdings |
162
|
|
Total
Management Fee Paid |
$3,061,022
|
|
Portfolio
Turnover Rate |
12.36%
|
WHAT
DID THE FUND INVEST IN? (as
of February 28, 2026)
Portfolio Composition*
(% of Total Investments)

WHAT
WERE THE FUND COSTS FOR THE LAST YEAR? (based
on a hypothetical $10,000 investment)
|
Class
Name |
Costs
of a $10,000 investment
|
Costs
paid as a percentage of a $10,000
investment*
|
|
Advisor
Class |
$60
|
0.59%
|
HOW
DID THE FUND PERFORM LAST YEAR AND WHAT AFFECTED ITS PERFORMANCE?
For the twelve months ended February
28, 2026, Advisor Class shares
of Franklin Missouri Tax-Free Income Fund returned 3.98%.
The Fund compares its performance
to the Bloomberg Municipal Bond Index, which returned 4.96% for the same period.
PERFORMANCE
HIGHLIGHTS
|
Top
contributors to performance: | |
|
↑
|
Security
selection in AA rated bonds |
|
↑
|
Overweight
to bonds with no external credit rating |
|
↑
|
Overweight
to bonds with 20 years to maturity |
|
Top
detractors from performance: | |
|
↓
|
Underweight
to bonds with two, five and 10 years to maturity |
|
↓
|
Overweight
to bonds with 30 years to maturity |
|
↓
|
Security
selection in A rated bonds |

AVERAGE
ANNUAL TOTAL RETURNS (%) Period
Ended February 28, 2026
|
|
1
Year |
5
Year |
10
Year |
|
Advisor
Class |
3.98
|
0.92
|
1.89
|
|
Bloomberg
Municipal Bond Index |
4.96
|
1.44
|
2.43
|
For current month-end performance,
please call Franklin Templeton at (800)
DIAL BEN/342-5236 or visit
https://www.franklintempleton.com/investments/options/mutual-funds.
https://www.franklintempleton.com/investments/options/mutual-funds.
Important data provider notices
and terms available at www.franklintempletondatasources.com.
KEY
FUND STATISTICS (as
of February 28, 2026)
|
Total
Net Assets |
$633,628,377
|
|
Total
Number of Portfolio Holdings |
162
|
|
Total
Management Fee Paid |
$3,061,022
|
|
Portfolio
Turnover Rate |
12.36%
|
WHAT
DID THE FUND INVEST IN? (as
of February 28, 2026)
Portfolio Composition*
(% of Total Investments)

WHAT
WERE THE FUND COSTS FOR THE LAST YEAR? (based
on a hypothetical $10,000 investment)
|
Class
Name |
Costs
of a $10,000 investment
|
Costs
paid as a percentage of a $10,000
investment*
|
|
Class
A |
$87
|
0.85%
|
HOW
DID THE FUND PERFORM LAST YEAR AND WHAT AFFECTED ITS PERFORMANCE?
For the twelve months ended February
28, 2026, Class A shares of
Franklin New Jersey Tax-Free Income Fund returned 4.10%.
The Fund compares its performance
to the Bloomberg Municipal Bond Index, which returned 4.96% for the same period.
PERFORMANCE
HIGHLIGHTS
|
Top
contributors to performance: | |
|
An
overweight allocation to: | |
|
↑
|
Bonds
with 20 years to maturity |
|
↑
|
Bonds
with no external credit rating |
|
↑
|
A
rated bonds |
|
Top
detractors from performance: | |
|
↓
|
Underweight
to bonds with two and five years to maturity |
|
↓
|
Overweight
to bonds with 30 years to maturity |
|
↓
|
Selection
in A rated bonds |
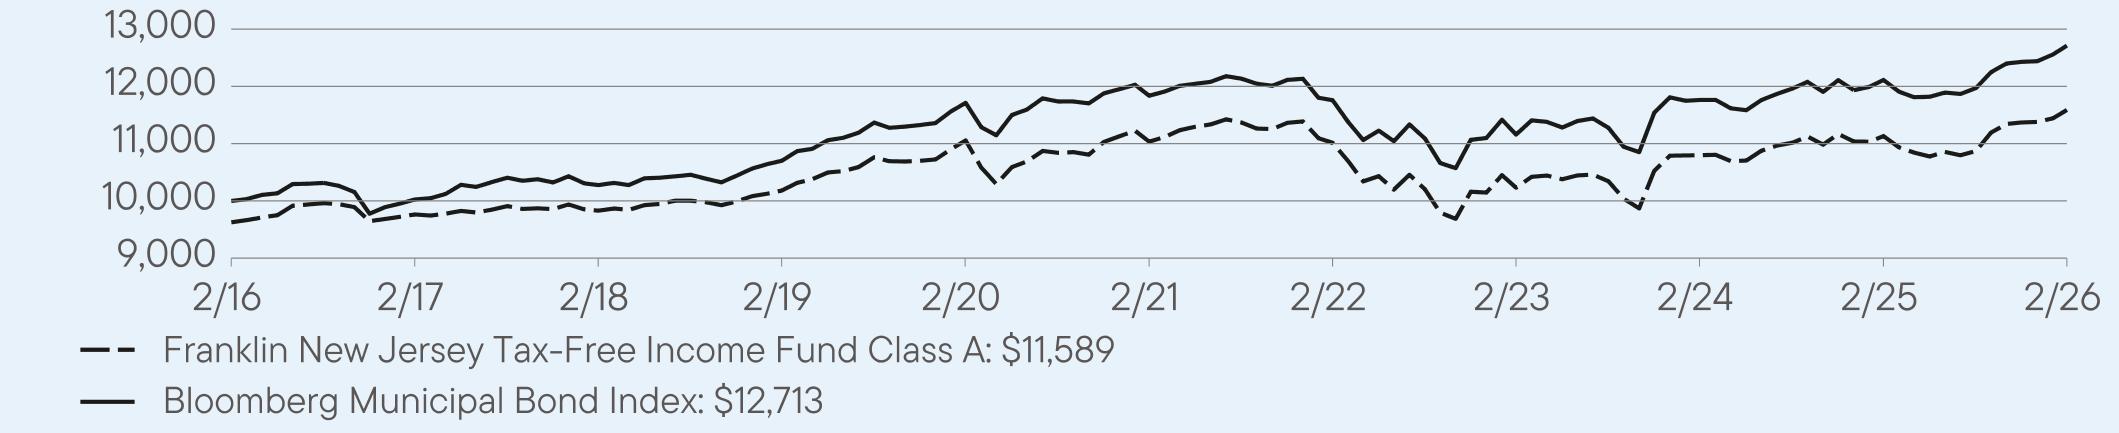
AVERAGE
ANNUAL TOTAL RETURNS (%) Period
Ended February 28, 2026
|
|
1
Year |
5
Year |
10
Year |
|
Class
A |
4.10
|
0.98
|
1.90
|
|
Class
A (with sales charge) |
0.19
|
0.21
|
1.51
|
|
Bloomberg
Municipal Bond Index |
4.96
|
1.44
|
2.43
|
For current month-end performance,
please call Franklin Templeton at (800)
DIAL BEN/342-5236 or visit
https://www.franklintempleton.com/investments/options/mutual-funds.
https://www.franklintempleton.com/investments/options/mutual-funds.
Important data provider notices
and terms available at www.franklintempletondatasources.com.
KEY
FUND STATISTICS (as
of February 28, 2026)
|
Total
Net Assets |
$837,047,147
|
|
Total
Number of Portfolio Holdings |
211
|
|
Total
Management Fee Paid |
$3,851,345
|
|
Portfolio
Turnover Rate |
18.26%
|
WHAT
DID THE FUND INVEST IN? (as
of February 28, 2026)
Portfolio Composition*
(% of Total Investments)
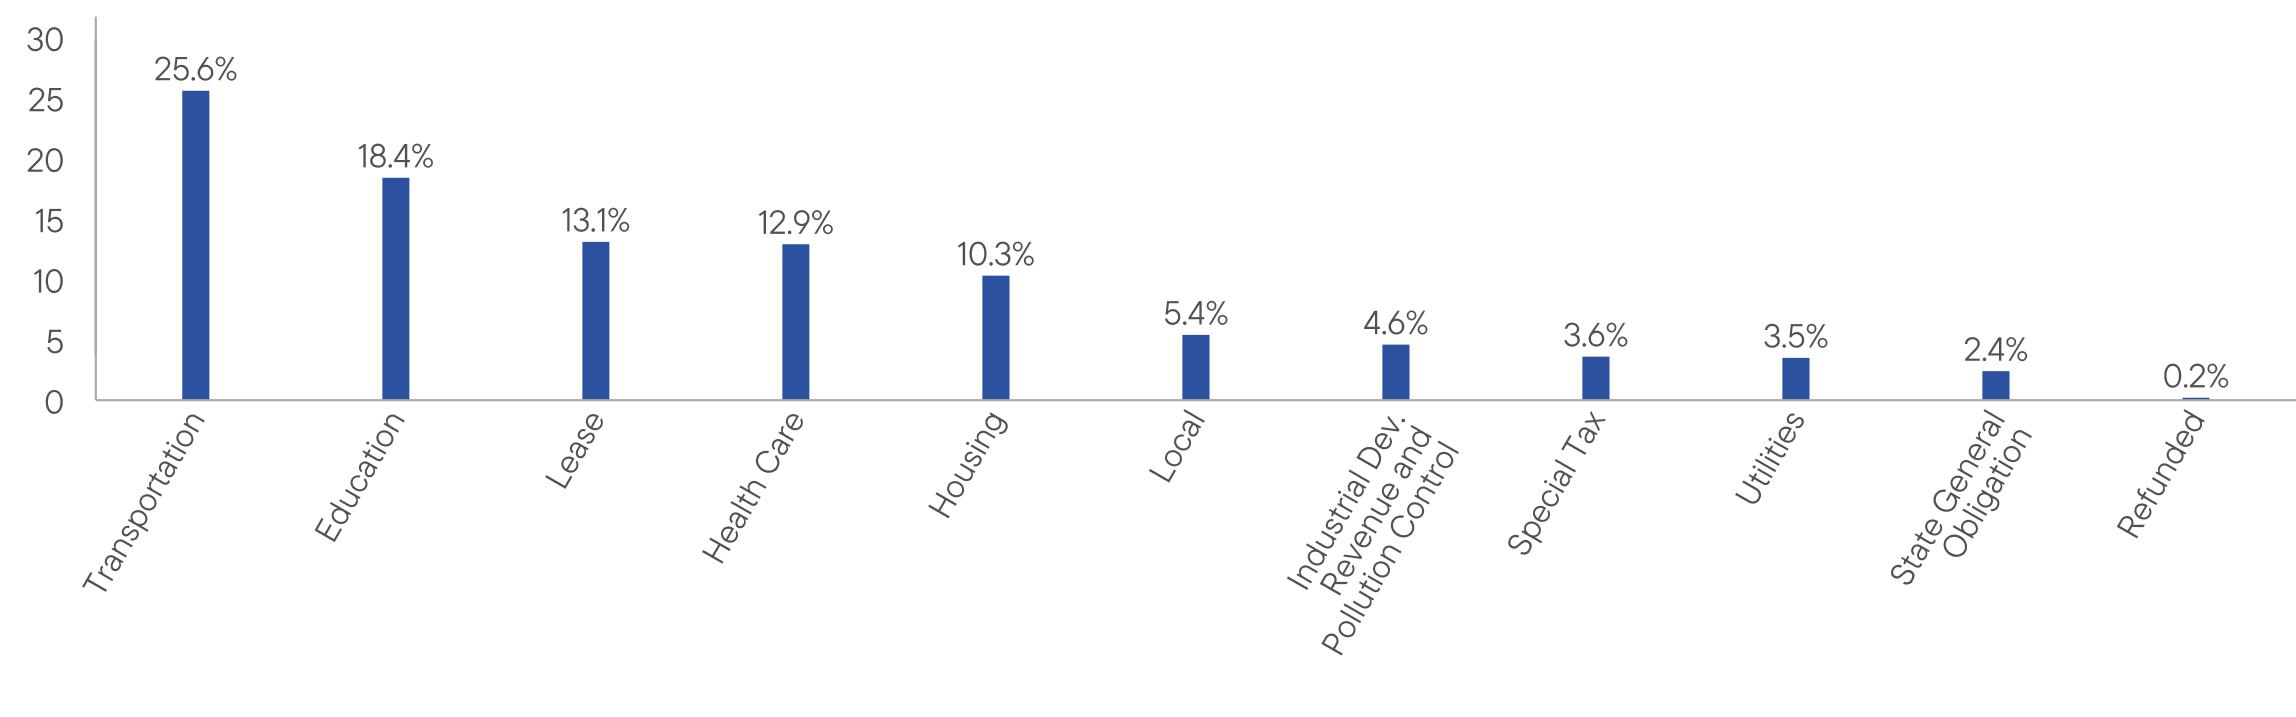
WHAT
WERE THE FUND COSTS FOR THE LAST YEAR? (based
on a hypothetical $10,000 investment)
|
Class
Name |
Costs
of a $10,000 investment
|
Costs
paid as a percentage of a $10,000
investment*
|
|
Class
A1 |
$71
|
0.70%
|
HOW
DID THE FUND PERFORM LAST YEAR AND WHAT AFFECTED ITS PERFORMANCE?
For the twelve months ended February
28, 2026, Class A1 shares of
Franklin New Jersey Tax-Free Income Fund returned 4.16%.
The Fund compares its performance
to the Bloomberg Municipal Bond Index, which returned 4.96% for the same period.
PERFORMANCE
HIGHLIGHTS
|
Top
contributors to performance: | |
|
An
overweight allocation to: | |
|
↑
|
Bonds
with 20 years to maturity |
|
↑
|
Bonds
with no external credit rating |
|
↑
|
A
rated bonds |
|
Top
detractors from performance: | |
|
↓
|
Underweight
to bonds with two and five years to maturity |
|
↓
|
Overweight
to bonds with 30 years to maturity |
|
↓
|
Selection
in A rated bonds |
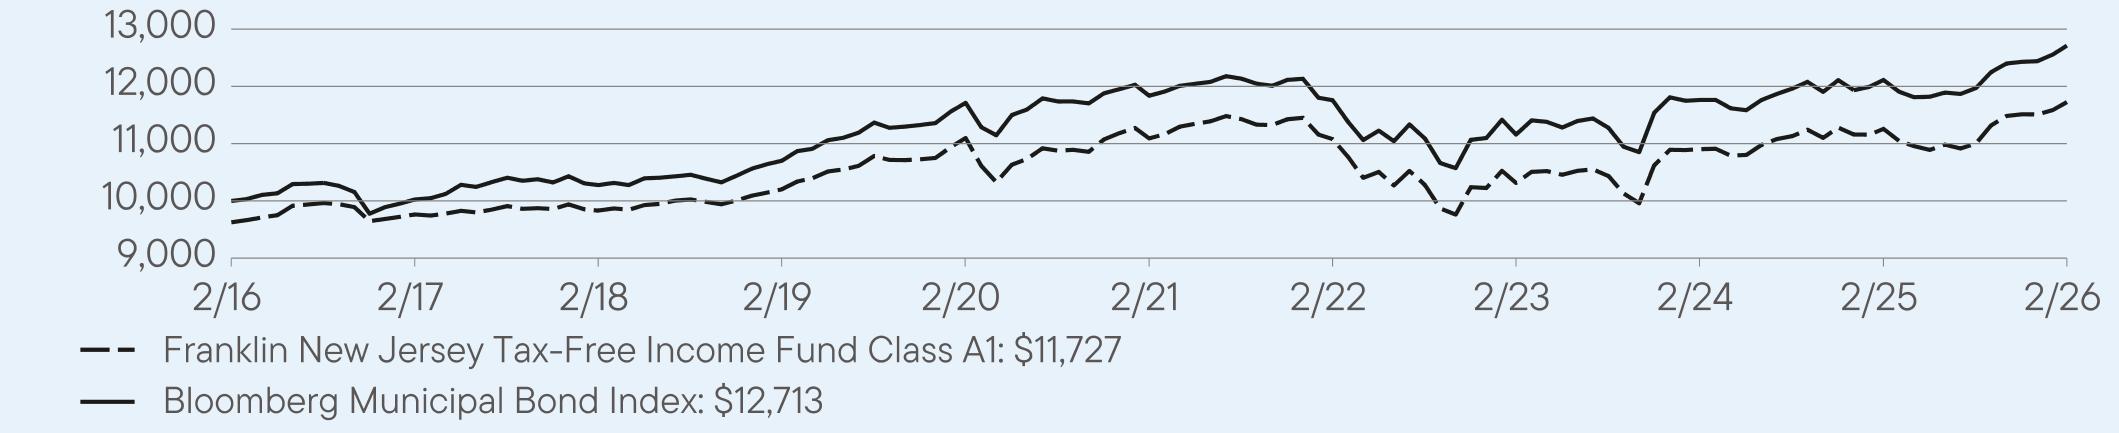
AVERAGE
ANNUAL TOTAL RETURNS (%) Period
Ended February 28, 2026
|
|
1
Year |
5
Year |
10
Year |
|
Class
A1 |
4.16
|
1.12
|
2.00
|
|
Class
A1 (with sales charge) |
0.29
|
0.34
|
1.60
|
|
Bloomberg
Municipal Bond Index |
4.96
|
1.44
|
2.43
|
For current month-end performance,
please call Franklin Templeton at (800)
DIAL BEN/342-5236 or visit
https://www.franklintempleton.com/investments/options/mutual-funds.
https://www.franklintempleton.com/investments/options/mutual-funds.
Important data provider notices
and terms available at www.franklintempletondatasources.com.
KEY
FUND STATISTICS (as
of February 28, 2026)
|
Total
Net Assets |
$837,047,147
|
|
Total
Number of Portfolio Holdings |
211
|
|
Total
Management Fee Paid |
$3,851,345
|
|
Portfolio
Turnover Rate |
18.26%
|
WHAT
DID THE FUND INVEST IN? (as
of February 28, 2026)
Portfolio Composition*
(% of Total Investments)

WHAT
WERE THE FUND COSTS FOR THE LAST YEAR? (based
on a hypothetical $10,000 investment)
|
Class
Name |
Costs
of a $10,000 investment
|
Costs
paid as a percentage of a $10,000
investment*
|
|
Class
C |
$126
|
1.24%
|
HOW
DID THE FUND PERFORM LAST YEAR AND WHAT AFFECTED ITS PERFORMANCE?
For the twelve months ended February
28, 2026, Class C shares of
Franklin New Jersey Tax-Free Income Fund returned 3.63%.
The Fund compares its performance
to the Bloomberg Municipal Bond Index, which returned 4.96% for the same period.
PERFORMANCE
HIGHLIGHTS
|
Top
contributors to performance: | |
|
An
overweight allocation to: | |
|
↑
|
Bonds
with 20 years to maturity |
|
↑
|
Bonds
with no external credit rating |
|
↑
|
A
rated bonds |
|
Top
detractors from performance: | |
|
↓
|
Underweight
to bonds with two and five years to maturity |
|
↓
|
Overweight
to bonds with 30 years to maturity |
|
↓
|
Selection
in A rated bonds |
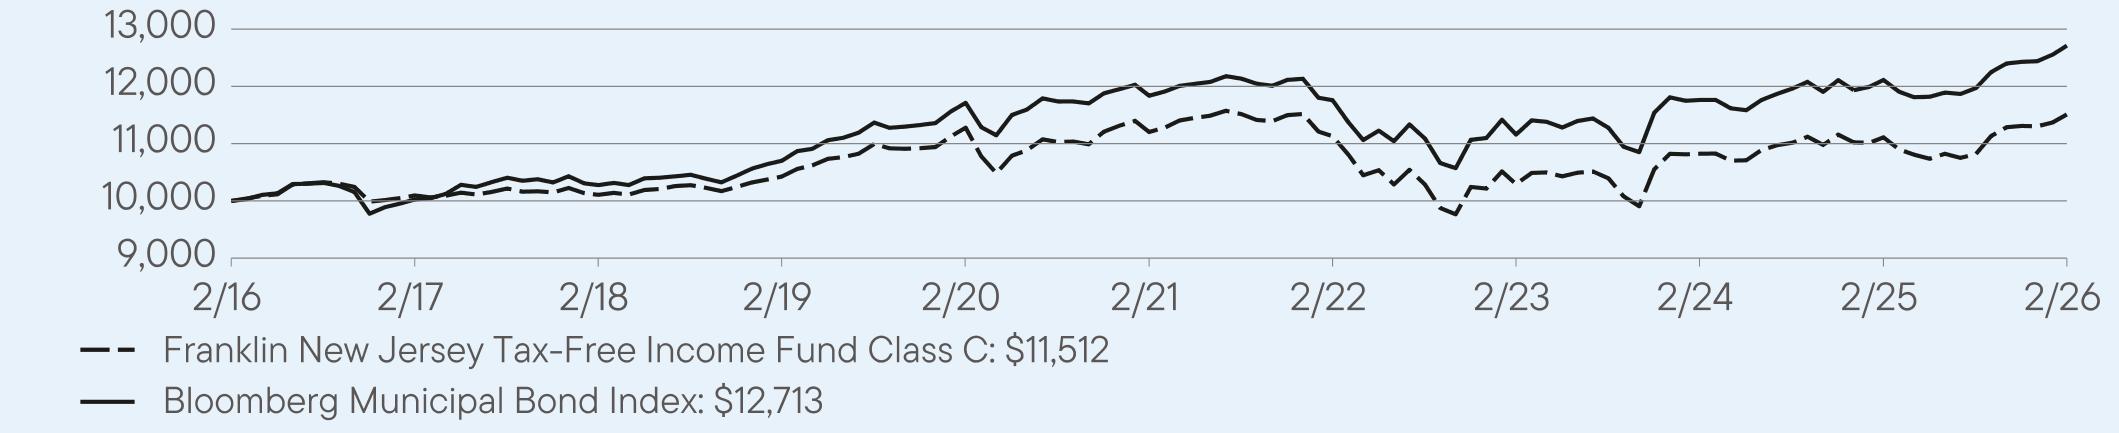
AVERAGE
ANNUAL TOTAL RETURNS (%) Period
Ended February 28, 2026
|
|
1
Year |
5
Year |
10
Year |
|
Class
C |
3.63
|
0.55
|
1.42
|
|
Class
C (with sales charge) |
2.63
|
0.55
|
1.42
|
|
Bloomberg
Municipal Bond Index |
4.96
|
1.44
|
2.43
|
For current month-end performance,
please call Franklin Templeton at (800)
DIAL BEN/342-5236 or visit
https://www.franklintempleton.com/investments/options/mutual-funds.
https://www.franklintempleton.com/investments/options/mutual-funds.
Important data provider notices
and terms available at www.franklintempletondatasources.com.
KEY
FUND STATISTICS (as
of February 28, 2026)
|
Total
Net Assets |
$837,047,147
|
|
Total
Number of Portfolio Holdings |
211
|
|
Total
Management Fee Paid |
$3,851,345
|
|
Portfolio
Turnover Rate |
18.26%
|
WHAT
DID THE FUND INVEST IN? (as
of February 28, 2026)
Portfolio Composition*
(% of Total Investments)

WHAT
WERE THE FUND COSTS FOR THE LAST YEAR? (based
on a hypothetical $10,000 investment)
|
Class
Name |
Costs
of a $10,000 investment
|
Costs
paid as a percentage of a $10,000
investment |
|
Class
R6 |
$54
|
0.53%
|
HOW
DID THE FUND PERFORM LAST YEAR AND WHAT AFFECTED ITS PERFORMANCE?
For the twelve months ended February
28, 2026, Class R6 shares of
Franklin New Jersey Tax-Free Income Fund returned 4.42%.
The Fund compares its performance
to the Bloomberg Municipal Bond Index, which returned 4.96% for the same period.
PERFORMANCE
HIGHLIGHTS
|
Top
contributors to performance: | |
|
An
overweight allocation to: | |
|
↑
|
Bonds
with 20 years to maturity |
|
↑
|
Bonds
with no external credit rating |
|
↑
|
A
rated bonds |
|
Top
detractors from performance: | |
|
↓
|
Underweight
to bonds with two and five years to maturity |
|
↓
|
Overweight
to bonds with 30 years to maturity |
|
↓
|
Selection
in A rated bonds |
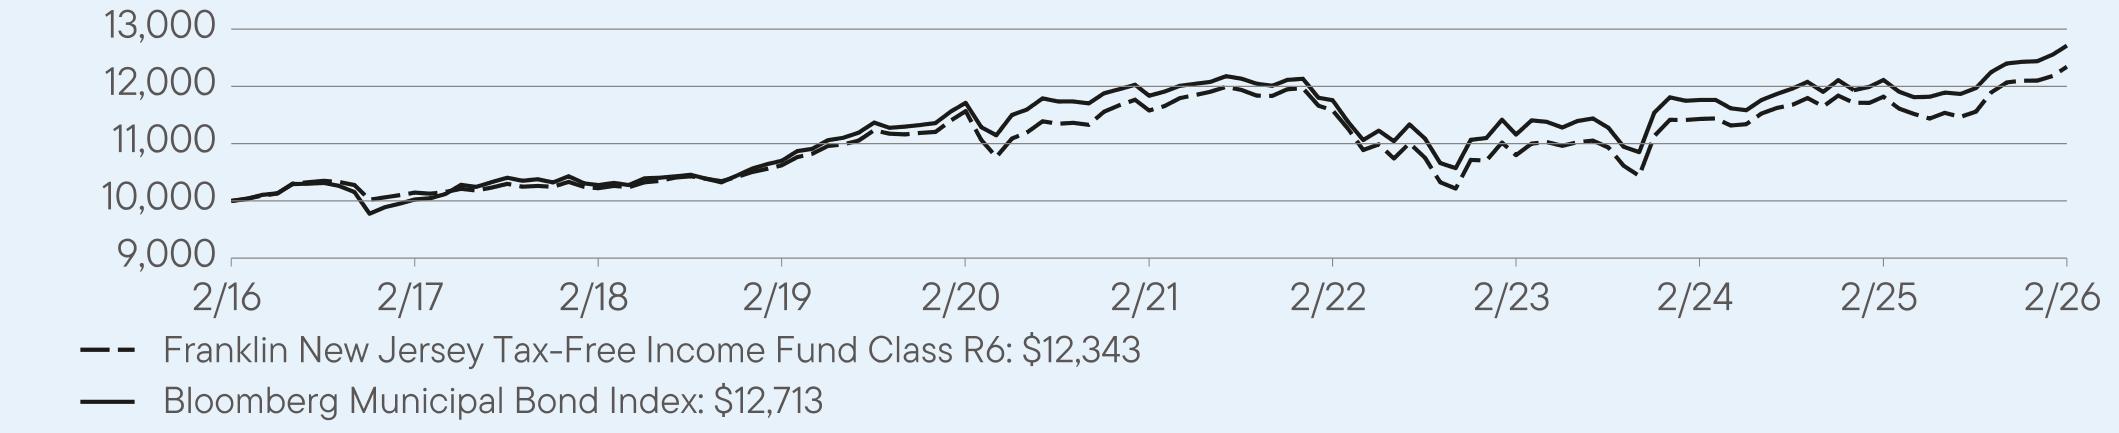
AVERAGE
ANNUAL TOTAL RETURNS (%) Period
Ended February 28, 2026
|
|
1
Year |
5
Year |
10
Year |
|
Class
R6 |
4.42
|
1.29
|
2.14
|
|
Bloomberg
Municipal Bond Index |
4.96
|
1.44
|
2.43
|
For current month-end performance,
please call Franklin Templeton at (800)
DIAL BEN/342-5236 or visit
https://www.franklintempleton.com/investments/options/mutual-funds.
https://www.franklintempleton.com/investments/options/mutual-funds.
Important data provider notices
and terms available at www.franklintempletondatasources.com.
KEY
FUND STATISTICS (as
of February 28, 2026)
|
Total
Net Assets |
$837,047,147
|
|
Total
Number of Portfolio Holdings |
211
|
|
Total
Management Fee Paid |
$3,851,345
|
|
Portfolio
Turnover Rate |
18.26%
|
WHAT
DID THE FUND INVEST IN? (as
of February 28, 2026)
Portfolio Composition*
(% of Total Investments)

WHAT
WERE THE FUND COSTS FOR THE LAST YEAR? (based
on a hypothetical $10,000 investment)
|
Class
Name |
Costs
of a $10,000 investment
|
Costs
paid as a percentage of a $10,000
investment*
|
|
Advisor
Class |
$61
|
0.60%
|
HOW
DID THE FUND PERFORM LAST YEAR AND WHAT AFFECTED ITS PERFORMANCE?
For the twelve months ended February
28, 2026, Advisor Class shares
of Franklin New Jersey Tax-Free Income Fund returned 4.26%.
The Fund compares its performance
to the Bloomberg Municipal Bond Index, which returned 4.96% for the same period.
PERFORMANCE
HIGHLIGHTS
|
Top
contributors to performance: | |
|
An
overweight allocation to: | |
|
↑
|
Bonds
with 20 years to maturity |
|
↑
|
Bonds
with no external credit rating |
|
↑
|
A
rated bonds |
|
Top
detractors from performance: | |
|
↓
|
Underweight
to bonds with two and five years to maturity |
|
↓
|
Overweight
to bonds with 30 years to maturity |
|
↓
|
Selection
in A rated bonds |
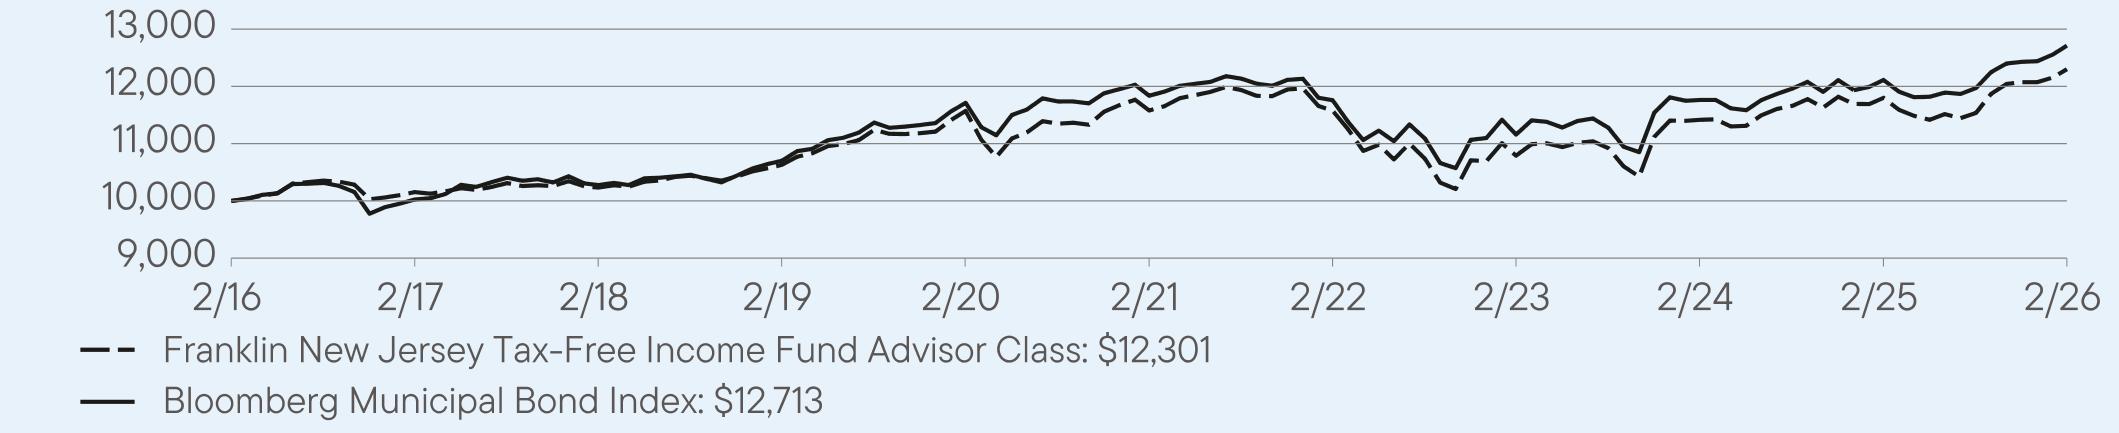
AVERAGE
ANNUAL TOTAL RETURNS (%) Period
Ended February 28, 2026
|
|
1
Year |
5
Year |
10
Year |
|
Advisor
Class |
4.26
|
1.22
|
2.10
|
|
Bloomberg
Municipal Bond Index |
4.96
|
1.44
|
2.43
|
For current month-end performance,
please call Franklin Templeton at (800)
DIAL BEN/342-5236 or visit
https://www.franklintempleton.com/investments/options/mutual-funds.
https://www.franklintempleton.com/investments/options/mutual-funds.
Important data provider notices
and terms available at www.franklintempletondatasources.com.
KEY
FUND STATISTICS (as
of February 28, 2026)
|
Total
Net Assets |
$837,047,147
|
|
Total
Number of Portfolio Holdings |
211
|
|
Total
Management Fee Paid |
$3,851,345
|
|
Portfolio
Turnover Rate |
18.26%
|
WHAT
DID THE FUND INVEST IN? (as
of February 28, 2026)
Portfolio Composition*
(% of Total Investments)

WHAT
WERE THE FUND COSTS FOR THE LAST YEAR? (based
on a hypothetical $10,000 investment)
|
Class
Name |
Costs
of a $10,000 investment
|
Costs
paid as a percentage of a $10,000
investment*
|
|
Class
A |
$88
|
0.86%
|
HOW
DID THE FUND PERFORM LAST YEAR AND WHAT AFFECTED ITS PERFORMANCE?
For the twelve months ended February
28, 2026, Class A shares of
Franklin North Carolina Tax-Free Income Fund returned 4.19%.
The Fund compares its performance
to the Bloomberg Municipal Bond Index, which returned 4.96% for the same period.
PERFORMANCE
HIGHLIGHTS
|
Top
contributors to performance: | |
|
↑
|
Overweight
to bonds with no external credit rating |
|
↑
|
Overweight
to bonds with 20 years or more to maturity |
|
↑
|
Security
selection in BBB rated bonds |
|
Top
detractors from performance: | |
|
↓
|
Underweight
to bonds with two and five years to maturity |
|
↓
|
Security
selection in AA rated bonds |
|
↓
|
Security
selection in A rated bonds |
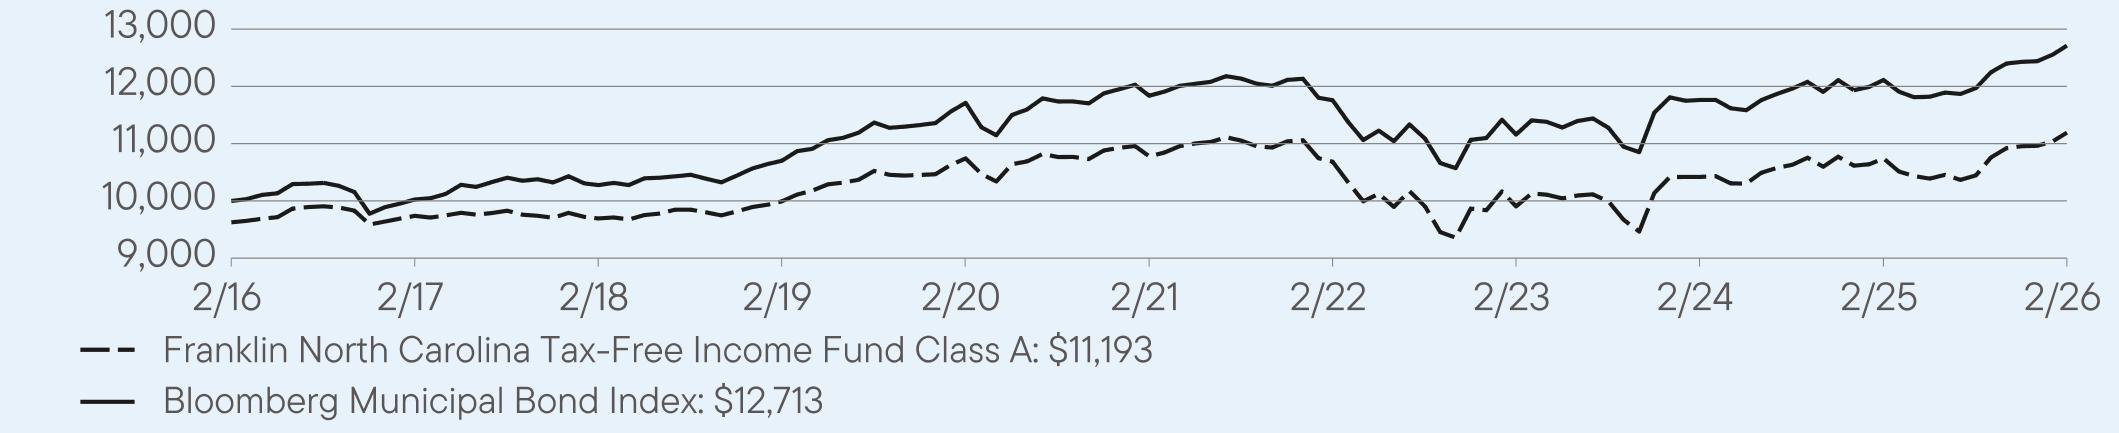
AVERAGE
ANNUAL TOTAL RETURNS (%) Period
Ended February 28, 2026
|
|
1
Year |
5
Year |
10
Year |
|
Class
A |
4.19
|
0.75
|
1.54
|
|
Class
A (with sales charge) |
0.28
|
-0.01
|
1.15
|
|
Bloomberg
Municipal Bond Index |
4.96
|
1.44
|
2.43
|
For current month-end performance,
please call Franklin Templeton at (800)
DIAL BEN/342-5236 or visit
https://www.franklintempleton.com/investments/options/mutual-funds.
https://www.franklintempleton.com/investments/options/mutual-funds.
Important data provider notices
and terms available at www.franklintempletondatasources.com.
KEY
FUND STATISTICS (as
of February 28, 2026)
|
Total
Net Assets |
$585,863,903
|
|
Total
Number of Portfolio Holdings |
204
|
|
Total
Management Fee Paid |
$2,828,219
|
|
Portfolio
Turnover Rate |
16.41%
|
WHAT
DID THE FUND INVEST IN? (as
of February 28, 2026)
Portfolio Composition*
(% of Total Investments)
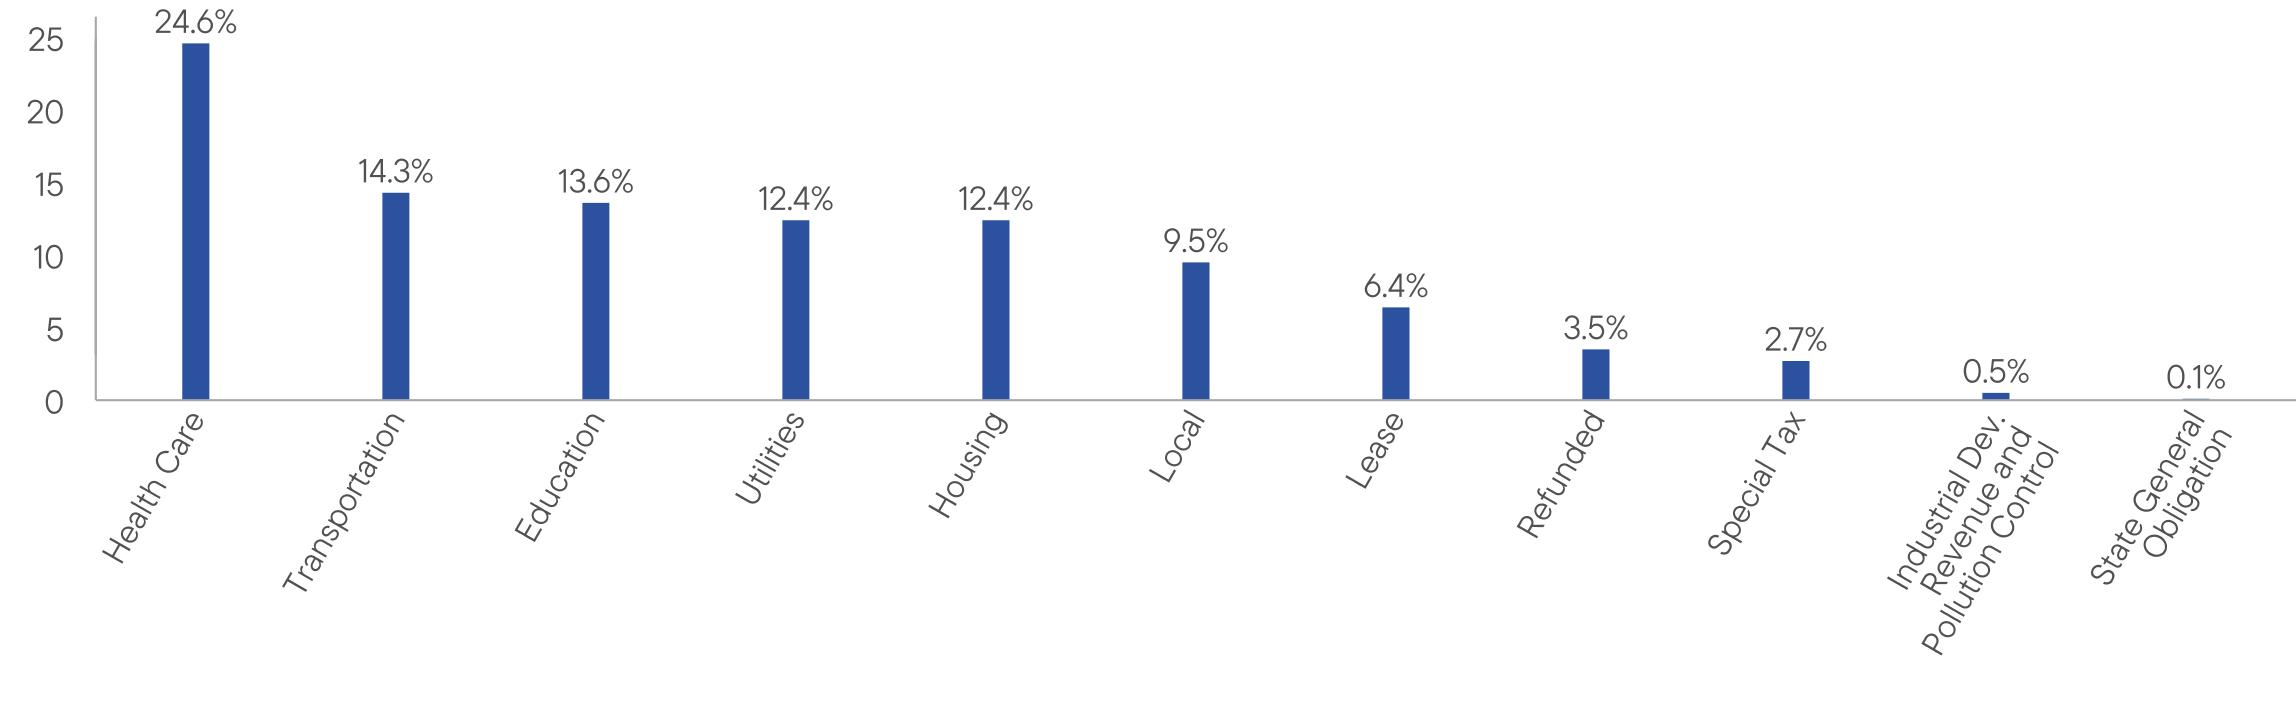
WHAT
WERE THE FUND COSTS FOR THE LAST YEAR? (based
on a hypothetical $10,000 investment)
|
Class
Name |
Costs
of a $10,000 investment
|
Costs
paid as a percentage of a $10,000
investment*
|
|
Class
A1 |
$73
|
0.71%
|
HOW
DID THE FUND PERFORM LAST YEAR AND WHAT AFFECTED ITS PERFORMANCE?
For the twelve months ended February
28, 2026, Class A1 shares of
Franklin North Carolina Tax-Free Income Fund returned 4.35%.
The Fund compares its performance
to the Bloomberg Municipal Bond Index, which returned 4.96% for the same period.
PERFORMANCE
HIGHLIGHTS
|
Top
contributors to performance: | |
|
↑
|
Overweight
to bonds with no external credit rating |
|
↑
|
Overweight
to bonds with 20 years or more to maturity |
|
↑
|
Security
selection in BBB rated bonds |
|
Top
detractors from performance: | |
|
↓
|
Underweight
to bonds with two and five years to maturity |
|
↓
|
Security
selection in AA rated bonds |
|
↓
|
Security
selection in A rated bonds |
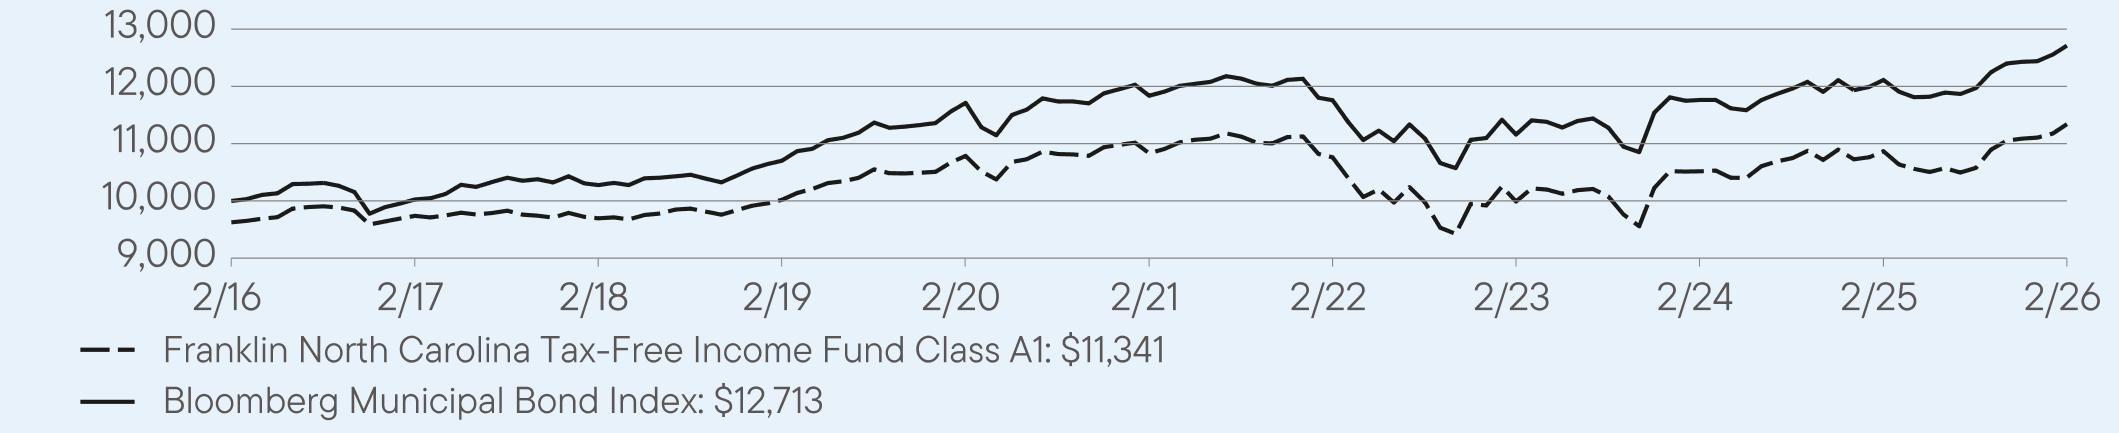
AVERAGE
ANNUAL TOTAL RETURNS (%) Period
Ended February 28, 2026
|
|
1
Year |
5
Year |
10
Year |
|
Class
A1 |
4.35
|
0.92
|
1.66
|
|
Class
A1 (with sales charge) |
0.44
|
0.16
|
1.27
|
|
Bloomberg
Municipal Bond Index |
4.96
|
1.44
|
2.43
|
For current month-end performance,
please call Franklin Templeton at (800)
DIAL BEN/342-5236 or visit
https://www.franklintempleton.com/investments/options/mutual-funds.
https://www.franklintempleton.com/investments/options/mutual-funds.
Important data provider notices
and terms available at www.franklintempletondatasources.com.
KEY
FUND STATISTICS (as
of February 28, 2026)
|
Total
Net Assets |
$585,863,903
|
|
Total
Number of Portfolio Holdings |
204
|
|
Total
Management Fee Paid |
$2,828,219
|
|
Portfolio
Turnover Rate |
16.41%
|
WHAT
DID THE FUND INVEST IN? (as
of February 28, 2026)
Portfolio Composition*
(% of Total Investments)

WHAT
WERE THE FUND COSTS FOR THE LAST YEAR? (based
on a hypothetical $10,000 investment)
|
Class
Name |
Costs
of a $10,000 investment
|
Costs
paid as a percentage of a $10,000
investment*
|
|
Class
C |
$127
|
1.25%
|
HOW
DID THE FUND PERFORM LAST YEAR AND WHAT AFFECTED ITS PERFORMANCE?
For the twelve months ended February
28, 2026, Class C shares of
Franklin North Carolina Tax-Free Income Fund returned 3.61%.
The Fund compares its performance
to the Bloomberg Municipal Bond Index, which returned 4.96% for the same period.
PERFORMANCE
HIGHLIGHTS
|
Top
contributors to performance: | |
|
↑
|
Overweight
to bonds with no external credit rating |
|
↑
|
Overweight
to bonds with 20 years or more to maturity |
|
↑
|
Security
selection in BBB rated bonds |
|
Top
detractors from performance: | |
|
↓
|
Underweight
to bonds with two and five years to maturity |
|
↓
|
Security
selection in AA rated bonds |
|
↓
|
Security
selection in A rated bonds |
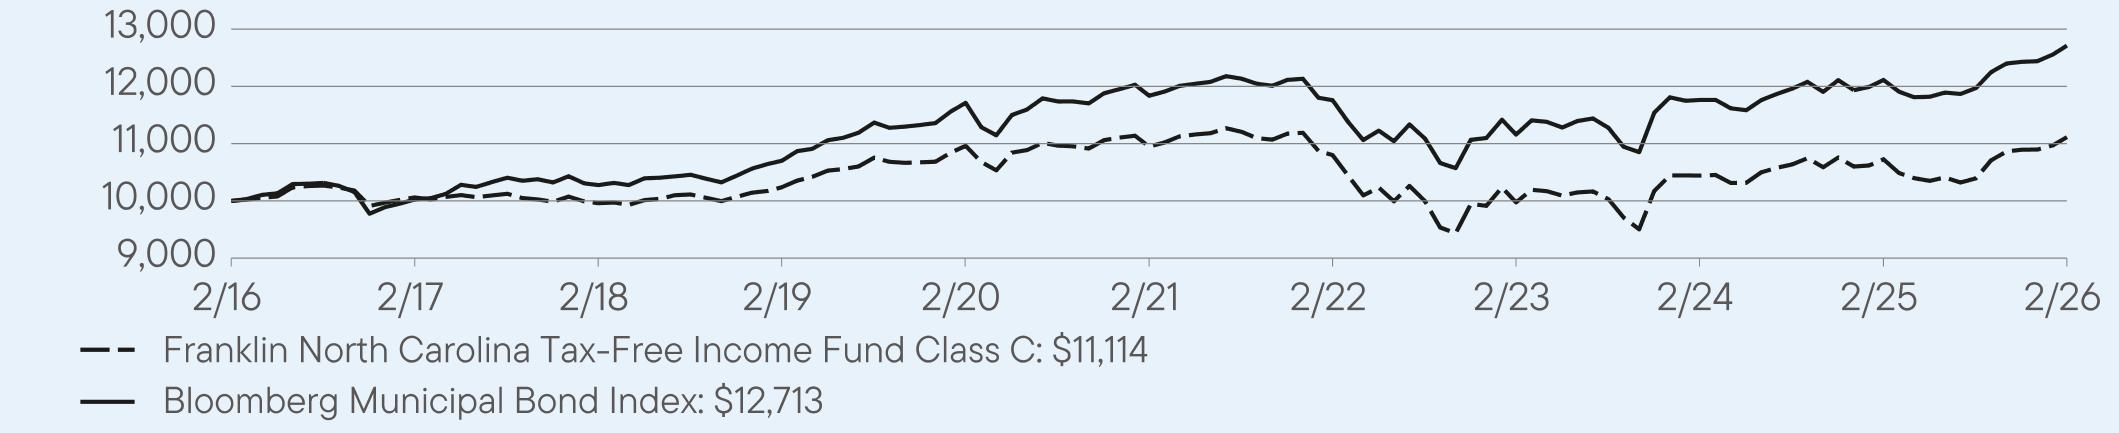
AVERAGE
ANNUAL TOTAL RETURNS (%) Period
Ended February 28, 2026
|
|
1
Year |
5
Year |
10
Year |
|
Class
C |
3.61
|
0.30
|
1.06
|
|
Class
C (with sales charge) |
2.61
|
0.30
|
1.06
|
|
Bloomberg
Municipal Bond Index |
4.96
|
1.44
|
2.43
|
For current month-end performance,
please call Franklin Templeton at (800)
DIAL BEN/342-5236 or visit
https://www.franklintempleton.com/investments/options/mutual-funds.
https://www.franklintempleton.com/investments/options/mutual-funds.
Important data provider notices
and terms available at www.franklintempletondatasources.com.
KEY
FUND STATISTICS (as
of February 28, 2026)
|
Total
Net Assets |
$585,863,903
|
|
Total
Number of Portfolio Holdings |
204
|
|
Total
Management Fee Paid |
$2,828,219
|
|
Portfolio
Turnover Rate |
16.41%
|
WHAT
DID THE FUND INVEST IN? (as
of February 28, 2026)
Portfolio Composition*
(% of Total Investments)

WHAT
WERE THE FUND COSTS FOR THE LAST YEAR? (based
on a hypothetical $10,000 investment)
|
Class
Name |
Costs
of a $10,000 investment
|
Costs
paid as a percentage of a $10,000
investment |
|
Class
R6 |
$57
|
0.56%
|
HOW
DID THE FUND PERFORM LAST YEAR AND WHAT AFFECTED ITS PERFORMANCE?
For the twelve months ended February
28, 2026, Class R6 shares of
Franklin North Carolina Tax-Free Income Fund returned 4.41%.
The Fund compares its performance
to the Bloomberg Municipal Bond Index, which returned 4.96% for the same period.
PERFORMANCE
HIGHLIGHTS
|
Top
contributors to performance: | |
|
↑
|
Overweight
to bonds with no external credit rating |
|
↑
|
Overweight
to bonds with 20 years or more to maturity |
|
↑
|
Security
selection in BBB rated bonds |
|
Top
detractors from performance: | |
|
↓
|
Underweight
to bonds with two and five years to maturity |
|
↓
|
Security
selection in AA rated bonds |
|
↓
|
Security
selection in A rated bonds |
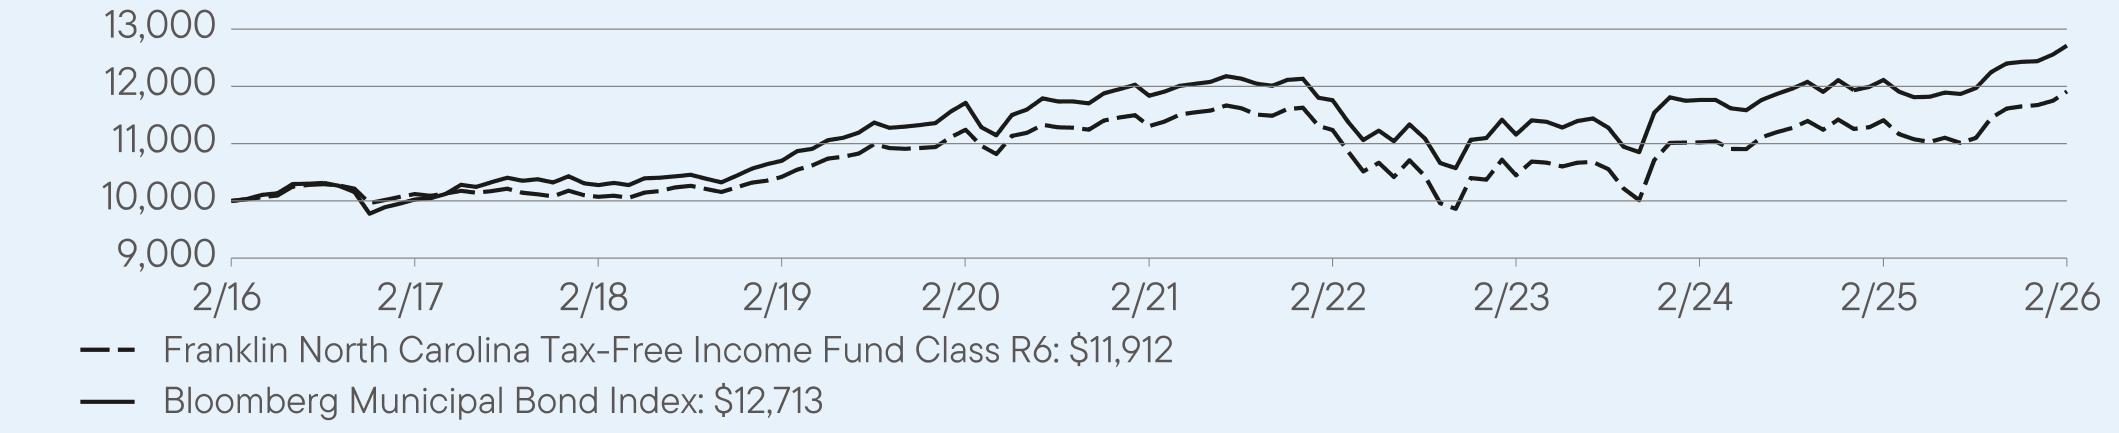
AVERAGE
ANNUAL TOTAL RETURNS (%) Period
Ended February 28, 2026
|
|
1
Year |
5
Year |
10
Year |
|
Class
R6 |
4.41
|
1.05
|
1.78
|
|
Bloomberg
Municipal Bond Index |
4.96
|
1.44
|
2.43
|
For current month-end performance,
please call Franklin Templeton at (800)
DIAL BEN/342-5236 or visit
https://www.franklintempleton.com/investments/options/mutual-funds.
https://www.franklintempleton.com/investments/options/mutual-funds.
Important data provider notices
and terms available at www.franklintempletondatasources.com.
KEY
FUND STATISTICS (as
of February 28, 2026)
|
Total
Net Assets |
$585,863,903
|
|
Total
Number of Portfolio Holdings |
204
|
|
Total
Management Fee Paid |
$2,828,219
|
|
Portfolio
Turnover Rate |
16.41%
|
WHAT
DID THE FUND INVEST IN? (as
of February 28, 2026)
Portfolio Composition*
(% of Total Investments)

WHAT
WERE THE FUND COSTS FOR THE LAST YEAR? (based
on a hypothetical $10,000 investment)
|
Class
Name |
Costs
of a $10,000 investment
|
Costs
paid as a percentage of a $10,000
investment*
|
|
Advisor
Class |
$62
|
0.61%
|
HOW
DID THE FUND PERFORM LAST YEAR AND WHAT AFFECTED ITS PERFORMANCE?
For the twelve months ended February
28, 2026, Advisor Class shares
of Franklin North Carolina Tax-Free Income Fund returned 4.45%.
The Fund compares its performance to the Bloomberg Municipal Bond Index, which returned 4.96% for the same period.
PERFORMANCE
HIGHLIGHTS
|
Top
contributors to performance: | |
|
↑
|
Overweight
to bonds with no external credit rating |
|
↑
|
Overweight
to bonds with 20 years or more to maturity |
|
↑
|
Security
selection in BBB rated bonds |
|
Top
detractors from performance: | |
|
↓
|
Underweight
to bonds with two and five years to maturity |
|
↓
|
Security
selection in AA rated bonds |
|
↓
|
Security
selection in A rated bonds |
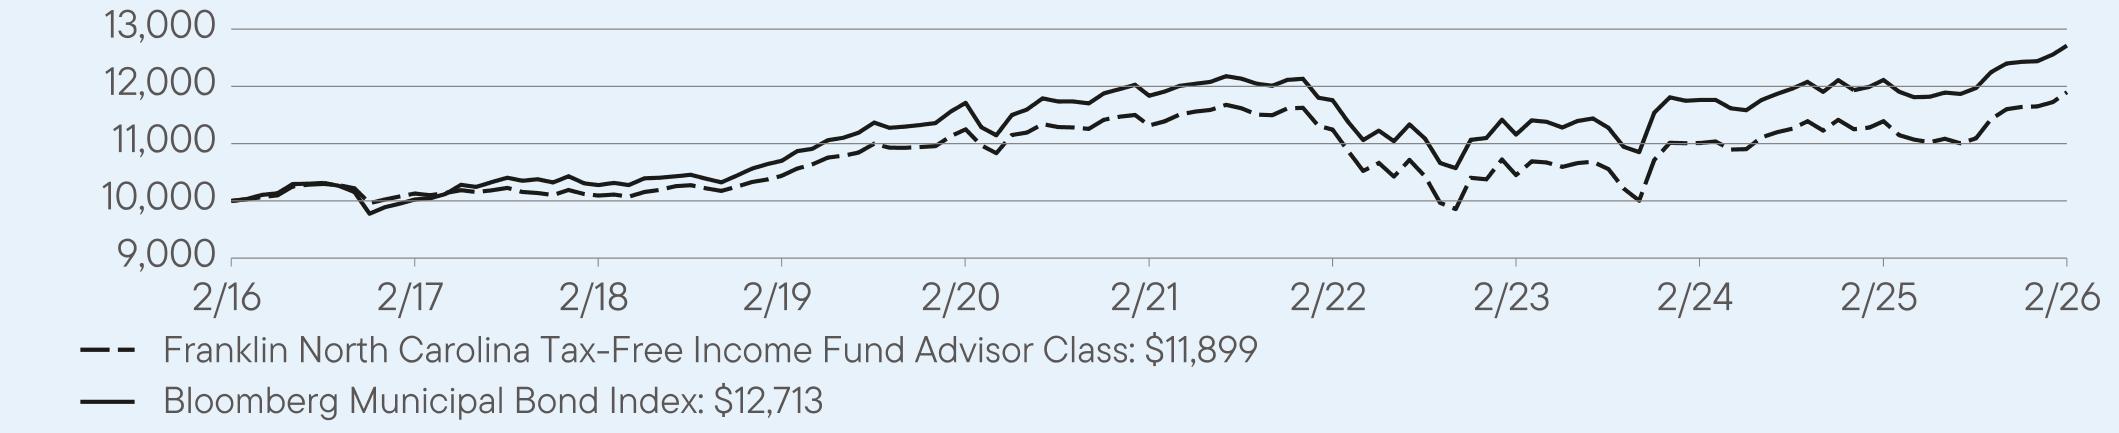
AVERAGE
ANNUAL TOTAL RETURNS (%) Period
Ended February 28, 2026
|
|
1
Year |
5
Year |
10
Year |
|
Advisor
Class |
4.45
|
1.01
|
1.76
|
|
Bloomberg
Municipal Bond Index |
4.96
|
1.44
|
2.43
|
For current month-end performance,
please call Franklin Templeton at (800)
DIAL BEN/342-5236 or visit
https://www.franklintempleton.com/investments/options/mutual-funds.
https://www.franklintempleton.com/investments/options/mutual-funds.
Important data provider notices
and terms available at www.franklintempletondatasources.com.
KEY
FUND STATISTICS (as
of February 28, 2026)
|
Total
Net Assets |
$585,863,903
|
|
Total
Number of Portfolio Holdings |
204
|
|
Total
Management Fee Paid |
$2,828,219
|
|
Portfolio
Turnover Rate |
16.41%
|
WHAT
DID THE FUND INVEST IN? (as
of February 28, 2026)
Portfolio Composition*
(% of Total Investments)

WHAT
WERE THE FUND COSTS FOR THE LAST YEAR? (based
on a hypothetical $10,000 investment)
|
Class
Name |
Costs
of a $10,000 investment
|
Costs
paid as a percentage of a $10,000
investment*
|
|
Class
A |
$84
|
0.82%
|
HOW
DID THE FUND PERFORM LAST YEAR AND WHAT AFFECTED ITS PERFORMANCE?
For the twelve months ended February
28, 2026, Class A shares of
Franklin Ohio Tax-Free Income Fund returned 4.21%.
The Fund compares its performance
to the Bloomberg Municipal Bond Index, which returned 4.96% for the same period.
PERFORMANCE
HIGHLIGHTS
|
Top
contributors to performance: | |
|
↑
|
Overweight
to bonds with no external credit rating |
|
↑
|
Security
selection in AA rated bonds |
|
↑
|
Security
selection in AAA rated bonds |
|
Top
detractors from performance: | |
|
↓
|
Underweight
to bonds with five and 10 years to maturity |
|
↓
|
Overweight
to bonds with 30 years to maturity |
|
↓
|
Security
selection in A rated bonds |
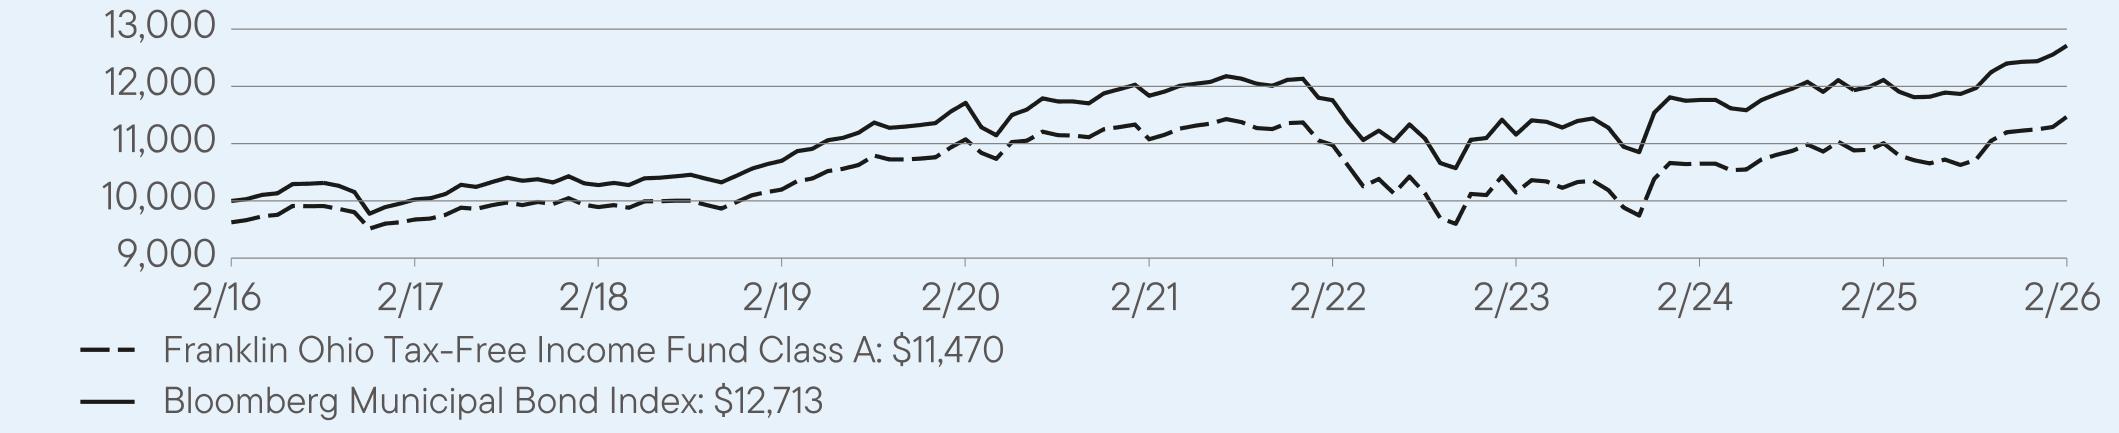
AVERAGE
ANNUAL TOTAL RETURNS (%) Period
Ended February 28, 2026
|
|
1
Year |
5
Year |
10
Year |
|
Class
A |
4.21
|
0.70
|
1.79
|
|
Class
A (with sales charge) |
0.31
|
-0.07
|
1.40
|
|
Bloomberg
Municipal Bond Index |
4.96
|
1.44
|
2.43
|
For current month-end performance,
please call Franklin Templeton at (800)
DIAL BEN/342-5236 or visit
https://www.franklintempleton.com/investments/options/mutual-funds.
https://www.franklintempleton.com/investments/options/mutual-funds.
Important data provider notices
and terms available at www.franklintempletondatasources.com.
KEY
FUND STATISTICS (as
of February 28, 2026)
|
Total
Net Assets |
$916,240,647
|
|
Total
Number of Portfolio Holdings |
239
|
|
Total
Management Fee Paid |
$4,418,096
|
|
Portfolio
Turnover Rate |
10.45%
|
WHAT
DID THE FUND INVEST IN? (as
of February 28, 2026)
Portfolio Composition*
(% of Total Investments)

WHAT
WERE THE FUND COSTS FOR THE LAST YEAR? (based
on a hypothetical $10,000 investment)
|
Class
Name |
Costs
of a $10,000 investment
|
Costs
paid as a percentage of a $10,000
investment*
|
|
Class
A1 |
$68
|
0.67%
|
HOW
DID THE FUND PERFORM LAST YEAR AND WHAT AFFECTED ITS PERFORMANCE?
For the twelve months ended February
28, 2026, Class A1 shares of
Franklin Ohio Tax-Free Income Fund returned 4.37%.
The Fund compares its performance
to the Bloomberg Municipal Bond Index, which returned 4.96% for the same period.
PERFORMANCE
HIGHLIGHTS
|
Top
contributors to performance: | |
|
↑
|
Overweight
to bonds with no external credit rating |
|
↑
|
Security
selection in AA rated bonds |
|
↑
|
Security
selection in AAA rated bonds |
|
Top
detractors from performance: | |
|
↓
|
Underweight
to bonds with five and 10 years to maturity |
|
↓
|
Overweight
to bonds with 30 years to maturity |
|
↓
|
Security
selection in A rated bonds |

AVERAGE
ANNUAL TOTAL RETURNS (%) Period
Ended February 28, 2026
|
|
1
Year |
5
Year |
10
Year |
|
Class
A1 |
4.37
|
0.84
|
1.90
|
|
Class
A1 (with sales charge) |
0.45
|
0.07
|
1.51
|
|
Bloomberg
Municipal Bond Index |
4.96
|
1.44
|
2.43
|
For current month-end performance,
please call Franklin Templeton at (800)
DIAL BEN/342-5236 or visit
https://www.franklintempleton.com/investments/options/mutual-funds.
https://www.franklintempleton.com/investments/options/mutual-funds.
Important data provider notices
and terms available at www.franklintempletondatasources.com.
KEY
FUND STATISTICS (as
of February 28, 2026)
|
Total
Net Assets |
$916,240,647
|
|
Total
Number of Portfolio Holdings |
239
|
|
Total
Management Fee Paid |
$4,418,096
|
|
Portfolio
Turnover Rate |
10.45%
|
WHAT
DID THE FUND INVEST IN? (as
of February 28, 2026)
Portfolio Composition*
(% of Total Investments)

WHAT
WERE THE FUND COSTS FOR THE LAST YEAR? (based
on a hypothetical $10,000 investment)
|
Class
Name |
Costs
of a $10,000 investment
|
Costs
paid as a percentage of a $10,000
investment*
|
|
Class
C |
$124
|
1.22%
|
HOW
DID THE FUND PERFORM LAST YEAR AND WHAT AFFECTED ITS PERFORMANCE?
For the twelve months ended February
28, 2026, Class C shares of
Franklin Ohio Tax-Free Income Fund returned 3.74%.
The Fund compares its performance
to the Bloomberg Municipal Bond Index, which returned 4.96% for the same period.
PERFORMANCE
HIGHLIGHTS
|
Top
contributors to performance: | |
|
↑
|
Overweight
to bonds with no external credit rating |
|
↑
|
Security
selection in AA rated bonds |
|
↑
|
Security
selection in AAA rated bonds |
|
Top
detractors from performance: | |
|
↓
|
Underweight
to bonds with five and 10 years to maturity |
|
↓
|
Overweight
to bonds with 30 years to maturity |
|
↓
|
Security
selection in A rated bonds |

AVERAGE
ANNUAL TOTAL RETURNS (%) Period
Ended February 28, 2026
|
|
1
Year |
5
Year |
10
Year |
|
Class
C |
3.74
|
0.24
|
1.31
|
|
Class
C (with sales charge) |
2.74
|
0.24
|
1.31
|
|
Bloomberg
Municipal Bond Index |
4.96
|
1.44
|
2.43
|
For current month-end performance,
please call Franklin Templeton at (800)
DIAL BEN/342-5236 or visit
https://www.franklintempleton.com/investments/options/mutual-funds.
https://www.franklintempleton.com/investments/options/mutual-funds.
Important data provider notices
and terms available at www.franklintempletondatasources.com.
KEY
FUND STATISTICS (as
of February 28, 2026)
|
Total
Net Assets |
$916,240,647
|
|
Total
Number of Portfolio Holdings |
239
|
|
Total
Management Fee Paid |
$4,418,096
|
|
Portfolio
Turnover Rate |
10.45%
|
WHAT
DID THE FUND INVEST IN? (as
of February 28, 2026)
Portfolio Composition*
(% of Total Investments)
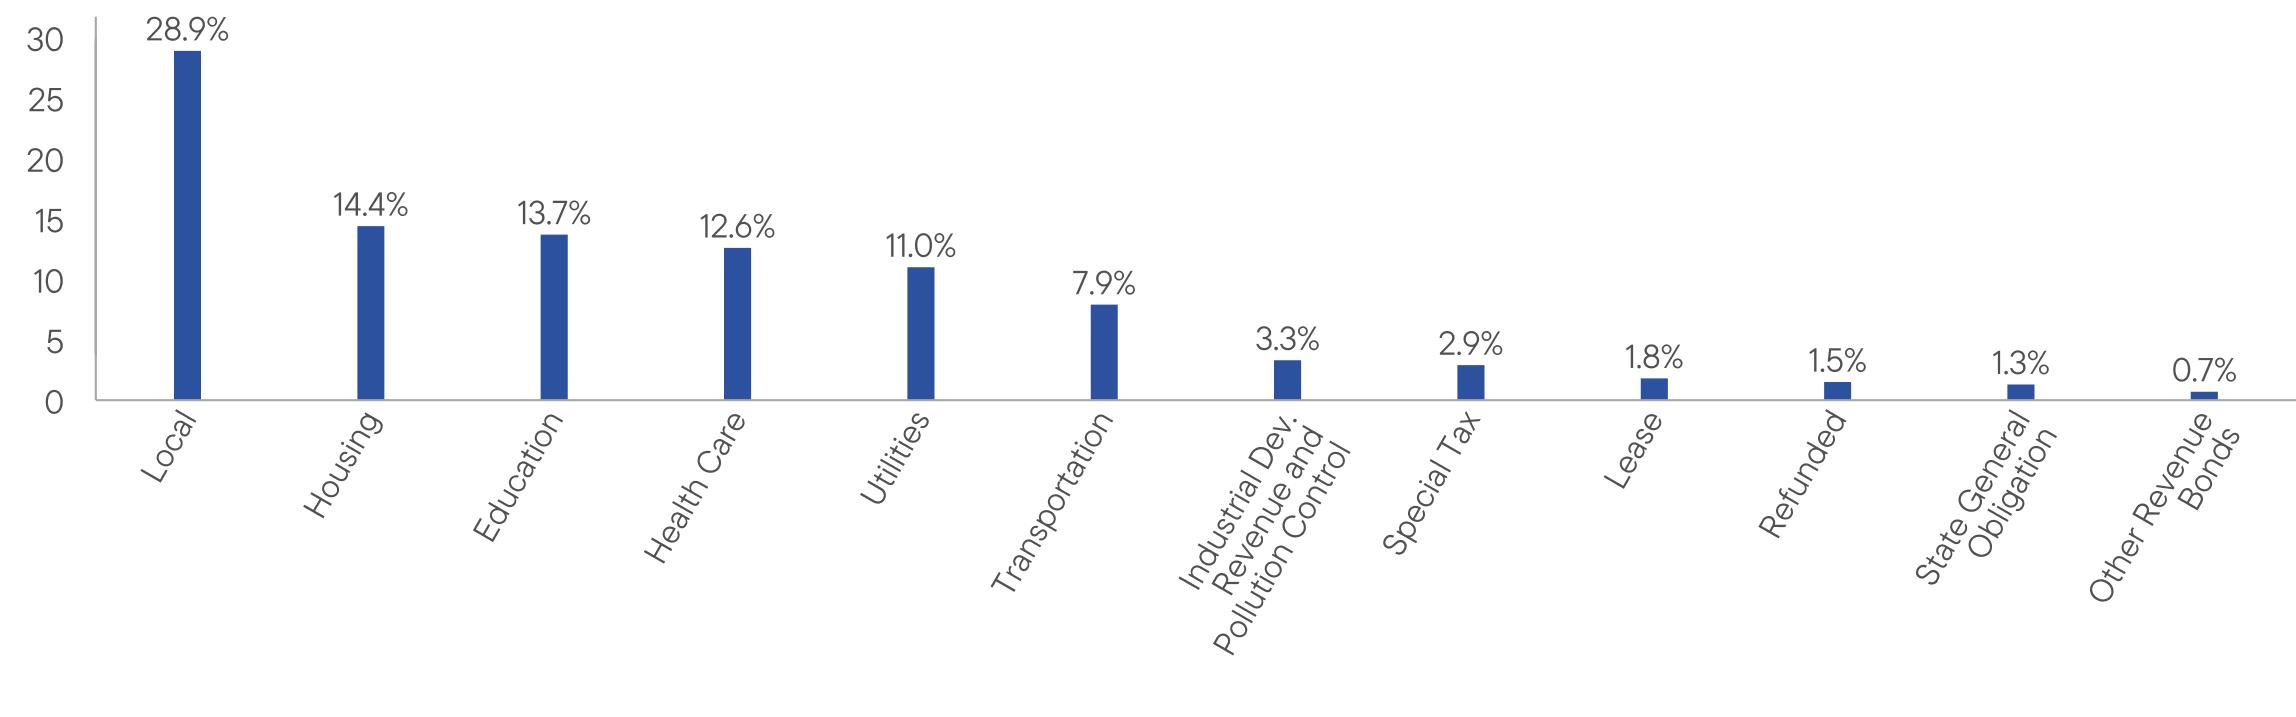
WHAT
WERE THE FUND COSTS FOR THE LAST YEAR? (based
on a hypothetical $10,000 investment)
|
Class
Name |
Costs
of a $10,000 investment
|
Costs
paid as a percentage of a $10,000
investment*
|
|
Class
R6 |
$55
|
0.54%
|
HOW
DID THE FUND PERFORM LAST YEAR AND WHAT AFFECTED ITS PERFORMANCE?
For the twelve months ended February
28, 2026, Class R6 shares of
Franklin Ohio Tax-Free Income Fund returned 4.42%.
The Fund compares its performance
to the Bloomberg Municipal Bond Index, which returned 4.96% for the same period.
PERFORMANCE
HIGHLIGHTS
|
Top
contributors to performance: | |
|
↑
|
Overweight
to bonds with no external credit rating |
|
↑
|
Security
selection in AA rated bonds |
|
↑
|
Security
selection in AAA rated bonds |
|
Top
detractors from performance: | |
|
↓
|
Underweight
to bonds with five and 10 years to maturity |
|
↓
|
Overweight
to bonds with 30 years to maturity |
|
↓
|
Security
selection in A rated bonds |
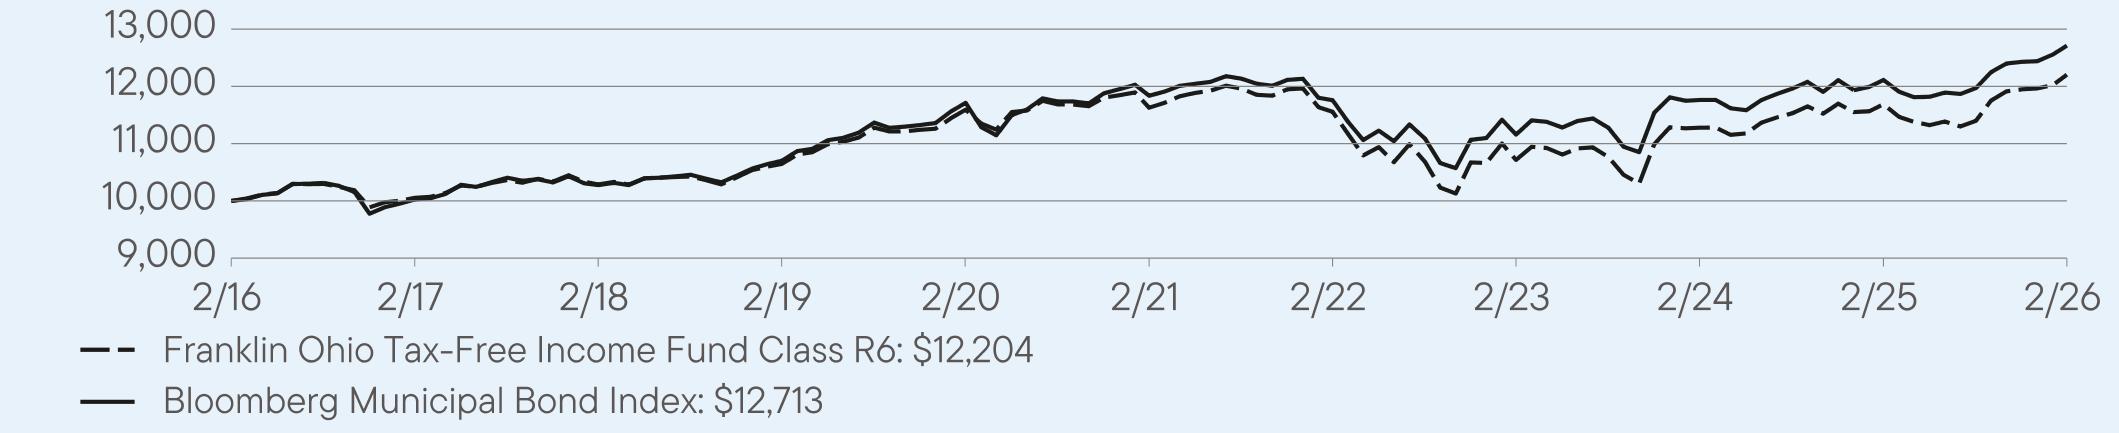
AVERAGE
ANNUAL TOTAL RETURNS (%) Period
Ended February 28, 2026
|
|
1
Year |
5
Year |
10
Year |
|
Class
R6 |
4.42
|
0.97
|
2.03
|
|
Bloomberg
Municipal Bond Index |
4.96
|
1.44
|
2.43
|
For current month-end performance,
please call Franklin Templeton at (800)
DIAL BEN/342-5236 or visit
https://www.franklintempleton.com/investments/options/mutual-funds.
https://www.franklintempleton.com/investments/options/mutual-funds.
Important data provider notices
and terms available at www.franklintempletondatasources.com.
KEY
FUND STATISTICS (as
of February 28, 2026)
|
Total
Net Assets |
$916,240,647
|
|
Total
Number of Portfolio Holdings |
239
|
|
Total
Management Fee Paid |
$4,418,096
|
|
Portfolio
Turnover Rate |
10.45%
|
WHAT
DID THE FUND INVEST IN? (as
of February 28, 2026)
Portfolio Composition*
(% of Total Investments)

WHAT
WERE THE FUND COSTS FOR THE LAST YEAR? (based
on a hypothetical $10,000 investment)
|
Class
Name |
Costs
of a $10,000 investment
|
Costs
paid as a percentage of a $10,000
investment*
|
|
Advisor
Class |
$58
|
0.57%
|
HOW
DID THE FUND PERFORM LAST YEAR AND WHAT AFFECTED ITS PERFORMANCE?
For the twelve months ended February
28, 2026, Advisor Class shares
of Franklin Ohio Tax-Free Income Fund returned 4.38%.
The Fund compares its performance
to the Bloomberg Municipal Bond Index, which returned 4.96% for the same period.
PERFORMANCE
HIGHLIGHTS
|
Top
contributors to performance: | |
|
↑
|
Overweight
to bonds with no external credit rating |
|
↑
|
Security
selection in AA rated bonds |
|
↑
|
Security
selection in AAA rated bonds |
|
Top
detractors from performance: | |
|
↓
|
Underweight
to bonds with five and 10 years to maturity |
|
↓
|
Overweight
to bonds with 30 years to maturity |
|
↓
|
Security
selection in A rated bonds |
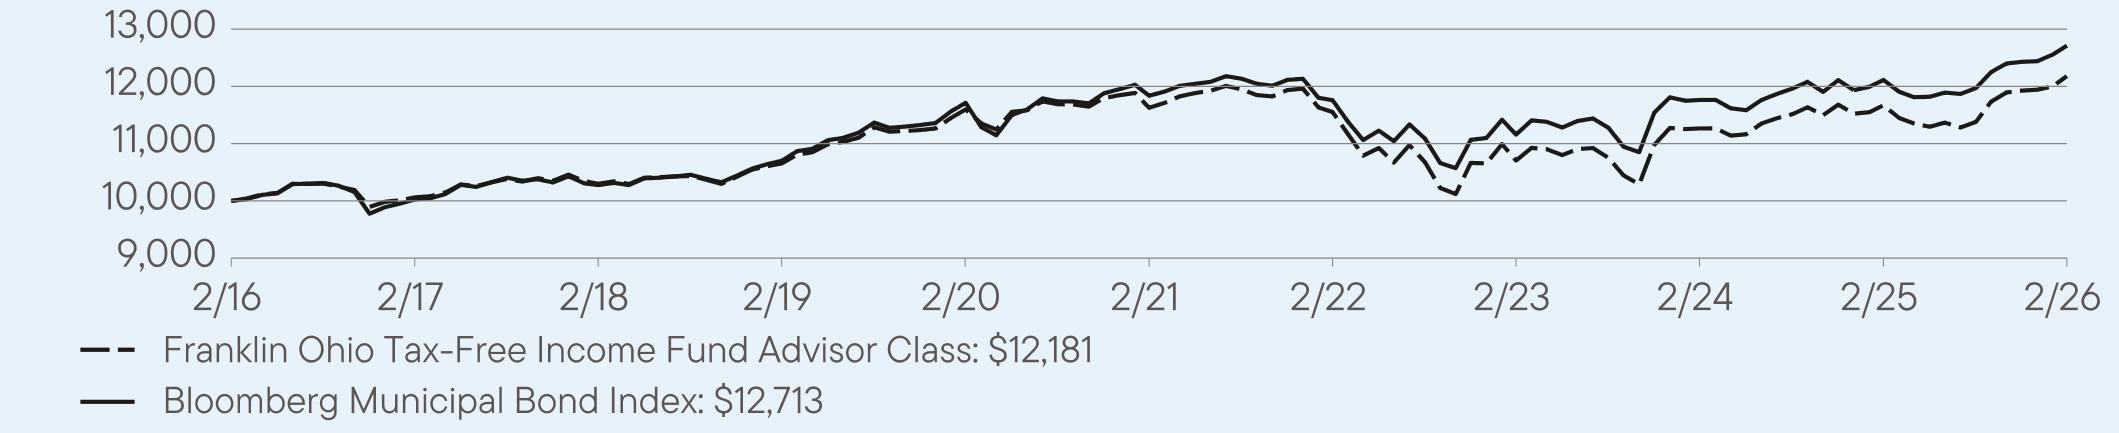
AVERAGE
ANNUAL TOTAL RETURNS (%) Period
Ended February 28, 2026
|
|
1
Year |
5
Year |
10
Year |
|
Advisor
Class |
4.38
|
0.93
|
1.99
|
|
Bloomberg
Municipal Bond Index |
4.96
|
1.44
|
2.43
|
For current month-end performance,
please call Franklin Templeton at (800)
DIAL BEN/342-5236 or visit
https://www.franklintempleton.com/investments/options/mutual-funds.
https://www.franklintempleton.com/investments/options/mutual-funds.
Important data provider notices
and terms available at www.franklintempletondatasources.com.
KEY
FUND STATISTICS (as
of February 28, 2026)
|
Total
Net Assets |
$916,240,647
|
|
Total
Number of Portfolio Holdings |
239
|
|
Total
Management Fee Paid |
$4,418,096
|
|
Portfolio
Turnover Rate |
10.45%
|
WHAT
DID THE FUND INVEST IN? (as
of February 28, 2026)
Portfolio Composition*
(% of Total Investments)

WHAT
WERE THE FUND COSTS FOR THE LAST YEAR? (based
on a hypothetical $10,000 investment)
|
Class
Name |
Costs
of a $10,000 investment
|
Costs
paid as a percentage of a $10,000
investment*
|
|
Class
A |
$84
|
0.82%
|
HOW
DID THE FUND PERFORM LAST YEAR AND WHAT AFFECTED ITS PERFORMANCE?
For the twelve months ended February
28, 2026, Class A shares of
Franklin Oregon Tax-Free Income Fund returned 4.08%.
The Fund compares its performance
to the Bloomberg Municipal Bond Index, which returned 4.96% for the same period.
PERFORMANCE
HIGHLIGHTS
|
Top
contributors to performance: | |
|
↑
|
Overweight
to bonds with 20 years to maturity |
|
↑
|
Overweight
to bonds with no external credit rating |
|
↑
|
Security
selection in BBB rated bonds |
|
Top
detractors from performance: | |
|
↓
|
Underweight
to bonds with two, five and 10 years maturity |
|
↓
|
Security
selection in AA rated bonds |
|
↓
|
Overweight
to bonds with 30 years to maturity |

AVERAGE
ANNUAL TOTAL RETURNS (%) Period
Ended February 28, 2026
|
|
1
Year |
5
Year |
10
Year |
|
Class
A |
4.08
|
0.73
|
1.70
|
|
Class
A (with sales charge) |
0.18
|
-0.04
|
1.32
|
|
Bloomberg
Municipal Bond Index |
4.96
|
1.44
|
2.43
|
For current month-end performance,
please call Franklin Templeton at (800)
DIAL BEN/342-5236 or visit
https://www.franklintempleton.com/investments/options/mutual-funds.
https://www.franklintempleton.com/investments/options/mutual-funds.
Important data provider notices
and terms available at www.franklintempletondatasources.com.
KEY
FUND STATISTICS (as
of February 28, 2026)
|
Total
Net Assets |
$814,893,234
|
|
Total
Number of Portfolio Holdings |
164
|
|
Total
Management Fee Paid |
$3,876,472
|
|
Portfolio
Turnover Rate |
16.43%
|
WHAT
DID THE FUND INVEST IN? (as
of February 28, 2026)
Portfolio Composition*
(% of Total Investments)

WHAT
WERE THE FUND COSTS FOR THE LAST YEAR? (based
on a hypothetical $10,000 investment)
|
Class
Name |
Costs
of a $10,000 investment
|
Costs
paid as a percentage of a $10,000
investment*
|
|
Class
A1 |
$68
|
0.67%
|
HOW
DID THE FUND PERFORM LAST YEAR AND WHAT AFFECTED ITS PERFORMANCE?
For the twelve months ended February
28, 2026, Class A1 shares of
Franklin Oregon Tax-Free Income Fund returned 4.14%.
The Fund compares its performance
to the Bloomberg Municipal Bond Index, which returned 4.96% for the same period.
PERFORMANCE
HIGHLIGHTS
|
Top
contributors to performance: | |
|
↑
|
Overweight
to bonds with 20 years to maturity |
|
↑
|
Overweight
to bonds with no external credit rating |
|
↑
|
Security
selection in BBB rated bonds |
|
Top
detractors from performance: | |
|
↓
|
Underweight
to bonds with two, five and 10 years maturity |
|
↓
|
Security
selection in AA rated bonds |
|
↓
|
Overweight
to bonds with 30 years to maturity |
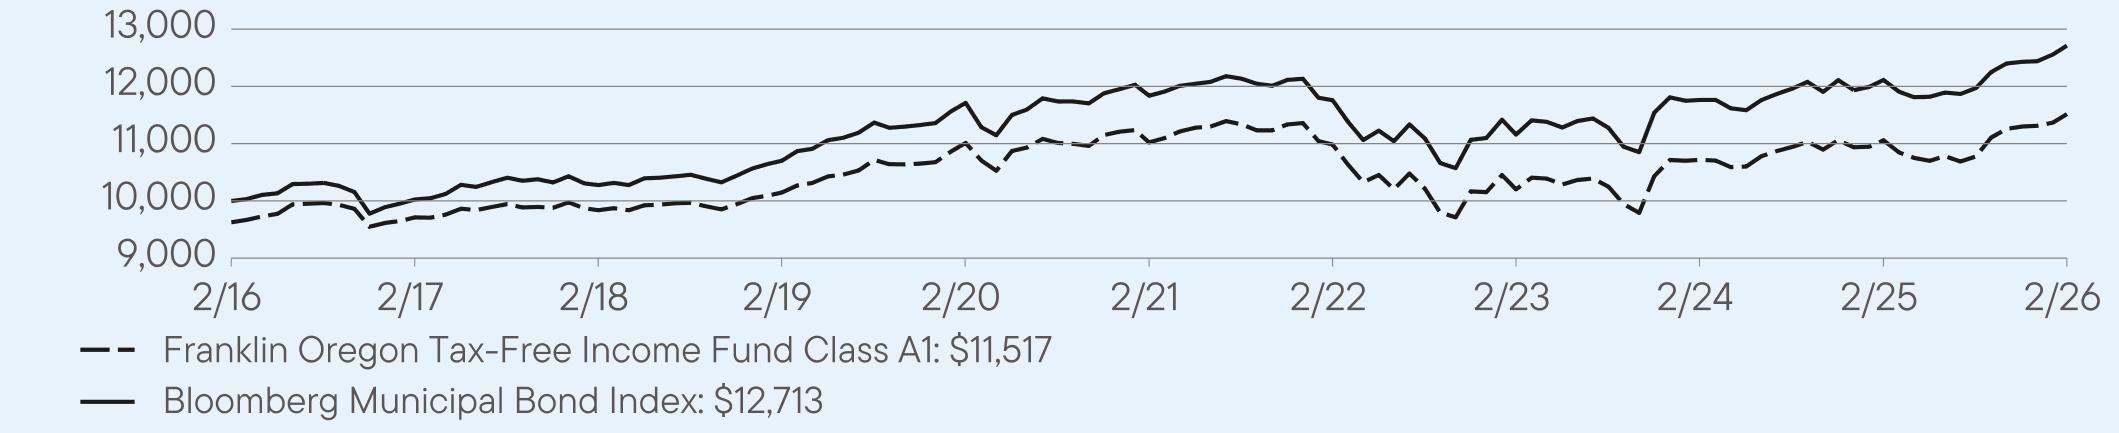
AVERAGE
ANNUAL TOTAL RETURNS (%) Period
Ended February 28, 2026
|
|
1
Year |
5
Year |
10
Year |
|
Class
A1 |
4.14
|
0.88
|
1.81
|
|
Class
A1 (with sales charge) |
0.24
|
0.11
|
1.43
|
|
Bloomberg
Municipal Bond Index |
4.96
|
1.44
|
2.43
|
For current month-end performance,
please call Franklin Templeton at (800)
DIAL BEN/342-5236 or visit
https://www.franklintempleton.com/investments/options/mutual-funds.
https://www.franklintempleton.com/investments/options/mutual-funds.
Important data provider notices
and terms available at www.franklintempletondatasources.com.
KEY
FUND STATISTICS (as
of February 28, 2026)
|
Total
Net Assets |
$814,893,234
|
|
Total
Number of Portfolio Holdings |
164
|
|
Total
Management Fee Paid |
$3,876,472
|
|
Portfolio
Turnover Rate |
16.43%
|
WHAT
DID THE FUND INVEST IN? (as
of February 28, 2026)
Portfolio Composition*
(% of Total Investments)

WHAT
WERE THE FUND COSTS FOR THE LAST YEAR? (based
on a hypothetical $10,000 investment)
|
Class
Name |
Costs
of a $10,000 investment
|
Costs
paid as a percentage of a $10,000
investment*
|
|
Class
C |
$123
|
1.21%
|
HOW
DID THE FUND PERFORM LAST YEAR AND WHAT AFFECTED ITS PERFORMANCE?
For the twelve months ended February
28, 2026, Class C shares of
Franklin Oregon Tax-Free Income Fund returned 3.60%.
The Fund compares its performance
to the Bloomberg Municipal Bond Index, which returned 4.96% for the same period.
PERFORMANCE
HIGHLIGHTS
|
Top
contributors to performance: | |
|
↑
|
Overweight
to bonds with 20 years to maturity |
|
↑
|
Overweight
to bonds with no external credit rating |
|
↑
|
Security
selection in BBB rated bonds |
|
Top
detractors from performance: | |
|
↓
|
Underweight
to bonds with two, five and 10 years maturity |
|
↓
|
Security
selection in AA rated bonds |
|
↓
|
Overweight
to bonds with 30 years to maturity |

AVERAGE
ANNUAL TOTAL RETURNS (%) Period
Ended February 28, 2026
|
|
1
Year |
5
Year |
10
Year |
|
Class
C |
3.60
|
0.29
|
1.23
|
|
Class
C (with sales charge) |
2.60
|
0.29
|
1.23
|
|
Bloomberg
Municipal Bond Index |
4.96
|
1.44
|
2.43
|
For current month-end performance,
please call Franklin Templeton at (800)
DIAL BEN/342-5236 or visit
https://www.franklintempleton.com/investments/options/mutual-funds.
https://www.franklintempleton.com/investments/options/mutual-funds.
Important data provider notices
and terms available at www.franklintempletondatasources.com.
KEY
FUND STATISTICS (as
of February 28, 2026)
|
Total
Net Assets |
$814,893,234
|
|
Total
Number of Portfolio Holdings |
164
|
|
Total
Management Fee Paid |
$3,876,472
|
|
Portfolio
Turnover Rate |
16.43%
|
WHAT
DID THE FUND INVEST IN? (as
of February 28, 2026)
Portfolio Composition*
(% of Total Investments)

WHAT
WERE THE FUND COSTS FOR THE LAST YEAR? (based
on a hypothetical $10,000 investment)
|
Class
Name |
Costs
of a $10,000 investment
|
Costs
paid as a percentage of a $10,000
investment |
|
Class
R6 |
$54
|
0.53%
|
HOW
DID THE FUND PERFORM LAST YEAR AND WHAT AFFECTED ITS PERFORMANCE?
For the twelve months ended February
28, 2026, Class R6 shares of
Franklin Oregon Tax-Free Income Fund returned 4.38%.
The Fund compares its performance
to the Bloomberg Municipal Bond Index, which returned 4.96% for the same period.
PERFORMANCE
HIGHLIGHTS
|
Top
contributors to performance: | |
|
↑
|
Overweight
to bonds with 20 years to maturity |
|
↑
|
Overweight
to bonds with no external credit rating |
|
↑
|
Security
selection in BBB rated bonds |
|
Top
detractors from performance: | |
|
↓
|
Underweight
to bonds with two, five and 10 years maturity |
|
↓
|
Security
selection in AA rated bonds |
|
↓
|
Overweight
to bonds with 30 years to maturity |
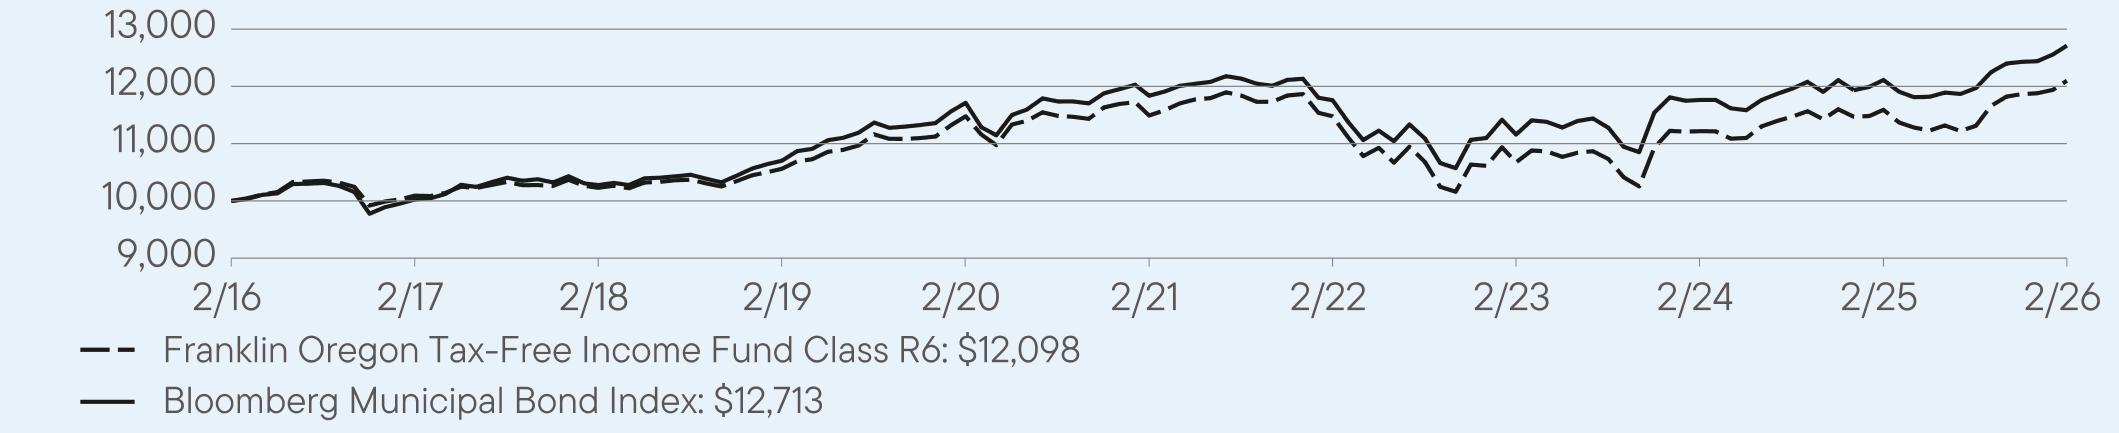
AVERAGE
ANNUAL TOTAL RETURNS (%) Period
Ended February 28, 2026
|
|
1
Year |
5
Year |
10
Year |
|
Class
R6 |
4.38
|
1.03
|
1.94
|
|
Bloomberg
Municipal Bond Index |
4.96
|
1.44
|
2.43
|
For current month-end performance,
please call Franklin Templeton at (800)
DIAL BEN/342-5236 or visit
https://www.franklintempleton.com/investments/options/mutual-funds.
https://www.franklintempleton.com/investments/options/mutual-funds.
Important data provider notices
and terms available at www.franklintempletondatasources.com.
KEY
FUND STATISTICS (as
of February 28, 2026)
|
Total
Net Assets |
$814,893,234
|
|
Total
Number of Portfolio Holdings |
164
|
|
Total
Management Fee Paid |
$3,876,472
|
|
Portfolio
Turnover Rate |
16.43%
|
WHAT
DID THE FUND INVEST IN? (as
of February 28, 2026)
Portfolio Composition*
(% of Total Investments)

WHAT
WERE THE FUND COSTS FOR THE LAST YEAR? (based
on a hypothetical $10,000 investment)
|
Class
Name |
Costs
of a $10,000 investment
|
Costs
paid as a percentage of a $10,000
investment*
|
|
Advisor
Class |
$58
|
0.57%
|
HOW
DID THE FUND PERFORM LAST YEAR AND WHAT AFFECTED ITS PERFORMANCE?
For the twelve months ended February
28, 2026, Advisor Class shares
of Franklin Oregon Tax-Free Income Fund returned 4.34%.
The Fund compares its performance
to the Bloomberg Municipal Bond Index, which returned 4.96% for the same period.
PERFORMANCE
HIGHLIGHTS
|
Top
contributors to performance: | |
|
↑
|
Overweight
to bonds with 20 years to maturity |
|
↑
|
Overweight
to bonds with no external credit rating |
|
↑
|
Security
selection in BBB rated bonds |
|
Top
detractors from performance: | |
|
↓
|
Underweight
to bonds with two, five and 10 years maturity |
|
↓
|
Security
selection in AA rated bonds |
|
↓
|
Overweight
to bonds with 30 years to maturity |
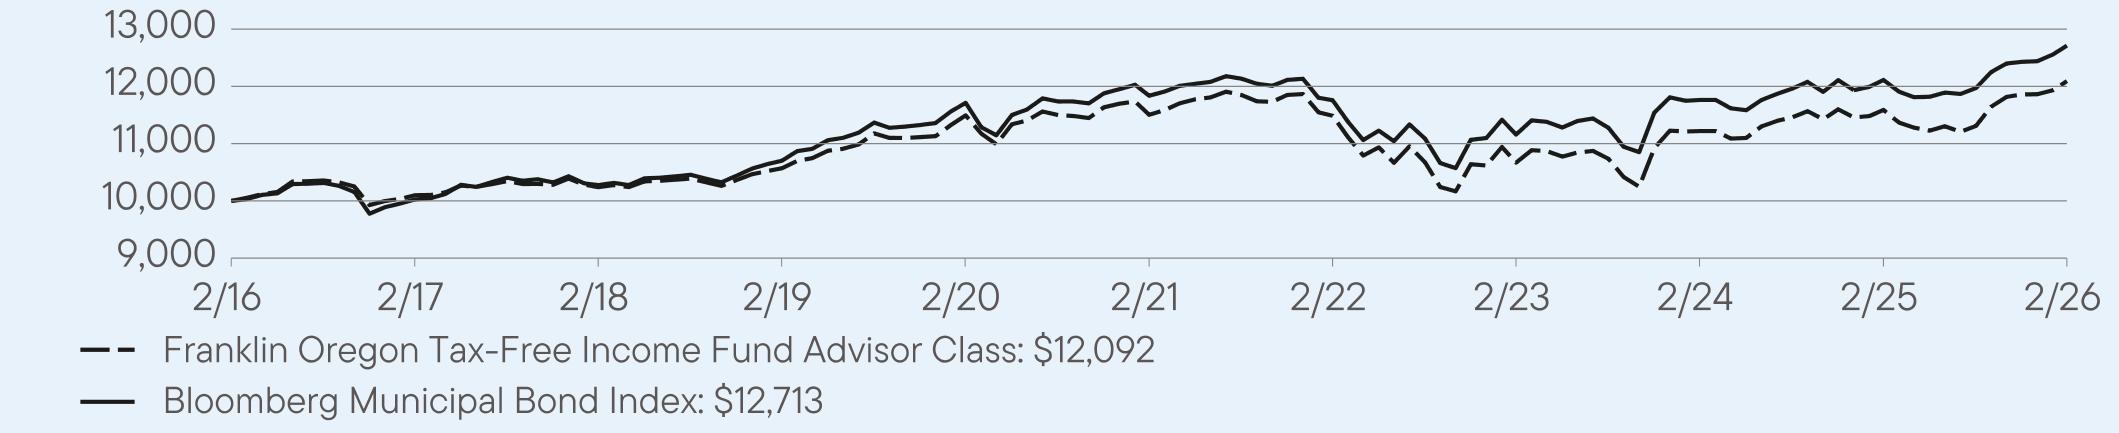
AVERAGE
ANNUAL TOTAL RETURNS (%) Period
Ended February 28, 2026
|
|
1
Year |
5
Year |
10
Year |
|
Advisor
Class |
4.34
|
1.00
|
1.92
|
|
Bloomberg
Municipal Bond Index |
4.96
|
1.44
|
2.43
|
For current month-end performance,
please call Franklin Templeton at (800)
DIAL BEN/342-5236 or visit
https://www.franklintempleton.com/investments/options/mutual-funds.
https://www.franklintempleton.com/investments/options/mutual-funds.
Important data provider notices
and terms available at www.franklintempletondatasources.com.
KEY
FUND STATISTICS (as
of February 28, 2026)
|
Total
Net Assets |
$814,893,234
|
|
Total
Number of Portfolio Holdings |
164
|
|
Total
Management Fee Paid |
$3,876,472
|
|
Portfolio
Turnover Rate |
16.43%
|
WHAT
DID THE FUND INVEST IN? (as
of February 28, 2026)
Portfolio Composition*
(% of Total Investments)
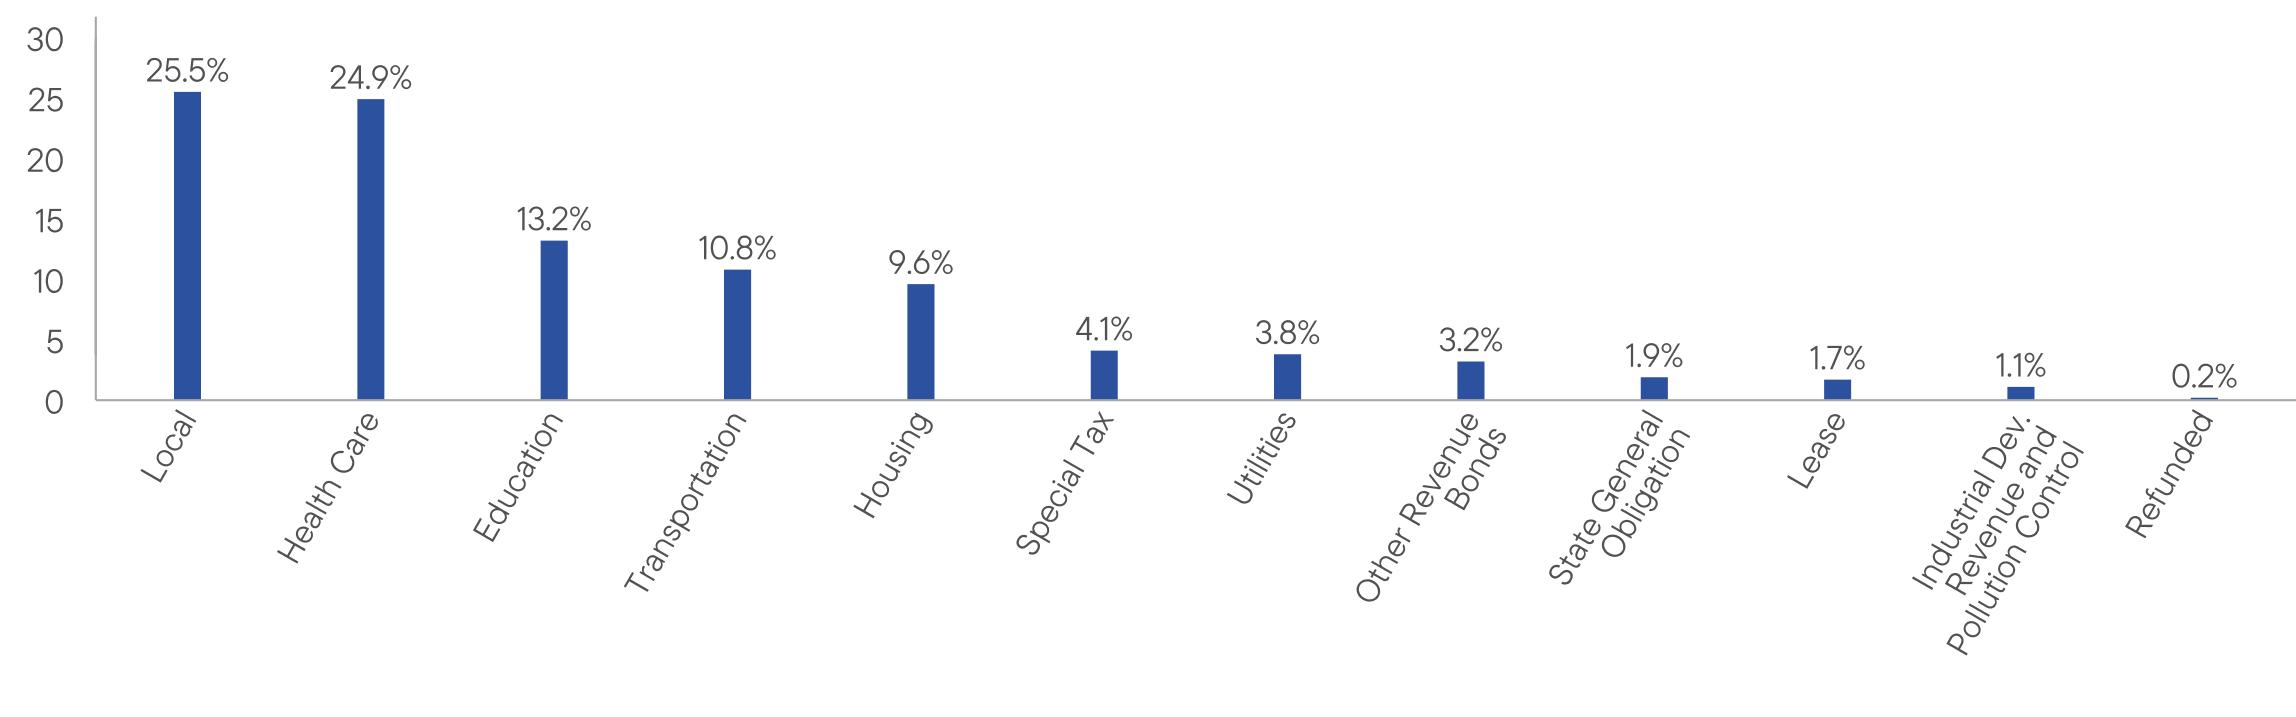
WHAT
WERE THE FUND COSTS FOR THE LAST YEAR? (based
on a hypothetical $10,000 investment)
|
Class
Name |
Costs
of a $10,000 investment
|
Costs
paid as a percentage of a $10,000
investment*
|
|
Class
A |
$87
|
0.85%
|
HOW
DID THE FUND PERFORM LAST YEAR AND WHAT AFFECTED ITS PERFORMANCE?
For the twelve months ended February
28, 2026, Class A shares of
Franklin Pennsylvania Tax-Free Income Fund returned 3.94%.
The Fund compares its performance
to the Bloomberg Municipal Bond Index, which returned 4.96% for the same period.
PERFORMANCE
HIGHLIGHTS
|
Top
contributors to performance: | |
|
↑
|
Overweight
on bonds with 10 and 20 years to maturity |
|
↑
|
Security
selection in AAA rated bonds |
|
↑
|
Overweight
to bonds with no external credit rating |
|
Top
detractors from performance: | |
|
↓
|
Underweight
to bonds with two and five years to maturity |
|
↓
|
Security
selection in A rated bonds |
|
↓
|
Security
selection in AA rated bonds |
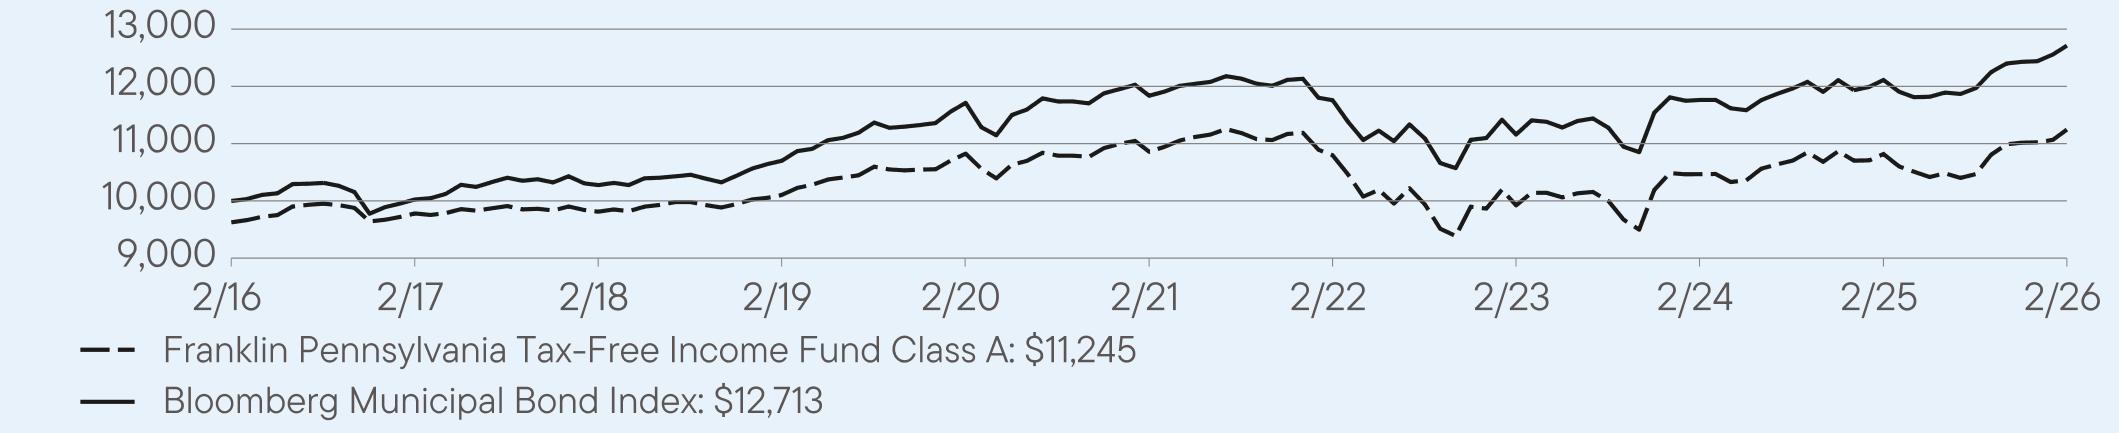
AVERAGE
ANNUAL TOTAL RETURNS (%) Period
Ended February 28, 2026
|
|
1
Year |
5
Year |
10
Year |
|
Class
A |
3.94
|
0.70
|
1.58
|
|
Class
A (with sales charge) |
0.04
|
-0.07
|
1.19
|
|
Bloomberg
Municipal Bond Index |
4.96
|
1.44
|
2.43
|
For current month-end performance,
please call Franklin Templeton at (800)
DIAL BEN/342-5236 or visit
https://www.franklintempleton.com/investments/options/mutual-funds.
https://www.franklintempleton.com/investments/options/mutual-funds.
Important data provider notices
and terms available at www.franklintempletondatasources.com.
KEY
FUND STATISTICS (as
of February 28, 2026)
|
Total
Net Assets |
$670,661,825
|
|
Total
Number of Portfolio Holdings |
211
|
|
Total
Management Fee Paid |
$3,284,255
|
|
Portfolio
Turnover Rate |
15.53%
|
WHAT
DID THE FUND INVEST IN? (as
of February 28, 2026)
Portfolio Composition*
(% of Total Investments)

WHAT
WERE THE FUND COSTS FOR THE LAST YEAR? (based
on a hypothetical $10,000 investment)
|
Class
Name |
Costs
of a $10,000 investment
|
Costs
paid as a percentage of a $10,000
investment*
|
|
Class
A1 |
$71
|
0.70%
|
HOW
DID THE FUND PERFORM LAST YEAR AND WHAT AFFECTED ITS PERFORMANCE?
For the twelve months ended February
28, 2026, Class A1 shares of
Franklin Pennsylvania Tax-Free Income Fund returned 4.21%.
The Fund compares its performance
to the Bloomberg Municipal Bond Index, which returned 4.96% for the same period.
PERFORMANCE
HIGHLIGHTS
|
Top
contributors to performance: | |
|
↑
|
Overweight
on bonds with 10 and 20 years to maturity |
|
↑
|
Security
selection in AAA rated bonds |
|
↑
|
Overweight
to bonds with no external credit rating |
|
Top
detractors from performance: | |
|
↓
|
Underweight
to bonds with two and five years to maturity |
|
↓
|
Security
selection in A rated bonds |
|
↓
|
Security
selection in AA rated bonds |
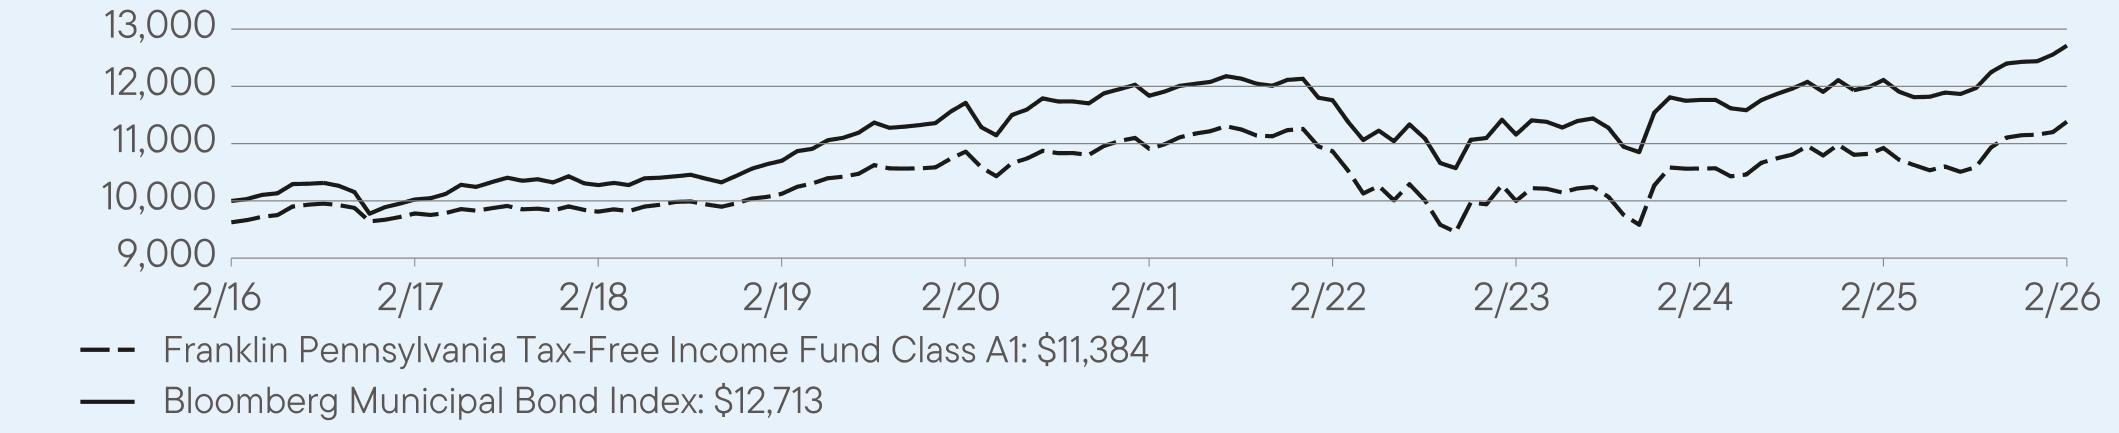
AVERAGE
ANNUAL TOTAL RETURNS (%) Period
Ended February 28, 2026
|
|
1
Year |
5
Year |
10
Year |
|
Class
A1 |
4.21
|
0.85
|
1.69
|
|
Class
A1 (with sales charge) |
0.25
|
0.07
|
1.31
|
|
Bloomberg
Municipal Bond Index |
4.96
|
1.44
|
2.43
|
For current month-end performance,
please call Franklin Templeton at (800)
DIAL BEN/342-5236 or visit
https://www.franklintempleton.com/investments/options/mutual-funds.
https://www.franklintempleton.com/investments/options/mutual-funds.
Important data provider notices
and terms available at www.franklintempletondatasources.com.
KEY
FUND STATISTICS (as
of February 28, 2026)
|
Total
Net Assets |
$670,661,825
|
|
Total
Number of Portfolio Holdings |
211
|
|
Total
Management Fee Paid |
$3,284,255
|
|
Portfolio
Turnover Rate |
15.53%
|
WHAT
DID THE FUND INVEST IN? (as
of February 28, 2026)
Portfolio Composition*
(% of Total Investments)
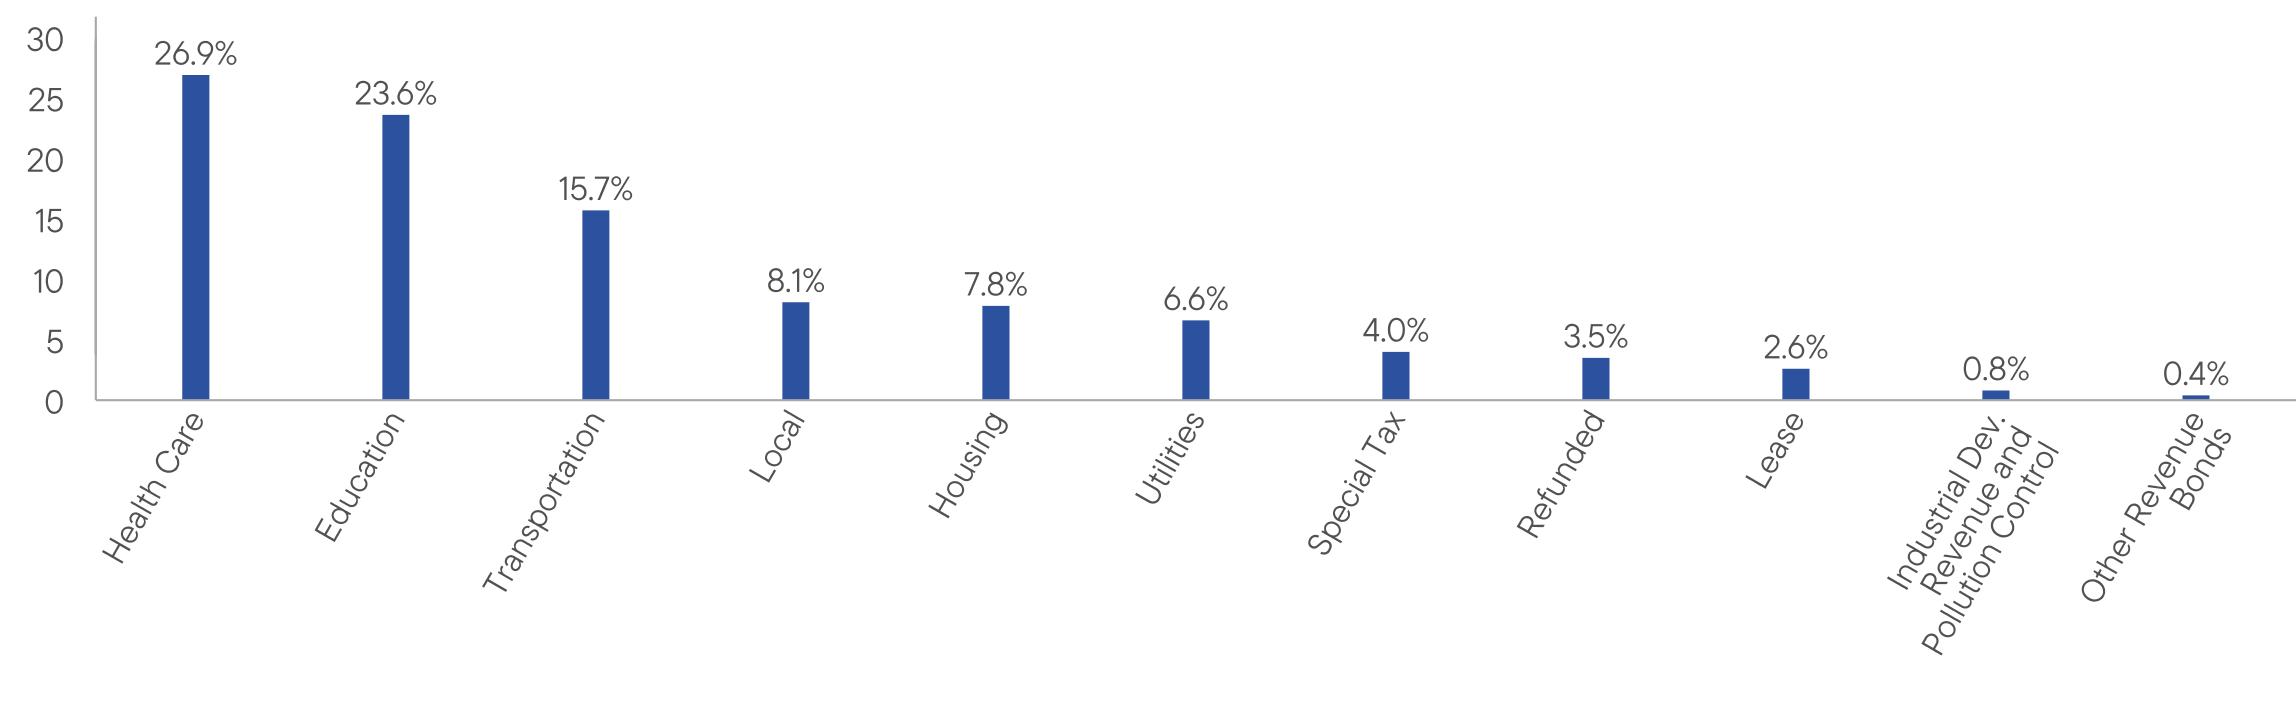
WHAT
WERE THE FUND COSTS FOR THE LAST YEAR? (based
on a hypothetical $10,000 investment)
|
Class
Name |
Costs
of a $10,000 investment
|
Costs
paid as a percentage of a $10,000
investment*
|
|
Class
C |
$126
|
1.24%
|
HOW
DID THE FUND PERFORM LAST YEAR AND WHAT AFFECTED ITS PERFORMANCE?
For the twelve months ended February
28, 2026, Class C shares of
Franklin Pennsylvania Tax-Free Income Fund returned 3.47%.
The Fund compares its performance
to the Bloomberg Municipal Bond Index, which returned 4.96% for the same period.
PERFORMANCE
HIGHLIGHTS
|
Top
contributors to performance: | |
|
↑
|
Overweight
on bonds with 10 and 20 years to maturity |
|
↑
|
Security
selection in AAA rated bonds |
|
↑
|
Overweight
to bonds with no external credit rating |
|
Top
detractors from performance: | |
|
↓
|
Underweight
to bonds with two and five years to maturity |
|
↓
|
Security
selection in A rated bonds |
|
↓
|
Security
selection in AA rated bonds |
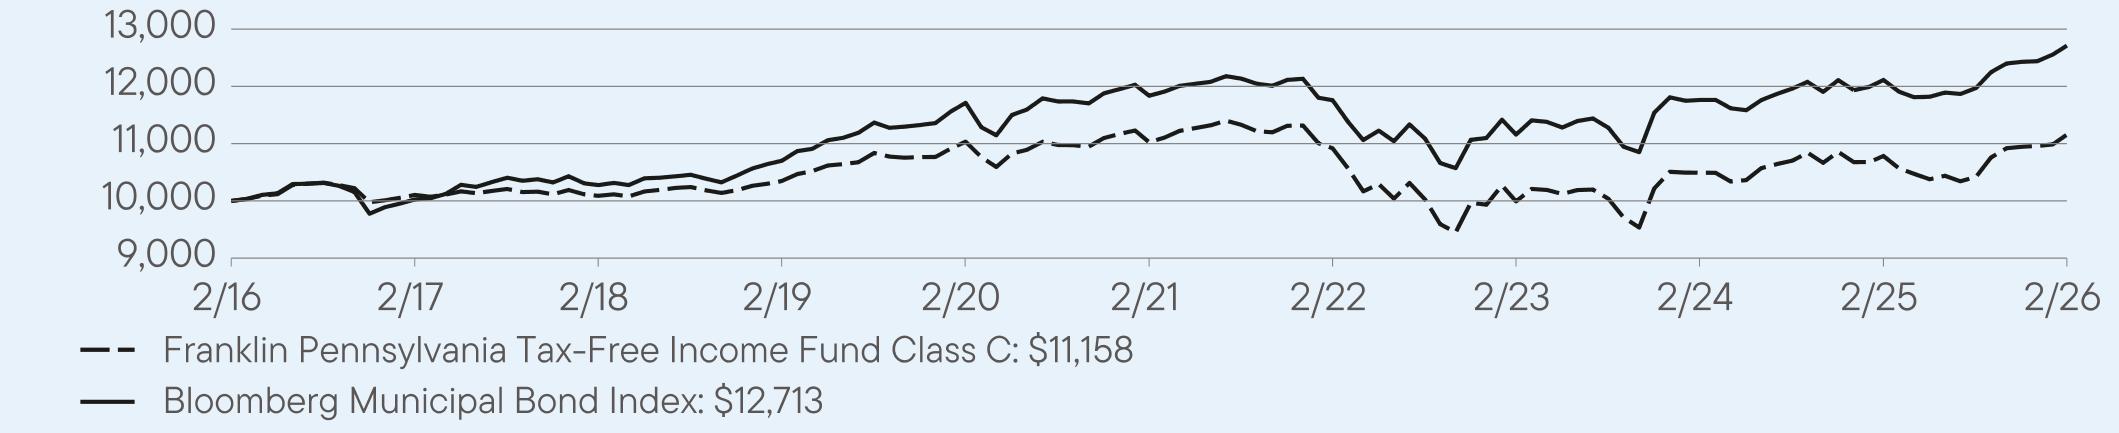
AVERAGE
ANNUAL TOTAL RETURNS (%) Period
Ended February 28, 2026
|
|
1
Year |
5
Year |
10
Year |
|
Class
C |
3.47
|
0.24
|
1.10
|
|
Class
C (with sales charge) |
2.47
|
0.24
|
1.10
|
|
Bloomberg
Municipal Bond Index |
4.96
|
1.44
|
2.43
|
For current month-end performance,
please call Franklin Templeton at (800)
DIAL BEN/342-5236 or visit
https://www.franklintempleton.com/investments/options/mutual-funds.
https://www.franklintempleton.com/investments/options/mutual-funds.
Important data provider notices
and terms available at www.franklintempletondatasources.com.
KEY
FUND STATISTICS (as
of February 28, 2026)
|
Total
Net Assets |
$670,661,825
|
|
Total
Number of Portfolio Holdings |
211
|
|
Total
Management Fee Paid |
$3,284,255
|
|
Portfolio
Turnover Rate |
15.53%
|
WHAT
DID THE FUND INVEST IN? (as
of February 28, 2026)
Portfolio Composition*
(% of Total Investments)

WHAT
WERE THE FUND COSTS FOR THE LAST YEAR? (based
on a hypothetical $10,000 investment)
|
Class
Name |
Costs
of a $10,000 investment
|
Costs
paid as a percentage of a $10,000
investment*
|
|
Class
R6 |
$56
|
0.55%
|
HOW
DID THE FUND PERFORM LAST YEAR AND WHAT AFFECTED ITS PERFORMANCE?
For the twelve months ended February
28, 2026, Class R6 shares of
Franklin Pennsylvania Tax-Free Income Fund returned 4.25%.
The Fund compares its performance
to the Bloomberg Municipal Bond Index, which returned 4.96% for the same period.
PERFORMANCE
HIGHLIGHTS
|
Top
contributors to performance: | |
|
↑
|
Overweight
on bonds with 10 and 20 years to maturity |
|
↑
|
Security
selection in AAA rated bonds |
|
↑
|
Overweight
to bonds with no external credit rating |
|
Top
detractors from performance: | |
|
↓
|
Underweight
to bonds with two and five years to maturity |
|
↓
|
Security
selection in A rated bonds |
|
↓
|
Security
selection in AA rated bonds |
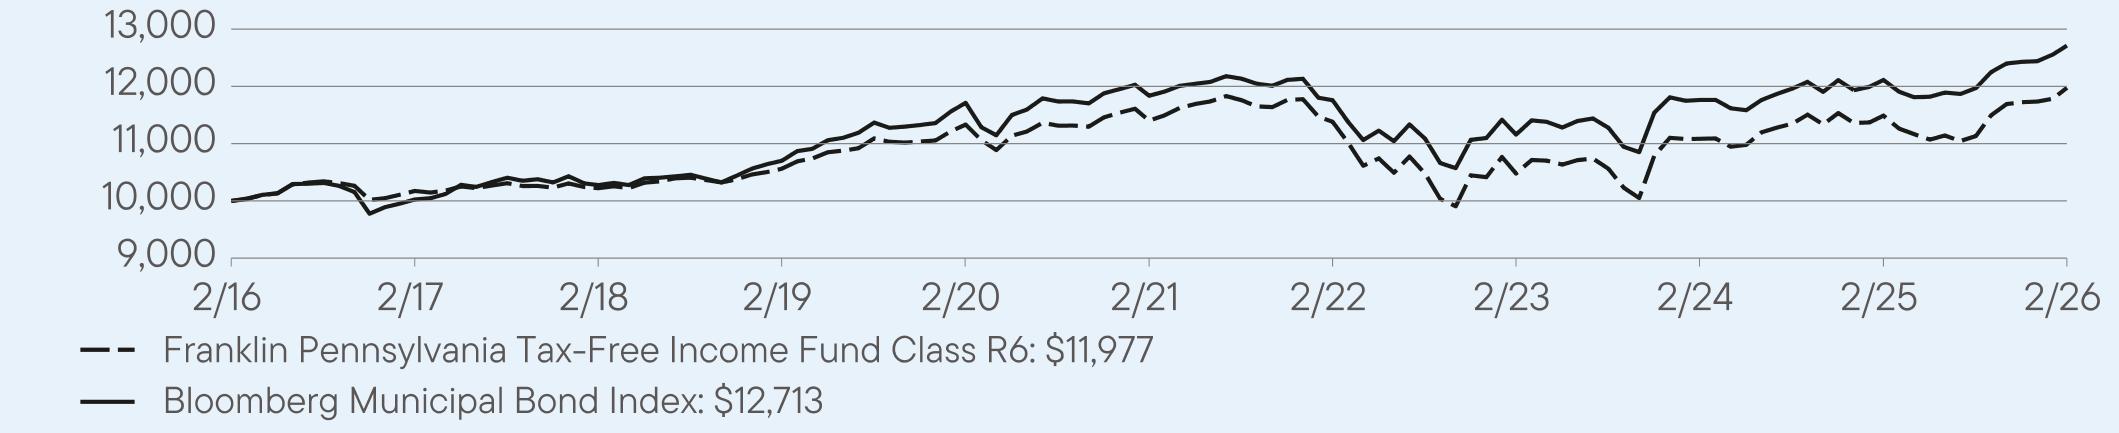
AVERAGE
ANNUAL TOTAL RETURNS (%) Period
Ended February 28, 2026
|
|
1
Year |
5
Year |
10
Year |
|
Class
R6 |
4.25
|
0.99
|
1.82
|
|
Bloomberg
Municipal Bond Index |
4.96
|
1.44
|
2.43
|
For current month-end performance,
please call Franklin Templeton at (800)
DIAL BEN/342-5236 or visit
https://www.franklintempleton.com/investments/options/mutual-funds.
https://www.franklintempleton.com/investments/options/mutual-funds.
Important data provider notices
and terms available at www.franklintempletondatasources.com.
KEY
FUND STATISTICS (as
of February 28, 2026)
|
Total
Net Assets |
$670,661,825
|
|
Total
Number of Portfolio Holdings |
211
|
|
Total
Management Fee Paid |
$3,284,255
|
|
Portfolio
Turnover Rate |
15.53%
|
WHAT
DID THE FUND INVEST IN? (as
of February 28, 2026)
Portfolio Composition*
(% of Total Investments)

WHAT
WERE THE FUND COSTS FOR THE LAST YEAR? (based
on a hypothetical $10,000 investment)
|
Class
Name |
Costs
of a $10,000 investment
|
Costs
paid as a percentage of a $10,000
investment*
|
|
Advisor
Class |
$61
|
0.60%
|
HOW
DID THE FUND PERFORM LAST YEAR AND WHAT AFFECTED ITS PERFORMANCE?
For the twelve months ended February
28, 2026, Advisor Class shares
of Franklin Pennsylvania Tax-Free Income Fund returned 4.19%.
The Fund compares its performance
to the Bloomberg Municipal Bond Index, which returned 4.96% for the same period.
PERFORMANCE
HIGHLIGHTS
|
Top
contributors to performance: | |
|
↑
|
Overweight
on bonds with 10 and 20 years to maturity |
|
↑
|
Security
selection in AAA rated bonds |
|
↑
|
Overweight
to bonds with no external credit rating |
|
Top
detractors from performance: | |
|
↓
|
Underweight
to bonds with two and five years to maturity |
|
↓
|
Security
selection in A rated bonds |
|
↓
|
Security
selection in AA rated bonds |
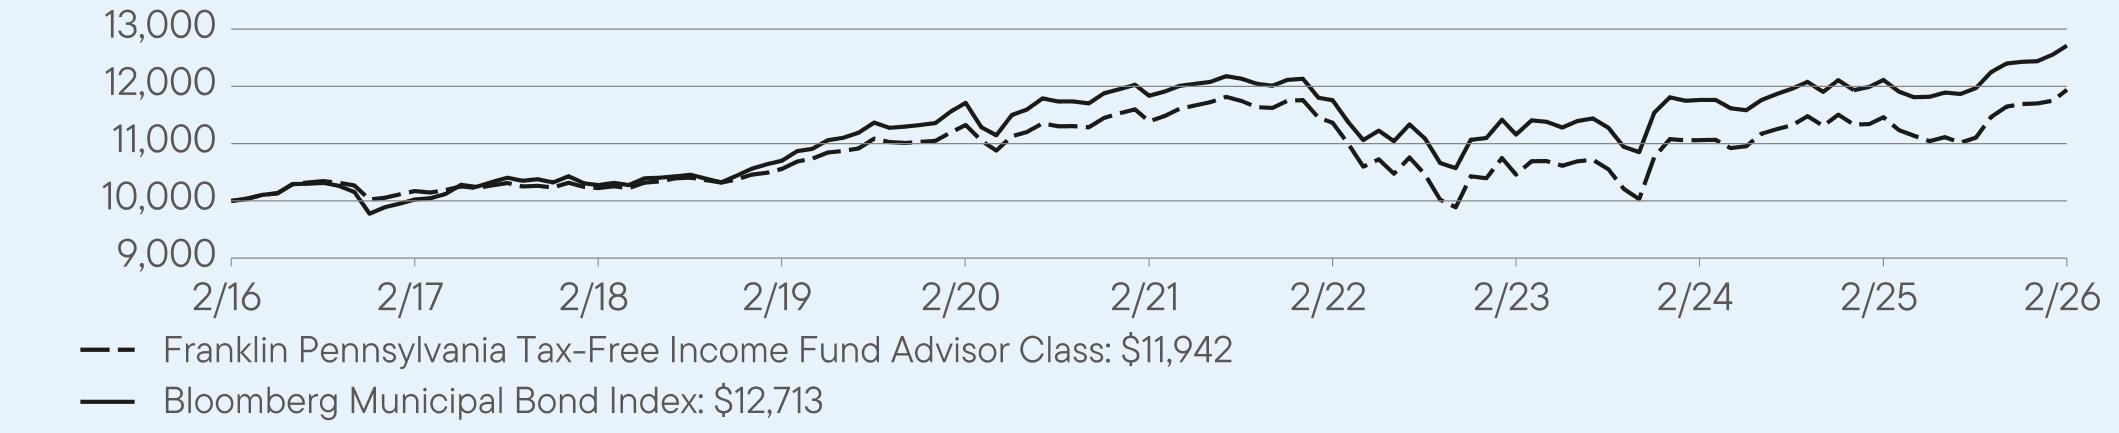
AVERAGE
ANNUAL TOTAL RETURNS (%) Period
Ended February 28, 2026
|
|
1
Year |
5
Year |
10
Year |
|
Advisor
Class |
4.19
|
0.95
|
1.79
|
|
Bloomberg
Municipal Bond Index |
4.96
|
1.44
|
2.43
|
For current month-end performance,
please call Franklin Templeton at (800)
DIAL BEN/342-5236 or visit
https://www.franklintempleton.com/investments/options/mutual-funds.
https://www.franklintempleton.com/investments/options/mutual-funds.
Important data provider notices
and terms available at www.franklintempletondatasources.com.
KEY
FUND STATISTICS (as
of February 28, 2026)
|
Total
Net Assets |
$670,661,825
|
|
Total
Number of Portfolio Holdings |
211
|
|
Total
Management Fee Paid |
$3,284,255
|
|
Portfolio
Turnover Rate |
15.53%
|
WHAT
DID THE FUND INVEST IN? (as
of February 28, 2026)
Portfolio Composition*
(% of Total Investments)

WHAT
WERE THE FUND COSTS FOR THE LAST YEAR? (based
on a hypothetical $10,000 investment)
|
Class
Name |
Costs
of a $10,000 investment
|
Costs
paid as a percentage of a $10,000
investment*
|
|
Class
A |
$90
|
0.89%
|
HOW
DID THE FUND PERFORM LAST YEAR AND WHAT AFFECTED ITS PERFORMANCE?
For the twelve months ended February
28, 2026, Class A shares of
Franklin Virginia Tax-Free Income Fund returned 2.98%.
The Fund compares its performance
to the Bloomberg Municipal Bond Index, which returned 4.96% for the same period.
PERFORMANCE
HIGHLIGHTS
|
Top
contributors to performance: | |
|
↑
|
Overweight
to bonds with no external credit rating |
|
↑
|
Overweight
to bonds with 20 years to maturity |
|
↑
|
Underweight
to AA rated bonds |
|
Top
detractors from performance: | |
|
↓
|
Underweight
to bonds with 10 years or less to maturity |
|
↓
|
Security
selection in AA rated bonds |
|
↓
|
Security
selection in BBB rated bonds |
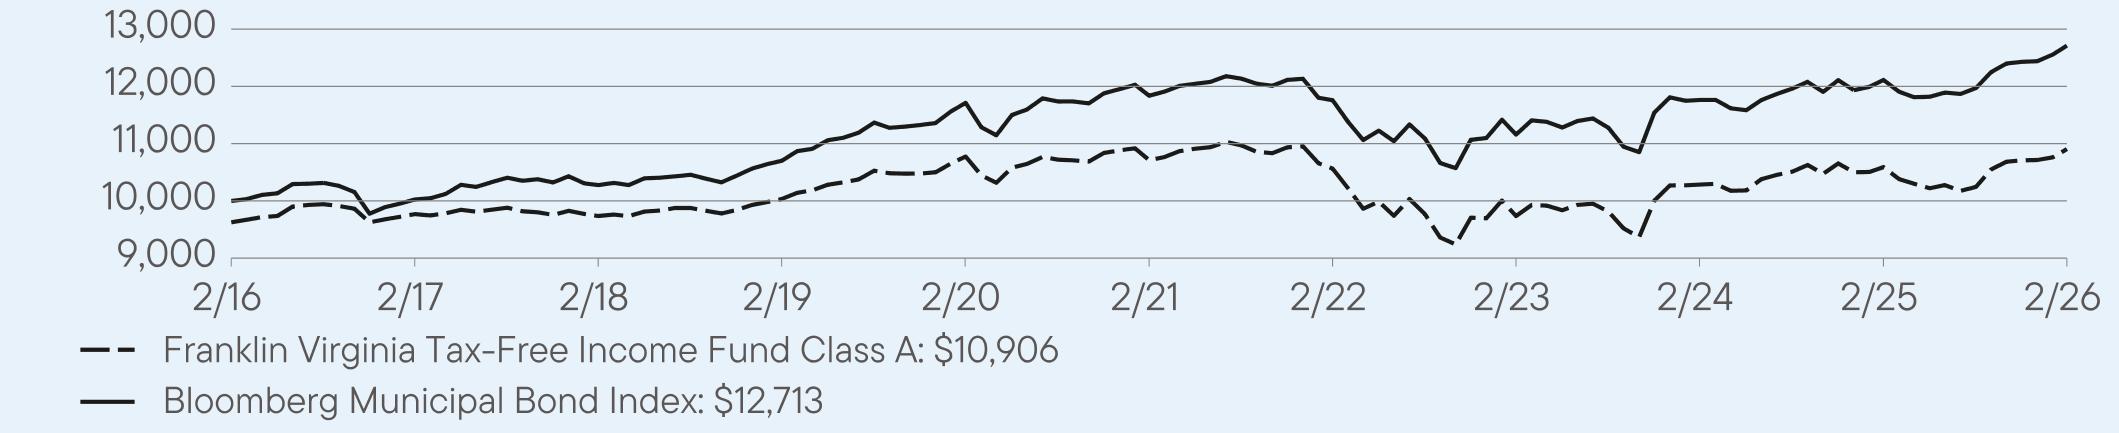
AVERAGE
ANNUAL TOTAL RETURNS (%) Period
Ended February 28, 2026
|
|
1
Year |
5
Year |
10
Year |
|
Class
A |
2.98
|
0.36
|
1.28
|
|
Class
A (with sales charge) |
-0.88
|
-0.41
|
0.89
|
|
Bloomberg
Municipal Bond Index |
4.96
|
1.44
|
2.43
|
For current month-end performance,
please call Franklin Templeton at (800)
DIAL BEN/342-5236 or visit
https://www.franklintempleton.com/investments/options/mutual-funds.
https://www.franklintempleton.com/investments/options/mutual-funds.
Important data provider notices
and terms available at www.franklintempletondatasources.com.
KEY
FUND STATISTICS (as
of February 28, 2026)
|
Total
Net Assets |
$448,134,596
|
|
Total
Number of Portfolio Holdings |
147
|
|
Total
Management Fee Paid |
$2,255,697
|
|
Portfolio
Turnover Rate |
15.57%
|
WHAT
DID THE FUND INVEST IN? (as
of February 28, 2026)
Portfolio Composition*
(% of Total Investments)

WHAT
WERE THE FUND COSTS FOR THE LAST YEAR? (based
on a hypothetical $10,000 investment)
|
Class
Name |
Costs
of a $10,000 investment
|
Costs
paid as a percentage of a $10,000
investment*
|
|
Class
A1 |
$75
|
0.74%
|
HOW
DID THE FUND PERFORM LAST YEAR AND WHAT AFFECTED ITS PERFORMANCE?
For the twelve months ended February
28, 2026, Class A1 shares of
Franklin Virginia Tax-Free Income Fund returned 3.14%.
The Fund compares its performance
to the Bloomberg Municipal Bond Index, which returned 4.96% for the same period.
PERFORMANCE
HIGHLIGHTS
|
Top
contributors to performance: | |
|
↑
|
Overweight
to bonds with no external credit rating |
|
↑
|
Overweight
to bonds with 20 years to maturity |
|
↑
|
Underweight
to AA rated bonds |
|
Top
detractors from performance: | |
|
↓
|
Underweight
to bonds with 10 years or less to maturity |
|
↓
|
Security
selection in AA rated bonds |
|
↓
|
Security
selection in BBB rated bonds |
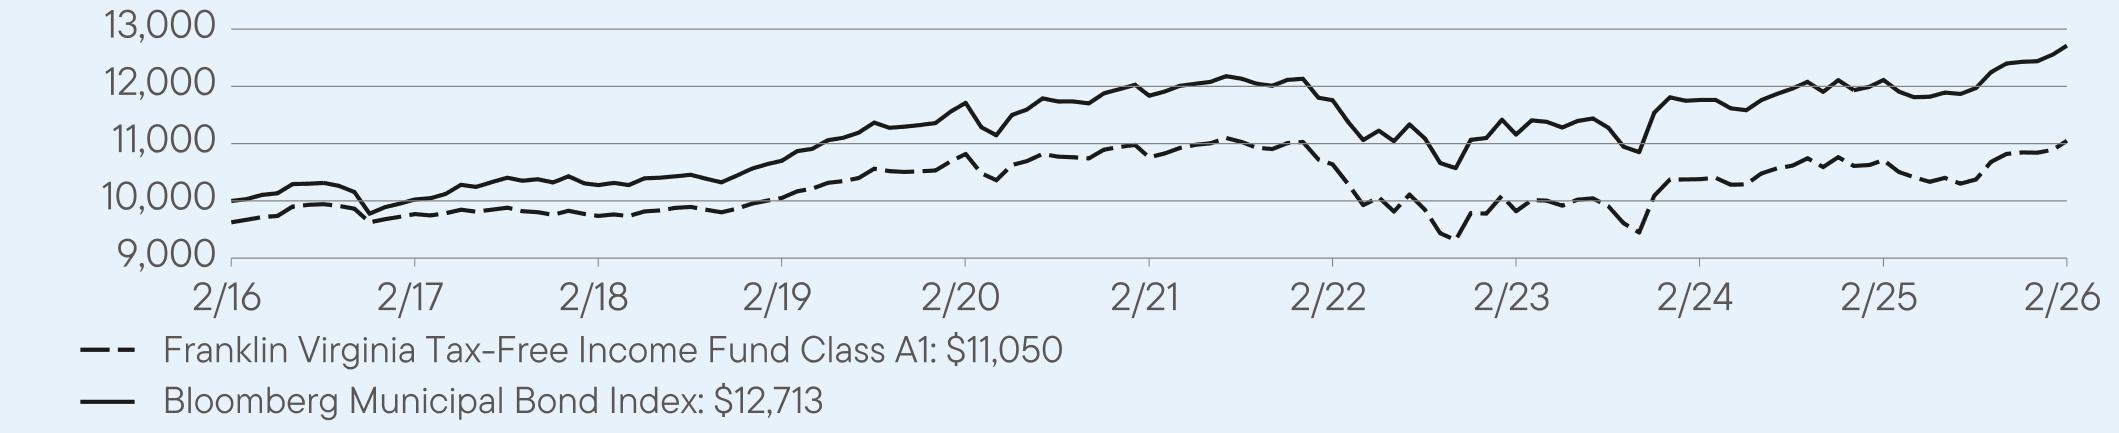
AVERAGE
ANNUAL TOTAL RETURNS (%) Period
Ended February 28, 2026
|
|
1
Year |
5
Year |
10
Year |
|
Class
A1 |
3.14
|
0.53
|
1.39
|
|
Class
A1 (with sales charge) |
-0.73
|
-0.23
|
1.00
|
|
Bloomberg
Municipal Bond Index |
4.96
|
1.44
|
2.43
|
For current month-end performance,
please call Franklin Templeton at (800)
DIAL BEN/342-5236 or visit
https://www.franklintempleton.com/investments/options/mutual-funds.
https://www.franklintempleton.com/investments/options/mutual-funds.
Important data provider notices
and terms available at www.franklintempletondatasources.com.
KEY
FUND STATISTICS (as
of February 28, 2026)
|
Total
Net Assets |
$448,134,596
|
|
Total
Number of Portfolio Holdings |
147
|
|
Total
Management Fee Paid |
$2,255,697
|
|
Portfolio
Turnover Rate |
15.57%
|
WHAT
DID THE FUND INVEST IN? (as
of February 28, 2026)
Portfolio Composition*
(% of Total Investments)

WHAT
WERE THE FUND COSTS FOR THE LAST YEAR? (based
on a hypothetical $10,000 investment)
|
Class
Name |
Costs
of a $10,000 investment
|
Costs
paid as a percentage of a $10,000
investment*
|
|
Class
C |
$130
|
1.28%
|
HOW
DID THE FUND PERFORM LAST YEAR AND WHAT AFFECTED ITS PERFORMANCE?
For the twelve months ended February
28, 2026, Class C shares of
Franklin Virginia Tax-Free Income Fund returned 2.42%.
The Fund compares its performance
to the Bloomberg Municipal Bond Index, which returned 4.96% for the same period.
PERFORMANCE
HIGHLIGHTS
|
Top
contributors to performance: | |
|
↑
|
Overweight
to bonds with no external credit rating |
|
↑
|
Overweight
to bonds with 20 years to maturity |
|
↑
|
Underweight
to AA rated bonds |
|
Top
detractors from performance: | |
|
↓
|
Underweight
to bonds with 10 years or less to maturity |
|
↓
|
Security
selection in AA rated bonds |
|
↓
|
Security
selection in BBB rated bonds |
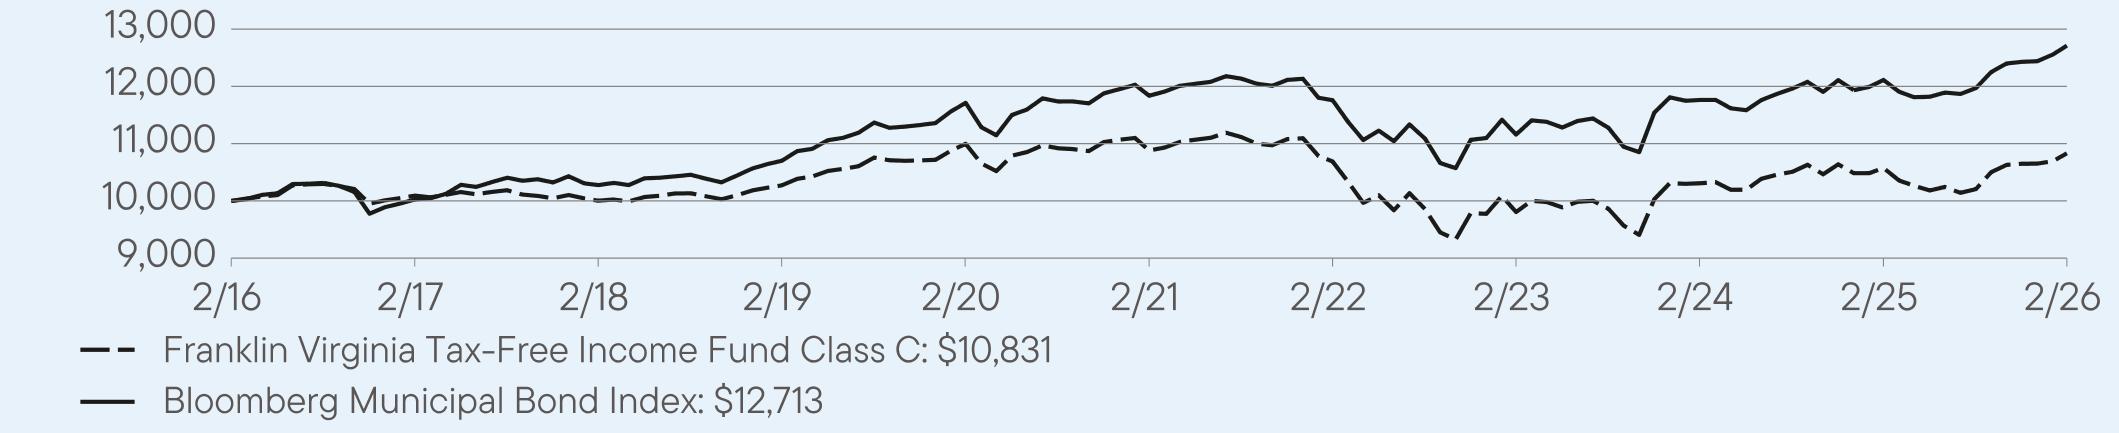
AVERAGE
ANNUAL TOTAL RETURNS (%) Period
Ended February 28, 2026
|
|
1
Year |
5
Year |
10
Year |
|
Class
C |
2.42
|
-0.09
|
0.80
|
|
Class
C (with sales charge) |
1.42
|
-0.09
|
0.80
|
|
Bloomberg
Municipal Bond Index |
4.96
|
1.44
|
2.43
|
For current month-end performance,
please call Franklin Templeton at (800)
DIAL BEN/342-5236 or visit
https://www.franklintempleton.com/investments/options/mutual-funds.
https://www.franklintempleton.com/investments/options/mutual-funds.
Important data provider notices
and terms available at www.franklintempletondatasources.com.
KEY
FUND STATISTICS (as
of February 28, 2026)
|
Total
Net Assets |
$448,134,596
|
|
Total
Number of Portfolio Holdings |
147
|
|
Total
Management Fee Paid |
$2,255,697
|
|
Portfolio
Turnover Rate |
15.57%
|
WHAT
DID THE FUND INVEST IN? (as
of February 28, 2026)
Portfolio Composition*
(% of Total Investments)

WHAT
WERE THE FUND COSTS FOR THE LAST YEAR? (based
on a hypothetical $10,000 investment)
|
Class
Name |
Costs
of a $10,000 investment
|
Costs
paid as a percentage of a $10,000
investment |
|
Class
R6 |
$58
|
0.57%
|
HOW
DID THE FUND PERFORM LAST YEAR AND WHAT AFFECTED ITS PERFORMANCE?
For the twelve months ended February
28, 2026, Class R6 shares of
Franklin Virginia Tax-Free Income Fund returned 3.21%.
The Fund compares its performance
to the Bloomberg Municipal Bond Index, which returned 4.96% for the same period.
PERFORMANCE
HIGHLIGHTS
|
Top
contributors to performance: | |
|
↑
|
Overweight
to bonds with no external credit rating |
|
↑
|
Overweight
to bonds with 20 years to maturity |
|
↑
|
Underweight
to AA rated bonds |
|
Top
detractors from performance: | |
|
↓
|
Underweight
to bonds with 10 years or less to maturity |
|
↓
|
Security
selection in AA rated bonds |
|
↓
|
Security
selection in BBB rated bonds |

AVERAGE
ANNUAL TOTAL RETURNS (%) Period
Ended February 28, 2026
|
|
1
Year |
5
Year |
10
Year |
|
Class
R6 |
3.21
|
0.66
|
1.53
|
|
Bloomberg
Municipal Bond Index |
4.96
|
1.44
|
2.43
|
For current month-end performance,
please call Franklin Templeton at (800)
DIAL BEN/342-5236 or visit
https://www.franklintempleton.com/investments/options/mutual-funds.
https://www.franklintempleton.com/investments/options/mutual-funds.
Important data provider notices
and terms available at www.franklintempletondatasources.com.
KEY
FUND STATISTICS (as
of February 28, 2026)
|
Total
Net Assets |
$448,134,596
|
|
Total
Number of Portfolio Holdings |
147
|
|
Total
Management Fee Paid |
$2,255,697
|
|
Portfolio
Turnover Rate |
15.57%
|
WHAT
DID THE FUND INVEST IN? (as
of February 28, 2026)
Portfolio Composition*
(% of Total Investments)
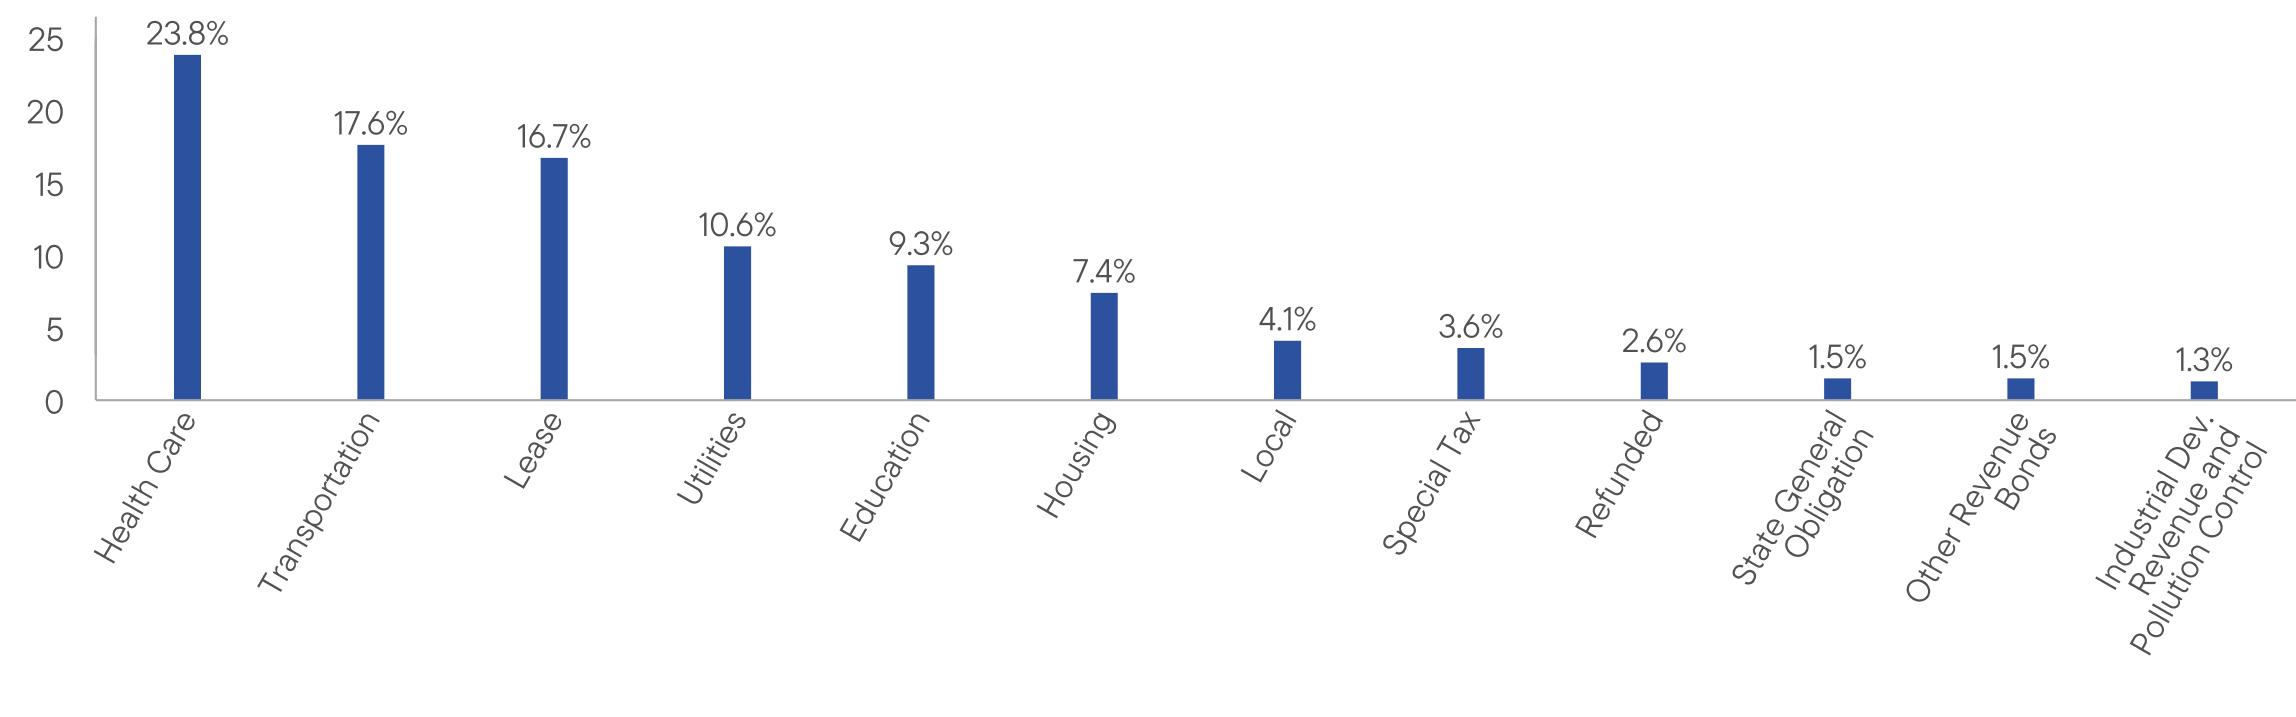
WHAT
WERE THE FUND COSTS FOR THE LAST YEAR? (based
on a hypothetical $10,000 investment)
|
Class
Name |
Costs
of a $10,000 investment
|
Costs
paid as a percentage of a $10,000
investment*
|
|
Advisor
Class |
$65
|
0.64%
|
HOW
DID THE FUND PERFORM LAST YEAR AND WHAT AFFECTED ITS PERFORMANCE?
For the twelve months ended February
28, 2026, Advisor Class shares
of Franklin Virginia Tax-Free Income Fund returned 3.24%.
The Fund compares its performance
to the Bloomberg Municipal Bond Index, which returned 4.96% for the same period.
PERFORMANCE
HIGHLIGHTS
|
Top
contributors to performance: | |
|
↑
|
Overweight
to bonds with no external credit rating |
|
↑
|
Overweight
to bonds with 20 years to maturity |
|
↑
|
Underweight
to AA rated bonds |
|
Top
detractors from performance: | |
|
↓
|
Underweight
to bonds with 10 years or less to maturity |
|
↓
|
Security
selection in AA rated bonds |
|
↓
|
Security
selection in BBB rated bonds |
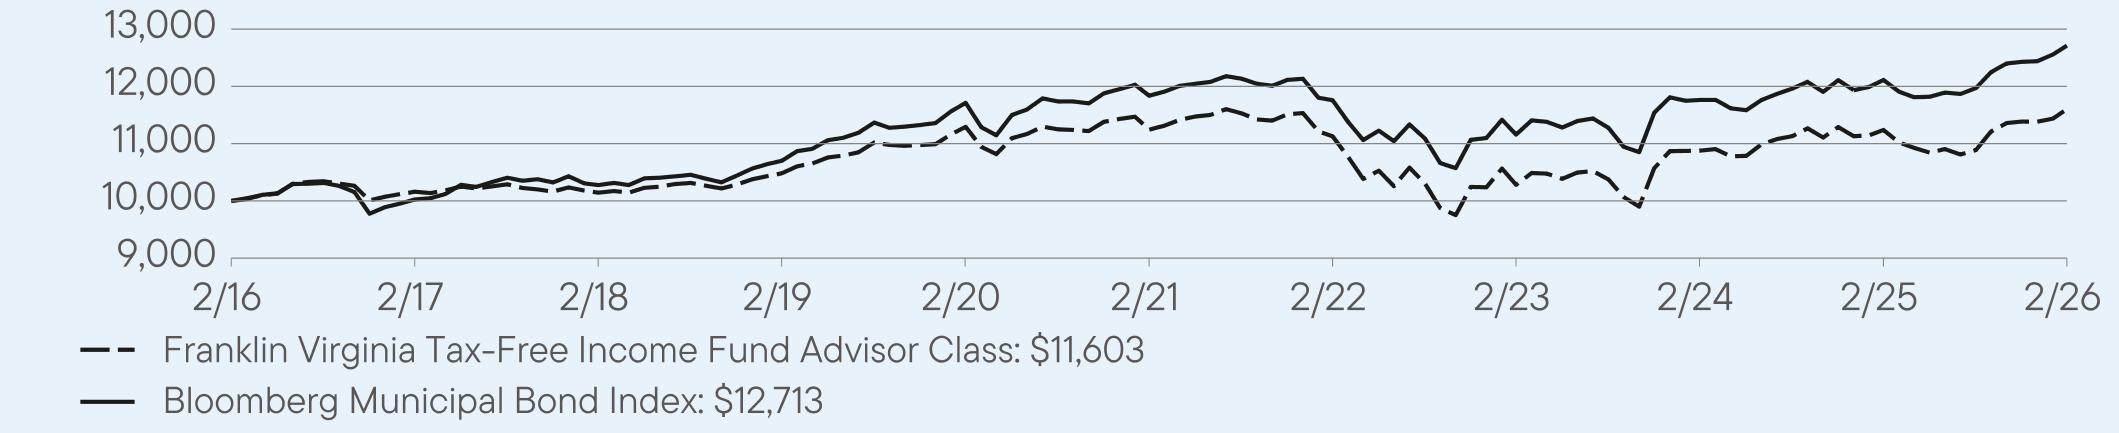
AVERAGE
ANNUAL TOTAL RETURNS (%) Period
Ended February 28, 2026
|
|
1
Year |
5
Year |
10
Year |
|
Advisor
Class |
3.24
|
0.63
|
1.50
|
|
Bloomberg
Municipal Bond Index |
4.96
|
1.44
|
2.43
|
For current month-end performance,
please call Franklin Templeton at (800)
DIAL BEN/342-5236 or visit
https://www.franklintempleton.com/investments/options/mutual-funds.
https://www.franklintempleton.com/investments/options/mutual-funds.
Important data provider notices
and terms available at www.franklintempletondatasources.com.
KEY
FUND STATISTICS (as
of February 28, 2026)
|
Total
Net Assets |
$448,134,596
|
|
Total
Number of Portfolio Holdings |
147
|
|
Total
Management Fee Paid |
$2,255,697
|
|
Portfolio
Turnover Rate |
15.57%
|
WHAT
DID THE FUND INVEST IN? (as
of February 28, 2026)
Portfolio Composition*
(% of Total Investments)

| [1] |
|
||
| [2] |
|
||
| [3] |
|
||
| [4] |
|
||
| [5] |
|
||
| [6] |
|
||
| [7] |
|
||
| [8] |
|
||
| [9] |
|
||
| [10] |
|
||
| [11] |
|
||
| [12] |
|
||
| [13] |
|
||
| [14] |
|
||
| [15] |
|
||
| [16] |
|
||
| [17] |
|
||
| [18] |
|
||
| [19] |
|
||
| [20] |
|
||
| [21] |
|
||
| [22] |
|
||
| [23] |
|
||
| [24] |
|
||
| [25] |
|
||
| [26] |
|
||
| [27] |
|
||
| [28] |
|
||
| [29] |
|
||
| [30] |
|
||
| [31] |
|
||
| [32] |
|
||
| [33] |
|
||
| [34] |
|
||
| [35] |
|
||
| [36] |
|
||
| [37] |
|
||
| [38] |
|
||
| [39] |
|
||
| [40] |
|
||
| [41] |
|
||
| [42] |
|
||
| [43] |
|
||
| [44] |
|
||
| [45] |
|
||
| [46] |
|
||
| [47] |
|
||
| [48] |
|
||
| [49] |
|
||
| [50] |
|
||
| [51] |
|
||
| [52] |
|
||
| [53] |
|
||
| [54] |
|
||
| [55] |
|
||
| [56] |
|
||
| [57] |
|
||
| [58] |
|
||
| [59] |
|
||
| [60] |
|
||
| [61] |
|
||
| [62] |
|
||
| [63] |
|
||
| [64] |
|
||
| [65] |
|
||
| [66] |
|
||
| [67] |
|
||
| [68] |
|
||
| [69] |
|
||
| [70] |
|
||
| [71] |
|
||
| [72] |
|
||
| [73] |
|
||
| [74] |
|
||
| [75] |
|
||
| [76] |
|
||
| [77] |
|
||
| [78] |
|
||
| [79] |
|
||
| [80] |
|
||
| [81] |
|
||
| [82] |
|
||
| [83] |
|
||
| [84] |
|
||
| [85] |
|
||
| [86] |
|
||
| [87] |
|
||
| [88] |
|
||
| [89] |
|
||
| [90] |
|
||
| [91] |
|
||
| [92] |
|
||
| [93] |
|
||
| [94] |
|
||
| [95] |
|
||
| [96] |
|
||
| [97] |
|
||
| [98] |
|
||
| [99] |
|
||
| [100] |
|
||
| [101] |
|
||
| [102] |
|
||
| [103] |
|
||
| [104] |
|
||
| [105] |
|
||
| [106] |
|
||
| [107] |
|
||
| [108] |
|
||
| [109] |
|
||
| [110] |
|
||
| [111] |
|
||
| [112] |
|
||
| [113] |
|
||
| [114] |
|
||
| [115] |
|
||
| [116] |
|
||
| [117] |
|
||
| [118] |
|
||
| [119] |
|
||
| [120] |
|
||
| [121] |
|
||
| [122] |
|
||
| [123] |
|
||
| [124] |
|
||
| [125] |
|
||
| [126] |
|
||
| [127] |
|
||
| [128] |
|
||
| [129] |
|
||
| [130] |
|
||
| [131] |
|
||
| [132] |
|
||
| [133] |
|
||
| [134] |
|
||
| [135] |
|
||
| [136] |
|
||
| [137] |
|
||
| [138] |
|
||
| [139] |
|
||
| [140] |
|
||
| [141] |
|
||
| [142] |
|
||
| [143] |
|
||
| [144] |
|
||
| [145] |
|
||
| [146] |
|
||
| [147] |
|
||
| [148] |
|
||
| [149] |
|
||
| [150] |
|
||
| [151] |
|
||
| [152] |
|
||
| [153] |
|
||
| [154] |
|
||
| [155] |
|
||
| [156] |
|
||
| [157] |
|
||
| [158] |
|
||
| [159] |
|
||
| [160] |
|
||
| [161] |
|
||
| [162] |
|
||
| [163] |
|
||
| [164] |
|
||
| [165] |
|
||
| [166] |
|
||
| [167] |
|
||
| [168] |
|
||
| [169] |
|
||
| [170] |
|
||
| [171] |
|
||
| [172] |
|
||
| [173] |
|
||
| [174] |
|
||
| [175] |
|
||
| [176] |
|
||
| [177] |
|
||
| [178] |
|
||
| [179] |
|
||
| [180] |
|
||
| [181] |
|
||
| [182] |
|
||
| [183] |
|
||
| [184] |
|