Performance Management - Natixis Funds Trust I
Dec. 31, 2025
The bar chart and table shown below provide some indication of the risks of investing in the Fund by showing changes in the Fund’s performance from year-to-year and by showing how the Fund’s average annual returns for the one-year, five-year, life-of-fund, and life-of-class periods (as applicable) compare to those of a broad-based securities market index that reflects the performance of the overall market applicable to the Fund. Performance for Class C shares includes the automatic conversion to Class A shares after eight years, where applicable. The Fund’s past performance (before and after taxes) does not necessarily indicate how the Fund will perform in the future. Updated performance information is available online at im.natixis.com and/or by calling the Fund toll-free at 800-225-5478.
The chart does not reflect any sales charge that you may be required to pay when you buy or redeem the Fund’s shares. A sales charge will reduce your return. To the extent that a class of shares was subject to the waiver or reimbursement of certain expenses during a period, had such expenses not been waived or reimbursed during the period, total returns would have been lower.
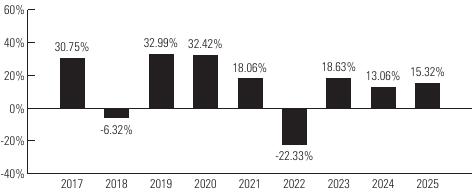
Highest Quarterly Return:
Second Quarter 2020, 22.67%
Lowest Quarterly Return:
Second Quarter 2022, -15.11%
Second Quarter 2020, 22.67%
Lowest Quarterly Return:
Second Quarter 2022, -15.11%
|
Average Annual Total Returns
|
|
|
|
|
|
(for the periods ended December 31, 2025)
|
Past 1 Year
|
Past 5 Years
|
Life of Fund
(3/31/16) |
Life of Class N
(5/1/17) |
|
Class Y - Return Before Taxes
|
15.32%
|
7.24%
|
12.07%
|
-
|
|
Return After Taxes on Distributions
|
14.06%
|
6.04%
|
11.20%
|
-
|
|
Return After Taxes on Distributions and Sale of Fund Shares
|
9.86%
|
5.49%
|
9.86%
|
-
|
|
Class A - Return Before Taxes
|
8.40%
|
5.72%
|
11.11%
|
-
|
|
Class C - Return Before Taxes
|
13.17%
|
6.17%
|
11.10%
|
-
|
|
Class N - Return Before Taxes
|
15.38%
|
7.30%
|
-
|
12.13%
|
|
MSCI World Index (Net)
|
21.09%
|
12.15%
|
12.49%
|
12.15%
|
After-tax returns are calculated using the historical highest individual federal marginal income tax rates and do not reflect the impact of state and local taxes. Actual after-tax returns depend on an investor’s tax situation and may differ from those shown. After-tax returns shown are not relevant to investors who hold their shares through tax-advantaged arrangements, such as 401(k) plans, qualified plans, education savings accounts, such as 529 plans, or individual retirement accounts. The after-tax returns are shown for only one class of the Fund. After-tax returns for the other classes of the Fund will vary. Index performance reflects no deduction for fees, expenses or taxes.
The bar chart and table shown below provide some indication of the risks of investing in the Fund by showing changes in the Fund’s performance from year-to-year and by showing how the Fund’s average annual returns for the one-year, five-year, ten-year and life-of-class periods (as applicable) compare to those of a a broad-based securities market index that reflects the performance of the overall market applicable to the Fund and an additional index that represents the market sectors in which the Fund primarily invests. Performance for Class C shares includes the automatic conversion to Class A shares after eight years, where applicable. The Fund’s past performance (before and after taxes) does not necessarily indicate how the Fund will perform in the future. Updated performance information is available online at im.natixis.com and/or by calling the Fund toll-free at 800-225-5478.
The chart does not reflect any sales charge that you may be required to pay when you buy or redeem the Fund’s shares. A sales charge will reduce your return. To the extent that a class of shares was subject to the waiver or reimbursement of certain expenses during a period, had such expenses not been waived or reimbursed during the period, total returns would have been lower.
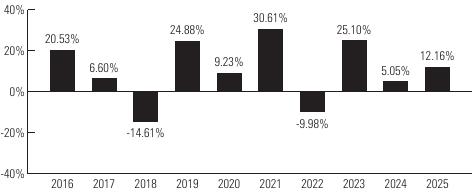
Highest Quarterly Return:
Fourth Quarter 2020, 28.00%
Lowest Quarterly Return:
First Quarter 2020, -29.83%
Fourth Quarter 2020, 28.00%
Lowest Quarterly Return:
First Quarter 2020, -29.83%
|
Average Annual Total Returns
|
|
|
|
|
|
(for the periods ended December 31, 2025)
|
Past 1 Year
|
Past 5 Years
|
Past 10 Years
|
Life of Class N
(5/1/17) |
|
Class Y - Return Before Taxes
|
12.16%
|
11.62%
|
10.00%
|
-
|
|
Return After Taxes on Distributions
|
10.77%
|
9.54%
|
7.83%
|
-
|
|
Return After Taxes on Distributions and Sale of Fund Shares
|
8.24%
|
8.51%
|
7.33%
|
-
|
|
Class A - Return Before Taxes
|
5.45%
|
10.04%
|
9.08%
|
-
|
|
Class C - Return Before Taxes
|
10.17%
|
10.53%
|
9.06%
|
-
|
|
Class N - Return Before Taxes
|
12.22%
|
11.68%
|
-
|
9.39%
|
|
Russell 3000® Index
|
17.15%
|
13.15%
|
14.29%
|
14.09%
|
|
Russell 2000® Value Index
|
12.59%
|
8.88%
|
9.27%
|
7.18%
|
After-tax returns are calculated using the historical highest individual federal marginal income tax rates and do not reflect the impact of state and local taxes. Actual after-tax returns depend on an investor’s tax situation and may differ from those shown. After-tax returns shown are not relevant to investors who hold their shares through tax-advantaged arrangements, such as 401(k) plans, qualified plans, education savings accounts, such as 529 plans, or individual retirement accounts. The after-tax returns are shown for only one class of the Fund. After-tax returns for the other classes of the Fund will vary. Index performance reflects no deduction for fees, expenses or taxes.
The bar chart and table shown below provide some indication of the risks of investing in the Fund by showing changes in the Fund’s performance from year-to-year and by showing how the Fund’s average annual returns for the one-year, five-year, ten-year and life-of-class periods (as applicable) compare to those of a broad-based securities market index that reflects the performance of the overall market applicable to the Fund. Performance for Class C shares includes the automatic conversion to Class A shares after eight years, where applicable. The Fund’s past performance (before and after taxes) does not necessarily indicate how the Fund will perform in the future. Updated performance information is available online at im.natixis.com and/or by calling the Fund toll-free at 800-225-5478.
The chart does not reflect any sales charge that you may be required to pay when you buy or redeem the Fund’s shares. A sales charge will reduce your return. To the extent that a class of shares was subject to the waiver or reimbursement of certain expenses during a period, had such expenses not been waived or reimbursed during the period, total returns would have been lower.
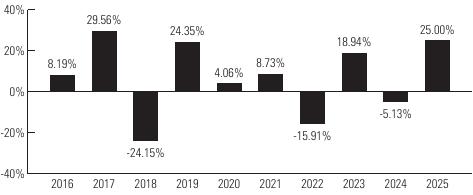
Highest Quarterly Return:
, 31.94%
Lowest Quarterly Return:
, -38.74%
, 31.94%
Lowest Quarterly Return:
, -38.74%
|
Average Annual Total Returns
|
|
|
|
|
|
(for the periods ended December 31, 2025)
|
Past 1 Year
|
Past 5 Years
|
Past 10 Years
|
Life of Class N
(5/1/17) |
|
Class A - Return Before Taxes
|
25.00%
|
5.22%
|
5.90%
|
-
|
|
Return After Taxes on Distributions
|
24.06%
|
4.79%
|
5.53%
|
-
|
|
Return After Taxes on Distributions and Sale of Fund Shares
|
15.40%
|
4.10%
|
4.80%
|
-
|
|
Class C - Return Before Taxes
|
30.66%
|
5.67%
|
5.89%
|
-
|
|
Class N - Return Before Taxes
|
32.91%
|
6.77%
|
-
|
5.21%
|
|
Class Y - Return Before Taxes
|
32.94%
|
6.73%
|
6.76%
|
-
|
|
MSCI World ex USA Index (Net)
|
31.85%
|
9.46%
|
8.55%
|
8.42%
|
After-tax returns are calculated using the historical highest individual federal marginal income tax rates and do not reflect the impact of state and local taxes. Actual after-tax returns depend on an investor’s tax situation and may differ from those shown. After-tax returns shown are not relevant to investors who hold their shares through tax-advantaged arrangements, such as 401(k) plans, qualified plans, education savings accounts, such as 529 plans, or individual retirement accounts. The after-tax returns are shown for only one class of the Fund. After-tax returns for the other classes of the Fund will vary. Index performance reflects no deduction for fees, expenses or taxes. The Return After Taxes on Distributions and the Return After Taxes on Distributions and Sale of Fund Shares for the 1-year and 5-year periods exceed the Return Before Taxes due to an assumed tax benefit from the pass-through of foreign tax credits and from losses on a sale of Fund shares at the end of the measurement period.
The bar chart and table shown below provide some indication of the risks of investing in the Fund by showing changes in the Fund’s performance from year-to-year and by showing how the Fund’s average annual returns for the one-year, five-year, ten-year, and life-of-class periods (as applicable) compare to those of two broad-based securities market indices that reflect the performance of the overall market applicable to the Fund. Performance for Class C shares includes the automatic conversion to Class A shares after eight years, where applicable. The Fund’s past performance (before and after taxes) does not necessarily indicate how the Fund will perform in the future. Updated performance information is available online at im.natixis.com and/or by calling the Fund toll-free at 800-225-5478.
The chart does not reflect any sales charge that you may be required to pay when you buy or redeem the Fund’s shares. A sales charge will reduce your return. To the extent that a class of shares was subject to the waiver or reimbursement of certain expenses during a period, had such expenses not been waived or reimbursed during the period, total returns would have been lower.
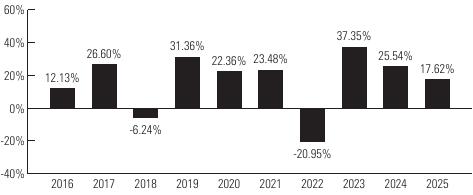
Highest Quarterly Return:
, 22.61%
Lowest Quarterly Return:
, -20.63%
, 22.61%
Lowest Quarterly Return:
, -20.63%
|
Average Annual Total Returns
|
|
|
|
|
|
(for the periods ended December 31, 2025)
|
Past 1 Year
|
Past 5 Years
|
Past 10 Years
|
Life of Class N
(5/1/17) |
|
Class Y - Return Before Taxes
|
17.62%
|
14.63%
|
15.53%
|
-
|
|
Return After Taxes on Distributions
|
16.31%
|
12.61%
|
13.58%
|
-
|
|
Return After Taxes on Distributions and Sale of Fund Shares
|
11.24%
|
11.17%
|
12.38%
|
-
|
|
Class A - Return Before Taxes
|
10.57%
|
13.00%
|
14.56%
|
-
|
|
Class C - Return Before Taxes
|
15.47%
|
13.49%
|
14.55%
|
-
|
|
Class N - Return Before Taxes
|
17.68%
|
14.70%
|
-
|
15.57%
|
|
S&P 500® Index
|
17.88%
|
14.42%
|
14.82%
|
14.77%
|
|
Russell 1000® Index
|
17.37%
|
13.59%
|
14.59%
|
14.49%
|
After-tax returns are calculated using the historical highest individual federal marginal income tax rates and do not reflect the impact of state and local taxes. Actual after-tax returns depend on an investor’s tax situation and may differ from those shown. After-tax returns shown are not relevant to investors who hold their shares through tax-advantaged arrangements, such as 401(k) plans, qualified plans, education savings accounts, such as 529 plans, or individual retirement accounts. The after-tax returns are shown for only one class of the Fund. After-tax returns for the other classes of the Fund will vary. Index performance reflects no deduction for fees, expenses or taxes.