
Registration Nos. 2-98326
811-04323
UNITED STATES
SECURITIES AND EXCHANGE COMMISSION
Washington, DC 20549
FORM
REGISTRATION STATEMENT
UNDER
| THE SECURITIES ACT OF 1933 | ☐ | |
| Pre-Effective Amendment No. | ☐ | |
| Post-Effective Amendment No. 166 | ☒ |
and/or
REGISTRATION STATEMENT
UNDER
| THE INVESTMENT COMPANY ACT OF 1940 | ☐ | |
| Amendment No. 167 | ☒ |
(Check appropriate box or boxes.)
(Exact Name of Registrant as Specified in Charter)
888 Boylston Street, Boston, Massachusetts 02199-8197
(Address of principal executive offices) (Zip Code)
Registrant’s Telephone Number, including Area Code (617) 449-2139
Susan McWhan Tobin, Esq.
Natixis Distribution, LLC
888 Boylston Street
Boston, Massachusetts 02199-8197
(Name and Address of Agent for Service)
Copy to:
Michael G. Doherty, Esq.
Jessica Reece, Esq.
Ropes & Gray LLP
1211 Avenue of the Americas
New York, NY 10036-8704
Approximate Date of Proposed Public Offering
It is proposed that this filing will become effective (check appropriate box):
| ☐ | immediately upon filing pursuant to paragraph (b) | |
| ☒ | on May 1, 2026 pursuant to paragraph (b) | |
| ☐ | 60 days after filing pursuant to paragraph (a)(1) | |
| ☐ | on (date) pursuant to paragraph (a)(1) | |
| ☐ | 75 days after filing pursuant to paragraph (a)(2) | |
| ☐ | on (date) pursuant to paragraph (a)(2) of Rule 485. |
If appropriate, check the following box:
| ☐ | This post-effective amendment designates a new effective date for a previously filed post-effective amendment. |
|
|
Class A
|
Class C
|
Class N
|
Class Y
|
|
Gateway Equity Call Premium Fund
|
GCPAX
|
GCPCX
|
GCPNX
|
GCPYX
|
|
Gateway Fund
|
GATEX
|
GTECX
|
GTENX
|
GTEYX
|
|
Mirova Global Megatrends Fund
|
ESGMX
|
ESGCX
|
ESGNX
|
ESGYX
|
|
Vaughan Nelson Mid Cap Fund
|
VNVAX
|
VNVCX
|
VNVNX
|
VNVYX
|
|
Vaughan Nelson Small Cap Fund
|
NEFJX
|
NEJCX
|
VSCNX
|
NEJYX
|
|
(fees paid directly from your investment)
|
Class A
|
Class C
|
Class N
|
Class Y
|
|
Maximum sales charge (load) imposed on purchases (as a percentage of offering price)
|
5.75%
|
None
|
None
|
None
|
|
Maximum deferred sales charge (load) (as a percentage of original purchase price or redemption proceeds, as applicable)
|
None1
|
1.00%
|
None
|
None
|
|
Redemption fees
|
None
|
None
|
None
|
None
|
| 1 | A 1.00% contingent deferred sales charge (“CDSC”) may apply to certain purchases of Class A shares of $1,000,000 or more that are redeemed within eighteen months of the date of purchase. |
|
(expenses that you pay each year as a percentage of the value of your investment)
|
Class A
|
Class C
|
Class N
|
Class Y
|
|
Management fees
|
0.58%
|
0.58%
|
0.58%
|
0.58%
|
|
Distribution and/or service (12b-1) fees
|
0.25%
|
1.00%
|
0.00%
|
0.00%
|
|
Other expenses
|
0.22%
|
0.22%
|
0.49%
|
0.22%
|
|
Total annual fund operating expenses
|
1.05%
|
1.80%
|
1.07%
|
0.80%
|
|
Fee waiver and/or expense reimbursement1,2
|
0.12%
|
0.12%
|
0.44%
|
0.12%
|
|
Total annual fund operating expenses after fee waiver and/or expense reimbursement
|
0.93%
|
1.68%
|
0.63%
|
0.68%
|
| 1 | Gateway Investment Advisers, LLC (“Gateway” or the “Adviser”) has given a binding contractual undertaking to the Fund to limit the amount of the Fund’s total annual fund operating expenses to 0.93%, 1.68%, 0.63%, and 0.68% of the Fund’s average daily net assets for Class A, Class C, Class N, and Class Y shares, respectively, exclusive of brokerage expenses, interest expense, taxes, acquired fund fees and expenses, organizational and extraordinary expenses, such as litigation and indemnification expenses. This undertaking is in effect through April 30, 2027 and may be terminated before then only with the consent of the Fund’s Board of Trustees. The Adviser will be permitted to recover, on a class-by-class basis, management fees waived and/or expenses reimbursed to the extent that expenses in later periods fall below both (1) the class’ applicable expense limitation at the time such amounts were waived/reimbursed and (2) the class’ current applicable expense limitation. The Fund will not be obligated to repay any such waived/reimbursed fees and expenses more than one year after the end of the fiscal year in which the fees or expenses were waived/reimbursed. |
| 2 | Natixis Advisors, LLC (“Natixis Advisors”) has given a binding contractual undertaking to the Fund to reimburse any and all transfer agency expenses for Class N shares. This undertaking is in effect through April 30, 2027 and may be terminated before then only with the consent of the Fund’s Board of Trustees. |
|
If shares are redeemed:
|
1 year
|
3 years
|
5 years
|
10 years
|
||||
|
Class A
|
$
|
664
|
$
|
879
|
$
|
1,110
|
$
|
1,774
|
|
If shares are redeemed:
|
1 year
|
3 years
|
5 years
|
10 years
|
||||
|
Class C
|
$
|
271
|
$
|
555
|
$
|
964
|
$
|
1,909
|
|
Class N
|
$
|
64
|
$
|
297
|
$
|
547
|
$
|
1,266
|
|
Class Y
|
$
|
69
|
$
|
243
|
$
|
432
|
$
|
979
|
|
If shares are not redeemed:
|
1 year
|
3 years
|
5 years
|
10 years
|
||||
|
Class C
|
$
|
171
|
$
|
555
|
$
|
964
|
$
|
1,909
|
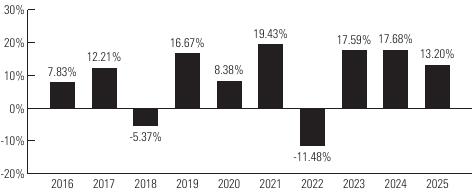 |
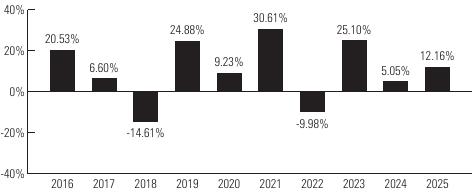
Highest Quarterly Return:
Second Quarter 2020, 11.74% Lowest Quarterly Return: First Quarter 2020, -15.92% |
|
Average Annual Total Returns
|
|
|
|
|
|
(for the periods ended December 31, 2025)
|
Past 1 Year
|
Past 5 Years
|
Past 10 Years
|
Life of Class N
(5/1/17) |
|
Class Y - Return Before Taxes
|
13.20%
|
10.61%
|
9.14%
|
-
|
|
Return After Taxes on Distributions
|
13.03%
|
10.41%
|
8.90%
|
-
|
|
Return After Taxes on Distributions and Sale of Fund Shares
|
7.92%
|
8.40%
|
7.44%
|
-
|
|
Class A - Return Before Taxes
|
6.42%
|
9.04%
|
8.22%
|
-
|
|
Class C - Return Before Taxes
|
11.09%
|
9.52%
|
8.22%
|
-
|
|
Class N - Return Before Taxes
|
13.27%
|
10.66%
|
-
|
9.15%
|
|
S&P 500® Index
|
17.88%
|
14.42%
|
14.82%
|
14.77%
|
|
CBOE S&P 500 BuyWrite Index (BXMSM)
|
8.91%
|
9.33%
|
7.31%
|
7.02%
|
|
Type of Account
|
Minimum Initial Purchase
|
|
Any account other than those listed below
|
$2,500
|
|
For shareholders participating in Natixis Funds’ Automatic Investment Plan
|
$1,000
|
|
For Traditional IRA, Roth IRA, Rollover IRA, SEP-IRA and Keogh plans
|
$1,000
|
|
•
|
Fee Based Programs (such as wrap accounts) where an advisory fee is paid to the broker-dealer or other financial intermediary. Please consult your financial representative to determine if your fee based program is subject to additional or different conditions or fees.
|
|
•
|
Certain Retirement Plans. Please consult your retirement plan administrator to determine if your retirement plan is subject to additional or different conditions or fees imposed by the plan administrator.
|
|
•
|
Clients of a Registered Investment Adviser where the Registered Investment Adviser receives an advisory, management or consulting fee.
|
|
•
|
Effective June 1, 2026, accounts invested through certain intermediaries held within an Intermediary Omnibus Account.
|
|
•
|
Effective June 1, 2026, in its sole discretion, Natixis Distribution, LLC (the “Distributor”) may waive any share class eligibility requirement.
|
|
•
|
Certain Retirement Plans. Please consult your retirement plan administrator to determine if your retirement plan is subject to additional or different conditions or fees imposed by the plan administrator.
|
|
•
|
Funds of funds that are distributed by the Distributor.
|
|
•
|
Sub-accounts held within an omnibus account, where the omnibus account has at least $1,000,000. (Effective June 1, 2026, this waiver no longer applies.)
|
|
•
|
Effective June 1, 2026, accounts invested through certain intermediaries held within an Intermediary Omnibus Account.
|
|
•
|
Effective June 1, 2026, in its sole discretion, the Distributor may waive any share class eligibility requirement.
|
|
•
|
Fee Based Programs (such as wrap accounts) where an advisory fee is paid to the broker-dealer or other financial intermediary. Please consult your financial representative to determine if your fee based program is subject to additional or different conditions or fees.
|
|
•
|
Certain Retirement Plans. Please consult your retirement plan administrator to determine if your retirement plan is subject to additional or different conditions or fees imposed by the plan administrator.
|
|
•
|
Certain Individual Retirement Accounts if the amounts invested represent rollover distributions from investments by any of the retirement plans invested in the Fund.
|
|
•
|
Clients of a Registered Investment Adviser where the Registered Investment Adviser receives an advisory, management or consulting fee.
|
|
•
|
Fund Trustees, former Fund trustees, employees of affiliates of the Natixis Funds and other individuals who are affiliated with any Natixis Fund (this also applies to any spouse, parents, children, siblings, grandparents, grandchildren and in-laws of those mentioned) and Natixis affiliate employee benefit plans.
|
|
•
|
Effective June 1, 2026, accounts invested through certain intermediaries held within an Intermediary Omnibus Account.
|
|
•
|
Effective June 1, 2026, in its sole discretion, the Distributor may waive any share class eligibility requirement.
|
|
(fees paid directly from your investment)
|
Class A
|
Class C
|
Class N
|
Class Y
|
|
Maximum sales charge (load) imposed on purchases (as a percentage of offering price)
|
5.75%
|
None
|
None
|
None
|
|
Maximum deferred sales charge (load) (as a percentage of original purchase price or redemption proceeds, as applicable)
|
None1
|
1.00%
|
None
|
None
|
|
Redemption fees
|
None
|
None
|
None
|
None
|
| 1 | A 1.00% contingent deferred sales charge (“CDSC”) may apply to certain purchases of Class A shares of $1,000,000 or more that are redeemed within eighteen months of the date of purchase. |
|
(expenses that you pay each year as a percentage of the value of your investment)
|
Class A
|
Class C
|
Class N
|
Class Y
|
|
Management fees
|
0.59%
|
0.59%
|
0.59%
|
0.59%
|
|
Distribution and/or service (12b-1) fees
|
0.25%
|
1.00%
|
0.00%
|
0.00%
|
|
Other expenses
|
0.13%
|
0.14%
|
0.06%
|
0.14%
|
|
Total annual fund operating expenses
|
0.97%
|
1.73%
|
0.65%
|
0.73%
|
|
Fee waiver and/or expense reimbursement1
|
0.03%
|
0.03%
|
0.00%
|
0.03%
|
|
Total annual fund operating expenses after fee waiver and/or expense reimbursement
|
0.94%
|
1.70%
|
0.65%
|
0.70%
|
| 1 | Gateway Investment Advisers, LLC (“Gateway” or the “Adviser”) has given a binding contractual undertaking to the Fund to limit the amount of the Fund’s total annual fund operating expenses to 0.94%, 1.70%, 0.65%, and 0.70% of the Fund’s average daily net assets for Class A, Class C, Class N, and Class Y shares, respectively, exclusive of brokerage expenses, interest expense, taxes, acquired fund fees and expenses, organizational and extraordinary expenses, such as litigation and indemnification expenses. This undertaking is in effect through April 30, 2027 and may be terminated before then only with the consent of the Fund’s Board of Trustees. The Adviser will be permitted to recover, on a class-by-class basis, management fees waived and/or expenses reimbursed to the extent that expenses in later periods fall below both (1) the class’ applicable expense limitation at the time such amounts were waived/reimbursed and (2) the class’ current applicable expense limitation. The Fund will not be obligated to repay any such waived/reimbursed fees and expenses more than one year after the end of the fiscal year in which the fees or expenses were waived/reimbursed. |
|
If shares are redeemed:
|
1 year
|
3 years
|
5 years
|
10 years
|
||||
|
Class A
|
$
|
665
|
$
|
863
|
$
|
1,078
|
$
|
1,694
|
|
Class C
|
$
|
273
|
$
|
542
|
$
|
936
|
$
|
1,837
|
|
If shares are redeemed:
|
1 year
|
3 years
|
5 years
|
10 years
|
||||
|
Class N
|
$
|
66
|
$
|
208
|
$
|
362
|
$
|
810
|
|
Class Y
|
$
|
72
|
$
|
230
|
$
|
403
|
$
|
904
|
|
If shares are not redeemed:
|
1 year
|
3 years
|
5 years
|
10 years
|
||||
|
Class C
|
$
|
173
|
$
|
542
|
$
|
936
|
$
|
1,837
|
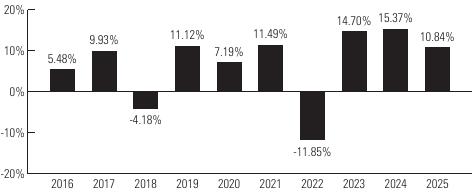 |
Highest Quarterly Return:
Second Quarter 2020, 8.36% Lowest Quarterly Return: First Quarter 2020, -10.01% |
|
Average Annual Total Returns
|
|
|
|
|
|
(for the periods ended December 31, 2025)
|
Past 1 Year
|
Past 5 Years
|
Past 10 Years
|
Life of Class N
(5/1/17) |
|
Class Y - Return Before Taxes
|
10.84%
|
7.59%
|
6.67%
|
-
|
|
Return After Taxes on Distributions
|
10.70%
|
7.40%
|
6.37%
|
-
|
|
Return After Taxes on Distributions and Sale of Fund Shares
|
6.51%
|
5.94%
|
5.29%
|
-
|
|
Class A - Return Before Taxes
|
4.22%
|
6.07%
|
5.79%
|
-
|
|
Class C - Return Before Taxes
|
8.72%
|
6.51%
|
5.77%
|
-
|
|
Class N - Return Before Taxes
|
10.89%
|
7.64%
|
-
|
6.67%
|
|
S&P 500® Index
|
17.88%
|
14.42%
|
14.82%
|
14.77%
|
|
Bloomberg U.S. Aggregate Bond Index
|
7.30%
|
-0.36%
|
2.01%
|
1.84%
|
|
Type of Account
|
Minimum Initial Purchase
|
|
Any account other than those listed below
|
$2,500
|
|
For shareholders participating in Natixis Funds’ Automatic Investment Plan
|
$1,000
|
|
For Traditional IRA, Roth IRA, Rollover IRA, SEP-IRA and Keogh plans
|
$1,000
|
|
•
|
Fee Based Programs (such as wrap accounts) where an advisory fee is paid to the broker-dealer or other financial intermediary. Please consult your financial representative to determine if your fee based program is subject to additional or different conditions or fees.
|
|
•
|
Certain Retirement Plans. Please consult your retirement plan administrator to determine if your retirement plan is subject to additional or different conditions or fees imposed by the plan administrator.
|
|
•
|
Clients of a Registered Investment Adviser where the Registered Investment Adviser receives an advisory, management or consulting fee.
|
|
•
|
Effective June 1, 2026, accounts invested through certain intermediaries held within an Intermediary Omnibus Account.
|
|
•
|
Effective June 1, 2026, in its sole discretion, Natixis Distribution, LLC (the “Distributor”) may waive any share class eligibility requirement.
|
|
•
|
Certain Retirement Plans. Please consult your retirement plan administrator to determine if your retirement plan is subject to additional or different conditions or fees imposed by the plan administrator.
|
|
•
|
Funds of funds that are distributed by the Distributor.
|
|
•
|
Sub-accounts held within an omnibus account, where the omnibus account has at least $1,000,000. (Effective June 1, 2026, this waiver no longer applies.)
|
|
•
|
Effective June 1, 2026, accounts invested through certain intermediaries held within an Intermediary Omnibus Account.
|
|
•
|
Effective June 1, 2026, in its sole discretion, the Distributor may waive any share class eligibility requirement.
|
|
•
|
Fee Based Programs (such as wrap accounts) where an advisory fee is paid to the broker-dealer or other financial intermediary. Please consult your financial representative to determine if your fee based program is subject to additional or different conditions or fees.
|
|
•
|
Certain Retirement Plans. Please consult your retirement plan administrator to determine if your retirement plan is subject to additional or different conditions or fees imposed by the plan administrator.
|
|
•
|
Certain Individual Retirement Accounts if the amounts invested represent rollover distributions from investments by any of the retirement plans invested in the Fund.
|
|
•
|
Clients of a Registered Investment Adviser where the Registered Investment Adviser receives an advisory, management or consulting fee.
|
|
•
|
Fund Trustees, former Fund trustees, employees of affiliates of the Natixis Funds and other individuals who are affiliated with any Natixis Fund (this also applies to any spouse, parents, children, siblings, grandparents, grandchildren and in-laws of those mentioned) and Natixis affiliate employee benefit plans.
|
|
•
|
Effective June 1, 2026, accounts invested through certain intermediaries held within an Intermediary Omnibus Account.
|
|
•
|
Effective June 1, 2026, in its sole discretion, the Distributor may waive any share class eligibility requirement.
|
|
|
Class A
|
Class C
|
Class N
|
Class Y
|
|
Maximum sales charge (load) imposed on purchases (as a percentage of offering price)
|
|
|
|
|
|
Maximum deferred sales charge (load) (as a percentage of original purchase price or redemption proceeds, as applicable)
|
|
|
|
|
|
Redemption fees
|
|
|
|
|
| 1 |
|
|
Class A
|
Class C
|
Class N
|
Class Y
|
|
Management fees
|
|
|
|
|
|
Distribution and/or service (12b-1) fees
|
|
|
|
|
|
Other expenses
|
|
|
|
|
|
Total annual fund operating expenses
|
|
|
|
|
|
Fee waiver and/or expense reimbursement1,2
|
|
|
|
|
|
Total annual fund operating expenses after fee waiver and/or expense reimbursement
|
|
|
|
|
| 1 | Mirova US LLC (“Mirova US” or the “Adviser”) has given a binding contractual undertaking to the Fund to limit the amount of the Fund’s total annual fund operating expenses to 1.20%, 1.95%, 0.90%, and 0.95% of the Fund’s average daily net assets for Class A, C, N, and Y shares, respectively, exclusive of brokerage expenses, interest expense, taxes, acquired fund fees and expenses, organizational and extraordinary expenses, such as litigation and indemnification expenses. This undertaking is in effect through |
| 2 | Natixis Advisors, LLC (“Natixis Advisors”) has given a binding contractual undertaking to the Fund to reimburse any and all transfer agency expenses for Class N shares. This undertaking is in effect through April 30, 2027 and may be terminated before then only with the consent of the Fund’s Board of Trustees. |
|
|
1 year
|
3 years
|
5 years
|
10 years
|
||||
|
Class A
|
$
|
|
$
|
|
$
|
|
$
|
|
|
Class C
|
$
|
|
$
|
|
$
|
|
$
|
|
|
If shares are redeemed:
|
1 year
|
3 years
|
5 years
|
10 years
|
||||
|
Class N
|
$
|
|
$
|
|
$
|
|
$
|
|
|
Class Y
|
$
|
|
$
|
|
$
|
|
$
|
|
|
|
1 year
|
3 years
|
5 years
|
10 years
|
||||
|
Class C
|
$
|
|
$
|
|
$
|
|
$
|
|
 |
|
|
|
|
|
|
|
|
|
Past 1 Year
|
Past 5 Years
|
Life of Fund
(3/31/16) |
Life of Class N
(5/1/17) |
|
Class Y - Return Before Taxes
|
|
|
|
-
|
|
Return After Taxes on Distributions
|
|
|
|
-
|
|
Return After Taxes on Distributions and Sale of Fund Shares
|
|
|
|
-
|
|
Class A - Return Before Taxes
|
|
|
|
-
|
|
Class C - Return Before Taxes
|
|
|
|
-
|
|
Class N - Return Before Taxes
|
|
|
-
|
|
|
MSCI World Index (Net)
|
|
|
|
|
|
Type of Account
|
Minimum Initial Purchase
|
|
Any account other than those listed below
|
$2,500
|
|
For shareholders participating in Natixis Funds’ Automatic Investment Plan
|
$1,000
|
|
For Traditional IRA, Roth IRA, Rollover IRA, SEP-IRA and Keogh plans
|
$1,000
|
|
•
|
Fee Based Programs (such as wrap accounts) where an advisory fee is paid to the broker-dealer or other financial intermediary. Please consult your financial representative to determine if your fee based program is subject to additional or different conditions or fees.
|
|
•
|
Certain Retirement Plans. Please consult your retirement plan administrator to determine if your retirement plan is subject to additional or different conditions or fees imposed by the plan administrator.
|
|
•
|
Clients of a Registered Investment Adviser where the Registered Investment Adviser receives an advisory, management or consulting fee.
|
|
•
|
Effective June 1, 2026, accounts invested through certain intermediaries held within an Intermediary Omnibus Account.
|
|
•
|
Effective June 1, 2026, in its sole discretion, Natixis Distribution, LLC (the “Distributor”) may waive any share class eligibility requirement.
|
|
•
|
Certain Retirement Plans. Please consult your retirement plan administrator to determine if your retirement plan is subject to additional or different conditions or fees imposed by the plan administrator.
|
|
•
|
Funds of funds that are distributed by the Distributor.
|
|
•
|
Sub-accounts held within an omnibus account, where the omnibus account has at least $1,000,000. (Effective June 1, 2026, this waiver no longer applies.)
|
|
•
|
Effective June 1, 2026, accounts invested through certain intermediaries held within an Intermediary Omnibus Account.
|
|
•
|
Effective June 1, 2026, in its sole discretion, the Distributor may waive any share class eligibility requirement.
|
|
•
|
Fee Based Programs (such as wrap accounts) where an advisory fee is paid to the broker-dealer or other financial intermediary. Please consult your financial representative to determine if your fee based program is subject to additional or different conditions or fees.
|
|
•
|
Certain Retirement Plans. Please consult your retirement plan administrator to determine if your retirement plan is subject to additional or different conditions or fees imposed by the plan administrator.
|
|
•
|
Certain Individual Retirement Accounts if the amounts invested represent rollover distributions from investments by any of the retirement plans invested in the Fund.
|
|
•
|
Clients of a Registered Investment Adviser where the Registered Investment Adviser receives an advisory, management or consulting fee.
|
|
•
|
Fund Trustees, former Fund trustees, employees of affiliates of the Natixis Funds and other individuals who are affiliated with any Natixis Fund (this also applies to any spouse, parents, children, siblings, grandparents, grandchildren and in-laws of those mentioned) and Natixis affiliate employee benefit plans.
|
|
•
|
Effective June 1, 2026, accounts invested through certain intermediaries held within an Intermediary Omnibus Account.
|
|
•
|
Effective June 1, 2026, in its sole discretion, the Distributor may waive any share class eligibility requirement.
|
|
(fees paid directly from your investment)
|
Class A
|
Class C
|
Class N
|
Class Y
|
|
Maximum sales charge (load) imposed on purchases (as a percentage of offering price)
|
5.75%
|
None
|
None
|
None
|
|
Maximum deferred sales charge (load) (as a percentage of original purchase price or redemption proceeds, as applicable)
|
None1
|
1.00%
|
None
|
None
|
|
Redemption fees
|
None
|
None
|
None
|
None
|
| 1 | A 1.00% contingent deferred sales charge (“CDSC”) may apply to certain purchases of Class A shares of $1,000,000 or more that are redeemed within eighteen months of the date of purchase. |
|
(expenses that you pay each year as a percentage of the value of your investment)
|
Class A
|
Class C
|
Class N
|
Class Y
|
|
Management fees
|
0.75%
|
0.75%
|
0.75%
|
0.75%
|
|
Distribution and/or service (12b-1) fees
|
0.25%
|
1.00%
|
0.00%
|
0.00%
|
|
Other expenses
|
0.27%
|
0.27%
|
0.17%
|
0.27%
|
|
Total annual fund operating expenses
|
1.27%
|
2.02%
|
0.92%
|
1.02%
|
|
Fee waiver and/or expense reimbursement1,2
|
0.12%
|
0.12%
|
0.07%
|
0.12%
|
|
Total annual fund operating expenses after fee waiver and/or expense reimbursement
|
1.15%
|
1.90%
|
0.85%
|
0.90%
|
| 1 | Natixis Advisors, LLC (“Natixis Advisors” or the “Adviser”) has given a binding contractual undertaking to the Fund to limit the amount of the Fund’s total annual fund operating expenses to 1.15%, 1.90%, 0.85%, and 0.90% of the Fund’s average daily net assets for Class A, Class C, Class N, and Class Y shares, respectively, exclusive of brokerage expenses, interest expense, taxes, acquired fund fees and expenses, organizational and extraordinary expenses, such as litigation and indemnification expenses. This undertaking is in effect through April 30, 2027 and may be terminated before then only with the consent of the Fund’s Board of Trustees. The Adviser will be permitted to recover, on a class-by-class basis, management fees waived and/or expenses reimbursed to the extent that expenses in later periods fall below both (1) the class’ applicable expense limitation at the time such amounts were waived/reimbursed and (2) the class’ current applicable expense limitation. The Fund will not be obligated to repay any such waived/reimbursed fees and expenses more than one year after the end of the fiscal year in which the fees or expenses were waived/reimbursed. |
| 2 | Natixis Advisors, LLC (“Natixis Advisors”) has given a binding contractual undertaking to the Fund to reimburse any and all transfer agency expenses for Class N shares. This undertaking is in effect through April 30, 2027 and may be terminated before then only with the consent of the Fund’s Board of Trustees. |
|
If shares are redeemed:
|
1 year
|
3 years
|
5 years
|
10 years
|
||||
|
Class A
|
$
|
685
|
$
|
943
|
$
|
1,221
|
$
|
2,011
|
|
Class C
|
$
|
293
|
$
|
622
|
$
|
1,077
|
$
|
2,145
|
|
If shares are redeemed:
|
1 year
|
3 years
|
5 years
|
10 years
|
||||
|
Class N
|
$
|
87
|
$
|
286
|
$
|
502
|
$
|
1,125
|
|
Class Y
|
$
|
92
|
$
|
313
|
$
|
552
|
$
|
1,237
|
|
|
1 year
|
3 years
|
5 years
|
10 years
|
||||
|
Class C
|
$
|
193
|
$
|
622
|
$
|
1,077
|
$
|
2,145
|
|
•
|
Companies earning a positive return on capital with stable-to-improving returns.
|
|
•
|
Companies valued at a discount to their asset value.
|
|
•
|
Companies with an attractive and sustainable dividend level.
|
|
•
|
Vaughan Nelson employs a value-driven investment philosophy that selects stocks selling at a relatively low value based on business fundamentals, economic margin analysis and discounted cash flow models. Vaughan Nelson selects companies that it believes are out of favor or misunderstood.
|
|
•
|
Vaughan Nelson uses fundamental analysis to construct a portfolio that, in the opinion of Vaughan Nelson, is made up of quality companies with the potential to provide significant increases in share price over a three year period.
|
|
•
|
Vaughan Nelson will generally sell a security when it reaches Vaughan Nelson’s price target or when the issuer shows a change in financial condition, competitive pressures, poor management decisions or internal or external forces reducing future expected returns from those expected at the time of investment.
|
|
•
|
Invest in foreign securities, including emerging markets securities.
|
|
•
|
Invest in other investment companies, to the extent permitted by the Investment Company Act of 1940.
|
|
•
|
Invest in REITs.
|
|
•
|
Invest in securities offered in initial public offerings (“IPOs”), securities issued pursuant to Rule 144A under the Securities Act of 1933 (“Rule 144A securities”), and other privately placed investments such as private equity investments.
|
 |
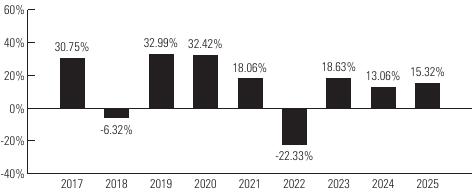
Highest Quarterly Return:
Fourth Quarter 2020, 22.51% Lowest Quarterly Return: First Quarter 2020, -28.21% |
|
Average Annual Total Returns
|
|
|
|
|
(for the periods ended December 31, 2025)
|
Past 1 Year
|
Past 5 Years
|
Past 10 Years
|
|
Class Y - Return Before Taxes
|
12.39%
|
11.08%
|
9.47%
|
|
Return After Taxes on Distributions
|
1.84%
|
7.33%
|
6.88%
|
|
Return After Taxes on Distributions and Sale of Fund Shares
|
11.43%
|
8.08%
|
7.10%
|
|
Class A - Return Before Taxes
|
5.67%
|
9.49%
|
8.55%
|
|
Class C - Return Before Taxes
|
10.59%
|
9.98%
|
8.53%
|
|
Class N - Return Before Taxes
|
12.44%
|
11.13%
|
9.54%
|
|
Russell 3000® Index
|
17.15%
|
13.15%
|
14.29%
|
|
Russell Midcap® Value Index
|
11.05%
|
9.83%
|
9.78%
|
|
Type of Account
|
Minimum Initial Purchase
|
|
Any account other than those listed below
|
$2,500
|
|
For shareholders participating in Natixis Funds’ Automatic Investment Plan
|
$1,000
|
|
For Traditional IRA, Roth IRA, Rollover IRA, SEP-IRA and Keogh plans
|
$1,000
|
|
•
|
Fee Based Programs (such as wrap accounts) where an advisory fee is paid to the broker-dealer or other financial intermediary. Please consult your financial representative to determine if your fee based program is subject to additional or different conditions or fees.
|
|
•
|
Certain Retirement Plans. Please consult your retirement plan administrator to determine if your retirement plan is subject to additional or different conditions or fees imposed by the plan administrator.
|
|
•
|
Clients of a Registered Investment Adviser where the Registered Investment Adviser receives an advisory, management or consulting fee.
|
|
•
|
Effective June 1, 2026, accounts invested through certain intermediaries held within an Intermediary Omnibus Account.
|
|
•
|
Effective June 1, 2026, in its sole discretion, Natixis Distribution, LLC (the “Distributor”) may waive any share class eligibility requirement.
|
|
•
|
Certain Retirement Plans. Please consult your retirement plan administrator to determine if your retirement plan is subject to additional or different conditions or fees imposed by the plan administrator.
|
|
•
|
Funds of funds that are distributed by the Distributor.
|
|
•
|
Sub-accounts held within an omnibus account, where the omnibus account has at least $1,000,000. (Effective June 1, 2026, this waiver no longer applies.)
|
|
•
|
Effective June 1, 2026, accounts invested through certain intermediaries held within an Intermediary Omnibus Account.
|
|
•
|
Effective June 1, 2026, in its sole discretion, the Distributor may waive any share class eligibility requirement.
|
|
•
|
Fee Based Programs (such as wrap accounts) where an advisory fee is paid to the broker-dealer or other financial intermediary. Please consult your financial representative to determine if your fee based program is subject to additional or different conditions or fees.
|
|
•
|
Certain Retirement Plans. Please consult your retirement plan administrator to determine if your retirement plan is subject to additional or different conditions or fees imposed by the plan administrator.
|
|
•
|
Certain Individual Retirement Accounts if the amounts invested represent rollover distributions from investments by any of the retirement plans invested in the Fund.
|
|
•
|
Clients of a Registered Investment Adviser where the Registered Investment Adviser receives an advisory, management or consulting fee.
|
|
•
|
Fund Trustees, former Fund trustees, employees of affiliates of the Natixis Funds and other individuals who are affiliated with any Natixis Fund (this also applies to any spouse, parents, children, siblings, grandparents, grandchildren and in-laws of those mentioned) and Natixis affiliate employee benefit plans.
|
|
•
|
Effective June 1, 2026, accounts invested through certain intermediaries held within an Intermediary Omnibus Account.
|
|
•
|
Effective June 1, 2026, in its sole discretion, the Distributor may waive any share class eligibility requirement.
|
|
(fees paid directly from your investment)
|
Class A
|
Class C
|
Class N
|
Class Y
|
|
Maximum sales charge (load) imposed on purchases (as a percentage of offering price)
|
|
|
|
|
|
Maximum deferred sales charge (load) (as a percentage of original purchase price or redemption proceeds, as applicable)
|
|
|
|
|
|
Redemption fees
|
|
|
|
|
| 1 |
|
|
Class A
|
Class C
|
Class N
|
Class Y
|
|
Management fees
|
|
|
|
|
|
Distribution and/or service (12b-1) fees
|
|
|
|
|
|
Other expenses
|
|
|
|
|
|
Acquired fund fees and expenses1
|
|
|
|
|
|
Total annual fund operating expenses
|
|
|
|
|
|
Fee waiver and/or expense reimbursement2,3
|
|
|
|
|
|
Total annual fund operating expenses after fee waiver and/or expense reimbursement
|
|
|
|
|
| 1 | The expense information shown in the table above differs from the expense information disclosed in the Fund’s financial highlights table because the financial highlights table reflects the operating expenses of the Fund and does not include acquired fund fees and expenses. |
| 2 | The Fund’s investment adviser has given a binding contractual undertaking to the Fund to limit the amount of the Fund’s total annual fund operating expenses to 1.25%, 2.00%, 0.95%, and 1.00% of the Fund’s average daily net assets for Class A, Class C, Class N, and Class Y shares, respectively, exclusive of brokerage expenses, interest expense, taxes, acquired fund fees and expenses, organizational and extraordinary expenses, such as litigation and indemnification expenses. This undertaking is in effect through |
| 3 | Natixis Advisors, LLC (“Natixis Advisors”) has given a binding contractual undertaking to the Fund to reimburse any and all transfer agency expenses for Class N shares. This undertaking is in effect through April 30, 2027 and may be terminated before then only with the consent of the Fund’s Board of Trustees. |
|
|
1 year
|
3 years
|
5 years
|
10 years
|
||||
|
Class A
|
$
|
|
$
|
|
$
|
|
$
|
|
|
Class C
|
$
|
|
$
|
|
$
|
|
$
|
|
|
Class N
|
$
|
|
$
|
|
$
|
|
$
|
|
|
Class Y
|
$
|
|
$
|
|
$
|
|
$
|
|
|
|
1 year
|
3 years
|
5 years
|
10 years
|
||||
|
Class C
|
$
|
|
$
|
|
$
|
|
$
|
|
|
•
|
Companies earning a positive return on capital with stable-to-improving returns.
|
|
•
|
Companies valued at a discount to their asset value.
|
|
•
|
Companies with an attractive and sustainable dividend level.
|
|
•
|
Value-driven investment philosophy that selects stocks selling at a relatively low value based on discounted cash flow models. Vaughan Nelson selects companies that it believes are out of favor or misunderstood.
|
|
•
|
Vaughan Nelson starts with an investment universe of 5,000 securities. Vaughan Nelson then uses value-driven screens to create a research universe of companies with market capitalizations of at least $100 million.
|
|
•
|
Vaughan Nelson uses fundamental analysis to construct a portfolio of 60 to 80 securities that, in the opinion of Vaughan Nelson, is made up of quality companies with the potential to provide significant increases in share price over a three year period.
|
|
•
|
Vaughan Nelson will generally sell a security when it reaches Vaughan Nelson’s price target or when the issuer shows a change in financial condition, competitive pressures, poor management decisions or internal or external forces reducing future expected returns from those expected at the time of investment.
|
|
•
|
Invest in convertible preferred stock and convertible debt securities.
|
|
•
|
Invest in foreign securities, including emerging market securities.
|
|
•
|
Invest in REITs.
|
|
•
|
Invest in securities offered in initial public offerings (“IPOs”).
|
 |
|
|
|
|
|
|
|
|
|
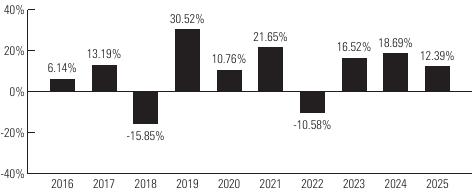
Past 1 Year
|
Past 5 Years
|
Past 10 Years
|
Life of Class N
(5/1/17) |
|
Class Y - Return Before Taxes
|
|
|
|
-
|
|
Return After Taxes on Distributions
|
|
|
|
-
|
|
Return After Taxes on Distributions and Sale of Fund Shares
|
|
|
|
-
|
|
Class A - Return Before Taxes
|
|
|
|
-
|
|
Class C - Return Before Taxes
|
|
|
|
-
|
|
Class N - Return Before Taxes
|
|
|
-
|
|
|
Russell 3000® Index
|
|
|
|
|
|
Russell 2000® Value Index
|
|
|
|
|
|
Type of Account
|
Minimum Initial Purchase
|
|
Any account other than those listed below
|
$2,500
|
|
For shareholders participating in Natixis Funds’ Automatic Investment Plan
|
$1,000
|
|
For Traditional IRA, Roth IRA, Rollover IRA, SEP-IRA and Keogh plans
|
$1,000
|
|
•
|
Fee Based Programs (such as wrap accounts) where an advisory fee is paid to the broker-dealer or other financial intermediary. Please consult your financial representative to determine if your fee based program is subject to additional or different conditions or fees.
|
|
•
|
Certain Retirement Plans. Please consult your retirement plan administrator to determine if your retirement plan is subject to additional or different conditions or fees imposed by the plan administrator.
|
|
•
|
Clients of a Registered Investment Adviser where the Registered Investment Adviser receives an advisory, management or consulting fee.
|
|
•
|
Effective June 1, 2026, accounts invested through certain intermediaries held within an Intermediary Omnibus Account.
|
|
•
|
Effective June 1, 2026, in its sole discretion, Natixis Distribution, LLC (the “Distributor”) may waive any share class eligibility requirement.
|
|
•
|
Certain Retirement Plans. Please consult your retirement plan administrator to determine if your retirement plan is subject to additional or different conditions or fees imposed by the plan administrator.
|
|
•
|
Funds of funds that are distributed by the Distributor.
|
|
•
|
Sub-accounts held within an omnibus account, where the omnibus account has at least $1,000,000. (Effective June 1, 2026, this waiver no longer applies.)
|
|
•
|
Effective June 1, 2026, accounts invested through certain intermediaries held within an Intermediary Omnibus Account.
|
|
•
|
Effective June 1, 2026, in its sole discretion, the Distributor may waive any share class eligibility requirement.
|
|
•
|
Fee Based Programs (such as wrap accounts) where an advisory fee is paid to the broker-dealer or other financial intermediary. Please consult your financial representative to determine if your fee based program is subject to additional or different conditions or fees.
|
|
•
|
Certain Retirement Plans. Please consult your retirement plan administrator to determine if your retirement plan is subject to additional or different conditions or fees imposed by the plan administrator.
|
|
•
|
Certain Individual Retirement Accounts if the amounts invested represent rollover distributions from investments by any of the retirement plans invested in the Fund.
|
|
•
|
Clients of a Registered Investment Adviser where the Registered Investment Adviser receives an advisory, management or consulting fee.
|
|
•
|
Fund Trustees, former Fund trustees, employees of affiliates of the Natixis Funds and other individuals who are affiliated with any Natixis Fund (this also applies to any spouse, parents, children, siblings, grandparents, grandchildren and in-laws of those mentioned) and Natixis affiliate employee benefit plans.
|
|
•
|
Effective June 1, 2026, accounts invested through certain intermediaries held within an Intermediary Omnibus Account.
|
|
•
|
Effective June 1, 2026, in its sole discretion, the Distributor may waive any share class eligibility requirement.
|
|
•
|
Companies earning a positive return on capital with stable-to-improving returns.
|
|
•
|
Companies valued at a discount to their asset value.
|
|
•
|
Companies with an attractive and sustainable dividend level.
|
|
•
|
Vaughan Nelson employs a value-driven investment philosophy that selects stocks selling at a relatively low value based on business fundamentals, economic margin analysis and discounted cash flow models. Vaughan Nelson selects companies that it believes are out of favor or misunderstood.
|
|
•
|
Vaughan Nelson uses fundamental analysis to construct a portfolio that, in the opinion of Vaughan Nelson, is made up of quality companies with the potential to provide significant increases in share price over a three year period.
|
|
•
|
Vaughan Nelson will generally sell a security when it reaches Vaughan Nelson’s price target or when the issuer shows a change in financial condition, competitive pressures, poor management decisions or internal or external forces reducing future expected returns from those expected at the time of investment.
|
|
•
|
Invest in foreign securities, including emerging markets securities.
|
|
•
|
Invest in other investment companies, to the extent permitted by the Investment Company Act of 1940.
|
|
•
|
Invest in REITs.
|
|
•
|
Invest in securities offered in initial public offerings (“IPOs”), securities issued pursuant to Rule 144A under the Securities Act of 1933 (“Rule 144A securities”), and other privately placed investments such as private equity investments.
|
|
•
|
Companies earning a positive return on capital with stable-to-improving returns.
|
|
•
|
Companies valued at a discount to their asset value.
|
|
•
|
Companies with an attractive and sustainable dividend level.
|
|
•
|
Value-driven investment philosophy that selects stocks selling at a relatively low value based on discounted cash flow models. Vaughan Nelson selects companies that it believes are out of favor or misunderstood.
|
|
•
|
Vaughan Nelson starts with an investment universe of 5,000 securities. Vaughan Nelson then uses value-driven screens to create a research universe of companies with market capitalizations of at least $100 million.
|
|
•
|
Vaughan Nelson uses fundamental analysis to construct a portfolio of 60 to 80 securities that, in the opinion of Vaughan Nelson, is made up of quality companies with the potential to provide significant increases in share price over a three year period.
|
|
•
|
Vaughan Nelson will generally sell a security when it reaches Vaughan Nelson’s price target or when the issuer shows a change in financial condition, competitive pressures, poor management decisions or internal or external forces reducing future expected returns from those expected at the time of investment.
|
|
•
|
Invest in convertible preferred stock and convertible debt securities.
|
|
•
|
Invest in foreign securities, including emerging market securities.
|
|
•
|
Invest in REITs.
|
|
•
|
Invest in securities offered in initial public offerings (“IPOs”).
|
|
•
|
You pay a sales charge when you buy Class A shares. There are several ways to reduce this charge. See the section “How Sales Charges Are Calculated.”
|
|
•
|
You pay lower annual expenses than Class C shares, giving you the potential for higher returns per share. However, where front-end sales charges are applicable, returns are earned on a smaller amount of your investment.
|
|
•
|
You pay higher expenses than Class N and Class Y shares.
|
|
•
|
You do not pay a sales charge if your total investment reaches $1 million or more, but you may pay a charge on redemptions if you redeem these shares within 18 months of purchase.
|
|
•
|
The Gateway Fund acquired the assets and liabilities of the Gateway Predecessor Fund in a Reorganization on February 15, 2008. If you held shares of the Gateway Predecessor Fund in your existing account as of the date of the Reorganization, you are eligible to purchase additional Class A shares without a sales charge or a contingent deferred sales charge (“CDSC”) through your existing account, provided you have held fund shares in your existing account since that date.
Due to operational limitations at your financial intermediary, a sales charge or CDSC may be assessed unless you inform the financial intermediary at the time you make any additional purchase that you were a shareholder of the Gateway Predecessor Fund and are eligible to purchase Class A shares |
|
without a sales charge or CDSC. Notwithstanding the foregoing, former shareholders of the Gateway Predecessor Fund may not be eligible to purchase shares at NAV through a financial intermediary if the nature of your relationship with, and/or the services you receive from, the financial intermediary changes. Please consult your financial representative for further details.
|
|
•
|
You do not pay a sales charge when you buy Class C shares. All of your money goes to work for you right away.
|
|
•
|
You pay higher annual expenses than Class A, Class N and Class Y shares.
|
|
•
|
You may pay a sales charge on redemptions if you sell your Class C shares within one year of purchase.
|
|
•
|
Investors will not be permitted to purchase $1 million or more of Class C shares as a single investment per account. There may be certain exceptions to this restriction for omnibus and other nominee accounts. Investors may want to consider the lower operating expense of Class A shares in such instances. You may pay a charge on redemptions if you redeem Class A shares within 18 months of purchase.
|
|
•
|
Except as noted below, Class C shares will automatically convert to Class A shares after eight years. Please see the section “Exchanging or Converting Shares” for details regarding a conversion of shares. Generally, to be eligible to have your Class C shares automatically converted to Class A shares, the Fund or the financial intermediary through which you purchased your shares will need to have records verifying that your Class C shares have been held for eight years. Due to operational limitations at your financial intermediary, your ability to have your Class C shares automatically converted to Class A shares may be limited. Group retirement plans of certain financial intermediaries who hold Class C shares with a Fund in an omnibus account do not track participant level aging of shares and therefore these shares will not be eligible for an automatic conversion. Certain intermediaries may convert your Class C shares to Class A shares in accordance with a conversion schedule that may differ from the one described above. Please consult your financial representative for more information.
|
|
•
|
You have a minimum initial investment of $1,000,000. There are several ways to waive this minimum. See the section “Purchase and Sale of Fund Shares.”
|
|
•
|
You do not pay a sales charge when you buy Class N shares. All of your money goes to work for you right away.
|
|
•
|
You do not pay a sales charge on redemptions.
|
|
•
|
You may pay lower annual expenses than Class A, Class C and Class Y shares, giving you the potential for higher returns per share.
|
|
•
|
You have a minimum initial investment of $100,000. There are several ways to waive this minimum. See the section “Purchase and Sale of Fund Shares.”
|
|
•
|
You do not pay a sales charge when you buy Class Y shares. All of your money goes to work for you right away.
|
|
•
|
You do not pay a sales charge on redemptions.
|
|
•
|
You pay lower annual expenses than Class A and Class C shares, giving you the potential for higher returns per share.
|
|
•
|
You may pay higher annual expenses than Class N shares.
|
|
Class A Sales Charges*
|
||
|
|
All Funds
|
|
|
Your Investment
|
As a % of offering price
|
As a % of your investment
|
|
Less than $50,000
|
5.75%
|
6.10%
|
|
$50,000 – $99,999
|
4.50%
|
4.71%
|
|
$100,000 – $249,999
|
3.50%
|
3.63%
|
|
$250,000 – $499,999
|
2.50%
|
2.56%
|
|
$500,000 – $999,999
|
2.00%
|
2.04%
|
|
$1,000,000 or more**
|
0.00%
|
0.00%
|
|
•
|
Letter of Intent — By signing a Letter of Intent, you may purchase Class A shares of any Natixis Fund over a 13-month period but pay sales charges as if you had purchased all shares at once. This program can save you money if you plan to invest $50,000 or more within 13 months.
|
|
•
|
Cumulative Purchase Discount — You may be entitled to a reduced sales charge if your “total investment” reaches a breakpoint for a reduced sales charge. The total investment is determined by adding the amount of your current purchase in a Fund, including the applicable sales charge, to the current public offering price of all series and classes of shares of the Natixis Funds held by you in one or more accounts. If your total investment exceeds a sales charge breakpoint in the table above, the lower sales charge applies to the entire amount of your current purchase in a Fund.
|
|
•
|
Combining Accounts — This allows you to combine shares of multiple Natixis Funds and classes for purposes of calculating your sales charge
|
|
Individual Accounts: You may elect to combine your purchase(s) and your total investment, as defined above, with the purchases and total investment of your spouse, parents, children, siblings, grandparents, grandchildren, in-laws (of those previously mentioned), individual retirement accounts, sole proprietorships, single trust estates and any other individuals acceptable to the Distributor.
|
|
Certain Retirement Plan Accounts: The Distributor may, at its discretion, combine the purchase(s) and total investment of all qualified participants in the same retirement plan for purposes of determining the availability of a reduced sales charge. In most instances, individual accounts may not be linked with certain retirement plan accounts for the purposes of calculating sales charges. In most instances, individual accounts may not be linked with certain retirement plan accounts for the purposes of calculating sales charges. Savings Incentive Match Plan for Employees (“SIMPLE IRA”) contributions will automatically be linked with those of other participants in the same SIMPLE IRA Plan (Class A shares only) using the Natixis Funds prototype document. Effective May 8, 2026, all share classes will be linked for the purpose of calculating sales charges. SIMPLE IRA accounts may not be linked with any other Natixis Fund account for rights of accumulation. Please refer to the SAI for more detailed information on combining accounts.
|
|
•
|
Clients of a financial intermediary that has entered into an agreement with the Distributor and has been approved by the Distributor to offer Fund shares to self-directed investment brokerage accounts that may or may not charge a transaction fee;
|
|
•
|
Any government entity that is prohibited from paying a sales charge or commission to purchase mutual fund shares;
|
|
•
|
All employees of financial intermediaries under arrangements with the Distributor (this also applies to spouses and children under the age of 21 of those mentioned);
|
|
•
|
Fund trustees, former trustees, employees of affiliates of the Natixis Funds and other individuals who are affiliated with any Natixis Fund (this also applies to any spouse, parents, children, siblings, grandparents, grandchildren and in-laws of those mentioned);
|
|
•
|
Certain Retirement Plans. The availability of this pricing may depend upon the policies and procedures of your specific financial intermediary; consult your financial adviser;
|
|
•
|
Non-discretionary and non-retirement accounts of bank trust departments or trust companies, but only if they principally engage in banking or trust activities;
|
|
•
|
Investors who were Gateway Predecessor Fund shareholders as of the date of the Reorganization (see the section “Choosing a Share Class”);
|
|
•
|
Fee Based Programs of certain broker-dealers, the Advisers or the Distributor. Please consult your financial representative to determine if your fee based program is subject to additional or different conditions or fees; and
|
|
•
|
Registered Investment Advisers investing on behalf of clients in exchange for an advisory, management or consulting fee.
|
|
Year Since Purchase
|
CDSC on Shares Being Sold
|
|
1st
|
1.00%
|
|
Thereafter
|
0.00%
|
|
•
|
Is calculated based on the number of shares you are selling;
|
|
•
|
Calculation is based on either your original purchase price or the current NAV of the shares being sold, whichever is lower in order to minimize your CDSC;
|
|
•
|
Is deducted from the proceeds of the redemption unless you request, at the time of the redemption, that it be deducted from the amount remaining in your account; and
|
|
•
|
Applies to redemptions made within the time frame shown above for each class.
|
|
•
|
Increases in NAV above the purchase price;
|
|
•
|
Shares you acquired by reinvesting your dividends or capital gains distributions; or
|
|
•
|
Exchanges. However, the original purchase date of the shares from which the exchange is made determines if the newly acquired shares are subject to the CDSC when they are sold.
|
|
•
|
If you are selling more than $100,000 per day from a single fund/account and you are requesting the proceeds by check (this does not apply to IRA transfer of assets to new custodian).
|
|
•
|
If you are requesting that the proceeds check (of any amount) be made out to someone other than the registered owner(s) or sent to an address other than the address of record.
|
|
•
|
If the account registration or bank account information has changed within the past 30 days.
|
|
•
|
If you are instructing us to send the proceeds by check, wire or ACH to a bank not already active on the fund account.
|
|
Restriction
|
Situation
|
|
Each Fund may suspend the right of redemption:
|
|
|
Each Fund reserves the right to suspend account services or refuse transaction requests:
|
|
|
Each Fund may pay the redemption price in whole or in part by a distribution in-kind of readily marketable securities in lieu of cash or may take up to 7 days to pay a redemption request in order to raise capital:
|
|
|
Each Fund may withhold redemption proceeds for 10 days from the purchase date:
|
|

|
•
|
A share’s NAV is determined at the close of regular trading on the NYSE on the days the NYSE is open for trading. This is normally 4:00 p.m., Eastern time. A Fund’s shares will not be priced on the days on which the NYSE is closed for trading. In addition, a Fund’s shares will not be priced on the holidays listed in the SAI. See the section “Net Asset Value” in the SAI for more details.
|
|
•
|
The price you pay for purchasing, redeeming or exchanging a share will be based upon the NAV next calculated (plus or minus applicable sales charges as described earlier in the Fund Summary) after your order is received by the transfer agent, SS&C Global Investor & Distribution Solutions, Inc., (rather than when the order arrives at the P.O. box) “in good order” (meaning that the order is complete and contains all necessary information).1
|
|
•
|
Requests received by the Funds after the NYSE closes will be processed based upon the NAV determined at the close of regular trading on the next day that the NYSE is open. If the transfer agent receives the order in good order prior to the NYSE market close (normally 4:00 p.m., Eastern time), the shareholder will receive that day’s NAV. Under limited circumstances, the Distributor may enter into contractual agreements pursuant to which orders received by your investment dealer before a Fund determines its NAV and transmitted to the transfer agent prior to market open on the next business day are processed at the NAV determined on the day the order was received by your investment dealer. Please contact your investment dealer to determine whether it has entered into such a contractual agreement. If your investment dealer has not entered into such a contractual agreement, your order will be processed at the NAV next determined after your investment dealer submits the order to a Fund.
|
|
•
|
If a Fund invests in foreign securities, it may have NAV changes on days when you cannot buy or sell its shares.
|
| 1 | Please see the section “How to Purchase Shares,” which provides additional information regarding who can receive a purchase order. |
|
•
|
Equity securities (including shares of closed-end investment companies and ETFs), exchange traded notes, rights, and warrants — listed equity securities are valued at the last sale price quoted on the exchange where they are traded most extensively or, if there is no reported sale during the day, the closing bid quotation as reported by a third-party pricing service. Securities traded on the NASDAQ Global Select Market, NASDAQ Global Market and NASDAQ Capital Market are valued at the NASDAQ Official Closing Price (“NOCP”), or if lacking an NOCP, at the most recent bid quotations on the
|
|
applicable NASDAQ Market. Unlisted equity securities (except unlisted preferred equity securities discussed below) are valued at the last sale price quoted in the market where they are traded most extensively or, if there is no reported sale during the day, the closing bid quotation as reported by a third-party pricing service. If there is no sale price or closing bid quotation available, unlisted equity securities will be valued using evaluated bids furnished by a third-party pricing service, if available. In some foreign markets, an official close price and a last sale price may be available from the foreign exchange or market. In those cases, the official close price is used. Valuations based on information from foreign markets may be subject to the Funds’ fair value policies described below. If a right is not traded on any exchange, its value is based on the market value of the underlying security, less the cost to subscribe to the underlying security (e.g., to exercise the right), adjusted for the subscription ratio. If a warrant is not traded on any exchange, a price is obtained from a broker-dealer.
|
|
•
|
Debt securities and unlisted preferred equity securities — evaluated bids furnished to a Fund by a third-party pricing service using market information, transactions for comparable securities and various relationships between securities, if available, or bid prices obtained from broker-dealers.
|
|
•
|
Senior Loans — bid prices supplied by a third-party pricing service, if available, or bid prices obtained from broker-dealers.
|
|
•
|
Bilateral Swaps — bilateral credit default swaps are valued based on mid prices (between the bid price and the ask price) supplied by a third-party pricing service. Bilateral interest rate swaps and bilateral standardized commodity and equity index total return swaps are valued based on prices supplied by a third-party pricing service. If prices from a third-party pricing service are not available, prices from a broker-dealer may be used.
|
|
•
|
Centrally Cleared Swaps — settlement prices of the clearing house on which the contracts were traded or prices obtained from broker-dealers.
|
|
•
|
Options — domestic exchange-traded index and single name equity options contracts (including options on ETFs) are valued at the mean of the National Best Bid and Offer quotations as determined by the Options Price Reporting Authority. Foreign exchange-traded single name equity options contracts are valued at the most recent settlement price. Options contracts on foreign indices are priced at the most recent settlement price. Options on futures contracts are valued using the current settlement price on the exchange on which, over time, they are traded most extensively. Other exchange-traded options are valued at the average of the closing bid and ask quotations on the exchange on which, over time, they are traded most extensively. OTC currency options and swaptions are valued at mid prices (between the bid price and the ask price) supplied by a third-party pricing service, if available. Other OTC options contracts (including currency options and swaptions not priced through a third-party pricing service) are valued based on prices obtained from broker-dealers. Valuations based on information from foreign markets may be subject to the Funds’ fair value policies as described below.
|
|
•
|
Futures —most recent settlement price on the exchange on which the valuation designee believes that, over time, they are traded most extensively. Valuations based on information from foreign markets may be subject to the Funds’ fair value policies as described below.
|
|
•
|
Forward Foreign Currency Contracts — interpolated rates determined based on information provided by a third-party pricing service.
|
|
•
|
Mutual Funds - net asset value.
|
|
Dividend Payment Schedule
|
|
|
Annually
|
Quarterly
|
|
Mirova Global Megatrends Fund
|
Gateway Equity Call Premium Fund
|
|
Vaughan Nelson Mid Cap Fund
|
Gateway Fund
|
|
Dividend Payment Schedule
|
|
|
Vaughan Nelson Small Cap Fund
|
|
|
•
|
Participate in the Dividend Diversification Program, which allows you to have all dividends and distributions automatically invested at NAV in shares of the same class of another Natixis Fund registered in your name. Certain investment minimums and restrictions may apply. For more information about the program, see the section “Additional Investor Services;”
|
|
•
|
Receive distributions from dividends and interest in cash while reinvesting distributions from capital gains in additional shares of the same class of the Fund, or in the same class of another Natixis Fund;
|
|
•
|
Receive distributions from capital gains in cash while reinvesting distributions from dividends and interest in additional shares of the same class of the Fund, or in the same class of another Natixis Fund; or
|
|
•
|
Receive all distributions in cash.
|
|
|
Class A
|
|||||||||
|
|
Year Ended
December 31, 2025 |
Year Ended
December 31, 2024 |
Year Ended
December 31, 2023 |
Year Ended
December 31, 2022 |
Year Ended
December 31, 2021 |
|||||
|
Net asset value, beginning of the period
|
$
|
19.86
|
$
|
17.01
|
$
|
14.60
|
$
|
16.66
|
$
|
14.03
|
|
INCOME (LOSS) FROM INVESTMENT OPERATIONS:
|
|
|
|
|
|
|
|
|
|
|
|
Net investment income(a)
|
|
0.07
|
|
0.10
|
|
0.12
|
|
0.10
|
|
0.07
|
|
Net realized and unrealized gain (loss)
|
|
2.48
|
|
2.85
|
|
2.41
|
|
(2.06
)
|
|
2.62
|
|
Total from Investment Operations
|
|
2.55
|
|
2.95
|
|
2.53
|
|
(1.96
)
|
|
2.69
|
|
LESS DISTRIBUTIONS FROM:
|
|
|
|
|
|
|
|
|
|
|
|
Net investment income
|
|
(0.08
)
|
|
(0.10
)
|
|
(0.12
)
|
|
(0.10
)
|
|
(0.06
)
|
|
Net asset value, end of the period
|
$
|
22.33
|
$
|
19.86
|
$
|
17.01
|
$
|
14.60
|
$
|
16.66
|
|
Total return(b)(c)
|
|
12.91
%
|
|
17.38
%
|
|
17.35
%
|
|
(11.77
)%
|
|
19.20
%
|
|
RATIOS TO AVERAGE NET ASSETS:
|
|
|
|
|
|
|
|
|
|
|
|
Net assets, end of the period (000’s)
|
$
|
3,443
|
$
|
3,090
|
$
|
2,073
|
$
|
1,617
|
$
|
2,613
|
|
Net expenses(d)
|
|
0.93
%
|
|
0.93
%
|
|
0.93
%
|
|
0.93
%
|
|
1.03
%
(e)(f)
|
|
Gross expenses
|
|
1.05
%
|
|
1.07
%
|
|
1.09
%
|
|
1.16
%
|
|
1.20
%
|
|
Net investment income
|
|
0.34
%
|
|
0.52
%
|
|
0.78
%
|
|
0.66
%
|
|
0.43
%
|
|
Portfolio turnover rate
|
|
18
%
|
|
19
%
|
|
32
%
|
|
11
%
|
|
5
%
|
|
(a)
|
Per share net investment income has been calculated using the average shares outstanding during the period.
|
|
(b)
|
A sales charge for Class A shares is not reflected in total return calculations.
|
|
(c)
|
Had certain expenses not been waived/reimbursed during the period, total returns would have been lower.
|
|
(d)
|
The investment adviser agreed to waive its fees and/or reimburse a portion of the Fund’s expenses during the period. Without this waiver/reimbursement, expenses would have been higher.
|
|
(e)
|
Effective July 1, 2021, the expense limit decreased from 1.20% to 0.93%.
|
|
(f)
|
Includes additional voluntary waiver of advisory fee of 0.02%.
|
|
|
Class C
|
|||||||||
|
|
Year Ended
December 31, 2025 |
Year Ended
December 31, 2024 |
Year Ended
December 31, 2023 |
Year Ended
December 31, 2022 |
Year Ended
December 31, 2021 |
|||||
|
Net asset value, beginning of the period
|
$
|
19.60
|
$
|
16.83
|
$
|
14.46
|
$
|
16.52
|
$
|
13.96
|
|
INCOME (LOSS) FROM INVESTMENT OPERATIONS:
|
|
|
|
|
|
|
|
|
|
|
|
Net investment income (loss)(a)
|
|
(0.08
)
|
|
(0.04
)
|
|
0.00
(b)
|
|
(0.01
)
|
|
(0.05
)
|
|
Net realized and unrealized gain (loss)
|
|
2.44
|
|
2.81
|
|
2.38
|
|
(2.04
)
|
|
2.61
|
|
Total from Investment Operations
|
|
2.36
|
|
2.77
|
|
2.38
|
|
(2.05
)
|
|
2.56
|
|
LESS DISTRIBUTIONS FROM:
|
|
|
|
|
|
|
|
|
|
|
|
Net investment income
|
|
—
|
|
(0.00
)
(b)
|
|
(0.01
)
|
|
(0.01
)
|
|
(0.00
)
(b)
|
|
Net asset value, end of the period
|
$
|
21.96
|
$
|
19.60
|
$
|
16.83
|
$
|
14.46
|
$
|
16.52
|
|
Total return(c)(d)
|
|
12.09
%
|
|
16.47
%
|
|
16.44
%
|
|
(12.36
)%
|
|
18.28
%
|
|
RATIOS TO AVERAGE NET ASSETS:
|
|
|
|
|
|
|
|
|
|
|
|
Net assets, end of the period (000’s)
|
$
|
821
|
$
|
1,053
|
$
|
1,130
|
$
|
944
|
$
|
814
|
|
Net expenses(e)
|
|
1.68
%
|
|
1.68
%
|
|
1.68
%
|
|
1.68
%
|
|
1.79
%
(f)(g)
|
|
Gross expenses
|
|
1.80
%
|
|
1.82
%
|
|
1.84
%
|
|
1.91
%
|
|
1.96
%
|
|
Net investment income (loss)
|
|
(0.40
)%
|
|
(0.23
)%
|
|
0.03
%
|
|
(0.06
)%
|
|
(0.33
)%
|
|
Portfolio turnover rate
|
|
18
%
|
|
19
%
|
|
32
%
|
|
11
%
|
|
5
%
|
|
(a)
|
Per share net investment income (loss) has been calculated using the average shares outstanding during the period.
|
|
(b)
|
Amount rounds to less than $0.01 per share.
|
|
(c)
|
A contingent deferred sales charge for Class C shares is not reflected in total return calculations.
|
|
(d)
|
Had certain expenses not been waived/reimbursed during the period, total returns would have been lower.
|
|
(e)
|
The investment adviser agreed to waive its fees and/or reimburse a portion of the Fund’s expenses during the period. Without this waiver/reimbursement, expenses would have been higher.
|
|
(f)
|
Effective July 1, 2021, the expense limit decreased from 1.95% to 1.68%.
|
|
(g)
|
Includes additional voluntary waiver of advisory fee of 0.02%.
|
|
|
Class N
|
|||||||||
|
|
Year Ended
December 31, 2025 |
Year Ended
December 31, 2024 |
Year Ended
December 31, 2023 |
Year Ended
December 31, 2022 |
Year Ended
December 31, 2021 |
|||||
|
Net asset value, beginning of the period
|
$
|
19.82
|
$
|
16.98
|
$
|
14.57
|
$
|
16.63
|
$
|
14.01
|
|
INCOME (LOSS) FROM INVESTMENT OPERATIONS:
|
|
|
|
|
|
|
|
|
|
|
|
Net investment income(a)
|
|
0.13
|
|
0.15
|
|
0.17
|
|
0.14
|
|
0.11
|
|
Net realized and unrealized gain (loss)
|
|
2.48
|
|
2.85
|
|
2.40
|
|
(2.05
)
|
|
2.61
|
|
Total from Investment Operations
|
|
2.61
|
|
3.00
|
|
2.57
|
|
(1.91
)
|
|
2.72
|
|
LESS DISTRIBUTIONS FROM:
|
|
|
|
|
|
|
|
|
|
|
|
Net investment income
|
|
(0.14
)
|
|
(0.16
)
|
|
(0.16
)
|
|
(0.15
)
|
|
(0.10
)
|
|
Net asset value, end of the period
|
$
|
22.29
|
$
|
19.82
|
$
|
16.98
|
$
|
14.57
|
$
|
16.63
|
|
Total return(b)
|
|
13.27
%
|
|
17.69
%
|
|
17.74
%
|
|
(11.51
)%
|
|
19.49
%
|
|
RATIOS TO AVERAGE NET ASSETS:
|
|
|
|
|
|
|
|
|
|
|
|
Net assets, end of the period (000’s)
|
$
|
208
|
$
|
309
|
$
|
255
|
$
|
219
|
$
|
437
|
|
Net expenses(c)
|
|
0.63
%
|
|
0.63
%
|
|
0.63
%
|
|
0.63
%
|
|
0.77
%
(d)
|
|
Gross expenses
|
|
1.07
%
|
|
1.05
%
|
|
1.28
%
|
|
1.23
%
|
|
1.08
%
|
|
Net investment income
|
|
0.63
%
|
|
0.82
%
|
|
1.08
%
|
|
0.95
%
|
|
0.70
%
|
|
Portfolio turnover rate
|
|
18
%
|
|
19
%
|
|
32
%
|
|
11
%
|
|
5
%
|
|
(a)
|
Per share net investment income has been calculated using the average shares outstanding during the period.
|
|
(b)
|
Had certain expenses not been waived/reimbursed during the period, total returns would have been lower.
|
|
(c)
|
The investment adviser agreed to waive its fees and/or reimburse a portion of the Fund’s expenses during the period. Without this waiver/reimbursement, expenses would have been higher.
|
|
(d)
|
Effective July 1, 2021, the expense limit decreased from 0.90% to 0.63%.
|
|
|
Class Y
|
|||||||||
|
|
Year Ended
December 31, 2025 |
Year Ended
December 31, 2024 |
Year Ended
December 31, 2023 |
Year Ended
December 31, 2022 |
Year Ended
December 31, 2021 |
|||||
|
Net asset value, beginning of the period
|
$
|
19.84
|
$
|
16.99
|
$
|
14.59
|
$
|
16.65
|
$
|
14.02
|
|
INCOME (LOSS) FROM INVESTMENT OPERATIONS:
|
|
|
|
|
|
|
|
|
|
|
|
Net investment income(a)
|
|
0.12
|
|
0.14
|
|
0.17
|
|
0.14
|
|
0.10
|
|
Net realized and unrealized gain (loss)
|
|
2.48
|
|
2.86
|
|
2.39
|
|
(2.06
)
|
|
2.63
|
|
Total from Investment Operations
|
|
2.60
|
|
3.00
|
|
2.56
|
|
(1.92
)
|
|
2.73
|
|
LESS DISTRIBUTIONS FROM:
|
|
|
|
|
|
|
|
|
|
|
|
Net investment income
|
|
(0.13
)
|
|
(0.15
)
|
|
(0.16
)
|
|
(0.14
)
|
|
(0.10
)
|
|
Net asset value, end of the period
|
$
|
22.31
|
$
|
19.84
|
$
|
16.99
|
$
|
14.59
|
$
|
16.65
|
|
Total return(b)
|
|
13.20
%
|
|
17.68
%
|
|
17.59
%
|
|
(11.48
)%
|
|
19.43
%
|
|
RATIOS TO AVERAGE NET ASSETS:
|
|
|
|
|
|
|
|
|
|
|
|
Net assets, end of the period (000’s)
|
$
|
296,829
|
$
|
243,477
|
$
|
267,033
|
$
|
136,629
|
$
|
102,004
|
|
Net expenses(c)
|
|
0.68
%
|
|
0.68
%
|
|
0.68
%
|
|
0.68
%
|
|
0.78
%
(d)(e)
|
|
Gross expenses
|
|
0.80
%
|
|
0.82
%
|
|
0.84
%
|
|
0.91
%
|
|
0.95
%
|
|
Net investment income
|
|
0.59
%
|
|
0.76
%
|
|
1.04
%
|
|
0.95
%
|
|
0.67
%
|
|
Portfolio turnover rate
|
|
18
%
|
|
19
%
|
|
32
%
|
|
11
%
|
|
5
%
|
|
(a)
|
Per share net investment income has been calculated using the average shares outstanding during the period.
|
|
(b)
|
Had certain expenses not been waived/reimbursed during the period, total returns would have been lower.
|
|
(c)
|
The investment adviser agreed to waive its fees and/or reimburse a portion of the Fund’s expenses during the period. Without this waiver/reimbursement, expenses would have been higher.
|
|
(d)
|
Effective July 1, 2021, the expense limit decreased from 0.95% to 0.68%.
|
|
(e)
|
Includes additional voluntary waiver of advisory fee of 0.02%.
|
|
|
Class A
|
|||||||||
|
|
Year Ended
December 31, 2025 |
Year Ended
December 31, 2024 |
Year Ended
December 31, 2023 |
Year Ended
December 31, 2022 |
Year Ended
December 31, 2021 |
|||||
|
Net asset value, beginning of the period
|
$
|
46.31
|
$
|
40.42
|
$
|
35.57
|
$
|
40.70
|
$
|
36.76
|
|
INCOME (LOSS) FROM INVESTMENT OPERATIONS:
|
|
|
|
|
|
|
|
|
|
|
|
Net investment income(a)
|
|
0.14
|
|
0.19
|
|
0.27
|
|
0.22
|
|
0.18
|
|
Net realized and unrealized gain (loss)
|
|
4.78
|
|
5.89
|
|
4.85
|
|
(5.13
)
|
|
3.93
|
|
Total from Investment Operations
|
|
4.92
|
|
6.08
|
|
5.12
|
|
(4.91
)
|
|
4.11
|
|
LESS DISTRIBUTIONS FROM:
|
|
|
|
|
|
|
|
|
|
|
|
Net investment income
|
|
(0.14
)
|
|
(0.19
)
|
|
(0.27
)
|
|
(0.22
)
|
|
(0.17
)
|
|
Net asset value, end of the period
|
$
|
51.09
|
$
|
46.31
|
$
|
40.42
|
$
|
35.57
|
$
|
40.70
|
|
Total return(b)(c)
|
|
10.59
%
|
|
15.08
%
|
|
14.43
%
|
|
(12.06
)%
|
|
11.24
%
|
|
RATIOS TO AVERAGE NET ASSETS:
|
|
|
|
|
|
|
|
|
|
|
|
Net assets, end of the period (000’s)
|
$
|
683,058
|
$
|
688,801
|
$
|
778,973
|
$
|
869,122
|
$
|
1,073,713
|
|
Net expenses(d)
|
|
0.94
%
(e)
|
|
0.94
%
(f)
|
|
0.94
%
(f)
|
|
0.93
%
(g)
|
|
0.94
%
(g)
|
|
Gross expenses
|
|
0.97
%
(e)
|
|
0.98
%
(f)
|
|
0.98
%
(f)
|
|
0.96
%
(g)
|
|
0.98
%
(g)
|
|
Net investment income
|
|
0.30
%
|
|
0.44
%
|
|
0.71
%
|
|
0.60
%
|
|
0.46
%
|
|
Portfolio turnover rate
|
|
17
%
|
|
12
%
|
|
18
%
|
|
16
%
|
|
11
%
|
|
(a)
|
Per share net investment income has been calculated using the average shares outstanding during the period.
|
|
(b)
|
A sales charge for Class A shares is not reflected in total return calculations.
|
|
(c)
|
Had certain expenses not been waived/reimbursed during the period, total returns would have been lower.
|
|
(d)
|
The investment adviser agreed to waive its fees and/or reimburse a portion of the Fund’s expenses during the period. Without this waiver/reimbursement, expenses would have been higher.
|
|
(e)
|
Includes refund of prior year service fee of less than 0.01%.
|
|
(f)
|
Includes refund of prior year service fee of less than 0.01%.
|
|
(g)
|
Includes refund of prior year service fee of 0.01%.
|
|
|
Class C
|
|||||||||
|
|
Year Ended
December 31, 2025 |
Year Ended
December 31, 2024 |
Year Ended
December 31, 2023 |
Year Ended
December 31, 2022 |
Year Ended
December 31, 2021 |
|||||
|
Net asset value, beginning of the period
|
$
|
45.70
|
$
|
40.02
|
$
|
35.26
|
$
|
40.41
|
$
|
36.60
|
|
INCOME (LOSS) FROM INVESTMENT OPERATIONS:
|
|
|
|
|
|
|
|
|
|
|
|
Net investment loss(a)
|
|
(0.22
)
|
|
(0.14
)
|
|
(0.02
)
|
|
(0.06
)
|
|
(0.11
)
|
|
Net realized and unrealized gain (loss)
|
|
4.69
|
|
5.83
|
|
4.80
|
|
(5.09
)
|
|
3.92
|
|
Total from Investment Operations
|
|
4.47
|
|
5.69
|
|
4.78
|
|
(5.15
)
|
|
3.81
|
|
LESS DISTRIBUTIONS FROM:
|
|
|
|
|
|
|
|
|
|
|
|
Net investment income
|
|
(0.00
)
(b)
|
|
(0.01
)
|
|
(0.02
)
|
|
—
|
|
—
|
|
Net asset value, end of the period
|
$
|
50.17
|
$
|
45.70
|
$
|
40.02
|
$
|
35.26
|
$
|
40.41
|
|
Total return(c)(d)
|
|
9.72
%
|
|
14.22
%
|
|
13.56
%
|
|
(12.74
)%
|
|
10.41
%
|
|
RATIOS TO AVERAGE NET ASSETS:
|
|
|
|
|
|
|
|
|
|
|
|
Net assets, end of the period (000’s)
|
$
|
40,593
|
$
|
50,388
|
$
|
61,730
|
$
|
77,355
|
$
|
114,019
|
|
Net expenses(e)
|
|
1.70
%
|
|
1.70
%
|
|
1.70
%
|
|
1.70
%
|
|
1.70
%
|
|
Gross expenses
|
|
1.73
%
|
|
1.73
%
|
|
1.73
%
|
|
1.71
%
|
|
1.73
%
|
|
Net investment loss
|
|
(0.46
)%
|
|
(0.32
)%
|
|
(0.06
)%
|
|
(0.17
)%
|
|
(0.30
)%
|
|
Portfolio turnover rate
|
|
17
%
|
|
12
%
|
|
18
%
|
|
16
%
|
|
11
%
|
|
(a)
|
Per share net investment loss has been calculated using the average shares outstanding during the period.
|
|
(b)
|
Amount rounds to less than $0.01 per share.
|
|
(c)
|
A contingent deferred sales charge for Class C shares is not reflected in total return calculations.
|
|
(d)
|
Had certain expenses not been waived/reimbursed during the period, total returns would have been lower.
|
|
(e)
|
The investment adviser agreed to waive its fees and/or reimburse a portion of the Fund’s expenses during the period. Without this waiver/reimbursement, expenses would have been higher.
|
|
|
Class N
|
|||||||||
|
|
Year Ended
December 31, 2025 |
Year Ended
December 31, 2024 |
Year Ended
December 31, 2023 |
Year Ended
December 31, 2022 |
Year Ended
December 31, 2021 |
|||||
|
Net asset value, beginning of the period
|
$
|
46.27
|
$
|
40.39
|
$
|
35.55
|
$
|
40.68
|
$
|
36.74
|
|
INCOME (LOSS) FROM INVESTMENT OPERATIONS:
|
|
|
|
|
|
|
|
|
|
|
|
Net investment income(a)
|
|
0.28
|
|
0.32
|
|
0.39
|
|
0.33
|
|
0.29
|
|
Net realized and unrealized gain (loss)
|
|
4.77
|
|
5.88
|
|
4.83
|
|
(5.13
)
|
|
3.94
|
|
Total from Investment Operations
|
|
5.05
|
|
6.20
|
|
5.22
|
|
(4.80
)
|
|
4.23
|
|
LESS DISTRIBUTIONS FROM:
|
|
|
|
|
|
|
|
|
|
|
|
Net investment income
|
|
(0.28
)
|
|
(0.32
)
|
|
(0.38
)
|
|
(0.33
)
|
|
(0.29
)
|
|
Net asset value, end of the period
|
$
|
51.04
|
$
|
46.27
|
$
|
40.39
|
$
|
35.55
|
$
|
40.68
|
|
Total return
|
|
10.89
%
|
|
15.40
%
(b)
|
|
14.75
%
(b)
|
|
(11.80
)%
|
|
11.57
%
(b)
|
|
RATIOS TO AVERAGE NET ASSETS:
|
|
|
|
|
|
|
|
|
|
|
|
Net assets, end of the period (000’s)
|
$
|
484,162
|
$
|
416,799
|
$
|
540,446
|
$
|
378,377
|
$
|
504,299
|
|
Net expenses
|
|
0.65
%
|
|
0.65
%
(c)
|
|
0.65
%
(c)
|
|
0.65
%
|
|
0.65
%
(c)
|
|
Gross expenses
|
|
0.65
%
|
|
0.66
%
|
|
0.66
%
|
|
0.65
%
|
|
0.67
%
|
|
Net investment income
|
|
0.59
%
|
|
0.74
%
|
|
1.00
%
|
|
0.88
%
|
|
0.74
%
|
|
Portfolio turnover rate
|
|
17
%
|
|
12
%
|
|
18
%
|
|
16
%
|
|
11
%
|
|
(a)
|
Per share net investment income has been calculated using the average shares outstanding during the period.
|
|
(b)
|
Had certain expenses not been waived/reimbursed during the period, total returns would have been lower.
|
|
(c)
|
The investment adviser agreed to waive its fees and/or reimburse a portion of the Fund’s expenses during the period. Without this waiver/reimbursement, expenses would have been higher.
|
|
|
Class Y
|
|||||||||
|
|
Year Ended
December 31, 2025 |
Year Ended
December 31, 2024 |
Year Ended
December 31, 2023 |
Year Ended
December 31, 2022 |
Year Ended
December 31, 2021 |
|||||
|
Net asset value, beginning of the period
|
$
|
46.27
|
$
|
40.38
|
$
|
35.54
|
$
|
40.67
|
$
|
36.73
|
|
INCOME (LOSS) FROM INVESTMENT OPERATIONS:
|
|
|
|
|
|
|
|
|
|
|
|
Net investment income(a)
|
|
0.26
|
|
0.29
|
|
0.36
|
|
0.31
|
|
0.27
|
|
Net realized and unrealized gain (loss)
|
|
4.76
|
|
5.90
|
|
4.84
|
|
(5.13
)
|
|
3.94
|
|
Total from Investment Operations
|
|
5.02
|
|
6.19
|
|
5.20
|
|
(4.82
)
|
|
4.21
|
|
LESS DISTRIBUTIONS FROM:
|
|
|
|
|
|
|
|
|
|
|
|
Net investment income
|
|
(0.26
)
|
|
(0.30
)
|
|
(0.36
)
|
|
(0.31
)
|
|
(0.27
)
|
|
Net asset value, end of the period
|
$
|
51.03
|
$
|
46.27
|
$
|
40.38
|
$
|
35.54
|
$
|
40.67
|
|
Total return(b)
|
|
10.84
%
|
|
15.37
%
|
|
14.70
%
|
|
(11.85
)%
|
|
11.49
%
|
|
RATIOS TO AVERAGE NET ASSETS:
|
|
|
|
|
|
|
|
|
|
|
|
Net assets, end of the period (000’s)
|
$
|
5,935,682
|
$
|
5,646,527
|
$
|
5,071,145
|
$
|
5,013,186
|
$
|
6,492,511
|
|
Net expenses(c)
|
|
0.70
%
|
|
0.70
%
|
|
0.70
%
|
|
0.70
%
|
|
0.70
%
|
|
Gross expenses
|
|
0.73
%
|
|
0.73
%
|
|
0.73
%
|
|
0.71
%
|
|
0.73
%
|
|
Net investment income
|
|
0.54
%
|
|
0.67
%
|
|
0.94
%
|
|
0.83
%
|
|
0.70
%
|
|
Portfolio turnover rate
|
|
17
%
|
|
12
%
|
|
18
%
|
|
16
%
|
|
11
%
|
|
(a)
|
Per share net investment income has been calculated using the average shares outstanding during the period.
|
|
(b)
|
Had certain expenses not been waived/reimbursed during the period, total returns would have been lower.
|
|
(c)
|
The investment adviser agreed to waive its fees and/or reimburse a portion of the Fund’s expenses during the period. Without this waiver/reimbursement, expenses would have been higher.
|
|
|
Class A
|
|||||||||
|
|
Year Ended
December 31, 2025 |
Year Ended
December 31, 2024 |
Year Ended
December 31, 2023 |
Year Ended
December 31, 2022 |
Year Ended
December 31, 2021 |
|||||
|
Net asset value, beginning of the period
|
$
|
19.89
|
$
|
17.94
|
$
|
15.22
|
$
|
20.53
|
$
|
19.57
|
|
INCOME (LOSS) FROM INVESTMENT OPERATIONS:
|
|
|
|
|
|
|
|
|
|
|
|
Net investment income (loss)(a)
|
|
0.02
|
|
0.01
|
|
0.06
|
|
0.08
|
|
(0.01
)
|
|
Net realized and unrealized gain (loss)
|
|
2.90
|
|
2.30
|
|
2.73
|
|
(4.62
)
|
|
3.45
|
|
Total from Investment Operations
|
|
2.92
|
|
2.31
|
|
2.79
|
|
(4.54
)
|
|
3.44
|
|
LESS DISTRIBUTIONS FROM:
|
|
|
|
|
|
|
|
|
|
|
|
Net investment income
|
|
(0.03
)
|
|
(0.03
)
|
|
(0.07
)
|
|
(0.07
)
|
|
(0.00
)
(b)
|
|
Net realized capital gains
|
|
(0.90
)
|
|
(0.33
)
|
|
—
|
|
(0.70
)
|
|
(2.48
)
|
|
Total Distributions
|
|
(0.93
)
|
|
(0.36
)
|
|
(0.07
)
|
|
(0.77
)
|
|
(2.48
)
|
|
Net asset value, end of the period
|
$
|
21.88
|
$
|
19.89
|
$
|
17.94
|
$
|
15.22
|
$
|
20.53
|
|
Total return(c)(d)
|
|
15.00
%
|
|
12.83
%
|
|
18.32
%
|
|
(22.56
)%
|
|
17.82
%
|
|
RATIOS TO AVERAGE NET ASSETS:
|
|
|
|
|
|
|
|
|
|
|
|
Net assets, end of the period (000’s)
|
$
|
36,419
|
$
|
35,416
|
$
|
30,525
|
$
|
29,013
|
$
|
43,117
|
|
Net expenses(e)
|
|
1.20
%
|
|
1.20
%
|
|
1.20
%
|
|
1.20
%
(f)
|
|
1.21
%
(g)
|
|
Gross expenses
|
|
1.26
%
|
|
1.24
%
|
|
1.24
%
|
|
1.26
%
(f)
|
|
1.24
%
(g)
|
|
Net investment income (loss)
|
|
0.09
%
|
|
0.05
%
|
|
0.37
%
|
|
0.51
%
|
|
(0.03
)%
|
|
Portfolio turnover rate
|
|
21
%
|
|
18
%
|
|
23
%
|
|
23
%
|
|
40
%
|
|
(a)
|
Per share net investment income (loss) has been calculated using the average shares outstanding during the period.
|
|
(b)
|
Amount rounds to less than $0.01 per share.
|
|
(c)
|
A sales charge for Class A shares is not reflected in total return calculations.
|
|
(d)
|
Had certain expenses not been waived/reimbursed during the period, total returns would have been lower.
|
|
(e)
|
The investment adviser agreed to waive its fees and/or reimburse a portion of the Fund’s expenses during the period. Without this waiver/reimbursement, expenses would have been higher.
|
|
(f)
|
Includes interest expense. Without this expense the ratio of net expenses would have been 1.20% and the ratio of gross expenses would have been 1.25%.
|
|
(g)
|
Includes interest expense. Without this expense the ratio of net expenses would have been 1.20% and the ratio of gross expenses would have been 1.24%.
|
|
|
Class C
|
|||||||||
|
|
Year Ended
December 31, 2025 |
Year Ended
December 31, 2024 |
Year Ended
December 31, 2023 |
Year Ended
December 31, 2022 |
Year Ended
December 31, 2021 |
|||||
|
Net asset value, beginning of the period
|
$
|
18.70
|
$
|
16.99
|
$
|
14.48
|
$
|
19.62
|
$
|
18.95
|
|
INCOME (LOSS) FROM INVESTMENT OPERATIONS:
|
|
|
|
|
|
|
|
|
|
|
|
Net investment loss(a)
|
|
(0.12
)
|
|
(0.13
)
|
|
(0.06
)
|
|
(0.04
)
|
|
(0.16
)
|
|
Net realized and unrealized gain (loss)
|
|
2.70
|
|
2.18
|
|
2.58
|
|
(4.40
)
|
|
3.31
|
|
Total from Investment Operations
|
|
2.58
|
|
2.05
|
|
2.52
|
|
(4.44
)
|
|
3.15
|
|
LESS DISTRIBUTIONS FROM:
|
|
|
|
|
|
|
|
|
|
|
|
Net investment income
|
|
—
|
|
(0.01
)
|
|
(0.01
)
|
|
—
|
|
(0.00
)
(b)
|
|
Net realized capital gains
|
|
(0.90
)
|
|
(0.33
)
|
|
—
|
|
(0.70
)
|
|
(2.48
)
|
|
Total Distributions
|
|
(0.90
)
|
|
(0.34
)
|
|
(0.01
)
|
|
(0.70
)
|
|
(2.48
)
|
|
Net asset value, end of the period
|
$
|
20.38
|
$
|
18.70
|
$
|
16.99
|
$
|
14.48
|
$
|
19.62
|
|
Total return(c)(d)
|
|
14.17
%
|
|
11.99
%
|
|
17.41
%
|
|
(23.11
)%
|
|
16.85
%
|
|
RATIOS TO AVERAGE NET ASSETS:
|
|
|
|
|
|
|
|
|
|
|
|
Net assets, end of the period (000’s)
|
$
|
6,807
|
$
|
9,305
|
$
|
10,786
|
$
|
11,441
|
$
|
17,248
|
|
Net expenses(e)
|
|
1.95
%
|
|
1.95
%
|
|
1.95
%
|
|
1.95
%
(f)
|
|
1.96
%
(g)
|
|
Gross expenses
|
|
2.01
%
|
|
1.99
%
|
|
1.99
%
|
|
2.01
%
(f)
|
|
1.99
%
(g)
|
|
Net investment loss
|
|
(0.64
)%
|
|
(0.70
)%
|
|
(0.38
)%
|
|
(0.23
)%
|
|
(0.79
)%
|
|
Portfolio turnover rate
|
|
21
%
|
|
18
%
|
|
23
%
|
|
23
%
|
|
40
%
|
|
(a)
|
Per share net investment loss has been calculated using the average shares outstanding during the period.
|
|
(b)
|
Amount rounds to less than $0.01 per share.
|
|
(c)
|
A contingent deferred sales charge for Class C shares is not reflected in total return calculations.
|
|
(d)
|
Had certain expenses not been waived/reimbursed during the period, total returns would have been lower.
|
|
(e)
|
The investment adviser agreed to waive its fees and/or reimburse a portion of the Fund’s expenses during the period. Without this waiver/reimbursement, expenses would have been higher.
|
|
(f)
|
Includes interest expense. Without this expense the ratio of net expenses would have been 1.95% and the ratio of gross expenses would have been 2.00%.
|
|
(g)
|
Includes interest expense. Without this expense the ratio of net expenses would have been 1.95% and the ratio of gross expenses would have been 1.99%.
|
|
|
Class N
|
|||||||||
|
|
Year Ended
December 31, 2025 |
Year Ended
December 31, 2024 |
Year Ended
December 31, 2023 |
Year Ended
December 31, 2022 |
Year Ended
December 31, 2021 |
|||||
|
Net asset value, beginning of the period
|
$
|
20.08
|
$
|
18.11
|
$
|
15.36
|
$
|
20.72
|
$
|
19.71
|
|
INCOME (LOSS) FROM INVESTMENT OPERATIONS:
|
|
|
|
|
|
|
|
|
|
|
|
Net investment income(a)
|
|
0.09
|
|
0.07
|
|
0.11
|
|
0.13
|
|
0.05
|
|
Net realized and unrealized gain (loss)
|
|
2.93
|
|
2.32
|
|
2.76
|
|
(4.67
)
|
|
3.49
|
|
Total from Investment Operations
|
|
3.02
|
|
2.39
|
|
2.87
|
|
(4.54
)
|
|
3.54
|
|
LESS DISTRIBUTIONS FROM:
|
|
|
|
|
|
|
|
|
|
|
|
Net investment income
|
|
(0.10
)
|
|
(0.09
)
|
|
(0.12
)
|
|
(0.12
)
|
|
(0.05
)
|
|
Net realized capital gains
|
|
(0.90
)
|
|
(0.33
)
|
|
—
|
|
(0.70
)
|
|
(2.48
)
|
|
Total Distributions
|
|
(1.00
)
|
|
(0.42
)
|
|
(0.12
)
|
|
(0.82
)
|
|
(2.53
)
|
|
Net asset value, end of the period
|
$
|
22.10
|
$
|
20.08
|
$
|
18.11
|
$
|
15.36
|
$
|
20.72
|
|
Total return
|
|
15.38
%
(b)
|
|
13.15
%
|
|
18.70
%
|
|
(22.32
)%
|
|
18.17
%
|
|
RATIOS TO AVERAGE NET ASSETS:
|
|
|
|
|
|
|
|
|
|
|
|
Net assets, end of the period (000’s)
|
$
|
139,265
|
$
|
285,343
|
$
|
239,009
|
$
|
189,957
|
$
|
219,679
|
|
Net expenses
|
|
0.89
%
(c)
|
|
0.89
%
|
|
0.89
%
|
|
0.90
%
(d)
|
|
0.91
%
(e)(f)
|
|
Gross expenses
|
|
0.90
%
|
|
0.89
%
|
|
0.89
%
|
|
0.90
%
(d)
|
|
0.91
%
(e)(f)
|
|
Net investment income
|
|
0.44
%
|
|
0.36
%
|
|
0.64
%
|
|
0.81
%
|
|
0.24
%
|
|
Portfolio turnover rate
|
|
21
%
|
|
18
%
|
|
23
%
|
|
23
%
|
|
40
%
|
|
(a)
|
Per share net investment income has been calculated using the average shares outstanding during the period.
|
|
(b)
|
Had certain expenses not been waived/reimbursed during the period, total returns would have been lower.
|
|
(c)
|
The investment adviser agreed to waive its fees and/or reimburse a portion of the Fund’s expenses during the period. Without this waiver/reimbursement, expenses would have been higher.
|
|
(d)
|
Includes interest expense. Without this expense the ratio of net expenses would have been 0.89% and the ratio of gross expenses would have been 0.89%.
|
|
(e)
|
Includes interest expense. Without this expense the ratio of net expenses would have been 0.90% and the ratio of gross expenses would have been 0.90%.
|
|
(f)
|
Includes fee/expense recovery of 0.01%.
|
|
|
Class Y
|
|||||||||
|
|
Year Ended
December 31, 2025 |
Year Ended
December 31, 2024 |
Year Ended
December 31, 2023 |
Year Ended
December 31, 2022 |
Year Ended
December 31, 2021 |
|||||
|
Net asset value, beginning of the period
|
$
|
20.08
|
$
|
18.11
|
$
|
15.36
|
$
|
20.71
|
$
|
19.71
|
|
INCOME (LOSS) FROM INVESTMENT OPERATIONS:
|
|
|
|
|
|
|
|
|
|
|
|
Net investment income(a)
|
|
0.07
|
|
0.07
|
|
0.11
|
|
0.12
|
|
0.05
|
|
Net realized and unrealized gain (loss)
|
|
2.93
|
|
2.31
|
|
2.75
|
|
(4.66
)
|
|
3.46
|
|
Total from Investment Operations
|
|
3.00
|
|
2.38
|
|
2.86
|
|
(4.54
)
|
|
3.51
|
|
LESS DISTRIBUTIONS FROM:
|
|
|
|
|
|
|
|
|
|
|
|
Net investment income
|
|
(0.08
)
|
|
(0.08
)
|
|
(0.11
)
|
|
(0.11
)
|
|
(0.03
)
|
|
Net realized capital gains
|
|
(0.90
)
|
|
(0.33
)
|
|
—
|
|
(0.70
)
|
|
(2.48
)
|
|
Total Distributions
|
|
(0.98
)
|
|
(0.41
)
|
|
(0.11
)
|
|
(0.81
)
|
|
(2.51
)
|
|
Net asset value, end of the period
|
$
|
22.10
|
$
|
20.08
|
$
|
18.11
|
$
|
15.36
|
$
|
20.71
|
|
Total return(b)
|
|
15.32
%
|
|
13.06
%
|
|
18.63
%
|
|
(22.33
)%
|
|
18.06
%
|
|
RATIOS TO AVERAGE NET ASSETS:
|
|
|
|
|
|
|
|
|
|
|
|
Net assets, end of the period (000’s)
|
$
|
664,906
|
$
|
644,038
|
$
|
753,396
|
$
|
637,021
|
$
|
840,638
|
|
Net expenses(c)
|
|
0.95
%
|
|
0.95
%
|
|
0.95
%
|
|
0.95
%
(d)
|
|
0.96
%
(e)
|
|
Gross expenses
|
|
1.01
%
|
|
0.99
%
|
|
0.99
%
|
|
1.01
%
(d)
|
|
0.99
%
(e)
|
|
Net investment income
|
|
0.33
%
|
|
0.32
%
|
|
0.63
%
|
|
0.76
%
|
|
0.22
%
|
|
Portfolio turnover rate
|
|
21
%
|
|
18
%
|
|
23
%
|
|
23
%
|
|
40
%
|
|
(a)
|
Per share net investment income has been calculated using the average shares outstanding during the period.
|
|
(b)
|
Had certain expenses not been waived/reimbursed during the period, total returns would have been lower.
|
|
(c)
|
The investment adviser agreed to waive its fees and/or reimburse a portion of the Fund’s expenses during the period. Without this waiver/reimbursement, expenses would have been higher.
|
|
(d)
|
Includes interest expense. Without this expense the ratio of net expenses would have been 0.95% and the ratio of gross expenses would have been 1.00%.
|
|
(e)
|
Includes interest expense. Without this expense the ratio of net expenses would have been 0.95% and the ratio of gross expenses would have been 0.99%.
|
|
|
Class A
|
|||||||||
|
|
Year Ended
December 31, 2025 |
Year Ended
December 31, 2024 |
Year Ended
December 31, 2023 |
Year Ended
December 31, 2022 |
Year Ended
December 31, 2021 |
|||||
|
Net asset value, beginning of the period
|
$
|
24.04
|
$
|
22.76
|
$
|
19.64
|
$
|
22.70
|
$
|
21.79
|
|
INCOME (LOSS) FROM INVESTMENT OPERATIONS:
|
|
|
|
|
|
|
|
|
|
|
|
Net investment income (loss)(a)
|
|
0.01
|
|
(0.01
)
|
|
0.05
|
|
0.11
|
|
0.05
|
|
Net realized and unrealized gain (loss)
|
|
2.84
|
|
4.22
|
|
3.14
|
|
(2.53
)
|
|
4.52
|
|
Total from Investment Operations
|
|
2.85
|
|
4.21
|
|
3.19
|
|
(2.42
)
|
|
4.57
|
|
LESS DISTRIBUTIONS FROM:
|
|
|
|
|
|
|
|
|
|
|
|
Net investment income
|
|
(0.02
)
|
|
(0.00
)
(b)
|
|
(0.07
)
|
|
(0.13
)
|
|
(0.04
)
|
|
Net realized capital gains
|
|
(8.51
)
|
|
(2.93
)
|
|
—
|
|
(0.51
)
|
|
(3.62
)
|
|
Total Distributions
|
|
(8.53
)
|
|
(2.93
)
|
|
(0.07
)
|
|
(0.64
)
|
|
(3.66
)
|
|
Net asset value, end of the period
|
$
|
18.36
|
$
|
24.04
|
$
|
22.76
|
$
|
19.64
|
$
|
22.70
|
|
Total return(c)(d)
|
|
12.14
%
|
|
18.36
%
|
|
16.26
%
|
|
(10.80
)%
|
|
21.32
%
|
|
RATIOS TO AVERAGE NET ASSETS:
|
|
|
|
|
|
|
|
|
|
|
|
Net assets, end of the period (000’s)
|
$
|
38,972
|
$
|
42,321
|
$
|
38,864
|
$
|
33,507
|
$
|
37,849
|
|
Net expenses(e)
|
|
1.15
%
|
|
1.15
%
|
|
1.15
%
|
|
1.15
%
|
|
1.17
%
(f)
|
|
Gross expenses
|
|
1.27
%
|
|
1.26
%
|
|
1.25
%
|
|
1.21
%
|
|
1.23
%
|
|
Net investment income (loss)
|
|
0.05
%
|
|
(0.05
)%
|
|
0.25
%
|
|
0.55
%
|
|
0.22
%
|
|
Portfolio turnover rate
|
|
163
%
|
|
109
%
|
|
94
%
|
|
53
%
|
|
71
%
|
|
(a)
|
Per share net investment income (loss) has been calculated using the average shares outstanding during the period.
|
|
(b)
|
Amount rounds to less than $0.01 per share.
|
|
(c)
|
A sales charge for Class A shares is not reflected in total return calculations.
|
|
(d)
|
Had certain expenses not been waived/reimbursed during the period, total returns would have been lower.
|
|
(e)
|
The investment adviser agreed to waive its fees and/or reimburse a portion of the Fund’s expenses during the period. Without this waiver/reimbursement, expenses would have been higher.
|
|
(f)
|
Effective July 1, 2021, the expense limit decreased from 1.20% to 1.15%.
|
|
|
Class C
|
|||||||||
|
|
Year Ended
December 31, 2025 |
Year Ended
December 31, 2024 |
Year Ended
December 31, 2023 |
Year Ended
December 31, 2022 |
Year Ended
December 31, 2021 |
|||||
|
Net asset value, beginning of the period
|
$
|
21.16
|
$
|
20.48
|
$
|
17.75
|
$
|
20.58
|
$
|
20.15
|
|
INCOME (LOSS) FROM INVESTMENT OPERATIONS:
|
|
|
|
|
|
|
|
|
|
|
|
Net investment loss(a)
|
|
(0.15
)
|
|
(0.18
)
|
|
(0.10
)
|
|
(0.04
)
|
|
(0.13
)
|
|
Net realized and unrealized gain (loss)
|
|
2.48
|
|
3.79
|
|
2.83
|
|
(2.28
)
|
|
4.18
|
|
Total from Investment Operations
|
|
2.33
|
|
3.61
|
|
2.73
|
|
(2.32
)
|
|
4.05
|
|
LESS DISTRIBUTIONS FROM:
|
|
|
|
|
|
|
|
|
|
|
|
Net investment income
|
|
(0.02
)
|
|
(0.00
)
(b)
|
|
—
|
|
—
|
|
(0.00
)
(b)
|
|
Net realized capital gains
|
|
(8.51
)
|
|
(2.93
)
|
|
—
|
|
(0.51
)
|
|
(3.62
)
|
|
Total Distributions
|
|
(8.53
)
|
|
(2.93
)
|
|
—
|
|
(0.51
)
|
|
(3.62
)
|
|
Net asset value, end of the period
|
$
|
14.96
|
$
|
21.16
|
$
|
20.48
|
$
|
17.75
|
$
|
20.58
|
|
Total return(c)(d)
|
|
11.30
%
|
|
17.47
%
|
|
15.38
%
|
|
(11.46
)%
|
|
20.44
%
|
|
RATIOS TO AVERAGE NET ASSETS:
|
|
|
|
|
|
|
|
|
|
|
|
Net assets, end of the period (000’s)
|
$
|
2,417
|
$
|
2,426
|
$
|
3,650
|
$
|
7,405
|
$
|
11,436
|
|
Net expenses(e)
|
|
1.90
%
|
|
1.90
%
|
|
1.90
%
|
|
1.90
%
|
|
1.93
%
(f)
|
|
Gross expenses
|
|
2.02
%
|
|
2.01
%
|
|
2.00
%
|
|
1.96
%
|
|
1.98
%
|
|
Net investment loss
|
|
(0.70
)%
|
|
(0.82
)%
|
|
(0.55
)%
|
|
(0.22
)%
|
|
(0.56
)%
|
|
Portfolio turnover rate
|
|
163
%
|
|
109
%
|
|
94
%
|
|
53
%
|
|
71
%
|
|
(a)
|
Per share net investment loss has been calculated using the average shares outstanding during the period.
|
|
(b)
|
Amount rounds to less than $0.01 per share.
|
|
(c)
|
A contingent deferred sales charge for Class C shares is not reflected in total return calculations.
|
|
(d)
|
Had certain expenses not been waived/reimbursed during the period, total returns would have been lower.
|
|
(e)
|
The investment adviser agreed to waive its fees and/or reimburse a portion of the Fund’s expenses during the period. Without this waiver/reimbursement, expenses would have been higher.
|
|
(f)
|
Effective July 1, 2021, the expense limit decreased from 1.95% to 1.90%.
|
|
|
Class N
|
|||||||||
|
|
Year Ended
December 31, 2025 |
Year Ended
December 31, 2024 |
Year Ended
December 31, 2023 |
Year Ended
December 31, 2022 |
Year Ended
December 31, 2021 |
|||||
|
Net asset value, beginning of the period
|
$
|
24.56
|
$
|
23.12
|
$
|
19.95
|
$
|
23.05
|
$
|
22.07
|
|
INCOME (LOSS) FROM INVESTMENT OPERATIONS:
|
|
|
|
|
|
|
|
|
|
|
|
Net investment income(a)
|
|
0.09
|
|
0.06
|
|
0.11
|
|
0.17
|
|
0.14
|
|
Net realized and unrealized gain (loss)
|
|
2.90
|
|
4.31
|
|
3.19
|
|
(2.57
)
|
|
4.58
|
|
Total from Investment Operations
|
|
2.99
|
|
4.37
|
|
3.30
|
|
(2.40
)
|
|
4.72
|
|
LESS DISTRIBUTIONS FROM:
|
|
|
|
|
|
|
|
|
|
|
|
Net investment income
|
|
(0.09
)
|
|
(0.00
)
(b)
|
|
(0.13
)
|
|
(0.19
)
|
|
(0.12
)
|
|
Net realized capital gains
|
|
(8.51
)
|
|
(2.93
)
|
|
—
|
|
(0.51
)
|
|
(3.62
)
|
|
Total Distributions
|
|
(8.60
)
|
|
(2.93
)
|
|
(0.13
)
|
|
(0.70
)
|
|
(3.74
)
|
|
Net asset value, end of the period
|
$
|
18.95
|
$
|
24.56
|
$
|
23.12
|
$
|
19.95
|
$
|
23.05
|
|
Total return(c)
|
|
12.44
%
|
|
18.77
%
|
|
16.56
%
|
|
(10.54
)%
|
|
21.70
%
|
|
RATIOS TO AVERAGE NET ASSETS:
|
|
|
|
|
|
|
|
|
|
|
|
Net assets, end of the period (000’s)
|
$
|
10,869
|
$
|
52,213
|
$
|
63,894
|
$
|
72,804
|
$
|
91,416
|
|
Net expenses(d)
|
|
0.85
%
|
|
0.85
%
|
|
0.85
%
|
|
0.85
%
|
|
0.86
%
(e)
|
|
Gross expenses
|
|
0.92
%
|
|
0.91
%
|
|
0.90
%
|
|
0.87
%
|
|
0.89
%
|
|
Net investment income
|
|
0.36
%
|
|
0.23
%
|
|
0.55
%
|
|
0.84
%
|
|
0.55
%
|
|
Portfolio turnover rate
|
|
163
%
|
|
109
%
|
|
94
%
|
|
53
%
|
|
71
%
|
|
(a)
|
Per share net investment income has been calculated using the average shares outstanding during the period.
|
|
(b)
|
Amount rounds to less than $0.01 per share.
|
|
(c)
|
Had certain expenses not been waived/reimbursed during the period, total returns would have been lower.
|
|
(d)
|
The investment adviser agreed to waive its fees and/or reimburse a portion of the Fund’s expenses during the period. Without this waiver/reimbursement, expenses would have been higher.
|
|
(e)
|
Effective July 1, 2021, the expense limit decreased from 0.90% to 0.85%.
|
|
|
Class Y
|
|||||||||
|
|
Year Ended
December 31, 2025 |
Year Ended
December 31, 2024 |
Year Ended
December 31, 2023 |
Year Ended
December 31, 2022 |
Year Ended
December 31, 2021 |
|||||
|
Net asset value, beginning of the period
|
$
|
24.60
|
$
|
23.17
|
$
|
19.99
|
$
|
23.09
|
$
|
22.10
|
|
INCOME (LOSS) FROM INVESTMENT OPERATIONS:
|
|
|
|
|
|
|
|
|
|
|
|
Net investment income(a)
|
|
0.07
|
|
0.05
|
|
0.10
|
|
0.16
|
|
0.11
|
|
Net realized and unrealized gain (loss)
|
|
2.91
|
|
4.31
|
|
3.20
|
|
(2.57
)
|
|
4.60
|
|
Total from Investment Operations
|
|
2.98
|
|
4.36
|
|
3.30
|
|
(2.41
)
|
|
4.71
|
|
LESS DISTRIBUTIONS FROM:
|
|
|
|
|
|
|
|
|
|
|
|
Net investment income
|
|
(0.07
)
|
|
(0.00
)
(b)
|
|
(0.12
)
|
|
(0.18
)
|
|
(0.10
)
|
|
Net realized capital gains
|
|
(8.51
)
|
|
(2.93
)
|
|
—
|
|
(0.51
)
|
|
(3.62
)
|
|
Total Distributions
|
|
(8.58
)
|
|
(2.93
)
|
|
(0.12
)
|
|
(0.69
)
|
|
(3.72
)
|
|
Net asset value, end of the period
|
$
|
19.00
|
$
|
24.60
|
$
|
23.17
|
$
|
19.99
|
$
|
23.09
|
|
Total return(c)
|
|
12.39
%
|
|
18.69
%
|
|
16.52
%
|
|
(10.58
)%
|
|
21.65
%
|
|
RATIOS TO AVERAGE NET ASSETS:
|
|
|
|
|
|
|
|
|
|
|
|
Net assets, end of the period (000’s)
|
$
|
102,858
|
$
|
146,248
|
$
|
144,247
|
$
|
148,505
|
$
|
226,838
|
|
Net expenses(d)
|
|
0.90
%
|
|
0.90
%
|
|
0.90
%
|
|
0.90
%
|
|
0.93
%
(e)
|
|
Gross expenses
|
|
1.02
%
|
|
1.01
%
|
|
1.00
%
|
|
0.96
%
|
|
0.98
%
|
|
Net investment income
|
|
0.30
%
|
|
0.20
%
|
|
0.49
%
|
|
0.78
%
|
|
0.45
%
|
|
Portfolio turnover rate
|
|
163
%
|
|
109
%
|
|
94
%
|
|
53
%
|
|
71
%
|
|
(a)
|
Per share net investment income has been calculated using the average shares outstanding during the period.
|
|
(b)
|
Amount rounds to less than $0.01 per share.
|
|
(c)
|
Had certain expenses not been waived/reimbursed during the period, total returns would have been lower.
|
|
(d)
|
The investment adviser agreed to waive its fees and/or reimburse a portion of the Fund’s expenses during the period. Without this waiver/reimbursement, expenses would have been higher.
|
|
(e)
|
Effective July 1, 2021, the expense limit decreased from 0.95% to 0.90%.
|
|
|
Class A
|
|||||||||
|
|
Year Ended
December 31, 2025 |
Year Ended
December 31, 2024 |
Year Ended
December 31, 2023 |
Year Ended
December 31, 2022 |
Year Ended
December 31, 2021 |
|||||
|
Net asset value, beginning of the period
|
$
|
19.51
|
$
|
18.88
|
$
|
15.17
|
$
|
17.87
|
$
|
16.69
|
|
INCOME (LOSS) FROM INVESTMENT OPERATIONS:
|
|
|
|
|
|
|
|
|
|
|
|
Net investment income (loss)(a)
|
|
0.13
|
|
0.16
|
|
0.09
|
|
(0.02
)
|
|
0.00
(b)(c)
|
|
Net realized and unrealized gain (loss)
|
|
2.21
|
|
0.75
|
|
3.67
|
|
(1.78
)
|
|
4.98
|
|
Total from Investment Operations
|
|
2.34
|
|
0.91
|
|
3.76
|
|
(1.80
)
|
|
4.98
|
|
LESS DISTRIBUTIONS FROM:
|
|
|
|
|
|
|
|
|
|
|
|
Net investment income
|
|
(0.16
)
|
|
(0.14
)
|
|
(0.05
)
|
|
—
|
|
(0.01
)
|
|
Net realized capital gains
|
|
(1.04
)
|
|
(0.14
)
|
|
—
|
|
(0.90
)
|
|
(3.79
)
|
|
Total Distributions
|
|
(1.20
)
|
|
(0.28
)
|
|
(0.05
)
|
|
(0.90
)
|
|
(3.80
)
|
|
Net asset value, end of the period
|
$
|
20.65
|
$
|
19.51
|
$
|
18.88
|
$
|
15.17
|
$
|
17.87
|
|
Total return(d)(e)
|
|
11.88
%
|
|
4.80
%
|
|
24.82
%
|
|
(10.19
)%
|
|
30.24
%
(c)
|
|
RATIOS TO AVERAGE NET ASSETS:
|
|
|
|
|
|
|
|
|
|
|
|
Net assets, end of the period (000’s)
|
$
|
286,920
|
$
|
152,088
|
$
|
111,268
|
$
|
66,339
|
$
|
81,493
|
|
Net expenses(f)
|
|
1.25
%
|
|
1.25
%
|
|
1.25
%
|
|
1.25
%
|
|
1.27
%
(g)
|
|
Gross expenses
|
|
1.31
%
|
|
1.31
%
|
|
1.37
%
|
|
1.37
%
|
|
1.43
%
|
|
Net investment income (loss)
|
|
0.67
%
|
|
0.79
%
|
|
0.53
%
|
|
(0.12
)%
|
|
0.01
%
(c)
|
|
Portfolio turnover rate
|
|
120
%
|
|
80
%
|
|
72
%
|
|
63
%
|
|
92
%
|
|
(a)
|
Per share net investment income (loss) has been calculated using the average shares outstanding during the period.
|
|
(b)
|
Amount rounds to less than $0.01 per share.
|
|
(c)
|
Includes a non-recurring dividend. Without this dividend, net investment loss per share would have been $(0.05), total return would have been 29.95% and the ratio of net investment loss to average net assets would have been (0.25)%.
|
|
(d)
|
A sales charge for Class A shares is not reflected in total return calculations.
|
|
(e)
|
Had certain expenses not been waived/reimbursed during the period, total returns would have been lower.
|
|
(f)
|
The investment adviser agreed to waive its fees and/or reimburse a portion of the Fund’s expenses during the period. Without this waiver/reimbursement, expenses would have been higher.
|
|
(g)
|
Effective July 1, 2021, the expense limit decreased from 1.30% to 1.25%.
|
|
|
Class C
|
|||||||||
|
|
Year Ended
December 31, 2025 |
Year Ended
December 31, 2024 |
Year Ended
December 31, 2023 |
Year Ended
December 31, 2022 |
Year Ended
December 31, 2021 |
|||||
|
Net asset value, beginning of the period
|
$
|
6.51
|
$
|
6.51
|
$
|
5.30
|
$
|
6.94
|
$
|
8.34
|
|
INCOME (LOSS) FROM INVESTMENT OPERATIONS:
|
|
|
|
|
|
|
|
|
|
|
|
Net investment income (loss)(a)
|
|
(0.01
)
|
|
0.00
(b)
|
|
(0.01
)
|
|
(0.04
)
|
|
(0.06
)
(c)
|
|
Net realized and unrealized gain (loss)
|
|
0.76
|
|
0.26
|
|
1.28
|
|
(0.70
)
|
|
2.45
|
|
Total from Investment Operations
|
|
0.75
|
|
0.26
|
|
1.27
|
|
(0.74
)
|
|
2.39
|
|
LESS DISTRIBUTIONS FROM:
|
|
|
|
|
|
|
|
|
|
|
|
Net investment income
|
|
(0.12
)
|
|
(0.12
)
|
|
(0.06
)
|
|
—
|
|
—
|
|
Net realized capital gains
|
|
(1.04
)
|
|
(0.14
)
|
|
—
|
|
(0.90
)
|
|
(3.79
)
|
|
Total Distributions
|
|
(1.16
)
|
|
(0.26
)
|
|
(0.06
)
|
|
(0.90
)
|
|
(3.79
)
|
|
Net asset value, end of the period
|
$
|
6.10
|
$
|
6.51
|
$
|
6.51
|
$
|
5.30
|
$
|
6.94
|
|
Total return(d)(e)
|
|
11.11
%
|
|
4.00
%
|
|
23.93
%
|
|
(11.01
)%
|
|
29.45
%
(c)
|
|
RATIOS TO AVERAGE NET ASSETS:
|
|
|
|
|
|
|
|
|
|
|
|
Net assets, end of the period (000’s)
|
$
|
8,409
|
$
|
12,948
|
$
|
7,988
|
$
|
2,118
|
$
|
966
|
|
Net expenses(f)
|
|
2.00
%
|
|
2.00
%
|
|
2.00
%
|
|
2.00
%
|
|
2.03
%
(g)
|
|
Gross expenses
|
|
2.06
%
|
|
2.06
%
|
|
2.12
%
|
|
2.12
%
|
|
2.19
%
|
|
Net investment income (loss)
|
|
(0.10
)%
|
|
0.03
%
|
|
(0.14
)%
|
|
(0.74
)%
|
|
(0.67
)%
(c)
|
|
Portfolio turnover rate
|
|
120
%
|
|
80
%
|
|
72
%
|
|
63
%
|
|
92
%
|
|
(a)
|
Per share net investment income (loss) has been calculated using the average shares outstanding during the period.
|
|
(b)
|
Amount rounds to less than $0.01 per share.
|
|
(c)
|
Includes a non-recurring dividend. Without this dividend, net investment loss per share would have been $(0.10), total return would have been 29.09% and the ratio of net investment loss to average net assets would have been (0.99)%.
|
|
(d)
|
A contingent deferred sales charge for Class C shares is not reflected in total return calculations.
|
|
(e)
|
Had certain expenses not been waived/reimbursed during the period, total returns would have been lower.
|
|
(f)
|
The investment adviser agreed to waive its fees and/or reimburse a portion of the Fund’s expenses during the period. Without this waiver/reimbursement, expenses would have been higher.
|
|
(g)
|
Effective July 1, 2021, the expense limit decreased from 2.05% to 2.00%.
|
|
|
Class N
|
|||||||||
|
|
Year Ended
December 31, 2025 |
Year Ended
December 31, 2024 |
Year Ended
December 31, 2023 |
Year Ended
December 31, 2022 |
Year Ended
December 31, 2021 |
|||||
|
Net asset value, beginning of the period
|
$
|
20.84
|
$
|
20.14
|
$
|
16.16
|
$
|
18.96
|
$
|
17.52
|
|
INCOME (LOSS) FROM INVESTMENT OPERATIONS:
|
|
|
|
|
|
|
|
|
|
|
|
Net investment income(a)
|
|
0.21
|
|
0.23
|
|
0.15
|
|
0.04
|
|
0.01
(b)
|
|
Net realized and unrealized gain (loss)
|
|
2.36
|
|
0.80
|
|
3.93
|
|
(1.91
)
|
|
5.29
|
|
Total from Investment Operations
|
|
2.57
|
|
1.03
|
|
4.08
|
|
(1.87
)
|
|
5.30
|
|
LESS DISTRIBUTIONS FROM:
|
|
|
|
|
|
|
|
|
|
|
|
Net investment income
|
|
(0.22
)
|
|
(0.19
)
|
|
(0.10
)
|
|
(0.03
)
|
|
(0.07
)
|
|
Net realized capital gains
|
|
(1.04
)
|
|
(0.14
)
|
|
—
|
|
(0.90
)
|
|
(3.79
)
|
|
Total Distributions
|
|
(1.26
)
|
|
(0.33
)
|
|
(0.10
)
|
|
(0.93
)
|
|
(3.86
)
|
|
Net asset value, end of the period
|
$
|
22.15
|
$
|
20.84
|
$
|
20.14
|
$
|
16.16
|
$
|
18.96
|
|
Total return
|
|
12.22
%
|
|
5.08
%
|
|
25.24
%
(c)
|
|
(9.95
)%
(c)
|
|
30.64
%
(b)(c)
|
|
RATIOS TO AVERAGE NET ASSETS:
|
|
|
|
|
|
|
|
|
|
|
|
Net assets, end of the period (000’s)
|
$
|
200,762
|
$
|
111,877
|
$
|
2,506
|
$
|
1,493
|
$
|
1,383
|
|
Net expenses
|
|
0.94
%
|
|
0.95
%
|
|
0.95
%
(d)
|
|
0.95
%
(d)
|
|
0.97
%
(d)(e)
|
|
Gross expenses
|
|
0.94
%
|
|
0.95
%
|
|
1.08
%
|
|
1.10
%
|
|
1.19
%
|
|
Net investment income
|
|
1.00
%
|
|
1.08
%
|
|
0.84
%
|
|
0.22
%
|
|
0.03
%
(b)
|
|
Portfolio turnover rate
|
|
120
%
|
|
80
%
|
|
72
%
|
|
63
%
|
|
92
%
|
|
(a)
|
Per share net investment income has been calculated using the average shares outstanding during the period.
|
|
(b)
|
Includes a non-recurring dividend. Without this dividend, net investment income per share would have been $0.01, total return would have been 30.37% and the ratio of net investment income to average net assets would have been 0.03%.
|
|
(c)
|
Had certain expenses not been waived/reimbursed during the period, total returns would have been lower.
|
|
(d)
|
The investment adviser agreed to waive its fees and/or reimburse a portion of the Fund’s expenses during the period. Without this waiver/reimbursement, expenses would have been higher.
|
|
(e)
|
Effective July 1, 2021, the expense limit decreased from 1.00% to 0.95%.
|
|
|
Class Y
|
|||||||||
|
|
Year Ended
December 31, 2025 |
Year Ended
December 31, 2024 |
Year Ended
December 31, 2023 |
Year Ended
December 31, 2022 |
Year Ended
December 31, 2021 |
|||||
|
Net asset value, beginning of the period
|
$
|
20.81
|
$
|
20.11
|
$
|
16.15
|
$
|
18.95
|
$
|
17.51
|
|
INCOME (LOSS) FROM INVESTMENT OPERATIONS:
|
|
|
|
|
|
|
|
|
|
|
|
Net investment income(a)
|
|
0.19
|
|
0.22
|
|
0.16
|
|
0.04
|
|
0.06
(b)
|
|
Net realized and unrealized gain (loss)
|
|
2.36
|
|
0.80
|
|
3.89
|
|
(1.91
)
|
|
5.23
|
|
Total from Investment Operations
|
|
2.55
|
|
1.02
|
|
4.05
|
|
(1.87
)
|
|
5.29
|
|
LESS DISTRIBUTIONS FROM:
|
|
|
|
|
|
|
|
|
|
|
|
Net investment income
|
|
(0.20
)
|
|
(0.18
)
|
|
(0.09
)
|
|
(0.03
)
|
|
(0.06
)
|
|
Net realized capital gains
|
|
(1.04
)
|
|
(0.14
)
|
|
—
|
|
(0.90
)
|
|
(3.79
)
|
|
Total Distributions
|
|
(1.24
)
|
|
(0.32
)
|
|
(0.09
)
|
|
(0.93
)
|
|
(3.85
)
|
|
Net asset value, end of the period
|
$
|
22.12
|
$
|
20.81
|
$
|
20.11
|
$
|
16.15
|
$
|
18.95
|
|
Total return(c)
|
|
12.16
%
|
|
5.05
%
|
|
25.10
%
|
|
(9.98
)%
|
|
30.61
%
(b)
|
|
RATIOS TO AVERAGE NET ASSETS:
|
|
|
|
|
|
|
|
|
|
|
|
Net assets, end of the period (000’s)
|
$
|
796,514
|
$
|
943,370
|
$
|
530,371
|
$
|
120,585
|
$
|
66,054
|
|
Net expenses(d)
|
|
1.00
%
|
|
1.00
%
|
|
1.00
%
|
|
1.00
%
|
|
1.02
%
(e)
|
|
Gross expenses
|
|
1.06
%
|
|
1.06
%
|
|
1.12
%
|
|
1.12
%
|
|
1.18
%
|
|
Net investment income
|
|
0.90
%
|
|
1.03
%
|
|
0.91
%
|
|
0.22
%
|
|
0.28
%
(b)
|
|
Portfolio turnover rate
|
|
120
%
|
|
80
%
|
|
72
%
|
|
63
%
|
|
92
%
|
|
(a)
|
Per share net investment income has been calculated using the average shares outstanding during the period.
|
|
(b)
|
Includes a non-recurring dividend. Without this dividend, net investment income per share would have been $0.00, total return would have been 30.26% and the ratio of net investment income to average net assets would have been 0.01%.
|
|
(c)
|
Had certain expenses not been waived/reimbursed during the period, total returns would have been lower.
|
|
(d)
|
The investment adviser agreed to waive its fees and/or reimburse a portion of the Fund’s expenses during the period. Without this waiver/reimbursement, expenses would have been higher.
|
|
(e)
|
Effective July 1, 2021, the expense limit decreased from 1.05% to 1.00%.
|
|
•
|
The redemption and repurchase occur in the same account.
|
|
•
|
The redemption proceeds are used to process an: IRA contribution, excess contributions, conversion, recharacterizing of contributions, or distribution, and the repurchase is done in an account within the same Edward Jones grouping for ROA.
|
|
•
|
The Right of Reinstatement excludes systematic or automatic transactions including, but not limited to, purchases made through payroll deductions, liquidations to cover account fees, and reinvestments from non-mutual fund products.
|
|
•
|
Shares of mutual funds available for purchase by employer-sponsored retirement, deferred compensation, and employee benefit plans (including health
|
|
savings accounts) and trusts used to fund those plans provided the shares are not held in a commission-based brokerage account and shares are held for the benefit of the plan. For purposes of this provision, employer-sponsored retirement plans do not include SEP IRAs, Simple IRAs, SAR-SEPs or Keogh plans;
|
|
•
|
Shares purchased through a Merrill investment advisory program;
|
|
•
|
Brokerage class shares exchanged from advisory class shares due to the holdings moving from a Merrill investment advisory program to a Merrill brokerage account;
|
|
•
|
Shares purchased through the Merrill Edge Self-Directed platform;
|
|
•
|
Shares purchased through the systematic reinvestment of capital gains distributions and dividend reinvestment when purchasing shares of the same mutual fund in the same account;
|
|
•
|
Shares exchanged from level-load shares to front-end load shares of the same mutual fund in accordance with the description in the Merrill SLWD Supplement;
|
|
•
|
Shares purchased by eligible employees of Merrill or its affiliates and their family members who purchase shares in accounts within the employee’s Merrill Household (as defined in the Merrill SLWD Supplement);
|
|
•
|
Shares purchased by eligible persons associated with the fund as defined in this prospectus (e.g. the fund’s officers or trustees);
|
|
•
|
Shares purchased from the proceeds of a mutual fund redemption in front-end load shares provided (1) the repurchase is in a mutual fund within the same fund family; (2) the repurchase occurs within 90 calendar days from the redemption trade date, and (3) the redemption and purchase occur in the same account (known as Rights of Reinstatement). Automated transactions (i.e. systematic purchases and withdrawals) and purchases made after shares are automatically sold to pay Merrill’s account maintenance fees are not eligible for Rights of Reinstatement.
|
|
•
|
Shares sold due to the client’s death or disability (as defined by Internal Revenue Code Section 22(e)(3));
|
|
•
|
Shares sold pursuant to a systematic withdrawal program subject to Merrill’s maximum systematic withdrawal limits as described in the Merrill SLWD Supplement;
|
|
•
|
Shares sold due to return of excess contributions from an IRA account;
|
|
•
|
Shares sold as part of a required minimum distribution for IRA and retirement accounts due to the investor reaching the qualified age based on applicable IRS regulation;
|
|
•
|
Front-end or level-load shares held in commission-based, non-taxable retirement brokerage accounts (e.g. traditional, Roth, rollover, SEP IRAs, Simple IRAs, SAR-SEPs or Keogh plans) that are transferred to fee-based accounts or platforms and exchanged for a lower cost share class of the same mutual fund.
|
|
•
|
Breakpoint discounts, as described in this prospectus, where the sales load is at or below the maximum sales load that Merrill permits to be assessed to a front-end load purchase, as described in the Merrill SLWD Supplement;
|
|
•
|
Rights of Accumulation (ROA), as described in the Merrill SLWD Supplement, which entitle clients to breakpoint discounts based on the aggregated holdings of mutual fund family assets held in accounts in their Merrill Household; On or about May 1, 2026, assets not held at Merrill will no longer be included in the ROA calculation. For more detail on the timing and calculation, please refer to the Merrill SLWD Supplement.
|
|
•
|
Letters of Intent (LOI), which allow for breakpoint discounts on eligible new purchases based on anticipated future eligible purchases within a fund family at Merrill, in accounts within your Merrill Household, as further described in the Merrill SLWD Supplement. On or about May 1, 2026, Merrill will no longer accept new LOIs. For more detail on the timing, please refer to the Merrill SLWD Supplement.
|
|
•
|
Wells Fargo Advisors employee and employee-related accounts according to Wells Fargo Advisor’s employee account linking rules. Legacy accounts and positions receiving affiliate discounts prior to the effective date will continue to receive discounts. Going forward employees of affiliate businesses will not be offered NAV.
|
|
•
|
Shares purchased through reinvestment of dividends and capital gains distributions when purchasing shares of the same fund.
|
|
•
|
Shares purchased through a rollover from another 529 plan.
|
|
•
|
Recontribution(s) of distributed funds are only allowed during the NAV reinstatement period as dictated by the sponsor’s specifications outlined by the plan.
|
|
•
|
Contingent deferred sales charges (CDSC) imposed on fund redemptions will not be rebated based on future purchases.
|
|
•
|
SEP or SIMPLE IRAs will not be aggregated as a group plan. They will aggregate with the client’s personal accounts based on Social Security Number. Previously established SEP and SIMPLE IRAs may still be aggregated as a group plan.
|
|
•
|
Employer-sponsored retirement plan (e.g., 401(k) plans, 457 plans, employer-sponsored 403(b) plans, profit sharing and money purchase pension plans and defined benefit plans) accounts will aggregate with other plan accounts under the same Tax ID and will not be aggregated with other retirement plan accounts under a different Tax ID or personal accounts. For purposes of this provision, employer-sponsored retirement plans do not include SEP IRAs, SIMPLE IRAs, SAR-SEPs or Keogh plans.
|
|
•
|
Gift of shares will not be considered when determining breakpoint discounts.
|
|
Bloomberg U.S. Aggregate Bond Index
|
A broad-based benchmark that measures the investment grade, US dollar-denominated, fixed-rate taxable bond market. The index includes Treasuries, government-related and corporate securities, mortgage-backed securities (agency fixed-rate pass-throughs), asset-backed securities and commercial mortgage-backed securities (agency and non-agency).
|
|
Cboe S&P 500 BuyWrite Index (BXMSM)
|
A benchmark index designed to track the performance of a hypothetical buy-write strategy on the S&P 500® Index. The BXM is a passive total return index based on (1) buying an S&P 500 stock index portfolio, and (2) “writing” (or selling) the near-term S&P 500® Index (SPXSM) “covered” call option, generally on the third Friday of each month. The SPX call written will have about one month remaining to expiration, with an exercise price just above the prevailing index level. The SPX call is held until expiration and cash settled, at which time a new one-month, near-the-money call is written.
|
|
MSCI World Index (Net)
|
A free float-adjusted market capitalization weighted index that captures large and mid-cap representation across developed markets. Emerging markets are excluded.
|
|
Russell 2000® Value Index
|
The index measures the performance of the small-cap value segment of the U.S. equity universe. It includes those Russell 2000® companies with relatively lower price-to-book ratios, lower I/B/E/S forecast medium term growth and lower sales per share historical growth.
|
|
Russell 3000® Index
|
The index measures the performance of the largest 3,000 U.S. companies representing approximately 98% of the investable US equity market.
|
|
Russell Midcap® Value Index
|
The index measures the performance of the mid-cap value segment of the U.S. equity universe. It includes those Russell Midcap® Index companies with relatively lower price-to-book ratios, lower I/B/E/S forecast medium term growth and lower sales per share historical growth.
|
|
S&P 500® Index
|
The index measures the performance of 500 widely held stocks in the U.S. equity market. Standard and Poor’s chooses member companies for the index based on market size, liquidity and industry group representation.
|
|
Investment Company Act File No. 811-22099
Investment Company Act File No.811-04323 Investment Company Act File No. 811-00242 |
XMA51-0526
|

|
|
Class A
|
Class C
|
Class N
|
Class Y
|
Admin Class
|
|
Loomis Sayles High Income Fund
|
NEFHX
|
NEHCX
|
LSHNX
|
NEHYX
|
|
|
Loomis Sayles International Growth Fund
|
LIGGX
|
LIGCX
|
LIGNX
|
LIGYX
|
|
|
Loomis Sayles Investment Grade Bond Fund
|
LIGRX
|
LGBCX
|
LGBNX
|
LSIIX
|
LIGAX
|
|
Loomis Sayles Strategic Alpha Fund
|
LABAX
|
LABCX
|
LASNX
|
LASYX
|
|
|
Loomis Sayles Strategic Income Fund
|
NEFZX
|
NECZX
|
NEZNX
|
NEZYX
|
NEZAX
|
|
Natixis Oakmark Fund
|
NEFOX
|
NECOX
|
NOANX
|
NEOYX
|
|
|
Natixis Oakmark International Fund
|
NOIAX
|
NOICX
|
NIONX
|
NOIYX
|
|
|
Natixis U.S. Equity Opportunities Fund
|
NEFSX
|
NECCX
|
NESNX
|
NESYX
|
|
(fees paid directly from your investment)
|
Class A
|
Class C
|
Class N
|
Class Y
|
|
Maximum sales charge (load) imposed on purchases (as a percentage of offering price)
|
4.25%
|
None
|
None
|
None
|
|
Maximum deferred sales charge (load) (as a percentage of original purchase price or redemption proceeds, as applicable)
|
None*
|
1.00%
|
None
|
None
|
|
Redemption fees
|
None
|
None
|
None
|
None
|
| * | A 1.00% contingent deferred sales charge (“CDSC”) may apply to certain purchases of Class A shares of $1,000,000 or more that are redeemed within eighteen months of the date of purchase. |
|
(expenses that you pay each year as a percentage of the value of your investment)
|
Class A
|
Class C
|
Class N
|
Class Y
|
|
Management fees
|
0.55%
|
0.55%
|
0.55%
|
0.55%
|
|
Distribution and/or service (12b-1) fees
|
0.25%
|
1.00%
|
0.00%
|
0.00%
|
|
Other expenses
|
0.53%
|
0.53%
|
0.47%
|
0.53%
|
|
Total annual fund operating expenses
|
1.33%
|
2.08%
|
1.02%
|
1.08%
|
|
Fee waiver and/or expense reimbursement1,2
|
0.38%
|
0.38%
|
0.37%
|
0.38%
|
|
Total annual fund operating expenses after fee waiver and/or expense reimbursement
|
0.95%
|
1.70%
|
0.65%
|
0.70%
|
| 1 | Loomis, Sayles & Company, L.P. (“Loomis Sayles” or the “Adviser”) has given a binding contractual undertaking to the Fund to limit the amount of the Fund’s total annual fund operating expenses to 0.95%, 1.70%, 0.65% and 0.70% of the Fund’s average daily net assets for Class A, C, N and Y shares, respectively, exclusive of brokerage expenses, interest expense, taxes, acquired fund fees and expenses, organizational and extraordinary expenses, such as litigation and indemnification expenses. This undertaking is in effect through April 30, 2027 and may be terminated before then only with the consent of the Fund’s Board of Trustees. The Adviser will be permitted to recover, on a class by class basis, management fees waived and/or expenses reimbursed to the extent that expenses in later periods fall below both (1) the class’ applicable expense limitation at the time such amounts were waived/reimbursed and (2) the class’ current applicable expense limitation. The Fund will not be obligated to repay any such waived/reimbursed fees and expenses more than one year after the end of the fiscal year in which the fees or expenses were waived/reimbursed. |
| 2 | Natixis Advisors, LLC (“Natixis Advisors”) has given a binding contractual undertaking to the Fund to reimburse any and all transfer agency expenses for Class N shares. This undertaking is in effect through April 30, 2027 and may be terminated before then only with the consent of the Fund’s Board of Trustees. |
|
If shares are redeemed:
|
1 year
|
3 years
|
5 years
|
10 years
|
||||
|
Class A
|
$
|
518
|
$
|
793
|
$
|
1,088
|
$
|
1,927
|
|
Class C
|
$
|
273
|
$
|
615
|
$
|
1,084
|
$
|
2,188
|
|
If shares are redeemed:
|
1 year
|
3 years
|
5 years
|
10 years
|
||||
|
Class N
|
$
|
66
|
$
|
288
|
$
|
527
|
$
|
1,214
|
|
Class Y
|
$
|
72
|
$
|
306
|
$
|
559
|
$
|
1,283
|
|
If shares are not redeemed:
|
1 year
|
3 years
|
5 years
|
10 years
|
||||
|
Class C
|
$
|
173
|
$
|
615
|
$
|
1,084
|
$
|
2,188
|
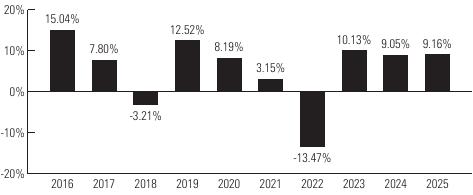 |
Highest Quarterly Return:
Second Quarter 2020, 11.39% Lowest Quarterly Return: First Quarter 2020, -14.16% |
|
Average Annual Total Returns
|
|
|
|
|
|
(for the periods ended December 31, 2025)
|
Past 1 Year
|
Past 5 Years
|
Past 10 Years
|
Life of Class N
(11/30/16) |
|
Class Y - Return Before Taxes
|
9.16%
|
3.19%
|
5.51%
|
-
|
|
Return After Taxes on Distributions
|
6.38%
|
0.55%
|
3.11%
|
-
|
|
Return After Taxes on Distributions and Sale of Fund Shares
|
5.36%
|
1.23%
|
3.19%
|
-
|
|
Class A - Return Before Taxes
|
4.25%
|
2.05%
|
4.77%
|
-
|
|
Class C - Return Before Taxes
|
6.99%
|
2.12%
|
4.61%
|
-
|
|
Class N - Return Before Taxes
|
9.19%
|
3.23%
|
-
|
4.69%
|
|
Bloomberg U.S. Aggregate Bond Index
|
7.30%
|
-0.36%
|
2.01%
|
1.93%
|
|
Bloomberg U.S. Corporate High-Yield Bond Index
|
8.62%
|
4.51%
|
6.53%
|
5.55%
|
|
Type of Account
|
Minimum Initial Purchase
|
|
Any account other than those listed below
|
$2,500
|
|
Type of Account
|
Minimum Initial Purchase
|
|
For shareholders participating in Natixis Funds’ Automatic Investment Plan
|
$1,000
|
|
For Traditional IRA, Roth IRA, Rollover IRA, SEP-IRA and Keogh plans
|
$1,000
|
|
•
|
Fee Based Programs (such as wrap accounts) where an advisory fee is paid to the broker-dealer or other financial intermediary. Please consult your financial representative to determine if your fee based program is subject to additional or different conditions or fees.
|
|
•
|
Certain Retirement Plans. Please consult your retirement plan administrator to determine if your retirement plan is subject to additional or different conditions or fees imposed by the plan administrator.
|
|
•
|
Clients of a Registered Investment Adviser where the Registered Investment Adviser receives an advisory, management or consulting fee.
|
|
•
|
Effective June 1, 2026, accounts invested through certain intermediaries held within an Intermediary Omnibus Account.
|
|
•
|
Effective June 1, 2026, in its sole discretion, Natixis Distribution, LLC (the “Distributor”) may waive any share class eligibility requirement.
|
|
•
|
Certain Retirement Plans. Please consult your retirement plan administrator to determine if your retirement plan is subject to additional or different conditions or fees imposed by the plan administrator.
|
|
•
|
Funds of funds that are distributed by the Distributor.
|
|
•
|
Sub-accounts held within an omnibus account, where the omnibus account has at least $1,000,000. (Effective June 1, 2026, this waiver no longer applies.)
|
|
•
|
Effective June 1, 2026, accounts invested through certain intermediaries held within an Intermediary Omnibus Account.
|
|
•
|
Effective June 1, 2026, in its sole discretion, the Distributor may waive any share class eligibility requirement.
|
|
•
|
Fee Based Programs (such as wrap accounts) where an advisory fee is paid to the broker-dealer or other financial intermediary. Please consult your financial representative to determine if your fee based program is subject to additional or different conditions or fees.
|
|
•
|
Certain Retirement Plans. Please consult your retirement plan administrator to determine if your retirement plan is subject to additional or different conditions or fees imposed by the plan administrator.
|
|
•
|
Certain Individual Retirement Accounts if the amounts invested represent rollover distributions from investments by any of the retirement plans invested in the Fund.
|
|
•
|
Clients of a Registered Investment Adviser where the Registered Investment Adviser receives an advisory, management or consulting fee.
|
|
•
|
Fund Trustees, former Fund trustees, employees of affiliates of the Natixis Funds and other individuals who are affiliated with any Natixis Fund (this also applies to any spouse, parents, children, siblings, grandparents, grandchildren and in-laws of those mentioned) and Natixis affiliate employee benefit plans.
|
|
•
|
Effective June 1, 2026, accounts invested through certain intermediaries held within an Intermediary Omnibus Account.
|
|
•
|
Effective June 1, 2026, in its sole discretion, the Distributor may waive any share class eligibility requirement.
|
|
(fees paid directly from your investment)
|
Class A
|
Class C
|
Class N
|
Class Y
|
|
Maximum sales charge (load) imposed on purchases (as a percentage of offering price)
|
5.75%
|
None
|
None
|
None
|
|
Maximum deferred sales charge (load) (as a percentage of original purchase price or redemption proceeds, as applicable)
|
None*
|
1.00%
|
None
|
None
|
|
Redemption fees
|
None
|
None
|
None
|
None
|
| * | A 1.00% contingent deferred sales charge (“CDSC”) may apply to certain purchases of Class A shares of $1,000,000 or more that are redeemed within eighteen months of the date of purchase. |
|
(expenses that you pay each year as a percentage of the value of your investment)
|
Class A
|
Class C
|
Class N
|
Class Y
|
|
Management fees
|
0.75%
|
0.75%
|
0.75%
|
0.75%
|
|
Distribution and/or service (12b-1) fees
|
0.25%
|
1.00%
|
0.00%
|
0.00%
|
|
Other expenses
|
0.91%1
|
0.88%1
|
0.81%
|
0.91%1
|
|
Total annual fund operating expenses
|
1.91%
|
2.63%
|
1.56%
|
1.66%
|
|
Fee waiver and/or expense reimbursement2,3
|
0.71%
|
0.68%
|
0.66%
|
0.71%
|
|
Total annual fund operating expenses after fee waiver and/or expense reimbursement
|
1.20%
|
1.95%
|
0.90%
|
0.95%
|
| 1 | Pursuant to an expense offset arrangement, credits realized as a result of uninvested cash balances may be used to reduce the Fund’s transfer agent expenses. Other expenses are shown net of such reductions of transfer agent expenses of 1bps. |
| 2 | Loomis, Sayles & Company, L.P. (“Loomis Sayles” or the “Adviser”) has given a binding contractual undertaking to the Fund to limit the amount of the Fund’s total annual fund operating expenses to 1.20%, 1.95%, 0.90% and 0.95% of the Fund’s average daily net assets for Class A, C, N and Y shares, respectively, exclusive of brokerage expenses, interest expense, taxes, acquired fund fees and expenses, organizational and extraordinary expenses, such as litigation and indemnification expenses. This undertaking is in effect through April 30, 2027 and may be terminated before then only with the consent of the Fund’s Board of Trustees. The Adviser will be permitted to recover, on a class by class basis, management fees waived and/or expenses reimbursed to the extent that expenses in later periods fall below both (1) the class’ applicable expense limitation at the time such amounts were waived/reimbursed and (2) the class’ current applicable expense limitation. The Fund will not be obligated to repay any such waived/reimbursed fees and expenses more than one year after the end of the fiscal year in which the fees or expenses were waived/reimbursed. |
| 3 | Natixis Advisors, LLC (“Natixis Advisors”) has given a binding contractual undertaking to the Fund to reimburse any and all transfer agency expenses for Class N shares. This undertaking is in effect through April 30, 2027 and may be terminated before then only with the consent of the Fund’s Board of Trustees. |
|
If shares are redeemed:
|
1 year
|
3 years
|
5 years
|
10 years
|
||||
|
Class A
|
$
|
690
|
$
|
1,076
|
$
|
1,485
|
$
|
2,625
|
|
If shares are redeemed:
|
1 year
|
3 years
|
5 years
|
10 years
|
||||
|
Class C
|
$
|
298
|
$
|
753
|
$
|
1,334
|
$
|
2,738
|
|
Class N
|
$
|
92
|
$
|
428
|
$
|
787
|
$
|
1,800
|
|
Class Y
|
$
|
97
|
$
|
454
|
$
|
835
|
$
|
1,906
|
|
If shares are not redeemed:
|
1 year
|
3 years
|
5 years
|
10 years
|
||||
|
Class C
|
$
|
198
|
$
|
753
|
$
|
1,334
|
$
|
2,738
|
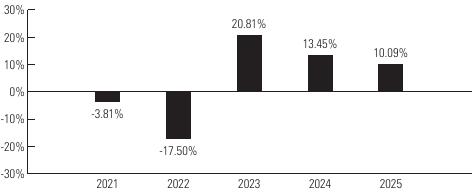 |
Highest Quarterly Return:
First Quarter 2023, 14.01% Lowest Quarterly Return: Second Quarter 2022, -13.00% |
|
Average Annual Total Returns
|
|
|
|
|
(for the periods ended December 31, 2025)
|
Past 1 Year
|
Past 5 Years
|
Life of Fund
(12/15/20) |
|
Class Y - Return Before Taxes
|
10.09%
|
3.67%
|
3.92%
|
|
Return After Taxes on Distributions
|
9.67%
|
3.47%
|
3.72%
|
|
Return After Taxes on Distributions and Sale of Fund Shares
|
6.33%
|
2.87%
|
3.07%
|
|
Class A - Return Before Taxes
|
3.54%
|
2.19%
|
2.45%
|
|
Class C - Return Before Taxes
|
8.01%
|
2.61%
|
2.86%
|
|
Class N - Return Before Taxes
|
10.15%
|
3.71%
|
3.96%
|
|
MSCI All Country World ex USA Index (Net)
|
32.39%
|
7.91%
|
8.31%
|
|
Type of Account
|
Minimum Initial Purchase
|
|
Any account other than those listed below
|
$2,500
|
|
For shareholders participating in Natixis Funds’ Automatic Investment Plan
|
$1,000
|
|
For Traditional IRA, Roth IRA, Rollover IRA, SEP-IRA and Keogh plans
|
$1,000
|
|
•
|
Fee Based Programs (such as wrap accounts) where an advisory fee is paid to the broker-dealer or other financial intermediary. Please consult your financial representative to determine if your fee based program is subject to additional or different conditions or fees.
|
|
•
|
Certain Retirement Plans. Please consult your retirement plan administrator to determine if your retirement plan is subject to additional or different conditions or fees imposed by the plan administrator.
|
|
•
|
Clients of a Registered Investment Adviser where the Registered Investment Adviser receives an advisory, management or consulting fee.
|
|
•
|
Effective June 1, 2026, accounts invested through certain intermediaries held within an Intermediary Omnibus Account.
|
|
•
|
Effective June 1, 2026, in its sole discretion, Natixis Distribution, LLC (the “Distributor”) may waive any share class eligibility requirement.
|
|
•
|
Certain Retirement Plans. Please consult your retirement plan administrator to determine if your retirement plan is subject to additional or different conditions or fees imposed by the plan administrator.
|
|
•
|
Funds of funds that are distributed by the Distributor.
|
|
•
|
Sub-accounts held within an omnibus account, where the omnibus account has at least $1,000,000. (Effective June 1, 2026, this waiver no longer applies.)
|
|
•
|
Effective June 1, 2026, accounts invested through certain intermediaries held within an Intermediary Omnibus Account.
|
|
•
|
Effective June 1, 2026, in its sole discretion, the Distributor may waive any share class eligibility requirement.
|
|
•
|
Fee Based Programs (such as wrap accounts) where an advisory fee is paid to the broker-dealer or other financial intermediary. Please consult your financial representative to determine if your fee based program is subject to additional or different conditions or fees.
|
|
•
|
Certain Retirement Plans. Please consult your retirement plan administrator to determine if your retirement plan is subject to additional or different conditions or fees imposed by the plan administrator.
|
|
•
|
Certain Individual Retirement Accounts if the amounts invested represent rollover distributions from investments by any of the retirement plans invested in the Fund.
|
|
•
|
Clients of a Registered Investment Adviser where the Registered Investment Adviser receives an advisory, management or consulting fee.
|
|
•
|
Fund Trustees, former Fund trustees, employees of affiliates of the Natixis Funds and other individuals who are affiliated with any Natixis Fund (this also applies to any spouse, parents, children, siblings, grandparents, grandchildren and in-laws of those mentioned) and Natixis affiliate employee benefit plans.
|
|
•
|
Effective June 1, 2026, accounts invested through certain intermediaries held within an Intermediary Omnibus Account.
|
|
•
|
Effective June 1, 2026, in its sole discretion, the Distributor may waive any share class eligibility requirement.
|
|
(fees paid directly from your investment)
|
Class A
|
Class C
|
Class N
|
Class Y
|
Admin Class
|
|
Maximum sales charge (load) imposed on purchases (as a percentage of offering price)
|
4.25%
|
None
|
None
|
None
|
None
|
|
Maximum deferred sales charge (load) (as a percentage of original purchase price or redemption proceeds, as applicable)
|
None*
|
1.00%
|
None
|
None
|
None
|
|
Redemption fees
|
None
|
None
|
None
|
None
|
None
|
| * | A 1.00% contingent deferred sales charge (“CDSC”) may apply to certain purchases of Class A shares of $1,000,000 or more that are redeemed within eighteen months of the date of purchase. |
|
(expenses that you pay each year as a percentage of the value of your investment)
|
Class A
|
Class C
|
Class N
|
Class Y
|
Admin Class
|
|
Management fees1
|
0.38%
|
0.38%
|
0.38%
|
0.38%
|
0.38%
|
|
Distribution and/or service (12b-1) fees
|
0.25%
|
1.00%
|
0.00%
|
0.00%
|
0.25%
|
|
Other expenses
|
0.15%
|
0.15%
|
0.07%
|
0.15%
|
0.40%2
|
|
Total annual fund operating expenses
|
0.78%
|
1.53%
|
0.45%
|
0.53%
|
1.03%
|
|
Fee waiver and/or expense reimbursement3
|
0.05%
|
0.05%
|
0.02%
|
0.05%
|
0.05%
|
|
Total annual fund operating expenses after fee waiver and/or expense reimbursement
|
0.73%
|
1.48%
|
0.43%
|
0.48%
|
0.98%
|
| 1 | The Fund’s operating expenses have been restated to reflect a reduction in management fees, effective as of January 1, 2026, as if reduction had been in effect during the fiscal year ended December 31, 2025. The information has been restated to better reflect anticipated expenses of the Fund. |
| 2 | Other expenses include an administrative services fee of 0.25% for Admin Class shares. |
| 3 | Loomis, Sayles & Company, L.P. (“Loomis Sayles” or the “Adviser”) has given a binding contractual undertaking to the Fund to limit the amount of the Fund’s total annual fund operating expenses to 0.73%, 1.48%, 0.43%, 0.48% and 0.98% of the Fund’s average daily net assets for Class A, Class C, Class N, Class Y and Admin Class shares, respectively, exclusive of brokerage expenses, interest expense, taxes, acquired fund fees and expenses, organizational and extraordinary expenses, such as litigation and indemnification expenses. This undertaking is in effect through April 30, 2027 and may be terminated before then only with the consent of the Fund’s Board of Trustees. The Adviser will be permitted to recover, on a class by class basis, management fees waived and/or expenses reimbursed to the extent that expenses in later periods fall below both (1) the class’ applicable expense limitation at the time such amounts were waived/reimbursed and (2) the class’ current applicable expense limitation. The Fund will not be obligated to repay any such waived/reimbursed fees and expenses more than one year after the end of the fiscal year in which the fees or expenses were waived/reimbursed. |
|
If shares are redeemed:
|
1 year
|
3 years
|
5 years
|
10 years
|
||||
|
Class A
|
$
|
496
|
$
|
659
|
$
|
835
|
$
|
1,346
|
|
Class C
|
$
|
251
|
$
|
478
|
$
|
829
|
$
|
1,617
|
|
If shares are redeemed:
|
1 year
|
3 years
|
5 years
|
10 years
|
||||
|
Class N
|
$
|
44
|
$
|
142
|
$
|
250
|
$
|
565
|
|
Class Y
|
$
|
49
|
$
|
165
|
$
|
291
|
$
|
660
|
|
Admin Class
|
$
|
100
|
$
|
323
|
$
|
564
|
$
|
1,255
|
|
If shares are not redeemed:
|
1 year
|
3 years
|
5 years
|
10 years
|
||||
|
Class C
|
$
|
151
|
$
|
478
|
$
|
829
|
$
|
1,617
|
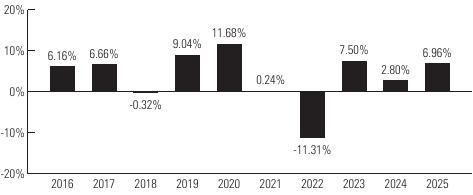 |
Highest Quarterly Return:
Second Quarter 2020, 8.60% Lowest Quarterly Return: Second Quarter 2022, -5.35% |
|
Average Annual Total Returns
|
|
|
|
|
(for the periods ended December 31, 2025)
|
Past 1 Year
|
Past 5 Years
|
Past 10 Years
|
|
Class Y - Return Before Taxes
|
6.96%
|
1.00%
|
3.74%
|
|
Return After Taxes on Distributions
|
4.85%
|
-0.69%
|
1.99%
|
|
Return After Taxes on Distributions and Sale of Fund Shares
|
4.09%
|
0.05%
|
2.21%
|
|
Class A - Return Before Taxes
|
2.28%
|
-0.12%
|
3.05%
|
|
Class C - Return Before Taxes
|
5.01%
|
0.00%
|
2.87%
|
|
Class N - Return Before Taxes
|
7.12%
|
1.06%
|
3.82%
|
|
Admin Class - Return Before Taxes
|
6.44%
|
0.49%
|
3.24%
|
|
Bloomberg U.S. Aggregate Bond Index
|
7.30%
|
-0.36%
|
2.01%
|
|
Type of Account
|
Minimum Initial Purchase
|
|
Any account other than those listed below
|
$2,500
|
|
For shareholders participating in Natixis Funds’ Automatic Investment Plan
|
$1,000
|
|
For Traditional IRA, Roth IRA, Rollover IRA, SEP-IRA and Keogh plans
|
$1,000
|
|
•
|
Fee Based Programs (such as wrap accounts) where an advisory fee is paid to the broker-dealer or other financial intermediary. Please consult your financial representative to determine if your fee based program is subject to additional or different conditions or fees.
|
|
•
|
Certain Retirement Plans. Please consult your retirement plan administrator to determine if your retirement plan is subject to additional or different conditions or fees imposed by the plan administrator.
|
|
•
|
Clients of a Registered Investment Adviser where the Registered Investment Adviser receives an advisory, management or consulting fee.
|
|
•
|
Effective June 1, 2026, accounts invested through certain intermediaries held within an Intermediary Omnibus Account.
|
|
•
|
Effective June 1, 2026, in its sole discretion, Natixis Distribution, LLC (the “Distributor”) may waive any share class eligibility requirement.
|
|
•
|
Certain Retirement Plans. Please consult your retirement plan administrator to determine if your retirement plan is subject to additional or different conditions or fees imposed by the plan administrator.
|
|
•
|
Funds of funds that are distributed by the Distributor.
|
|
•
|
Sub-accounts held within an omnibus account, where the omnibus account has at least $1,000,000. (Effective June 1, 2026, this waiver no longer applies.)
|
|
•
|
Effective June 1, 2026, accounts invested through certain intermediaries held within an Intermediary Omnibus Account.
|
|
•
|
Effective June 1, 2026, in its sole discretion, the Distributor may waive any share class eligibility requirement.
|
|
•
|
Fee Based Programs (such as wrap accounts) where an advisory fee is paid to the broker-dealer or other financial intermediary. Please consult your financial representative to determine if your fee based program is subject to additional or different conditions or fees.
|
|
•
|
Certain Retirement Plans. Please consult your retirement plan administrator to determine if your retirement plan is subject to additional or different conditions or fees imposed by the plan administrator.
|
|
•
|
Certain Individual Retirement Accounts if the amounts invested represent rollover distributions from investments by any of the retirement plans invested in the Fund.
|
|
•
|
Clients of a Registered Investment Adviser where the Registered Investment Adviser receives an advisory, management or consulting fee.
|
|
•
|
Fund Trustees, former Fund trustees, employees of affiliates of the Natixis Funds and other individuals who are affiliated with any Natixis Fund (this also applies to any spouse, parents, children, siblings, grandparents, grandchildren and in-laws of those mentioned) and Natixis affiliate employee benefit plans.
|
|
•
|
Effective June 1, 2026, accounts invested through certain intermediaries held within an Intermediary Omnibus Account.
|
|
•
|
Effective June 1, 2026, in its sole discretion, the Distributor may waive any share class eligibility requirement.
|
|
(fees paid directly from your investment)
|
Class A
|
Class C
|
Class N
|
Class Y
|
|
Maximum sales charge (load) imposed on purchases (as a percentage of offering price)
|
4.25%
|
None
|
None
|
None
|
|
Maximum deferred sales charge (load) (as a percentage of original purchase price or redemption proceeds, as applicable)
|
None*
|
1.00%
|
None
|
None
|
|
Redemption fees
|
None
|
None
|
None
|
None
|
| * | A 1.00% contingent deferred sales charge (“CDSC”) may apply to certain purchases of Class A shares of $1,000,000 or more that are redeemed within eighteen months of the date of purchase. |
|
(expenses that you pay each year as a percentage of the value of your investment)
|
Class A
|
Class C
|
Class N
|
Class Y
|
|
Management fees
|
0.60%
|
0.60%
|
0.60%
|
0.60%
|
|
Distribution and/or service (12b-1) fees
|
0.25%
|
1.00%
|
0.00%
|
0.00%
|
|
Other expenses
|
0.18%
|
0.18%
|
0.11%
|
0.18%
|
|
Total annual fund operating expenses
|
1.03%
|
1.78%
|
0.71%
|
0.78%
|
|
Fee waiver and/or expense reimbursement1
|
0.05%
|
0.05%
|
0.03%
|
0.05%
|
|
Total annual fund operating expenses after fee waiver and/or expense reimbursement
|
0.98%
|
1.73%
|
0.68%
|
0.73%
|
| 1 | Loomis, Sayles & Company, L.P. (“Loomis Sayles” or the “Adviser”) has given a binding contractual undertaking to the Fund to limit the amount of the Fund’s total annual fund operating expenses to 0.98%, 1.73%, 0.68% and 0.73% of the Fund’s average daily net assets for Class A, C, N and Y shares, respectively, exclusive of brokerage expenses, interest expense, taxes, acquired fund fees and expenses, organizational and extraordinary expenses, such as litigation and indemnification expenses. This undertaking is in effect through April 30, 2027 and may be terminated before then only with the consent of the Fund’s Board of Trustees. The Adviser will be permitted to recover, on a class by class basis, management fees waived and/or expenses reimbursed to the extent that expenses in later periods fall below both (1) the class’ applicable expense limitation at the time such amounts were waived/reimbursed and (2) the class’ current applicable expense limitation. The Fund will not be obligated to repay any such waived/reimbursed fees and expenses more than one year after the end of the fiscal year in which the fee/expense was waived/reimbursed. |
|
If shares are redeemed:
|
1 year
|
3 years
|
5 years
|
10 years
|
||||
|
Class A
|
$
|
521
|
$
|
734
|
$
|
965
|
$
|
1,627
|
|
Class C
|
$
|
276
|
$
|
555
|
$
|
960
|
$
|
1,893
|
|
Class N
|
$
|
69
|
$
|
224
|
$
|
392
|
$
|
880
|
|
If shares are redeemed:
|
1 year
|
3 years
|
5 years
|
10 years
|
||||
|
Class Y
|
$
|
75
|
$
|
244
|
$
|
428
|
$
|
961
|
|
If shares are not redeemed:
|
1 year
|
3 years
|
5 years
|
10 years
|
||||
|
Class C
|
$
|
176
|
$
|
555
|
$
|
960
|
$
|
1,893
|
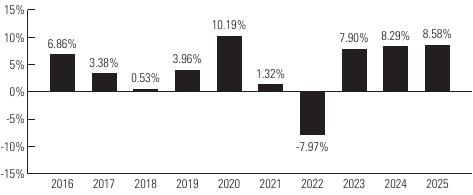 |
Highest Quarterly Return:
Second Quarter 2020, 8.07% Lowest Quarterly Return: First Quarter 2020, -5.57% |
|
Average Annual Total Returns
|
|
|
|
|
|
(for the periods ended December 31, 2025)
|
Past 1 Year
|
Past 5 Years
|
Past 10 Years
|
Life of Class N
(5/1/17) |
|
Class Y - Return Before Taxes
|
8.58%
|
3.42%
|
4.17%
|
-
|
|
Return After Taxes on Distributions
|
6.52%
|
1.60%
|
2.64%
|
-
|
|
Return After Taxes on Distributions and Sale of Fund Shares
|
5.05%
|
1.80%
|
2.54%
|
-
|
|
Class A - Return Before Taxes
|
3.73%
|
2.28%
|
3.47%
|
-
|
|
Class C - Return Before Taxes
|
6.48%
|
2.39%
|
3.29%
|
-
|
|
Class N - Return Before Taxes
|
8.62%
|
3.47%
|
-
|
3.93%
|
|
Bloomberg U.S. Aggregate Bond Index
|
7.30%
|
-0.36%
|
2.01%
|
1.84%
|
|
ICE BofA 3-Month U.S. Treasury Bill Index
|
4.18%
|
3.17%
|
2.18%
|
2.45%
|
|
Type of Account
|
Minimum Initial Purchase
|
|
Any account other than those listed below
|
$2,500
|
|
For shareholders participating in Natixis Funds’ Automatic Investment Plan
|
$1,000
|
|
For Traditional IRA, Roth IRA, Rollover IRA, SEP-IRA and Keogh plans
|
$1,000
|
|
•
|
Fee Based Programs (such as wrap accounts) where an advisory fee is paid to the broker-dealer or other financial intermediary. Please consult your financial representative to determine if your fee based program is subject to additional or different conditions or fees.
|
|
•
|
Certain Retirement Plans. Please consult your retirement plan administrator to determine if your retirement plan is subject to additional or different conditions or fees imposed by the plan administrator.
|
|
•
|
Clients of a Registered Investment Adviser where the Registered Investment Adviser receives an advisory, management or consulting fee.
|
|
•
|
Effective June 1, 2026, accounts invested through certain intermediaries held within an Intermediary Omnibus Account.
|
|
•
|
Effective June 1, 2026, in its sole discretion, Natixis Distribution, LLC (the “Distributor”) may waive any share class eligibility requirement.
|
|
•
|
Certain Retirement Plans. Please consult your retirement plan administrator to determine if your retirement plan is subject to additional or different conditions or fees imposed by the plan administrator.
|
|
•
|
Funds of funds that are distributed by the Distributor.
|
|
•
|
Sub-accounts held within an omnibus account, where the omnibus account has at least $1,000,000. (Effective June 1, 2026, this waiver no longer applies.)
|
|
•
|
Effective June 1, 2026, accounts invested through certain intermediaries held within an Intermediary Omnibus Account.
|
|
•
|
Effective June 1, 2026, in its sole discretion, the Distributor may waive any share class eligibility requirement.
|
|
•
|
Fee Based Programs (such as wrap accounts) where an advisory fee is paid to the broker-dealer or other financial intermediary. Please consult your financial representative to determine if your fee based program is subject to additional or different conditions or fees.
|
|
•
|
Certain Retirement Plans. Please consult your retirement plan administrator to determine if your retirement plan is subject to additional or different conditions or fees imposed by the plan administrator.
|
|
•
|
Certain Individual Retirement Accounts if the amounts invested represent rollover distributions from investments by any of the retirement plans invested in the Fund.
|
|
•
|
Clients of a Registered Investment Adviser where the Registered Investment Adviser receives an advisory, management or consulting fee.
|
|
•
|
Fund Trustees, former Fund trustees, employees of affiliates of the Natixis Funds and other individuals who are affiliated with any Natixis Fund (this also applies to any spouse, parents, children, siblings, grandparents, grandchildren and in-laws of those mentioned) and Natixis affiliate employee benefit plans.
|
|
•
|
Effective June 1, 2026, accounts invested through certain intermediaries held within an Intermediary Omnibus Account.
|
|
•
|
Effective June 1, 2026, in its sole discretion, the Distributor may waive any share class eligibility requirement.
|
|
(fees paid directly from your investment)
|
Class A
|
Class C
|
Class N
|
Class Y
|
Admin Class
|
|
Maximum sales charge (load) imposed on purchases (as a percentage of offering price)
|
4.25%
|
None
|
None
|
None
|
None
|
|
Maximum deferred sales charge (load) (as a percentage of original purchase price or redemption proceeds, as applicable)
|
None*
|
1.00%
|
None
|
None
|
None
|
|
Redemption fees
|
None
|
None
|
None
|
None
|
None
|
| * | A 1.00% contingent deferred sales charge (“CDSC”) may apply to certain purchases of Class A shares of $1,000,000 or more that are redeemed within eighteen months of the date of purchase. |
|
(expenses that you pay each year as a percentage of the value of your investment)
|
Class A
|
Class C
|
Class N
|
Class Y
|
Admin Class
|
|
Management fees
|
0.58%
|
0.58%
|
0.58%
|
0.58%
|
0.58%
|
|
Distribution and/or service (12b-1) fees
|
0.25%
|
1.00%
|
0.00%
|
0.00%
|
0.25%
|
|
Other expenses
|
0.17%
|
0.17%
|
0.08%
|
0.17%
|
0.42%1
|
|
Total annual fund operating expenses
|
1.00%
|
1.75%
|
0.66%
|
0.75%
|
1.25%
|
|
Fee waiver and/or expense reimbursement2
|
0.08%
|
0.08%
|
0.04%
|
0.08%
|
0.08%
|
|
Total annual fund operating expenses after fee waiver and/or expense reimbursement
|
0.92%
|
1.67%
|
0.62%
|
0.67%
|
1.17%
|
| 1 | Other expenses include an administrative services fee of 0.25% for Admin Class shares. |
| 2 | Loomis, Sayles & Company, L.P. (“Loomis Sayles” or the “Adviser”) has given a binding contractual undertaking to the Fund to limit the amount of the Fund’s total annual fund operating expenses to 0.92%, 1.67%, 0.62%, 0.67% and 1.17% of the Fund’s average daily net assets for Class A, C, N, Y and Admin Class shares, respectively, exclusive of brokerage expenses, interest expense, taxes, acquired fund fees and expenses, organizational and extraordinary expenses, such as litigation and indemnification expenses. This undertaking is in effect through April 30, 2027 and may be terminated before then only with the consent of the Fund’s Board of Trustees. The Adviser will be permitted to recover, on a class by class basis, management fees waived and/or expenses reimbursed to the extent that expenses in later periods fall below both (1) the class’ applicable expense limitation at the time such amounts were waived/reimbursed and (2) the class’ current applicable expense limitation. The Fund will not be obligated to repay any such waived/reimbursed fees and expenses more than one year after the end of the fiscal year in which the fees or expenses were waived/reimbursed. |
|
If shares are redeemed:
|
1 year
|
3 years
|
5 years
|
10 years
|
||||
|
Class A
|
$
|
515
|
$
|
722
|
$
|
947
|
$
|
1,591
|
|
Class C
|
$
|
270
|
$
|
543
|
$
|
941
|
$
|
1,858
|
|
Class N
|
$
|
63
|
$
|
207
|
$
|
364
|
$
|
819
|
|
If shares are redeemed:
|
1 year
|
3 years
|
5 years
|
10 years
|
||||
|
Class Y
|
$
|
68
|
$
|
232
|
$
|
409
|
$
|
923
|
|
Admin Class
|
$
|
119
|
$
|
389
|
$
|
679
|
$
|
1,504
|
|
If shares are not redeemed:
|
1 year
|
3 years
|
5 years
|
10 years
|
||||
|
Class C
|
$
|
170
|
$
|
543
|
$
|
941
|
$
|
1,858
|
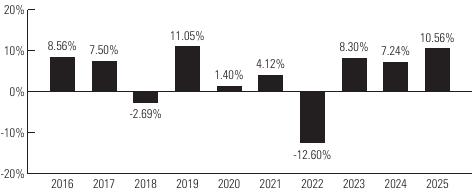 |
Highest Quarterly Return: Fourth Quarter 2023, 7.70%
Lowest Quarterly Return: First Quarter 2020, -12.29% |
|
Average Annual Total Returns
|
|
|
|
|
(for the periods ended December 31, 2025)
|
Past 1 Year
|
Past 5 Years
|
Past 10 Years
|
|
Class Y - Return Before Taxes
|
10.56%
|
3.16%
|
4.10%
|
|
Return After Taxes on Distributions
|
8.22%
|
1.03%
|
2.19%
|
|
Return After Taxes on Distributions and Sale of Fund Shares
|
6.22%
|
1.46%
|
2.36%
|
|
Class A - Return Before Taxes
|
5.62%
|
2.01%
|
3.38%
|
|
Class C - Return Before Taxes
|
8.36%
|
2.12%
|
3.21%
|
|
Class N - Return Before Taxes
|
10.62%
|
3.22%
|
4.17%
|
|
Admin Class - Return Before Taxes
|
9.95%
|
2.65%
|
3.58%
|
|
Bloomberg U.S. Aggregate Bond Index
|
7.30%
|
-0.36%
|
2.01%
|
|
Type of Account
|
Minimum Initial Purchase
|
|
Any account other than those listed below
|
$2,500
|
|
For shareholders participating in Natixis Funds’ Automatic Investment Plan
|
$1,000
|
|
For Traditional IRA, Roth IRA, Rollover IRA, SEP-IRA and Keogh plans
|
$1,000
|
|
•
|
Fee Based Programs (such as wrap accounts) where an advisory fee is paid to the broker-dealer or other financial intermediary. Please consult your financial representative to determine if your fee based program is subject to additional or different conditions or fees.
|
|
•
|
Certain Retirement Plans. Please consult your retirement plan administrator to determine if your retirement plan is subject to additional or different conditions or fees imposed by the plan administrator.
|
|
•
|
Clients of a Registered Investment Adviser where the Registered Investment Adviser receives an advisory, management or consulting fee.
|
|
•
|
Effective June 1, 2026, accounts invested through certain intermediaries held within an Intermediary Omnibus Account.
|
|
•
|
Effective June 1, 2026, in its sole discretion, Natixis Distribution, LLC (the “Distributor”) may waive any share class eligibility requirement.
|
|
•
|
Certain Retirement Plans. Please consult your retirement plan administrator to determine if your retirement plan is subject to additional or different conditions or fees imposed by the plan administrator.
|
|
•
|
Funds of funds that are distributed by the Distributor.
|
|
•
|
Sub-accounts held within an omnibus account, where the omnibus account has at least $1,000,000. (Effective June 1, 2026, this waiver no longer applies.)
|
|
•
|
Effective June 1, 2026, accounts invested through certain intermediaries held within an Intermediary Omnibus Account.
|
|
•
|
Effective June 1, 2026, in its sole discretion, the Distributor may waive any share class eligibility requirement.
|
|
•
|
Fee Based Programs (such as wrap accounts) where an advisory fee is paid to the broker-dealer or other financial intermediary. Please consult your financial representative to determine if your fee based program is subject to additional or different conditions or fees.
|
|
•
|
Certain Retirement Plans. Please consult your retirement plan administrator to determine if your retirement plan is subject to additional or different conditions or fees imposed by the plan administrator.
|
|
•
|
Certain Individual Retirement Accounts if the amounts invested represent rollover distributions from investments by any of the retirement plans invested in the Fund.
|
|
•
|
Clients of a Registered Investment Adviser where the Registered Investment Adviser receives an advisory, management or consulting fee.
|
|
•
|
Fund Trustees, former Fund trustees, employees of affiliates of the Natixis Funds and other individuals who are affiliated with any Natixis Fund (this also applies to any spouse, parents, children, siblings, grandparents, grandchildren and in-laws of those mentioned) and Natixis affiliate employee benefit plans.
|
|
•
|
Effective June 1, 2026, accounts invested through certain intermediaries held within an Intermediary Omnibus Account.
|
|
•
|
Effective June 1, 2026, in its sole discretion, the Distributor may waive any share class eligibility requirement.
|
|
(fees paid directly from your investment)
|
Class A
|
Class C
|
Class N
|
Class Y
|
|
Maximum sales charge (load) imposed on purchases (as a percentage of offering price)
|
5.75%
|
None
|
None
|
None
|
|
Maximum deferred sales charge (load) (as a percentage of original purchase price or redemption proceeds, as applicable)
|
None*
|
1.00%
|
None
|
None
|
|
Redemption fees
|
None
|
None
|
None
|
None
|
| * | A 1.00% contingent deferred sales charge (“CDSC”) may apply to certain purchases of Class A shares of $1,000,000 or more that are redeemed within eighteen months of the date of purchase. |
|
(expenses that you pay each year as a percentage of the value of your investment)
|
Class A
|
Class C
|
Class N
|
Class Y
|
|
Management fees
|
0.63%
|
0.63%
|
0.63%
|
0.63%
|
|
Distribution and/or service (12b-1) fees
|
0.25%
|
1.00%
|
0.00%
|
0.00%
|
|
Other expenses
|
0.18%
|
0.18%
|
0.16%1
|
0.18%
|
|
Total annual fund operating expenses
|
1.06%
|
1.81%
|
0.79%
|
0.81%
|
|
Fee waiver and/or expense reimbursement2,3
|
0.03%
|
0.03%
|
0.06%
|
0.03%
|
|
Total annual fund operating expenses after fee waiver and/or expense reimbursement
|
1.03%
|
1.78%
|
0.73%
|
0.78%
|
| 1 | Pursuant to an expense offset arrangement, credits realized as a result of uninvested cash balances may be used to reduce the Fund’s transfer agent expenses. Other expenses are shown net of such reductions of transfer agent expenses of 2 bps. |
| 2 | Natixis Advisors, LLC (“Natixis Advisors”) has given a binding contractual undertaking to the Fund to limit the amount of the Fund’s total annual fund operating expenses to 1.03%, 1.78%, 0.73% and 0.78% of the Fund’s average daily net assets for Class A, C, N and Y shares, respectively, exclusive of brokerage expenses, interest expense, taxes, acquired fund fees and expenses, organizational and extraordinary expenses, such as litigation and indemnification expenses. This undertaking is in effect through April 30, 2027 and may be terminated before then only with the consent of the Fund’s Board of Trustees. The Adviser will be permitted to recover, on a class by class basis, management fees waived and/or expenses reimbursed to the extent that expenses in later periods fall below both (1) the class’ applicable expense limitation at the time such amounts were waived/reimbursed and (2) the class’ current applicable expense limitation. The Fund will not be obligated to repay any such waived/reimbursed fees and expenses more than one year after the end of the fiscal year in which the fees or expenses were waived/reimbursed. |
| 3 | Natixis Advisors has given a binding contractual undertaking to the Fund to reimburse any and all transfer agency expenses for Class N shares. This undertaking is in effect through April 30, 2027 and may be terminated before then only with the consent of the Fund’s Board of Trustees. |
|
If shares are redeemed:
|
1 year
|
3 years
|
5 years
|
10 years
|
||||
|
Class A
|
$
|
674
|
$
|
890
|
$
|
1,123
|
$
|
1,792
|
|
If shares are redeemed:
|
1 year
|
3 years
|
5 years
|
10 years
|
||||
|
Class C
|
$
|
281
|
$
|
567
|
$
|
977
|
$
|
1,927
|
|
Class N
|
$
|
75
|
$
|
246
|
$
|
433
|
$
|
972
|
|
Class Y
|
$
|
80
|
$
|
256
|
$
|
447
|
$
|
999
|
|
If shares are not redeemed:
|
1 year
|
3 years
|
5 years
|
10 years
|
||||
|
Class C
|
$
|
181
|
$
|
567
|
$
|
977
|
$
|
1,927
|
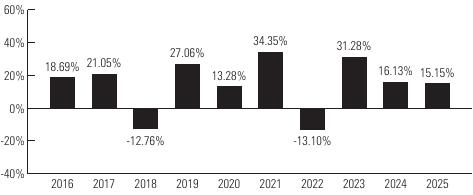 |
Highest Quarterly Return:
Fourth Quarter 2020, 23.76% Lowest Quarterly Return: First Quarter 2020, -29.68% |
|
Average Annual Total Returns
|
|
|
|
|
|
(for the periods ended December 31, 2025)
|
Past 1 Year
|
Past 5 Years
|
Past 10 Years
|
Life of Class N
(5/1/17) |
|
Class Y - Return Before Taxes
|
15.15%
|
15.43%
|
13.97%
|
-
|
|
Return After Taxes on Distributions
|
13.32%
|
13.43%
|
12.03%
|
-
|
|
Average Annual Total Returns
|
|
|
|
|
|
(for the periods ended December 31, 2025)
|
Past 1 Year
|
Past 5 Years
|
Past 10 Years
|
Life of Class N
(5/1/17) |
|
Return After Taxes on Distributions and Sale of Fund Shares
|
10.16%
|
12.00%
|
11.06%
|
-
|
|
Class A - Return Before Taxes
|
8.26%
|
13.78%
|
13.01%
|
-
|
|
Class C - Return Before Taxes
|
13.03%
|
14.28%
|
13.00%
|
-
|
|
Class N - Return Before Taxes
|
15.20%
|
15.51%
|
-
|
13.48%
|
|
S&P 500® Index
|
17.88%
|
14.42%
|
14.82%
|
14.77%
|
|
Type of Account
|
Minimum Initial Purchase
|
|
Any account other than those listed below
|
$2,500
|
|
For shareholders participating in Natixis Funds’ Automatic Investment Plan
|
$1,000
|
|
For Traditional IRA, Roth IRA, Rollover IRA, SEP-IRA and Keogh plans
|
$1,000
|
|
•
|
Fee Based Programs (such as wrap accounts) where an advisory fee is paid to the broker-dealer or other financial intermediary. Please consult your financial representative to determine if your fee based program is subject to additional or different conditions or fees.
|
|
•
|
Certain Retirement Plans. Please consult your retirement plan administrator to determine if your retirement plan is subject to additional or different conditions or fees imposed by the plan administrator.
|
|
•
|
Clients of a Registered Investment Adviser where the Registered Investment Adviser receives an advisory, management or consulting fee.
|
|
•
|
Effective June 1, 2026, accounts invested through certain intermediaries held within an Intermediary Omnibus Account.
|
|
•
|
Effective June 1, 2026, in its sole discretion, Natixis Distribution, LLC (the “Distributor”) may waive any share class eligibility requirement.
|
|
•
|
Certain Retirement Plans. Please consult your retirement plan administrator to determine if your retirement plan is subject to additional or different conditions or fees imposed by the plan administrator.
|
|
•
|
Funds of funds that are distributed by the Distributor.
|
|
•
|
Sub-accounts held within an omnibus account, where the omnibus account has at least $1,000,000. (Effective June 1, 2026, this waiver no longer applies.)
|
|
•
|
Effective June 1, 2026, accounts invested through certain intermediaries held within an Intermediary Omnibus Account.
|
|
•
|
Effective June 1, 2026, in its sole discretion, the Distributor may waive any share class eligibility requirement.
|
|
•
|
Fee Based Programs (such as wrap accounts) where an advisory fee is paid to the broker-dealer or other financial intermediary. Please consult your financial representative to determine if your fee based program is subject to additional or different conditions or fees.
|
|
•
|
Certain Retirement Plans. Please consult your retirement plan administrator to determine if your retirement plan is subject to additional or different conditions or fees imposed by the plan administrator.
|
|
•
|
Certain Individual Retirement Accounts if the amounts invested represent rollover distributions from investments by any of the retirement plans invested in the Fund.
|
|
•
|
Clients of a Registered Investment Adviser where the Registered Investment Adviser receives an advisory, management or consulting fee.
|
|
•
|
Fund Trustees, former Fund trustees, employees of affiliates of the Natixis Funds and other individuals who are affiliated with any Natixis Fund (this also applies to any spouse, parents, children, siblings, grandparents, grandchildren and in-laws of those mentioned) and Natixis affiliate employee benefit plans.
|
|
•
|
Effective June 1, 2026, accounts invested through certain intermediaries held within an Intermediary Omnibus Account.
|
|
•
|
Effective June 1, 2026, in its sole discretion, the Distributor may waive any share class eligibility requirement.
|
|
|
Class A
|
Class C
|
Class N
|
Class Y
|
|
Maximum sales charge (load) imposed on purchases (as a percentage of offering price)
|
|
|
|
|
|
Maximum deferred sales charge (load) (as a percentage of original purchase price or redemption proceeds, as applicable)
|
|
|
|
|
|
Redemption fees
|
|
|
|
|
| * |
|
|
Class A
|
Class C
|
Class N
|
Class Y
|
|
Management fees
|
|
|
|
|
|
Distribution and/or service (12b-1) fees
|
|
|
|
|
|
Other expenses1,2
|
|
|
|
|
|
Total annual fund operating expenses
|
|
|
|
|
|
Fee waiver and/or expense reimbursement4,5
|
|
|
|
|
|
Total annual fund operating expenses after fee waiver and/or expense reimbursement
|
|
|
|
|
| 1 | The expense information shown in the table above includes acquired fund fees and expenses of less than 0.01%; the ratios may differ from the expense information disclosed in the Fund’s financial highlights table because the financial highlights table reflects the operating expenses of the Fund and does not include acquired fund fees and expenses. |
| 2 | Other expenses are shown net of tax reclaim expense of the following: Class A 0.13%, Class C 0.10%, Class N 0.11%, and Class Y 0.13%. Without these reductions, total annual fund operating expenses would have been 1.55%, 2.28%, 1.38%, and 1.30%, and total annual fund operating expenses after fee waiver and/or expense reimbursement would have been 1.28%, 2.00%, 0.96%, and 1.03%. |
| 3 | Pursuant to an expense offset arrangement, credits realized as a result of uninvested cash balances may be used to reduce the Fund’s transfer agent expenses. Other expenses are shown net of such reductions of transfer agent expenses of 1bps. |
| 4 | Natixis Advisors, LLC (“Natixis Advisors”) has given a binding contractual undertaking to the Fund to limit the amount of the Fund’s total annual fund operating expenses to 1.15%, 1.90%, 0.85% and 0.90% of the Fund’s average daily net assets for Class A, C, N and Y shares, respectively, exclusive of brokerage expenses, interest expense, taxes, acquired fund fees and expenses, organizational and extraordinary expenses, such as litigation and indemnification expenses. This undertaking is in effect through |
| 5 | Natixis Advisors has given a binding contractual undertaking to the Fund to reimburse any and all transfer agency expenses for Class N shares. This undertaking is in effect through April 30, 2027 and may be terminated before then only with the consent of the Fund’s Board of Trustees. |
|
|
1 year
|
3 years
|
5 years
|
10 years
|
||||
|
Class A
|
$
|
|
$
|
|
$
|
|
$
|
|
|
Class C
|
$
|
|
$
|
|
$
|
|
$
|
|
|
Class N
|
$
|
|
$
|
|
$
|
|
$
|
|
|
Class Y
|
$
|
|
$
|
|
$
|
|
$
|
|
|
|
1 year
|
3 years
|
5 years
|
10 years
|
||||
|
Class C
|
$
|
|
$
|
|
$
|
|
$
|
|
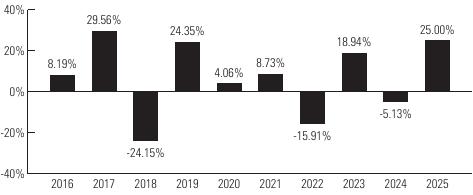 |
, , - |
|
|
|
|
|
|
|
|
Past 1 Year
|
Past 5 Years
|
Past 10 Years
|
Life of Class N
(5/1/17) |
|
Class A - Return Before Taxes
|
|
|
|
-
|
|
Return After Taxes on Distributions
|
|
|
|
-
|
|
Return After Taxes on Distributions and Sale of Fund Shares
|
|
|
|
-
|
|
Class C - Return Before Taxes
|
|
|
|
-
|
|
Class N - Return Before Taxes
|
|
|
-
|
|
|
Class Y - Return Before Taxes
|
|
|
|
-
|
|
MSCI World ex USA Index (Net)
|
|
|
|
|
|
Type of Account
|
Minimum Initial Purchase
|
|
Any account other than those listed below
|
$2,500
|
|
Type of Account
|
Minimum Initial Purchase
|
|
For shareholders participating in Natixis Funds’ Automatic Investment Plan
|
$1,000
|
|
For Traditional IRA, Roth IRA, Rollover IRA, SEP-IRA and Keogh plans
|
$1,000
|
|
•
|
Fee Based Programs (such as wrap accounts) where an advisory fee is paid to the broker-dealer or other financial intermediary. Please consult your financial representative to determine if your fee based program is subject to additional or different conditions or fees.
|
|
•
|
Certain Retirement Plans. Please consult your retirement plan administrator to determine if your retirement plan is subject to additional or different conditions or fees imposed by the plan administrator.
|
|
•
|
Clients of a Registered Investment Adviser where the Registered Investment Adviser receives an advisory, management or consulting fee.
|
|
•
|
Effective June 1, 2026, accounts invested through certain intermediaries held within an Intermediary Omnibus Account.
|
|
•
|
Effective June 1, 2026, in its sole discretion, Natixis Distribution, LLC (the “Distributor”) may waive any share class eligibility requirement.
|
|
•
|
Certain Retirement Plans. Please consult your retirement plan administrator to determine if your retirement plan is subject to additional or different conditions or fees imposed by the plan administrator.
|
|
•
|
Funds of funds that are distributed by the Distributor.
|
|
•
|
Sub-accounts held within an omnibus account, where the omnibus account has at least $1,000,000. (Effective June 1, 2026, this waiver no longer applies.)
|
|
•
|
Effective June 1, 2026, accounts invested through certain intermediaries held within an Intermediary Omnibus Account.
|
|
•
|
Effective June 1, 2026, in its sole discretion, the Distributor may waive any share class eligibility requirement.
|
|
•
|
Fee Based Programs (such as wrap accounts) where an advisory fee is paid to the broker-dealer or other financial intermediary. Please consult your financial representative to determine if your fee based program is subject to additional or different conditions or fees.
|
|
•
|
Certain Retirement Plans. Please consult your retirement plan administrator to determine if your retirement plan is subject to additional or different conditions or fees imposed by the plan administrator.
|
|
•
|
Certain Individual Retirement Accounts if the amounts invested represent rollover distributions from investments by any of the retirement plans invested in the Fund.
|
|
•
|
Clients of a Registered Investment Adviser where the Registered Investment Adviser receives an advisory, management or consulting fee.
|
|
•
|
Fund Trustees, former Fund trustees, employees of affiliates of the Natixis Funds and other individuals who are affiliated with any Natixis Fund (this also applies to any spouse, parents, children, siblings, grandparents, grandchildren and in-laws of those mentioned) and Natixis affiliate employee benefit plans.
|
|
•
|
Effective June 1, 2026, accounts invested through certain intermediaries held within an Intermediary Omnibus Account.
|
|
•
|
Effective June 1, 2026, in its sole discretion, the Distributor may waive any share class eligibility requirement.
|
|
|
Class A
|
Class C
|
Class N
|
Class Y
|
|
Maximum sales charge (load) imposed on purchases (as a percentage of offering price)
|
|
|
|
|
|
Maximum deferred sales charge (load) (as a percentage of original purchase price or redemption proceeds, as applicable)
|
|
|
|
|
|
Redemption fees
|
|
|
|
|
| 1 |
|
|
Class A
|
Class C
|
Class N
|
Class Y
|
|
Management fees
|
|
|
|
|
|
Distribution and/or service (12b-1) fees
|
|
|
|
|
|
Other expenses
|
|
|
|
|
|
Total annual fund operating expenses
|
|
|
|
|
|
Fee waiver and/or expense reimbursement1,2
|
|
|
|
|
|
Total annual fund operating expenses after fee waiver and/or expense reimbursement
|
|
|
|
|
| Natixis Advisors, LLC (“Natixis Advisors”) has given a binding contractual undertaking to the Fund to limit the amount of the Fund’s total annual fund operating expenses to 1.08%, 1.83%, 0.78% and 0.83% of the Fund’s average daily net assets for Class A, C, N and Y shares, respectively, exclusive of brokerage expenses, interest expense, taxes, acquired fund fees and expenses, organizational and extraordinary expenses, such as litigation and indemnification expenses. This undertaking is in effect through |
| 2 | Natixis Advisors has given a binding contractual undertaking to the Fund to reimburse any and all transfer agency expenses for Class N shares. This undertaking is in effect through April 30, 2027 and may be terminated before then only with the consent of the Fund’s Board of Trustees. |
|
|
1 year
|
3 years
|
5 years
|
10 years
|
||||
|
Class A
|
$
|
|
$
|
|
$
|
|
$
|
|
|
If shares are redeemed:
|
1 year
|
3 years
|
5 years
|
10 years
|
||||
|
Class C
|
$
|
|
$
|
|
$
|
|
$
|
|
|
Class N
|
$
|
|
$
|
|
$
|
|
$
|
|
|
Class Y
|
$
|
|
$
|
|
$
|
|
$
|
|
|
|
1 year
|
3 years
|
5 years
|
10 years
|
||||
|
Class C
|
$
|
|
$
|
|
$
|
|
$
|
|
|
•
|
Harris Associates - Large Cap Value sleeve - Under normal circumstances, the Large Cap Value sleeve of the Fund managed by Harris Associates L.P. (“Harris Associates”) will invest primarily in the common stocks of larger-capitalization companies that Harris Associates believes are trading at a substantial discount to the company’s “intrinsic value.” By “intrinsic value,” Harris Associates means its estimate of the price a knowledgeable buyer would pay to acquire the entire business. Harris Associates believes that investing in securities priced significantly below what Harris Associates believes is a company’s intrinsic value presents the best opportunity to achieve the Fund’s investment objectives. Harris Associates usually sells a security when the price approaches its estimated value and monitors each holding and adjusts its price targets as warranted to reflect changes in the issuer’s fundamentals. In determining whether an issuer is a U.S. or foreign issuer for the Harris Associates – Large Cap Value sleeve, Harris Associates considers various factors, including its country of domicile, the primary stock exchange on which it trades, the location from which the majority of its revenue comes, and its reporting currency.
|
|
•
|
Loomis Sayles - All Cap Growth sleeve - Under normal circumstances, the All Cap Growth sleeve of the Fund, managed by Loomis, Sayles & Company, L.P. (“Loomis Sayles”), will invest primarily in equity securities, including common stocks and depositary receipts. This sleeve may invest in companies of any size. The sleeve normally invests across a wide range of sectors and industries. The sleeve’s portfolio manager employs a growth style of equity management that emphasizes companies with sustainable competitive advantages versus others, long-term structural growth drivers that will lead to above-average future cash flow growth, attractive cash flow returns on invested capital, and management teams focused on creating long-term value for shareholders. The sleeve’s portfolio manager aims to invest in companies when they trade at a significant discount to the estimate of intrinsic value (i.e. companies with share prices trading significantly below what the portfolio manager believes the share price should be). The sleeve will consider selling a portfolio investment when the portfolio manager believes an unfavorable structural change occurs within a given business or the markets in which it operates, a critical underlying investment assumption is flawed, when a more attractive reward-to-risk opportunity becomes available, when the portfolio manager believes the current price fully reflects intrinsic value, or for other investment reasons which the portfolio manager deems appropriate. Although certain equity securities purchased by the Loomis Sayles – All Cap Growth sleeve of the Fund may be issued by domestic companies incorporated outside of the United States, Loomis Sayles uses a propriety definition to determine whether a security is classified as U.S. or non-U.S. In determining the location of an issuer for these purposes, or where the issuer’s principal activities are based, Loomis Sayles will consider a variety of factors (collectively designed to assess whether an issuer is economically tied to a particular country or region), including but not limited to: the markets in which the issuer’s securities are primarily traded; the location of the issuer’s headquarters, principal offices, or operations; the country where the issuer is organized; the percentage of the issuer’s revenues or profits derived from goods produced or sold, investments made, or services performed in the relevant country; and information provided by third-party data analytics service providers. No single factor will necessarily be determinative, nor must all factors be present for Loomis Sayles to assess an issuer’s location. Loomis Sayles may assign different weights to these factors based on different geographic policies, countries, or products.
|
|
•
|
Invest in securities offered in initial public offerings (“IPOs”) and securities issued pursuant to Rule 144A under the Securities Act of 1933 (“Rule 144A securities”).
|
|
•
|
Invest in convertible preferred stock and convertible debt securities.
|
|
•
|
Invest in real estate investment trusts (“REITs”).
|
|
•
|
Invest in fixed-income securities, including U.S. government bonds and below-investment grade fixed-income securities (commonly known as “junk bonds”).
|
|
•
|
Hold securities of foreign issuers traded over-the-counter or on foreign exchanges, including securities in emerging markets and related currency hedging transactions.
|
|
•
|
Invest in equity securities of Canadian issuers.
|
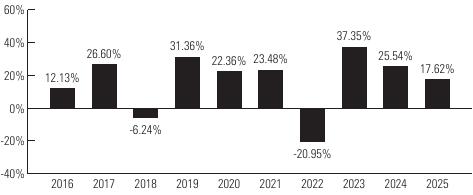 |
, , - |
|
|
|
|
|
|
|
|
Past 1 Year
|
Past 5 Years
|
Past 10 Years
|
Life of Class N
(5/1/17) |
|
Class Y - Return Before Taxes
|
|
|
|
-
|
|
Return After Taxes on Distributions
|
|
|
|
-
|
|
Return After Taxes on Distributions and Sale of Fund Shares
|
|
|
|
-
|
|
Class A - Return Before Taxes
|
|
|
|
-
|
|
Class C - Return Before Taxes
|
|
|
|
-
|
|
Class N - Return Before Taxes
|
|
|
-
|
|
|
S&P 500® Index
|
|
|
|
|
|
Russell 1000® Index
|
|
|
|
|
|
Type of Account
|
Minimum Initial Purchase
|
|
Any account other than those listed below
|
$2,500
|
|
For shareholders participating in Natixis Funds’ Automatic Investment Plan
|
$1,000
|
|
For Traditional IRA, Roth IRA, Rollover IRA, SEP-IRA and Keogh plans
|
$1,000
|
|
•
|
Fee Based Programs (such as wrap accounts) where an advisory fee is paid to the broker-dealer or other financial intermediary. Please consult your financial representative to determine if your fee based program is subject to additional or different conditions or fees.
|
|
•
|
Certain Retirement Plans. Please consult your retirement plan administrator to determine if your retirement plan is subject to additional or different conditions or fees imposed by the plan administrator.
|
|
•
|
Clients of a Registered Investment Adviser where the Registered Investment Adviser receives an advisory, management or consulting fee.
|
|
•
|
Effective June 1, 2026, accounts invested through certain intermediaries held within an Intermediary Omnibus Account.
|
|
•
|
Effective June 1, 2026, in its sole discretion, Natixis Distribution, LLC (the “Distributor”) may waive any share class eligibility requirement.
|
|
•
|
Certain Retirement Plans. Please consult your retirement plan administrator to determine if your retirement plan is subject to additional or different conditions or fees imposed by the plan administrator.
|
|
•
|
Funds of funds that are distributed by the Distributor.
|
|
•
|
Sub-accounts held within an omnibus account, where the omnibus account has at least $1,000,000. (Effective June 1, 2026, this waiver no longer applies.)
|
|
•
|
Effective June 1, 2026, accounts invested through certain intermediaries held within an Intermediary Omnibus Account.
|
|
•
|
Effective June 1, 2026, in its sole discretion, the Distributor may waive any share class eligibility requirement.
|
|
•
|
Fee Based Programs (such as wrap accounts) where an advisory fee is paid to the broker-dealer or other financial intermediary. Please consult your financial representative to determine if your fee based program is subject to additional or different conditions or fees.
|
|
•
|
Certain Retirement Plans. Please consult your retirement plan administrator to determine if your retirement plan is subject to additional or different conditions or fees imposed by the plan administrator.
|
|
•
|
Certain Individual Retirement Accounts if the amounts invested represent rollover distributions from investments by any of the retirement plans invested in the Fund.
|
|
•
|
Clients of a Registered Investment Adviser where the Registered Investment Adviser receives an advisory, management or consulting fee.
|
|
•
|
Fund Trustees, former Fund trustees, employees of affiliates of the Natixis Funds and other individuals who are affiliated with any Natixis Fund (this also applies to any spouse, parents, children, siblings, grandparents, grandchildren and in-laws of those mentioned) and Natixis affiliate employee benefit plans.
|
|
•
|
Effective June 1, 2026, accounts invested through certain intermediaries held within an Intermediary Omnibus Account.
|
|
•
|
Effective June 1, 2026, in its sole discretion, the Distributor may waive any share class eligibility requirement.
|
|
•
|
Harris Associates - Large Cap Value sleeve - Under normal circumstances, the Large Cap Value sleeve of the Fund managed by Harris Associates L.P. (“Harris Associates”) will invest primarily in the common stocks of larger-capitalization companies that Harris Associates believes are trading at a substantial discount to the company’s “intrinsic value.” By “intrinsic value,” Harris Associates means its estimate of the price a knowledgeable buyer would pay to acquire the entire business. Harris Associates believes that investing in securities priced significantly below what Harris Associates believes is a company’s intrinsic value presents the best opportunity to achieve the Fund’s investment objectives. Harris Associates usually sells a security when the price approaches its estimated value and monitors each holding and adjusts its price targets as warranted to reflect changes in the issuer’s fundamentals. In determining whether an issuer is a U.S. or foreign issuer for the Harris Associates – Large Cap Value sleeve, Harris Associates considers various factors, including its country of domicile, the primary stock exchange on which it trades, the location from which the majority of its revenue comes, and its reporting currency.
|
|
•
|
Loomis Sayles - All Cap Growth sleeve - Under normal circumstances, the All Cap Growth sleeve of the Fund, managed by Loomis, Sayles & Company, L.P. (“Loomis Sayles”), will invest primarily in equity securities, including common stocks and depositary receipts. This sleeve may invest in companies of any size. The sleeve normally invests across a wide range of sectors and industries. The sleeve’s portfolio manager employs a growth style of equity management that emphasizes companies with sustainable competitive advantages versus others, long-term structural growth drivers that will lead to above-average future cash flow growth, attractive cash flow returns on invested capital, and management teams focused on creating long-term value for shareholders. The sleeve’s portfolio manager aims to invest in companies when they trade at a significant discount to the estimate of intrinsic value (i.e. companies with share prices trading significantly below what the portfolio manager believes the share price should be). The sleeve will consider selling a portfolio investment when the portfolio manager believes an unfavorable structural change occurs within a given business or the markets in which it operates, a critical underlying investment assumption is flawed, when a more attractive reward-to-risk opportunity becomes available, when the portfolio manager believes the current price fully reflects intrinsic value, or for other investment reasons which the portfolio manager deems appropriate. Although certain equity securities purchased by the Loomis Sayles – All Cap Growth sleeve of the Fund may be issued by domestic companies incorporated outside of the United States, Loomis Sayles uses a propriety definition to determine whether a security is classified as U.S. or non-U.S. In determining the location of an issuer for these purposes, or where the issuer’s principal activities are based, Loomis Sayles will consider a variety of factors (collectively designed to assess whether an issuer is economically tied to a particular country or region), including but not limited to: the markets in which the issuer’s securities are primarily traded; the location of the issuer’s headquarters, principal offices, or operations; the country where the issuer is organized; the percentage of the issuer’s revenues or profits derived from goods produced or sold, investments made, or services performed in the relevant country; and information provided by third-party data analytics service providers. No single factor will necessarily be determinative, nor must all factors be present for Loomis Sayles to assess an issuer’s location. Loomis Sayles may assign different weights to these factors based on different geographic policies, countries, or products.
|
|
•
|
Invest in securities offered in initial public offerings (“IPOs”) and securities issued pursuant to Rule 144A under the Securities Act of 1933 (“Rule 144A securities”).
|
|
•
|
Invest in convertible preferred stock and convertible debt securities.
|
|
•
|
Invest in real estate investment trusts (“REITs”).
|
|
•
|
Invest in fixed-income securities, including U.S. government bonds and below-investment grade fixed-income securities (commonly known as “junk bonds”).
|
|
•
|
Hold securities of foreign issuers traded over-the-counter or on foreign exchanges, including securities in emerging markets and related currency hedging transactions.
|
|
•
|
Invest in equity securities of Canadian issuers.
|
|
•
|
You pay a sales charge when you buy Class A shares. There are several ways to reduce this charge. See the section “How Sales Charges Are Calculated.”
|
|
•
|
You pay lower annual expenses than Class C and Admin Class shares, giving you the potential for higher returns per share. However, where front-end sales charges are applicable, returns are earned on a smaller amount of your investment.
|
|
•
|
You pay higher annual expenses than Class N and Class Y shares.
|
|
•
|
You do not pay a sales charge if your total investment reaches $1 million or more, but you may pay a charge on redemptions if you redeem these shares within 18 months of purchase.
|
|
•
|
You do not pay a sales charge when you buy Class C shares. All of your money goes to work for you right away.
|
|
•
|
You pay higher annual expenses than Class A, Class N, Class Y and Admin Class shares.
|
|
•
|
You may pay a sales charge on redemptions if you sell your Class C shares within one year of purchase.
|
|
•
|
Investors will not be permitted to purchase $1 million or more of Class C shares as a single investment per account. There may be certain exceptions to this restriction for omnibus and other nominee accounts. Investors may want to consider the lower operating expense of Class A shares in such instances. You may pay a charge on redemptions if you redeem Class A shares within 18 months of purchase.
|
|
•
|
Except as noted below, Class C shares will automatically convert to Class A shares after eight years. Please see the section “Exchanging or Converting Shares” for details regarding a conversion of shares. Generally, to be eligible to have your Class C shares automatically converted to Class A shares, the Fund or the financial intermediary through which you purchased your shares will need to have records verifying that your Class C shares have been held for eight years. Due to operational limitations at your financial intermediary, your ability to have your Class C shares automatically converted to Class A shares may be limited. Group retirement plans of certain financial intermediaries who hold Class C shares with a Fund in an omnibus account do not track participant level aging of shares and therefore these shares will not be eligible for an automatic conversion. Certain intermediaries may convert your Class C shares to Class A shares in accordance with a conversion schedule that may differ from the one described above. Please consult your financial representative for more information.
|
|
•
|
You have a minimum initial investment of $1,000,000. There are several ways to waive this minimum. See the section “Purchase and Sale of Fund Shares.”
|
|
•
|
You do not pay a sales charge when you buy Class N shares. All of your money goes to work for you right away.
|
|
•
|
You do not pay a sales charge on redemptions.
|
|
•
|
You may pay lower annual expenses than Class A, Class C, Class Y and Admin Class shares, giving you the potential for higher returns per share.
|
|
•
|
You have a minimum initial investment of $100,000. There are several ways to waive this minimum. See the section “Purchase and Sale of Fund Shares.”
|
|
•
|
You do not pay a sales charge when you buy Class Y shares. All of your money goes to work for you right away.
|
|
•
|
You do not pay a sales charge on redemptions.
|
|
•
|
You pay lower annual expenses than Class A, Class C and Admin Class shares, giving you the potential for higher returns per share.
|
|
•
|
The shares are available to a limited type of investor. See the section “Purchase and Sale of Fund Shares.”
|
|
•
|
You have no minimum initial investment.
|
|
•
|
You do not pay a sales charge when you buy Admin Class shares. All of your money goes to work for you right away.
|
|
•
|
You do not pay a sales charge on redemptions.
|
|
•
|
You pay lower annual expenses than Class C shares, giving you the potential for higher returns per share.
|
|
•
|
You pay higher annual expenses than Class A, Class N and Class Y shares.
|
|
Class A Sales Charges*
|
|
|||||
|
Loomis Sayles International Growth Fund, Natixis Oakmark Fund, Natixis Oakmark International Fund and Natixis U.S. Equity Opportunities Fund
|
|
Loomis Sayles High Income Fund, Loomis Sayles Investment Grade Bond Fund, Loomis Sayles Strategic Income Fund and Loomis Sayles Strategic Alpha Fund
|
||||
|
Your Investment
|
As a % of offering price
|
As a % of your investment
|
|
Your Investment
|
As a % of offering price
|
As a % of your investment
|
|
Less than $50,000
|
5.75%
|
6.10%
|
|
Less than $100,000
|
4.25%
|
4.44%
|
|
Class A Sales Charges*
|
|
|
||||
|
|
Loomis Sayles International Growth Fund, Natixis Oakmark Fund, Natixis Oakmark International Fund and Natixis U.S. Equity Opportunities Fund
|
|
|
Loomis Sayles High Income Fund, Loomis Sayles Investment Grade Bond Fund, Loomis Sayles Strategic Income Fund and Loomis Sayles Strategic Alpha Fund
|
||
|
Your Investment
|
As a % of offering price
|
As a % of your investment
|
|
Your Investment
|
As a % of offering price
|
As a % of your investment
|
|
$50,000-$99,999
|
4.50%
|
4.71%
|
|
$100,000-$249,999
|
3.50%
|
3.63%
|
|
$100,000-$249,999
|
3.50%
|
3.63%
|
|
$250,000-$499,999
|
2.50%
|
2.56%
|
|
$250,000-$499,999
|
2.50%
|
2.56%
|
|
$500,000-$999,999
|
2.00%
|
2.04%
|
|
$500,000-$999,999
|
2.00%
|
2.04%
|
|
$1,000,000 or more**
|
0.00%
|
0.00%
|
|
$1,000,000 or more**
|
0.00%
|
0.00%
|
||||
|
•
|
Letter of Intent — By signing a Letter of Intent, you may purchase Class A shares of any Natixis Fund over a 13-month period but pay sales charges as if you had purchased all shares at once. This program can save you money if you plan to invest $50,000 or more (or $100,000 or more for Loomis Sayles High Income Fund, Loomis Sayles Investment Grade Bond Fund, Loomis Sayles Strategic Alpha Fund or Loomis Sayles Strategic Income Fund) within 13 months.
|
|
•
|
Cumulative Purchase Discount — You may be entitled to a reduced sales charge if your “total investment” reaches a breakpoint for a reduced sales charge. The total investment is determined by adding the amount of your current purchase in a Fund, including the applicable sales charge, to the current public offering price of all series and classes of shares of the Natixis Funds held by you in one or more accounts. If your total investment exceeds a sales charge breakpoint in the table above, the lower sales charge applies to the entire amount of your current purchase in a Fund.
|
|
•
|
Combining Accounts — This allows you to combine shares of multiple Natixis Funds and classes for purposes of calculating your sales charge.
|
|
Individual Accounts: You may elect to combine your purchase(s) and your total investment, as defined above, with the purchases and total investment of your spouse, parents, children, siblings, grandparents, grandchildren, in-laws (of those previously mentioned), individual retirement accounts, sole proprietorships, single trust estates and any other individuals acceptable to the Distributor.
|
|
Certain Retirement Plan Accounts: The Distributor may, at its discretion, combine the purchase(s) and total investment of all qualified participants in the same retirement plan for purposes of determining the availability of a reduced sales charge.
|
|
In most instances, individual accounts may not be linked with certain retirement plan accounts for the purposes of calculating sales charges. Savings Incentive Match Plan for Employees (“SIMPLE IRA”) contributions will automatically be linked with those of other participants in the same SIMPLE IRA Plan (Class A shares only) using the Natixis Funds prototype document. Effective May 8, 2026, all share classes will be linked for the purpose of calculating sales charges. SIMPLE IRA accounts may not be linked with any other Natixis Fund account for rights of accumulation. Please refer to the SAI for more detailed information on combining accounts.
|
|
•
|
Clients of a financial intermediary that has entered into an agreement with the Distributor and has been approved by the Distributor to offer Fund shares to self-directed investment brokerage accounts that may or may not charge a transaction fee;
|
|
•
|
Any government entity that is prohibited from paying a sales charge or commission to purchase mutual fund shares;
|
|
•
|
All employees of financial intermediaries under arrangements with the Distributor (this also applies to spouses and children under the age of 21 of those mentioned);
|
|
•
|
Fund trustees, former trustees, employees of affiliates of the Natixis Funds and other individuals who are affiliated with any Natixis Fund (this also applies to any spouse, parents, children, siblings, grandparents, grandchildren and in-laws of those mentioned);
|
|
•
|
Certain Retirement Plans. The availability of this pricing may depend upon the policies and procedures of your specific financial intermediary; consult your financial adviser;
|
|
•
|
Non-discretionary and non-retirement accounts of bank trust departments or trust companies, but only if they principally engage in banking or trust activities;
|
|
•
|
Fee Based Programs of certain broker-dealers, the Advisers or the Distributor. Please consult your financial representative to determine if your fee based program is subject to additional or different conditions or fees; and
|
|
•
|
Registered Investment Advisers investing on behalf of clients in exchange for an advisory, management or consulting fee.
|
|
Year Since Purchase
|
CDSC on Shares Being Sold
|
|
1st
|
1.00%
|
|
Thereafter
|
0.00%
|
|
•
|
Is calculated based on the number of shares you are selling;
|
|
•
|
Calculation is based on either your original purchase price or the current NAV of the shares being sold, whichever is lower in order to minimize your CDSC;
|
|
•
|
Is deducted from the proceeds of the redemption unless you request, at the time of the redemption, that it be deducted from the amount remaining in your account; and
|
|
•
|
Applies to redemptions made within the time frame shown above for each class.
|
|
•
|
Increases in NAV above the purchase price;
|
|
•
|
Shares you acquired by reinvesting your dividends or capital gains distributions; or
|
|
•
|
Exchanges. However, the original purchase date of the shares from which the exchange is made determines if the newly acquired shares are subject to the CDSC when they are sold.
|
|
•
|
If you are selling more than $100,000 per day from a single fund/account and you are requesting the proceeds by check (this does not apply to IRA transfer of assets to new custodian).
|
|
•
|
If you are requesting that the proceeds check (of any amount) be made out to someone other than the registered owner(s) or sent to an address other than the address of record.
|
|
•
|
If the account registration or bank account information has changed within the past 30 days.
|
|
•
|
If you are instructing us to send the proceeds by check, wire or ACH to a bank not already active on the fund account.
|
|
Restriction
|
Situation
|
|
Each Fund may suspend the right of redemption:
|
|
|
Each Fund reserves the right to suspend account services or refuse transaction requests:
|
|
|
Each Fund may pay the redemption price in whole or in part by a distribution in-kind of readily marketable securities in lieu of cash or may take up to 7 days to pay a redemption request in order to raise capital:
|
|
|
Each Fund may withhold redemption proceeds for 10 days from the purchase date:
|
|

|
•
|
A share’s NAV is determined at the close of regular trading on the NYSE on the days the NYSE is open for trading. This is normally 4:00 p.m., Eastern time. A Fund’s shares will not be priced on the days on which the NYSE is closed for trading. In addition, a Fund’s shares will not be priced on the holidays listed in the SAI. See the section “Net Asset Value” in the SAI for more details.
|
|
•
|
The price you pay for purchasing, redeeming or exchanging a share will be based upon the NAV next calculated (plus or minus applicable sales charges as
|
|
described earlier in the Fund Summary) after your order is received by the transfer agent, SS&C Global Investor & Distribution Solutions, Inc., (rather than when the order arrives at the P.O. box) “in good order” (meaning that the order is complete and contains all necessary information).1
|
|
•
|
Requests received by the Funds after the NYSE closes will be processed based upon the NAV determined at the close of regular trading on the next day that the NYSE is open. If the transfer agent receives the order in good order prior to the NYSE market close (normally 4:00 p.m., Eastern time), the shareholder will receive that day’s NAV. Under limited circumstances, the Distributor may enter into contractual agreements pursuant to which orders received by your investment dealer before a Fund determines its NAV and transmitted to the transfer agent prior to market open on the next business day are processed at the NAV determined on the day the order was received by your investment dealer. Please contact your investment dealer to determine whether it has entered into such a contractual agreement. If your investment dealer has not entered into such a contractual agreement, your order will be processed at the NAV next determined after your investment dealer submits the order to a Fund.
|
|
•
|
If a Fund invests in foreign securities, it may have NAV changes on days when you cannot buy or sell its shares.
|
| 1 | Please see the section “How to Purchase Shares,” which provides additional information regarding who can receive a purchase order. |
|
•
|
Equity securities (including shares of closed-end investment companies and exchange-traded funds (“ETFs”)), exchange traded notes, rights, and warrants — listed equity securities are valued at the last sale price quoted on the exchange where they are traded most extensively or, if there is no reported sale during the day, the closing bid quotation as reported by a third-party pricing service. Securities traded on the NASDAQ Global Select Market, NASDAQ Global Market and NASDAQ Capital Market are valued at the NASDAQ Official Closing Price (“NOCP”), or if lacking an NOCP, at the most recent bid quotations on the applicable NASDAQ Market. Unlisted equity securities (except unlisted preferred equity securities discussed below) are valued at the last sale price quoted in the market where they are traded most extensively or, if there is no reported sale during the day, the closing bid quotation as reported by a third-party pricing service. If there is no sale price or closing bid quotation available, unlisted equity securities will be valued using evaluated bids furnished by a third-party pricing service, if available. In some foreign markets, an official close price and a last sale price may be available from the foreign exchange or market. In those cases, the official close price is used. Valuations based on information from foreign markets may be subject to the Funds’ fair value policies described below. If a right is not traded on any exchange, its value is based on the market value of the underlying security, less the cost to subscribe to the underlying security (e.g., to exercise the right), adjusted for the subscription ratio. If a warrant is not traded on any exchange, a price is obtained from a broker-dealer.
|
|
•
|
Debt securities and unlisted preferred equity securities — evaluated bids furnished to a Fund by a third-party pricing service using market information, transactions for comparable securities and various relationships between securities, if available, or bid prices obtained from broker-dealers.
|
|
•
|
Senior Loans — bid prices supplied by a third-party pricing service, if available, or bid prices obtained from broker-dealers.
|
|
•
|
Bilateral Swaps — bilateral credit default swaps are valued based on mid prices (between the bid price and the ask price) supplied by a third-party pricing service. Bilateral interest rate swaps and bilateral standardized commodity and equity index total return swaps are valued based on prices supplied by a third-party pricing service. If prices from a third-party pricing service are not available, prices from a broker-dealer may be used.
|
|
•
|
Centrally Cleared Swaps — settlement prices of the clearing house on which the contracts were traded or prices obtained from broker-dealers.
|
|
•
|
Options — domestic exchange-traded index and single name equity options contracts (including options on ETFs) are valued at the mean of the National Best Bid and Offer quotations as determined by the Options Price Reporting Authority. Foreign exchange-traded single name equity options contracts are valued at the most recent settlement price. Options contracts on foreign indices are priced at the most recent settlement price. Options on futures contracts are valued using the current settlement price on the exchange on which, over time, they are traded most extensively. Other exchange-traded options are valued at the average of the closing bid and ask quotations on the exchange on which, over time, they are traded most extensively. OTC currency options and swaptions are valued at mid prices (between the bid price and the ask price) supplied by a third-party pricing service, if available. Other OTC options contracts (including currency options and swaptions not priced through a third-party pricing service) are valued based on prices obtained from broker-dealers. Valuations based on information from foreign markets may be subject to the Funds’ fair value policies as described below.
|
|
•
|
Futures —most recent settlement price on the exchange on which the valuation designee believes that, over time, they are traded most extensively. Valuations based on information from foreign markets may be subject to the Funds’ fair value policies as described below.
|
|
•
|
Forward Foreign Currency Contracts — interpolated rates determined based on information provided by a third-party pricing service.
|
|
•
|
Mutual Funds - net asset value.
|
|
Dividend Payment Schedule
|
||
|
Annually
|
Quarterly
|
Monthly
|
|
Loomis Sayles International Growth Fund
|
Loomis Sayles Strategic Alpha Fund
|
Loomis Sayles High Income Fund
|
|
Natixis Oakmark Fund
|
|
Loomis Sayles Investment Grade Bond Fund
|
|
Natixis Oakmark International Fund
|
|
Loomis Sayles Strategic Income Fund
|
|
Natixis U.S. Equity Opportunities Fund
|
|
|
|
•
|
Participate in the Dividend Diversification Program, which allows you to have all dividends and distributions automatically invested at NAV in shares of the same class of another Natixis Fund registered in your name. Certain investment minimums and restrictions may apply. For more information about the program, see the section “Additional Investor Services;”
|
|
•
|
Receive distributions from dividends and interest in cash while reinvesting distributions from capital gains in additional shares of the same class of the Fund, or in the same class of another Natixis Fund;
|
|
•
|
Receive distributions from capital gains in cash while reinvesting distributions from dividends and interest in additional shares of the same class of the Fund, or in the same class of another Natixis Fund; or
|
|
•
|
Receive all distributions in cash.
|
|
|
Class A
|
|||||||||
|
|
Year Ended
December 31, 2025 |
Year Ended
December 31, 2024 |
Year Ended
December 31, 2023 |
Year Ended
December 31, 2022 |
Year Ended
December 31, 2021 |
|||||
|
Net asset value, beginning of the period
|
$
|
3.61
|
$
|
3.55
|
$
|
3.50
|
$
|
4.29
|
$
|
4.35
|
|
INCOME (LOSS) FROM INVESTMENT OPERATIONS:
|
|
|
|
|
|
|
|
|
|
|
|
Net investment income(a)
|
|
0.23
|
|
0.23
|
|
0.21
|
|
0.19
|
|
0.17
|
|
Net realized and unrealized gain (loss)
|
|
0.08
|
|
0.08
|
|
0.11
|
|
(0.77
)
|
|
(0.05
)
|
|
Total from Investment Operations
|
|
0.31
|
|
0.31
|
|
0.32
|
|
(0.58
)
|
|
0.12
|
|
LESS DISTRIBUTIONS FROM:
|
|
|
|
|
|
|
|
|
|
|
|
Net investment income
|
|
(0.23
)
|
|
(0.25
)
|
|
(0.27
)
|
|
(0.21
)
|
|
(0.18
)
|
|
Net asset value, end of the period
|
$
|
3.69
|
$
|
3.61
|
$
|
3.55
|
$
|
3.50
|
$
|
4.29
|
|
Total return(b)(c)
|
|
8.88
%
|
|
9.08
%
|
|
9.53
%
|
|
(13.66
)%
|
|
2.87
%
|
|
RATIOS TO AVERAGE NET ASSETS:
|
|
|
|
|
|
|
|
|
|
|
|
Net assets, end of the period (000’s)
|
$
|
14,925
|
$
|
16,770
|
$
|
16,031
|
$
|
19,108
|
$
|
20,470
|
|
Net expenses(d)
|
|
0.95
%
|
|
0.95
%
|
|
0.98
%
(e)
|
|
1.00
%
|
|
1.00
%
|
|
Gross expenses
|
|
1.33
%
|
|
1.51
%
|
|
1.40
%
|
|
1.18
%
|
|
1.19
%
|
|
Net investment income
|
|
6.22
%
|
|
6.54
%
|
|
6.10
%
|
|
5.13
%
|
|
3.83
%
|
|
Portfolio turnover rate
|
|
107
%
|
|
106
%
|
|
40
%
|
|
53
%
|
|
67
%
|
|
(a)
|
Per share net investment income has been calculated using the average shares outstanding during the period.
|
|
(b)
|
A sales charge for Class A shares is not reflected in total return calculations.
|
|
(c)
|
Had certain expenses not been waived/reimbursed during the period, total returns would have been lower.
|
|
(d)
|
The investment adviser agreed to waive its fees and/or reimburse a portion of the Fund’s expenses during the period. Without this waiver/reimbursement, expenses would have been higher.
|
|
(e)
|
Effective July 1, 2023, the expense limit decreased from 1.00% to 0.95%.
|
|
|
Class C
|
|||||||||
|
|
Year Ended
December 31, 2025 |
Year Ended
December 31, 2024 |
Year Ended
December 31, 2023 |
Year Ended
December 31, 2022 |
Year Ended
December 31, 2021 |
|||||
|
Net asset value, beginning of the period
|
$
|
3.63
|
$
|
3.57
|
$
|
3.51
|
$
|
4.31
|
$
|
4.37
|
|
INCOME (LOSS) FROM INVESTMENT OPERATIONS:
|
|
|
|
|
|
|
|
|
|
|
|
Net investment income(a)
|
|
0.20
|
|
0.21
|
|
0.19
|
|
0.16
|
|
0.14
|
|
Net realized and unrealized gain (loss)
|
|
0.08
|
|
0.07
|
|
0.11
|
|
(0.78
)
|
|
(0.05
)
|
|
Total from Investment Operations
|
|
0.28
|
|
0.28
|
|
0.30
|
|
(0.62
)
|
|
0.09
|
|
LESS DISTRIBUTIONS FROM:
|
|
|
|
|
|
|
|
|
|
|
|
Net investment income
|
|
(0.20
)
|
|
(0.22
)
|
|
(0.24
)
|
|
(0.18
)
|
|
(0.15
)
|
|
Net asset value, end of the period
|
$
|
3.71
|
$
|
3.63
|
$
|
3.57
|
$
|
3.51
|
$
|
4.31
|
|
Total return(b)(c)
|
|
7.99
%
|
|
8.19
%
|
|
8.94
%
|
|
(14.50
)%
|
|
2.07
%
|
|
RATIOS TO AVERAGE NET ASSETS:
|
|
|
|
|
|
|
|
|
|
|
|
Net assets, end of the period (000’s)
|
$
|
419
|
$
|
558
|
$
|
754
|
$
|
1,182
|
$
|
1,795
|
|
Net expenses(d)
|
|
1.70
%
|
|
1.70
%
|
|
1.73
%
(e)
|
|
1.75
%
|
|
1.75
%
|
|
Gross expenses
|
|
2.08
%
|
|
2.26
%
|
|
2.15
%
|
|
1.93
%
|
|
1.94
%
|
|
Net investment income
|
|
5.46
%
|
|
5.85
%
|
|
5.28
%
|
|
4.34
%
|
|
3.14
%
|
|
Portfolio turnover rate
|
|
107
%
|
|
106
%
|
|
40
%
|
|
53
%
|
|
67
%
|
|
(a)
|
Per share net investment income has been calculated using the average shares outstanding during the period.
|
|
(b)
|
A contingent deferred sales charge for Class C shares is not reflected in total return calculations.
|
|
(c)
|
Had certain expenses not been waived/reimbursed during the period, total returns would have been lower.
|
|
(d)
|
The investment adviser agreed to waive its fees and/or reimburse a portion of the Fund’s expenses during the period. Without this waiver/reimbursement, expenses would have been higher.
|
|
(e)
|
Effective July 1, 2023, the expense limit decreased from 1.75% to 1.70%.
|
|
|
Class N
|
|||||||||
|
|
Year Ended
December 31, 2025 |
Year Ended
December 31, 2024 |
Year Ended
December 31, 2023 |
Year Ended
December 31, 2022 |
Year Ended
December 31, 2021 |
|||||
|
Net asset value, beginning of the period
|
$
|
3.61
|
$
|
3.55
|
$
|
3.50
|
$
|
4.29
|
$
|
4.36
|
|
INCOME (LOSS) FROM INVESTMENT OPERATIONS:
|
|
|
|
|
|
|
|
|
|
|
|
Net investment income(a)
|
|
0.24
|
|
0.22
|
|
0.23
|
|
0.20
|
|
0.18
|
|
Net realized and unrealized gain (loss)
|
|
0.08
|
|
0.10
|
|
0.10
|
|
(0.77
)
|
|
(0.05
)
|
|
Total from Investment Operations
|
|
0.32
|
|
0.32
|
|
0.33
|
|
(0.57
)
|
|
0.13
|
|
LESS DISTRIBUTIONS FROM:
|
|
|
|
|
|
|
|
|
|
|
|
Net investment income
|
|
(0.24
)
|
|
(0.26
)
|
|
(0.28
)
|
|
(0.22
)
|
|
(0.20
)
|
|
Net asset value, end of the period
|
$
|
3.69
|
$
|
3.61
|
$
|
3.55
|
$
|
3.50
|
$
|
4.29
|
|
Total return(b)
|
|
9.19
%
|
|
9.40
%
|
|
9.85
%
|
|
(13.40
)%
|
|
2.95
%
|
|
RATIOS TO AVERAGE NET ASSETS:
|
|
|
|
|
|
|
|
|
|
|
|
Net assets, end of the period (000’s)
|
$
|
33,706
|
$
|
19,912
|
$
|
173
|
$
|
132
|
$
|
105
|
|
Net expenses(c)
|
|
0.65
%
|
|
0.65
%
|
|
0.67
%
(d)
|
|
0.70
%
|
|
0.70
%
|
|
Gross expenses
|
|
1.02
%
|
|
1.31
%
|
|
1.82
%
|
|
1.80
%
|
|
0.86
%
|
|
Net investment income
|
|
6.56
%
|
|
6.35
%
|
|
6.47
%
|
|
5.46
%
|
|
4.10
%
|
|
Portfolio turnover rate
|
|
107
%
|
|
106
%
|
|
40
%
|
|
53
%
|
|
67
%
|
|
(a)
|
Per share net investment income has been calculated using the average shares outstanding during the period.
|
|
(b)
|
Had certain expenses not been waived/reimbursed during the period, total returns would have been lower.
|
|
(c)
|
The investment adviser agreed to waive its fees and/or reimburse a portion of the Fund’s expenses during the period. Without this waiver/reimbursement, expenses would have been higher.
|
|
(d)
|
Effective July 1, 2023, the expense limit decreased from 0.70% to 0.65%.
|
|
|
Class Y
|
|||||||||
|
|
Year Ended
December 31, 2025 |
Year Ended
December 31, 2024 |
Year Ended
December 31, 2023 |
Year Ended
December 31, 2022 |
Year Ended
December 31, 2021 |
|||||
|
Net asset value, beginning of the period
|
$
|
3.60
|
$
|
3.55
|
$
|
3.49
|
$
|
4.28
|
$
|
4.34
|
|
INCOME (LOSS) FROM INVESTMENT OPERATIONS:
|
|
|
|
|
|
|
|
|
|
|
|
Net investment income(a)
|
|
0.24
|
|
0.24
|
|
0.22
|
|
0.20
|
|
0.18
|
|
Net realized and unrealized gain (loss)
|
|
0.08
|
|
0.07
|
|
0.12
|
|
(0.77
)
|
|
(0.05
)
|
|
Total from Investment Operations
|
|
0.32
|
|
0.31
|
|
0.34
|
|
(0.57
)
|
|
0.13
|
|
LESS DISTRIBUTIONS FROM:
|
|
|
|
|
|
|
|
|
|
|
|
Net investment income
|
|
(0.24
)
|
|
(0.26
)
|
|
(0.28
)
|
|
(0.22
)
|
|
(0.19
)
|
|
Net asset value, end of the period
|
$
|
3.68
|
$
|
3.60
|
$
|
3.55
|
$
|
3.49
|
$
|
4.28
|
|
Total return(b)
|
|
9.16
%
|
|
9.05
%
|
|
10.13
%
|
|
(13.47
)%
|
|
3.15
%
|
|
RATIOS TO AVERAGE NET ASSETS:
|
|
|
|
|
|
|
|
|
|
|
|
Net assets, end of the period (000’s)
|
$
|
29,601
|
$
|
26,955
|
$
|
28,150
|
$
|
97,059
|
$
|
104,957
|
|
Net expenses(c)
|
|
0.70
%
|
|
0.70
%
|
|
0.73
%
(d)
|
|
0.75
%
|
|
0.75
%
|
|
Gross expenses
|
|
1.08
%
|
|
1.26
%
|
|
1.16
%
|
|
0.93
%
|
|
0.95
%
|
|
Net investment income
|
|
6.48
%
|
|
6.80
%
|
|
6.17
%
|
|
5.39
%
|
|
4.16
%
|
|
Portfolio turnover rate
|
|
107
%
|
|
106
%
|
|
40
%
|
|
53
%
|
|
67
%
|
|
(a)
|
Per share net investment income has been calculated using the average shares outstanding during the period.
|
|
(b)
|
Had certain expenses not been waived/reimbursed during the period, total returns would have been lower.
|
|
(c)
|
The investment adviser agreed to waive its fees and/or reimburse a portion of the Fund’s expenses during the period. Without this waiver/reimbursement, expenses would have been higher.
|
|
(d)
|
Effective July 1, 2023, the expense limit decreased from 0.75% to 0.70%.
|
|
|
Class A
|
|||||||||
|
|
Year Ended
December 31, 2025 |
Year Ended
December 31, 2024 |
Year Ended
December 31, 2023 |
Year Ended
December 31, 2022 |
Year Ended
December 31, 2021 |
|||||
|
Net asset value, beginning of the period
|
$
|
10.60
|
$
|
9.42
|
$
|
7.84
|
$
|
9.57
|
$
|
10.13
|
|
INCOME (LOSS) FROM INVESTMENT OPERATIONS:
|
|
|
|
|
|
|
|
|
|
|
|
Net investment income (loss)(a)
|
|
0.03
|
|
0.03
(b)
|
|
0.01
|
|
0.02
|
|
(0.01
)
|
|
Net realized and unrealized gain (loss)
|
|
0.99
|
|
1.20
|
|
1.60
|
|
(1.71
)
|
|
(0.41
)
|
|
Total from Investment Operations
|
|
1.02
|
|
1.23
|
|
1.61
|
|
(1.69
)
|
|
(0.42
)
|
|
LESS DISTRIBUTIONS FROM:
|
|
|
|
|
|
|
|
|
|
|
|
Net investment income
|
|
(0.03
)
|
|
(0.05
)
|
|
(0.03
)
|
|
(0.04
)
|
|
(0.01
)
|
|
Net realized capital gains
|
|
(0.14
)
|
|
—
|
|
—
|
|
—
|
|
(0.13
)
|
|
Total Distributions
|
|
(0.17
)
|
|
(0.05
)
|
|
(0.03
)
|
|
(0.04
)
|
|
(0.14
)
|
|
Net asset value, end of the period
|
$
|
11.45
|
$
|
10.60
|
$
|
9.42
|
$
|
7.84
|
$
|
9.57
|
|
Total return(c)(d)
|
|
9.89
%
|
|
13.09
%
(b)
|
|
20.56
%
|
|
(17.71
)%
|
|
(4.07
)%
|
|
RATIOS TO AVERAGE NET ASSETS:
|
|
|
|
|
|
|
|
|
|
|
|
Net assets, end of the period (000’s)
|
$
|
587
|
$
|
316
|
$
|
151
|
$
|
125
|
$
|
113
|
|
Net expenses(e)
|
|
1.20
%
|
|
1.21
%
(f)
|
|
1.20
%
|
|
1.20
%
|
|
1.20
%
|
|
Gross expenses
|
|
1.92
%
(g)
|
|
1.75
%
(f)
|
|
1.87
%
|
|
2.05
%
|
|
2.71
%
|
|
Net investment income (loss)
|
|
0.29
%
|
|
0.28
%
(b)
|
|
0.12
%
|
|
0.26
%
|
|
(0.07
)%
|
|
Portfolio turnover rate
|
|
9
%
|
|
36
%
|
|
5
%
|
|
11
%
|
|
9
%
|
|
(a)
|
Per share net investment income (loss) has been calculated using the average shares outstanding during the period.
|
|
(b)
|
Includes a non-recurring dividend. Without this dividend, net investment income per share would have been $0.01, total return would have been 12.98% and the ratio of net investment income to average net assets would have been 0.12%.
|
|
(c)
|
A sales charge for Class A shares is not reflected in total return calculations.
|
|
(d)
|
Had certain expenses not been waived/reimbursed during the period, total returns would have been lower.
|
|
(e)
|
The investment adviser agreed to waive its fees and/or reimburse a portion of the Fund’s expenses during the period. Without this waiver/reimbursement, expenses would have been higher.
|
|
(f)
|
Includes interest expense. Without this expense the ratio of net expenses would have been 1.20% and the ratio of gross expenses would have been 1.74%.
|
|
(g)
|
Includes transfer agent fees and expenses before expense offsets, had offsets been included the ratio of gross expenses would have been 1.91%.
|
|
|
Class C
|
|||||||||
|
|
Year Ended
December 31, 2025 |
Year Ended
December 31, 2024 |
Year Ended
December 31, 2023 |
Year Ended
December 31, 2022 |
Year Ended
December 31, 2021 |
|||||
|
Net asset value, beginning of the period
|
$
|
10.42
|
$
|
9.29
|
$
|
7.77
|
$
|
9.51
|
$
|
10.13
|
|
INCOME (LOSS) FROM INVESTMENT OPERATIONS:
|
|
|
|
|
|
|
|
|
|
|
|
Net investment income (loss)(a)
|
|
(0.06
)
|
|
(0.05
)
(b)
|
|
(0.06
)
|
|
0.02
|
|
(0.09
)
|
|
Net realized and unrealized gain (loss)
|
|
0.97
|
|
1.18
|
|
1.58
|
|
(1.76
)
|
|
(0.40
)
|
|
Total from Investment Operations
|
|
0.91
|
|
1.13
|
|
1.52
|
|
(1.74
)
|
|
(0.49
)
|
|
LESS DISTRIBUTIONS FROM:
|
|
|
|
|
|
|
|
|
|
|
|
Net investment income
|
|
—
|
|
(0.00
)
(c)
|
|
—
|
|
—
|
|
(0.00
)
(c)
|
|
Net realized capital gains
|
|
(0.14
)
|
|
—
|
|
—
|
|
—
|
|
(0.13
)
|
|
Total Distributions
|
|
(0.14
)
|
|
(0.00
)
|
|
—
|
|
—
|
|
(0.13
)
|
|
Net asset value, end of the period
|
$
|
11.19
|
$
|
10.42
|
$
|
9.29
|
$
|
7.77
|
$
|
9.51
|
|
Total return(d)(e)
|
|
9.01
%
|
|
12.19
%
(b)
|
|
19.56
%
|
|
(18.30
)%
|
|
(4.79
)%
|
|
RATIOS TO AVERAGE NET ASSETS:
|
|
|
|
|
|
|
|
|
|
|
|
Net assets, end of the period (000’s)
|
$
|
1
|
$
|
1
|
$
|
1
|
$
|
1
|
$
|
38
|
|
Net expenses(f)
|
|
1.95
%
|
|
1.95
%
(g)
|
|
1.95
%
|
|
1.95
%
|
|
1.95
%
|
|
Gross expenses
|
|
2.64
%
(h)
|
|
2.57
%
(g)
|
|
2.53
%
|
|
2.79
%
|
|
3.46
%
|
|
Net investment income (loss)
|
|
(0.57
)%
|
|
(0.55
)%
(b)
|
|
(0.68
)%
|
|
0.21
%
|
|
(0.90
)%
|
|
Portfolio turnover rate
|
|
9
%
|
|
36
%
|
|
5
%
|
|
11
%
|
|
9
%
|
|
(a)
|
Per share net investment income (loss) has been calculated using the average shares outstanding during the period.
|
|
(b)
|
Includes a non-recurring dividend. Without this dividend, net investment loss per share would have been $(0.07), total return would have been 12.08% and the ratio of net investment loss to average net assets would have been (0.75)%.
|
|
(c)
|
Amount rounds to less than $0.01 per share.
|
|
(d)
|
A contingent deferred sales charge for Class C shares is not reflected in total return calculations.
|
|
(e)
|
Had certain expenses not been waived/reimbursed during the period, total returns would have been lower.
|
|
(f)
|
The investment adviser agreed to waive its fees and/or reimburse a portion of the Fund’s expenses during the period. Without this waiver/reimbursement, expenses would have been higher.
|
|
(g)
|
Includes interest expense of less than 0.01%.
|
|
(h)
|
Includes transfer agent fees and expenses before expense offsets, had offsets been included the ratio of gross expenses would have been 2.63%.
|
|
|
Class N
|
|||||||||
|
|
Year Ended
December 31, 2025 |
Year Ended
December 31, 2024 |
Year Ended
December 31, 2023 |
Year Ended
December 31, 2022 |
Year Ended
December 31, 2021 |
|||||
|
Net asset value, beginning of the period
|
$
|
10.63
|
$
|
9.44
|
$
|
7.85
|
$
|
9.58
|
$
|
10.13
|
|
INCOME (LOSS) FROM INVESTMENT OPERATIONS:
|
|
|
|
|
|
|
|
|
|
|
|
Net investment income(a)
|
|
0.06
|
|
0.05
(b)
|
|
0.04
|
|
0.05
|
|
0.03
|
|
Net realized and unrealized gain (loss)
|
|
0.99
|
|
1.21
|
|
1.61
|
|
(1.72
)
|
|
(0.42
)
|
|
Total from Investment Operations
|
|
1.05
|
|
1.26
|
|
1.65
|
|
(1.67
)
|
|
(0.39
)
|
|
LESS DISTRIBUTIONS FROM:
|
|
|
|
|
|
|
|
|
|
|
|
Net investment income
|
|
(0.06
)
|
|
(0.07
)
|
|
(0.06
)
|
|
(0.06
)
|
|
(0.03
)
|
|
Net realized capital gains
|
|
(0.14
)
|
|
—
|
|
—
|
|
—
|
|
(0.13
)
|
|
Total Distributions
|
|
(0.20
)
|
|
(0.07
)
|
|
(0.06
)
|
|
(0.06
)
|
|
(0.16
)
|
|
Net asset value, end of the period
|
$
|
11.48
|
$
|
10.63
|
$
|
9.44
|
$
|
7.85
|
$
|
9.58
|
|
Total return(c)
|
|
10.15
%
|
|
13.36
%
(b)
|
|
20.99
%
|
|
(17.47
)%
|
|
(3.77
)%
|
|
RATIOS TO AVERAGE NET ASSETS:
|
|
|
|
|
|
|
|
|
|
|
|
Net assets, end of the period (000’s)
|
$
|
10,970
|
$
|
10,089
|
$
|
25,661
|
$
|
21,331
|
$
|
22,953
|
|
Net expenses(d)
|
|
0.90
%
|
|
0.90
%
(e)
|
|
0.90
%
|
|
0.90
%
|
|
0.90
%
|
|
Gross expenses
|
|
1.56
%
|
|
1.39
%
(e)
|
|
1.47
%
|
|
1.67
%
|
|
1.58
%
|
|
Net investment income
|
|
0.51
%
|
|
0.47
%
(b)
|
|
0.41
%
|
|
0.62
%
|
|
0.29
%
|
|
Portfolio turnover rate
|
|
9
%
|
|
36
%
|
|
5
%
|
|
11
%
|
|
9
%
|
|
(a)
|
Per share net investment income has been calculated using the average shares outstanding during the period.
|
|
(b)
|
Includes a non-recurring dividend. Without this dividend, net investment income per share would have been $0.03, total return would have been 13.26% and the ratio of net investment income to average net assets would have been 0.29%.
|
|
(c)
|
Had certain expenses not been waived/reimbursed during the period, total returns would have been lower.
|
|
(d)
|
The investment adviser agreed to waive its fees and/or reimburse a portion of the Fund’s expenses during the period. Without this waiver/reimbursement, expenses would have been higher.
|
|
(e)
|
Includes interest expense of less than 0.01%.
|
|
|
Class Y
|
|||||||||
|
|
Year Ended
December 31, 2025 |
Year Ended
December 31, 2024 |
Year Ended
December 31, 2023 |
Year Ended
December 31, 2022 |
Year Ended
December 31, 2021 |
|||||
|
Net asset value, beginning of the period
|
$
|
10.63
|
$
|
9.44
|
$
|
7.85
|
$
|
9.58
|
$
|
10.13
|
|
INCOME (LOSS) FROM INVESTMENT OPERATIONS:
|
|
|
|
|
|
|
|
|
|
|
|
Net investment income(a)
|
|
0.05
|
|
0.06
(b)
|
|
0.03
|
|
0.04
|
|
0.02
|
|
Net realized and unrealized gain (loss)
|
|
0.99
|
|
1.20
|
|
1.61
|
|
(1.72
)
|
|
(0.41
)
|
|
Total from Investment Operations
|
|
1.04
|
|
1.26
|
|
1.64
|
|
(1.68
)
|
|
(0.39
)
|
|
LESS DISTRIBUTIONS FROM:
|
|
|
|
|
|
|
|
|
|
|
|
Net investment income
|
|
(0.05
)
|
|
(0.07
)
|
|
(0.05
)
|
|
(0.05
)
|
|
(0.03
)
|
|
Net realized capital gains
|
|
(0.14
)
|
|
—
|
|
—
|
|
—
|
|
(0.13
)
|
|
Total Distributions
|
|
(0.19
)
|
|
(0.07
)
|
|
(0.05
)
|
|
(0.05
)
|
|
(0.16
)
|
|
Net asset value, end of the period
|
$
|
11.48
|
$
|
10.63
|
$
|
9.44
|
$
|
7.85
|
$
|
9.58
|
|
Total return(c)
|
|
10.09
%
|
|
13.45
%
(b)
|
|
20.81
%
|
|
(17.50
)%
|
|
(3.81
)%
|
|
RATIOS TO AVERAGE NET ASSETS:
|
|
|
|
|
|
|
|
|
|
|
|
Net assets, end of the period (000’s)
|
$
|
20,357
|
$
|
18,657
|
$
|
4,911
|
$
|
3,124
|
$
|
222
|
|
Net expenses(d)
|
|
0.95
%
|
|
0.96
%
(e)
|
|
0.95
%
|
|
0.95
%
|
|
0.95
%
|
|
Gross expenses
|
|
1.67
%
(f)
|
|
1.50
%
(e)
|
|
1.62
%
|
|
1.80
%
|
|
2.46
%
|
|
Net investment income
|
|
0.46
%
|
|
0.54
%
(b)
|
|
0.32
%
|
|
0.47
%
|
|
0.19
%
|
|
Portfolio turnover rate
|
|
9
%
|
|
36
%
|
|
5
%
|
|
11
%
|
|
9
%
|
|
(a)
|
Per share net investment income has been calculated using the average shares outstanding during the period.
|
|
(b)
|
Includes a non-recurring dividend. Without this dividend, net investment income per share would have been $0.04, total return would have been 13.23% and the ratio of net investment income to average net assets would have been 0.34%.
|
|
(c)
|
Had certain expenses not been waived/reimbursed during the period, total returns would have been lower.
|
|
(d)
|
The investment adviser agreed to waive its fees and/or reimburse a portion of the Fund’s expenses during the period. Without this waiver/reimbursement, expenses would have been higher.
|
|
(e)
|
Includes interest expense. Without this expense the ratio of net expenses would have been 0.95% and the ratio of gross expenses would have been 1.49%.
|
|
(f)
|
Includes transfer agent fees and expenses before expense offsets, had offsets been included the ratio of gross expenses would have been 1.66%.
|
|
|
Class A
|
|||||||||
|
|
Year Ended
December 31, 2025 |
Year Ended
December 31, 2024 |
Year Ended
December 31, 2023 |
Year Ended
December 31, 2022 |
Year Ended
December 31, 2021 |
|||||
|
Net asset value, beginning of the period
|
$
|
9.71
|
$
|
9.92
|
$
|
9.63
|
$
|
11.22
|
$
|
11.65
|
|
INCOME (LOSS) FROM INVESTMENT OPERATIONS:
|
|
|
|
|
|
|
|
|
|
|
|
Net investment income(a)
|
|
0.45
|
|
0.45
|
|
0.39
|
|
0.28
|
|
0.26
|
|
Net realized and unrealized gain (loss)
|
|
0.20
|
|
(0.21
)
|
|
0.30
|
|
(1.58
)
|
|
(0.26
)
|
|
Total from Investment Operations
|
|
0.65
|
|
0.24
|
|
0.69
|
|
(1.30
)
|
|
0.00
(b)
|
|
LESS DISTRIBUTIONS FROM:
|
|
|
|
|
|
|
|
|
|
|
|
Net investment income
|
|
(0.46
)
|
|
(0.45
)
|
|
(0.40
)
|
|
(0.28
)
|
|
(0.26
)
|
|
Net realized capital gains
|
|
—
|
|
—
|
|
—
|
|
(0.01
)
|
|
(0.17
)
|
|
Total Distributions
|
|
(0.46
)
|
|
(0.45
)
|
|
(0.40
)
|
|
(0.29
)
|
|
(0.43
)
|
|
Net asset value, end of the period
|
$
|
9.90
|
$
|
9.71
|
$
|
9.92
|
$
|
9.63
|
$
|
11.22
|
|
Total return(c)(d)
|
|
6.80
%
|
|
2.44
%
|
|
7.34
%
|
|
(11.62
)%
|
|
0.07
%
|
|
RATIOS TO AVERAGE NET ASSETS:
|
|
|
|
|
|
|
|
|
|
|
|
Net assets, end of the period (000’s)
|
$
|
759,813
|
$
|
776,083
|
$
|
717,999
|
$
|
641,311
|
$
|
793,271
|
|
Net expenses(e)
|
|
0.74
%
(f)
|
|
0.74
%
|
|
0.74
%
|
|
0.75
%
(g)
|
|
0.75
%
|
|
Gross expenses
|
|
0.80
%
|
|
0.81
%
|
|
0.81
%
|
|
0.80
%
|
|
0.79
%
|
|
Net investment income
|
|
4.61
%
|
|
4.55
%
|
|
4.04
%
|
|
2.71
%
|
|
2.24
%
|
|
Portfolio turnover rate
|
|
51
%
|
|
39
%
|
|
25
%
|
|
31
%
|
|
27
%
|
|
(a)
|
Per share net investment income has been calculated using the average shares outstanding during the period.
|
|
(b)
|
Amount rounds to less than $0.01 per share.
|
|
(c)
|
A sales charge for Class A shares is not reflected in total return calculations.
|
|
(d)
|
Had certain expenses not been waived/reimbursed during the period, total returns would have been lower.
|
|
(e)
|
The investment adviser agreed to waive its fees and/or reimburse a portion of the Fund’s expenses during the period. Without this waiver/reimbursement, expenses would have been higher.
|
|
(f)
|
Effective July 1, 2025, the expense limit decreased from 0.74% to 0.73%.
|
|
(g)
|
Effective July 1, 2022, the expense limit decreased from 0.75% to 0.74%.
|
|
|
Class C
|
|||||||||
|
|
Year Ended
December 31, 2025 |
Year Ended
December 31, 2024 |
Year Ended
December 31, 2023 |
Year Ended
December 31, 2022 |
Year Ended
December 31, 2021 |
|||||
|
Net asset value, beginning of the period
|
$
|
9.57
|
$
|
9.78
|
$
|
9.51
|
$
|
11.07
|
$
|
11.51
|
|
INCOME (LOSS) FROM INVESTMENT OPERATIONS:
|
|
|
|
|
|
|
|
|
|
|
|
Net investment income(a)
|
|
0.37
|
|
0.37
|
|
0.31
|
|
0.20
|
|
0.17
|
|
Net realized and unrealized gain (loss)
|
|
0.20
|
|
(0.20
)
|
|
0.29
|
|
(1.55
)
|
|
(0.26
)
|
|
Total from Investment Operations
|
|
0.57
|
|
0.17
|
|
0.60
|
|
(1.35
)
|
|
(0.09
)
|
|
LESS DISTRIBUTIONS FROM:
|
|
|
|
|
|
|
|
|
|
|
|
Net investment income
|
|
(0.39
)
|
|
(0.38
)
|
|
(0.33
)
|
|
(0.20
)
|
|
(0.18
)
|
|
Net realized capital gains
|
|
—
|
|
—
|
|
—
|
|
(0.01
)
|
|
(0.17
)
|
|
Total Distributions
|
|
(0.39
)
|
|
(0.38
)
|
|
(0.33
)
|
|
(0.21
)
|
|
(0.35
)
|
|
Net asset value, end of the period
|
$
|
9.75
|
$
|
9.57
|
$
|
9.78
|
$
|
9.51
|
$
|
11.07
|
|
Total return(b)(c)
|
|
6.01
%
|
|
1.71
%
|
|
6.43
%
|
|
(12.26
)%
|
|
(0.70
)%
|
|
RATIOS TO AVERAGE NET ASSETS:
|
|
|
|
|
|
|
|
|
|
|
|
Net assets, end of the period (000’s)
|
$
|
78,600
|
$
|
78,152
|
$
|
68,821
|
$
|
56,520
|
$
|
80,099
|
|
Net expenses(d)
|
|
1.48
%
(e)
|
|
1.49
%
|
|
1.49
%
|
|
1.50
%
(f)
|
|
1.50
%
|
|
Gross expenses
|
|
1.55
%
|
|
1.56
%
|
|
1.56
%
|
|
1.55
%
|
|
1.54
%
|
|
Net investment income
|
|
3.86
%
|
|
3.80
%
|
|
3.29
%
|
|
1.94
%
|
|
1.50
%
|
|
Portfolio turnover rate
|
|
51
%
|
|
39
%
|
|
25
%
|
|
31
%
|
|
27
%
|
|
(a)
|
Per share net investment income has been calculated using the average shares outstanding during the period.
|
|
(b)
|
A contingent deferred sales charge for Class C shares is not reflected in total return calculations.
|
|
(c)
|
Had certain expenses not been waived/reimbursed during the period, total returns would have been lower.
|
|
(d)
|
The investment adviser agreed to waive its fees and/or reimburse a portion of the Fund’s expenses during the period. Without this waiver/reimbursement, expenses would have been higher.
|
|
(e)
|
Effective July 1, 2025, the expense limit decreased from 1.49% to 1.48%.
|
|
(f)
|
Effective July 1, 2022, the expense limit decreased from 1.50% to 1.49%.
|
|
|
Class N
|
|||||||||
|
|
Year Ended
December 31, 2025 |
Year Ended
December 31, 2024 |
Year Ended
December 31, 2023 |
Year Ended
December 31, 2022 |
Year Ended
December 31, 2021 |
|||||
|
Net asset value, beginning of the period
|
$
|
9.71
|
$
|
9.92
|
$
|
9.64
|
$
|
11.22
|
$
|
11.65
|
|
INCOME (LOSS) FROM INVESTMENT OPERATIONS:
|
|
|
|
|
|
|
|
|
|
|
|
Net investment income(a)
|
|
0.48
|
|
0.48
|
|
0.42
|
|
0.31
|
|
0.29
|
|
Net realized and unrealized gain (loss)
|
|
0.20
|
|
(0.21
)
|
|
0.29
|
|
(1.57
)
|
|
(0.25
)
|
|
Total from Investment Operations
|
|
0.68
|
|
0.27
|
|
0.71
|
|
(1.26
)
|
|
0.04
|
|
LESS DISTRIBUTIONS FROM:
|
|
|
|
|
|
|
|
|
|
|
|
Net investment income
|
|
(0.49
)
|
|
(0.48
)
|
|
(0.43
)
|
|
(0.31
)
|
|
(0.30
)
|
|
Net realized capital gains
|
|
—
|
|
—
|
|
—
|
|
(0.01
)
|
|
(0.17
)
|
|
Total Distributions
|
|
(0.49
)
|
|
(0.48
)
|
|
(0.43
)
|
|
(0.32
)
|
|
(0.47
)
|
|
Net asset value, end of the period
|
$
|
9.90
|
$
|
9.71
|
$
|
9.92
|
$
|
9.64
|
$
|
11.22
|
|
Total return(b)
|
|
7.12
%
|
|
2.74
%
|
|
7.55
%
|
|
(11.26
)%
|
|
0.37
%
|
|
RATIOS TO AVERAGE NET ASSETS:
|
|
|
|
|
|
|
|
|
|
|
|
Net assets, end of the period (000’s)
|
$
|
3,613,568
|
$
|
2,763,066
|
$
|
1,496,893
|
$
|
1,348,621
|
$
|
1,473,020
|
|
Net expenses(c)
|
|
0.43
%
(d)
|
|
0.44
%
|
|
0.44
%
|
|
0.45
%
(e)
|
|
0.45
%
|
|
Gross expenses
|
|
0.47
%
|
|
0.48
%
|
|
0.47
%
|
|
0.47
%
|
|
0.47
%
|
|
Net investment income
|
|
4.92
%
|
|
4.86
%
|
|
4.32
%
|
|
3.02
%
|
|
2.53
%
|
|
Portfolio turnover rate
|
|
51
%
|
|
39
%
|
|
25
%
|
|
31
%
|
|
27
%
|
|
(a)
|
Per share net investment income has been calculated using the average shares outstanding during the period.
|
|
(b)
|
Had certain expenses not been waived/reimbursed during the period, total returns would have been lower.
|
|
(c)
|
The investment adviser agreed to waive its fees and/or reimburse a portion of the Fund’s expenses during the period. Without this waiver/reimbursement, expenses would have been higher.
|
|
(d)
|
Effective July 1, 2025, the expense limit decreased from 0.44% to 0.43%.
|
|
(e)
|
Effective July 1, 2022, the expense limit decreased from 0.45% to 0.44%.
|
|
|
Class Y
|
|||||||||
|
|
Year Ended
December 31, 2025 |
Year Ended
December 31, 2024 |
Year Ended
December 31, 2023 |
Year Ended
December 31, 2022 |
Year Ended
December 31, 2021 |
|||||
|
Net asset value, beginning of the period
|
$
|
9.72
|
$
|
9.92
|
$
|
9.64
|
$
|
11.22
|
$
|
11.66
|
|
INCOME (LOSS) FROM INVESTMENT OPERATIONS:
|
|
|
|
|
|
|
|
|
|
|
|
Net investment income(a)
|
|
0.48
|
|
0.47
|
|
0.42
|
|
0.30
|
|
0.29
|
|
Net realized and unrealized gain (loss)
|
|
0.18
|
|
(0.20
)
|
|
0.28
|
|
(1.56
)
|
|
(0.27
)
|
|
Total from Investment Operations
|
|
0.66
|
|
0.27
|
|
0.70
|
|
(1.26
)
|
|
0.02
|
|
LESS DISTRIBUTIONS FROM:
|
|
|
|
|
|
|
|
|
|
|
|
Net investment income
|
|
(0.48
)
|
|
(0.47
)
|
|
(0.42
)
|
|
(0.31
)
|
|
(0.29
)
|
|
Net realized capital gains
|
|
—
|
|
—
|
|
—
|
|
(0.01
)
|
|
(0.17
)
|
|
Total Distributions
|
|
(0.48
)
|
|
(0.47
)
|
|
(0.42
)
|
|
(0.32
)
|
|
(0.46
)
|
|
Net asset value, end of the period
|
$
|
9.90
|
$
|
9.72
|
$
|
9.92
|
$
|
9.64
|
$
|
11.22
|
|
Total return(b)
|
|
6.96
%
|
|
2.80
%
|
|
7.50
%
|
|
(11.31
)%
|
|
0.24
%
|
|
RATIOS TO AVERAGE NET ASSETS:
|
|
|
|
|
|
|
|
|
|
|
|
Net assets, end of the period (000’s)
|
$
|
12,548,305
|
$
|
11,221,966
|
$
|
7,942,477
|
$
|
4,833,608
|
$
|
3,920,635
|
|
Net expenses(c)
|
|
0.48
%
(d)
|
|
0.49
%
|
|
0.49
%
|
|
0.49
%
(e)
|
|
0.50
%
|
|
Gross expenses
|
|
0.55
%
|
|
0.56
%
|
|
0.56
%
|
|
0.55
%
|
|
0.54
%
|
|
Net investment income
|
|
4.86
%
|
|
4.80
%
|
|
4.33
%
|
|
3.01
%
|
|
2.49
%
|
|
Portfolio turnover rate
|
|
51
%
|
|
39
%
|
|
25
%
|
|
31
%
|
|
27
%
|
|
(a)
|
Per share net investment income has been calculated using the average shares outstanding during the period.
|
|
(b)
|
Had certain expenses not been waived/reimbursed during the period, total returns would have been lower.
|
|
(c)
|
The investment adviser agreed to waive its fees and/or reimburse a portion of the Fund’s expenses during the period. Without this waiver/reimbursement, expenses would have been higher.
|
|
(d)
|
Effective July 1, 2025, the expense limit decreased from 0.49% to 0.48%.
|
|
(e)
|
Effective July 1, 2022, the expense limit decreased from 0.50% to 0.49%.
|
|
|
Admin Class
|
|||||||||
|
|
Year Ended
December 31, 2025 |
Year Ended
December 31, 2024 |
Year Ended
December 31, 2023 |
Year Ended
December 31, 2022 |
Year Ended
December 31, 2021 |
|||||
|
Net asset value, beginning of the period
|
$
|
9.68
|
$
|
9.88
|
$
|
9.60
|
$
|
11.18
|
$
|
11.62
|
|
INCOME (LOSS) FROM INVESTMENT OPERATIONS:
|
|
|
|
|
|
|
|
|
|
|
|
Net investment income(a)
|
|
0.43
|
|
0.42
|
|
0.36
|
|
0.25
|
|
0.23
|
|
Net realized and unrealized gain (loss)
|
|
0.18
|
|
(0.20
)
|
|
0.29
|
|
(1.56
)
|
|
(0.26
)
|
|
Total from Investment Operations
|
|
0.61
|
|
0.22
|
|
0.65
|
|
(1.31
)
|
|
(0.03
)
|
|
LESS DISTRIBUTIONS FROM:
|
|
|
|
|
|
|
|
|
|
|
|
Net investment income
|
|
(0.43
)
|
|
(0.42
)
|
|
(0.37
)
|
|
(0.26
)
|
|
(0.24
)
|
|
Net realized capital gains
|
|
—
|
|
—
|
|
—
|
|
(0.01
)
|
|
(0.17
)
|
|
Total Distributions
|
|
(0.43
)
|
|
(0.42
)
|
|
(0.37
)
|
|
(0.27
)
|
|
(0.41
)
|
|
Net asset value, end of the period
|
$
|
9.86
|
$
|
9.68
|
$
|
9.88
|
$
|
9.60
|
$
|
11.18
|
|
Total return(b)
|
|
6.44
%
|
|
2.28
%
|
|
6.99
%
|
|
(11.80
)%
|
|
(0.26
)%
|
|
RATIOS TO AVERAGE NET ASSETS:
|
|
|
|
|
|
|
|
|
|
|
|
Net assets, end of the period (000’s)
|
$
|
81,213
|
$
|
90,999
|
$
|
142,689
|
$
|
122,710
|
$
|
139,169
|
|
Net expenses(c)
|
|
0.99
%
(d)
|
|
0.99
%
|
|
0.99
%
|
|
1.00
%
(e)
|
|
1.00
%
|
|
Gross expenses
|
|
1.05
%
|
|
1.06
%
|
|
1.06
%
|
|
1.05
%
|
|
1.04
%
|
|
Net investment income
|
|
4.35
%
|
|
4.27
%
|
|
3.79
%
|
|
2.47
%
|
|
1.98
%
|
|
Portfolio turnover rate
|
|
51
%
|
|
39
%
|
|
25
%
|
|
31
%
|
|
27
%
|
|
(a)
|
Per share net investment income has been calculated using the average shares outstanding during the period.
|
|
(b)
|
Had certain expenses not been waived/reimbursed during the period, total returns would have been lower.
|
|
(c)
|
The investment adviser agreed to waive its fees and/or reimburse a portion of the Fund’s expenses during the period. Without this waiver/reimbursement, expenses would have been higher.
|
|
(d)
|
Effective July 1, 2025, the expense limit decreased from 0.99% to 0.98%.
|
|
(e)
|
Effective July 1, 2022, the expense limit decreased from 1.00% to 0.99%.
|
|
|
Class A
|
|||||||||
|
|
Year Ended
December 31, 2025 |
Year Ended
December 31, 2024 |
Year Ended
December 31, 2023 |
Year Ended
December 31, 2022 |
Year Ended
December 31, 2021 |
|||||
|
Net asset value, beginning of the period
|
$
|
9.57
|
$
|
9.34
|
$
|
9.14
|
$
|
10.34
|
$
|
10.43
|
|
INCOME (LOSS) FROM INVESTMENT OPERATIONS:
|
|
|
|
|
|
|
|
|
|
|
|
Net investment income(a)
|
|
0.51
|
|
0.52
|
|
0.42
|
|
0.34
|
|
0.26
|
|
Net realized and unrealized gain (loss)
|
|
0.26
|
|
0.22
|
|
0.27
|
|
(1.20
)
|
|
(0.15
)
|
|
Total from Investment Operations
|
|
0.77
|
|
0.74
|
|
0.69
|
|
(0.86
)
|
|
0.11
|
|
LESS DISTRIBUTIONS FROM:
|
|
|
|
|
|
|
|
|
|
|
|
Net investment income
|
|
(0.44
)
|
|
(0.51
)
|
|
(0.49
)
|
|
(0.34
)
|
|
(0.20
)
|
|
Net asset value, end of the period
|
$
|
9.90
|
$
|
9.57
|
$
|
9.34
|
$
|
9.14
|
$
|
10.34
|
|
Total return(b)
|
|
8.18
%
(c)(d)
|
|
8.10
%
(c)
|
|
7.70
%
(c)
|
|
(8.29
)%
|
|
1.07
%
|
|
RATIOS TO AVERAGE NET ASSETS:
|
|
|
|
|
|
|
|
|
|
|
|
Net assets, end of the period (000’s)
|
$
|
16,222
|
$
|
15,930
|
$
|
17,891
|
$
|
29,797
|
$
|
41,765
|
|
Net expenses
|
|
0.98
%
(e)
|
|
0.99
%
(e)(f)
|
|
1.00
%
(e)
|
|
1.00
%
|
|
0.97
%
|
|
Gross expenses
|
|
1.03
%
|
|
1.05
%
|
|
1.03
%
|
|
1.00
%
|
|
0.97
%
|
|
Net investment income
|
|
5.17
%
|
|
5.47
%
|
|
4.51
%
|
|
3.59
%
|
|
2.45
%
|
|
Portfolio turnover rate
|
|
57
%
|
|
55
%
|
|
38
%
|
|
46
%
(g)
|
|
218
%
|
|
(a)
|
Per share net investment income has been calculated using the average shares outstanding during the period.
|
|
(b)
|
A sales charge for Class A shares is not reflected in total return calculations.
|
|
(c)
|
Had certain expenses not been waived/reimbursed during the period, total returns would have been lower.
|
|
(d)
|
Generally accepted accounting principles require certain adjustments to be made to the net assets of the Fund for financial statement purposes only, and as such, the total return based on the adjusted net asset value per share may differ from the live total return reported on the Fund’s website or any corresponding Shareholder Report. Without these adjustments, total return would have been 8.29%.
|
|
(e)
|
The investment adviser agreed to waive its fees and/or reimburse a portion of the Fund’s expenses during the period. Without this waiver/reimbursement, expenses would have been higher.
|
|
(f)
|
Effective July 1, 2024, the expense limit decreased from 1.00% to 0.98%.
|
|
(g)
|
The variation in the Fund’s turnover rate from 2021 to 2022 was primarily due to a decrease in trading volume and shareholder flows.
|
|
|
Class C
|
|||||||||
|
|
Year Ended
December 31, 2025 |
Year Ended
December 31, 2024 |
Year Ended
December 31, 2023 |
Year Ended
December 31, 2022 |
Year Ended
December 31, 2021 |
|||||
|
Net asset value, beginning of the period
|
$
|
9.55
|
$
|
9.33
|
$
|
9.13
|
$
|
10.32
|
$
|
10.40
|
|
INCOME (LOSS) FROM INVESTMENT OPERATIONS:
|
|
|
|
|
|
|
|
|
|
|
|
Net investment income(a)
|
|
0.43
|
|
0.45
|
|
0.35
|
|
0.27
|
|
0.18
|
|
Net realized and unrealized gain (loss)
|
|
0.26
|
|
0.21
|
|
0.26
|
|
(1.19
)
|
|
(0.15
)
|
|
Total from Investment Operations
|
|
0.69
|
|
0.66
|
|
0.61
|
|
(0.92
)
|
|
0.03
|
|
LESS DISTRIBUTIONS FROM:
|
|
|
|
|
|
|
|
|
|
|
|
Net investment income
|
|
(0.36
)
|
|
(0.44
)
|
|
(0.41
)
|
|
(0.27
)
|
|
(0.11
)
|
|
Net asset value, end of the period
|
$
|
9.88
|
$
|
9.55
|
$
|
9.33
|
$
|
9.13
|
$
|
10.32
|
|
Total return(b)
|
|
7.37
%
(c)(d)
|
|
7.31
%
(c)
|
|
6.77
%
(c)
|
|
(8.90
)%
|
|
0.30
%
|
|
RATIOS TO AVERAGE NET ASSETS:
|
|
|
|
|
|
|
|
|
|
|
|
Net assets, end of the period (000’s)
|
$
|
2,320
|
$
|
2,134
|
$
|
2,531
|
$
|
3,309
|
$
|
4,266
|
|
Net expenses
|
|
1.73
%
(e)
|
|
1.74
%
(e)(f)
|
|
1.75
%
(e)
|
|
1.75
%
|
|
1.73
%
|
|
Gross expenses
|
|
1.78
%
|
|
1.80
%
|
|
1.78
%
|
|
1.75
%
|
|
1.73
%
|
|
Net investment income
|
|
4.43
%
|
|
4.72
%
|
|
3.81
%
|
|
2.84
%
|
|
1.68
%
|
|
Portfolio turnover rate
|
|
57
%
|
|
55
%
|
|
38
%
|
|
46
%
(g)
|
|
218
%
|
|
(a)
|
Per share net investment income has been calculated using the average shares outstanding during the period.
|
|
(b)
|
A contingent deferred sales charge for Class C shares is not reflected in total return calculations.
|
|
(c)
|
Had certain expenses not been waived/reimbursed during the period, total returns would have been lower.
|
|
(d)
|
Generally accepted accounting principles require certain adjustments to be made to the net assets of the Fund for financial statement purposes only, and as such, the total return based on the adjusted net asset value per share may differ from the live total return reported on the Fund’s website or any corresponding Shareholder Report. Without these adjustments, total return would have been 7.48%.
|
|
(e)
|
The investment adviser agreed to waive its fees and/or reimburse a portion of the Fund’s expenses during the period. Without this waiver/reimbursement, expenses would have been higher.
|
|
(f)
|
Effective July 1, 2024, the expense limit decreased from 1.75% to 1.73%.
|
|
(g)
|
The variation in the Fund’s turnover rate from 2021 to 2022 was primarily due to a decrease in trading volume and shareholder flows.
|
|
|
Class N
|
|||||||||
|
|
Year Ended
December 31, 2025 |
Year Ended
December 31, 2024 |
Year Ended
December 31, 2023 |
Year Ended
December 31, 2022 |
Year Ended
December 31, 2021 |
|||||
|
Net asset value, beginning of the period
|
$
|
9.54
|
$
|
9.32
|
$
|
9.12
|
$
|
10.32
|
$
|
10.41
|
|
INCOME (LOSS) FROM INVESTMENT OPERATIONS:
|
|
|
|
|
|
|
|
|
|
|
|
Net investment income(a)
|
|
0.53
|
|
0.55
|
|
0.44
|
|
0.37
|
|
0.29
|
|
Net realized and unrealized gain (loss)
|
|
0.27
|
|
0.21
|
|
0.27
|
|
(1.19
)
|
|
(0.15
)
|
|
Total from Investment Operations
|
|
0.80
|
|
0.76
|
|
0.71
|
|
(0.82
)
|
|
0.14
|
|
LESS DISTRIBUTIONS FROM:
|
|
|
|
|
|
|
|
|
|
|
|
Net investment income
|
|
(0.47
)
|
|
(0.54
)
|
|
(0.51
)
|
|
(0.38
)
|
|
(0.23
)
|
|
Net asset value, end of the period
|
$
|
9.87
|
$
|
9.54
|
$
|
9.32
|
$
|
9.12
|
$
|
10.32
|
|
Total return
|
|
8.51
%
(b)(c)
|
|
8.45
%
(b)
|
|
7.94
%
(b)
|
|
(8.00
)%
|
|
1.38
%
|
|
RATIOS TO AVERAGE NET ASSETS:
|
|
|
|
|
|
|
|
|
|
|
|
Net assets, end of the period (000’s)
|
$
|
127,923
|
$
|
119,054
|
$
|
105,702
|
$
|
164,264
|
$
|
484,005
|
|
Net expenses
|
|
0.68
%
(d)
|
|
0.69
%
(d)(e)
|
|
0.70
%
(d)
|
|
0.69
%
|
|
0.67
%
|
|
Gross expenses
|
|
0.71
%
|
|
0.73
%
|
|
0.71
%
|
|
0.69
%
|
|
0.67
%
|
|
Net investment income
|
|
5.48
%
|
|
5.77
%
|
|
4.83
%
|
|
3.81
%
|
|
2.74
%
|
|
Portfolio turnover rate
|
|
57
%
|
|
55
%
|
|
38
%
|
|
46
%
(f)
|
|
218
%
|
|
(a)
|
Per share net investment income has been calculated using the average shares outstanding during the period.
|
|
(b)
|
Had certain expenses not been waived/reimbursed during the period, total returns would have been lower.
|
|
(c)
|
Generally accepted accounting principles require certain adjustments to be made to the net assets of the Fund for financial statement purposes only, and as such, the total return based on the adjusted net asset value per share may differ from the live total return reported on the Fund’s website or any corresponding Shareholder Report. Without these adjustments, total return would have been 8.62%.
|
|
(d)
|
The investment adviser agreed to waive its fees and/or reimburse a portion of the Fund’s expenses during the period. Without this waiver/reimbursement, expenses would have been higher.
|
|
(e)
|
Effective July 1, 2024, the expense limit decreased from 0.70% to 0.68%.
|
|
(f)
|
The variation in the Fund’s turnover rate from 2021 to 2022 was primarily due to a decrease in trading volume and shareholder flows.
|
|
|
Class Y
|
|||||||||
|
|
Year Ended
December 31, 2025 |
Year Ended
December 31, 2024 |
Year Ended
December 31, 2023 |
Year Ended
December 31, 2022 |
Year Ended
December 31, 2021 |
|||||
|
Net asset value, beginning of the period
|
$
|
9.53
|
$
|
9.31
|
$
|
9.12
|
$
|
10.31
|
$
|
10.41
|
|
INCOME (LOSS) FROM INVESTMENT OPERATIONS:
|
|
|
|
|
|
|
|
|
|
|
|
Net investment income(a)
|
|
0.53
|
|
0.54
|
|
0.44
|
|
0.37
|
|
0.28
|
|
Net realized and unrealized gain (loss)
|
|
0.26
|
|
0.21
|
|
0.26
|
|
(1.19
)
|
|
(0.15
)
|
|
Total from Investment Operations
|
|
0.79
|
|
0.75
|
|
0.70
|
|
(0.82
)
|
|
0.13
|
|
LESS DISTRIBUTIONS FROM:
|
|
|
|
|
|
|
|
|
|
|
|
Net investment income
|
|
(0.46
)
|
|
(0.53
)
|
|
(0.51
)
|
|
(0.37
)
|
|
(0.23
)
|
|
Net asset value, end of the period
|
$
|
9.86
|
$
|
9.53
|
$
|
9.31
|
$
|
9.12
|
$
|
10.31
|
|
Total return
|
|
8.47
%
(b)(c)
|
|
8.29
%
(b)
|
|
7.90
%
(b)
|
|
(7.97
)%
|
|
1.32
%
|
|
RATIOS TO AVERAGE NET ASSETS:
|
|
|
|
|
|
|
|
|
|
|
|
Net assets, end of the period (000’s)
|
$
|
890,697
|
$
|
460,318
|
$
|
476,304
|
$
|
650,242
|
$
|
930,815
|
|
Net expenses
|
|
0.73
%
(d)
|
|
0.74
%
(d)(e)
|
|
0.75
%
(d)
|
|
0.75
%
|
|
0.72
%
|
|
Gross expenses
|
|
0.78
%
|
|
0.80
%
|
|
0.78
%
|
|
0.75
%
|
|
0.72
%
|
|
Net investment income
|
|
5.45
%
|
|
5.72
%
|
|
4.80
%
|
|
3.83
%
|
|
2.70
%
|
|
Portfolio turnover rate
|
|
57
%
|
|
55
%
|
|
38
%
|
|
46
%
(f)
|
|
218
%
|
|
(a)
|
Per share net investment income has been calculated using the average shares outstanding during the period.
|
|
(b)
|
Had certain expenses not been waived/reimbursed during the period, total returns would have been lower.
|
|
(c)
|
Generally accepted accounting principles require certain adjustments to be made to the net assets of the Fund for financial statement purposes only, and as such, the total return based on the adjusted net asset value per share may differ from the live total return reported on the Fund’s website or any corresponding Shareholder Report. Without these adjustments, total return would have been 8.58%.
|
|
(d)
|
The investment adviser agreed to waive its fees and/or reimburse a portion of the Fund’s expenses during the period. Without this waiver/reimbursement, expenses would have been higher.
|
|
(e)
|
Effective July 1, 2024, the expense limit decreased from 0.75% to 0.73%.
|
|
(f)
|
The variation in the Fund’s turnover rate from 2021 to 2022 was primarily due to a decrease in trading volume and shareholder flows.
|
|
|
Class A
|
|||||||||
|
|
Year Ended
December 31, 2025 |
Year Ended
December 31, 2024 |
Year Ended
December 31, 2023 |
Year Ended
December 31, 2022 |
Year Ended
December 31, 2021 |
|||||
|
Net asset value, beginning of the year
|
$
|
12.04
|
$
|
11.92
|
$
|
11.65
|
$
|
14.19
|
$
|
14.03
|
|
INCOME (LOSS) FROM INVESTMENT OPERATIONS:
|
|
|
|
|
|
|
|
|
|
|
|
Net investment income(a)
|
|
0.72
|
|
0.62
|
|
0.57
|
|
0.44
|
|
0.26
|
|
Net realized and unrealized gain (loss)
|
|
0.48
|
|
0.18
|
|
0.34
|
|
(2.24)
|
|
0.27
|
|
Total from Investment Operations
|
|
1.20
|
|
0.80
|
|
0.91
|
|
(1.80)
|
|
0.53
|
|
LESS DISTRIBUTIONS FROM:
|
|
|
|
|
|
|
|
|
|
|
|
Net investment income
|
|
(0.63)
|
|
(0.68)
|
|
(0.64)
|
|
(0.74)
|
|
(0.37)
|
|
Net asset value, end of the period
|
$
|
12.61
|
$
|
12.04
|
$
|
11.92
|
$
|
11.65
|
$
|
14.19
|
|
Total return(b)(c)
|
|
10.27%
|
|
6.95%
|
|
8.02%
|
|
(12.80)%
|
|
3.85%
|
|
RATIOS TO AVERAGE NET ASSETS:
|
|
|
|
|
|
|
|
|
|
|
|
Net assets, end of the period (000’s)
|
$
|
803,617
|
$
|
840,790
|
$
|
946,579
|
$
|
1,067,151
|
$
|
1,512,939
|
|
Net expenses(d)
|
|
0.92%
|
|
0.93%(e)
|
|
0.94%(f)
|
|
0.95%(g)
|
|
0.96%(h)
|
|
Gross expenses
|
|
1.00%
|
|
1.00%
|
|
1.00%
|
|
0.98%
|
|
0.97%
|
|
Net investment income
|
|
5.83%
|
|
5.18%
|
|
4.89%
|
|
3.45%
|
|
1.85%
|
|
Portfolio turnover rate
|
|
100%
|
|
81%
|
|
39%
|
|
23%
|
|
99%
|
|
(a)
|
Per share net investment income has been calculated using the average shares outstanding during the period.
|
|
(b)
|
A sales charge for Class A shares is not reflected in total return calculations.
|
|
(c)
|
Had certain expenses not been waived/reimbursed during the period, total returns would have been lower.
|
|
(d)
|
The investment adviser agreed to waive its fees and/or reimburse a portion of the Fund’s expenses during the period. Without this waiver/reimbursement, expenses would have been higher.
|
|
(e)
|
Effective July 1, 2024, the expense limit decreased from 0.93% to 0.92%.
|
|
(f)
|
Effective July 1, 2023, the expense limit decreased from 0.94% to 0.93%.
|
|
(g)
|
Effective July 1, 2022, the expense limit decreased from 0.95% to 0.94%.
|
|
(h)
|
Effective July 1, 2021, the expense limit decreased from 1.00% to 0.95%.
|
|
|
Class C
|
|||||||||
|
|
Year Ended
December 31, 2025 |
Year Ended
December 31, 2024 |
Year Ended
December 31, 2023 |
Year Ended
December 31, 2022 |
Year Ended
December 31, 2021 |
|||||
|
Net asset value, beginning of the year
|
$
|
12.22
|
$
|
12.08
|
$
|
11.80
|
$
|
14.36
|
$
|
14.18
|
|
INCOME (LOSS) FROM INVESTMENT OPERATIONS:
|
|
|
|
|
|
|
|
|
|
|
|
Net investment income(a)
|
|
0.63
|
|
0.54
|
|
0.48
|
|
0.34
|
|
0.16
|
|
Net realized and unrealized gain (loss)
|
|
0.49
|
|
0.18
|
|
0.35
|
|
(2.26)
|
|
0.28
|
|
Total from Investment Operations
|
|
1.12
|
|
0.72
|
|
0.83
|
|
(1.92)
|
|
0.44
|
|
LESS DISTRIBUTIONS FROM:
|
|
|
|
|
|
|
|
|
|
|
|
Net investment income
|
|
(0.53)
|
|
(0.58)
|
|
(0.55)
|
|
(0.64)
|
|
(0.26)
|
|
Net asset value, end of the period
|
$
|
12.81
|
$
|
12.22
|
$
|
12.08
|
$
|
11.80
|
$
|
14.36
|
|
Total return(b)(c)
|
|
9.36%
|
|
6.13%
|
|
7.26%
|
|
(13.48)%
|
|
3.13%
|
|
RATIOS TO AVERAGE NET ASSETS:
|
|
|
|
|
|
|
|
|
|
|
|
Net assets, end of the period (000’s)
|
$
|
23,598
|
$
|
27,013
|
$
|
34,212
|
$
|
52,977
|
$
|
120,091
|
|
Net expenses(d)
|
|
1.67%
|
|
1.68%(e)
|
|
1.69%(f)
|
|
1.70%(g)
|
|
1.71%(h)
|
|
Gross expenses
|
|
1.75%
|
|
1.75%
|
|
1.75%
|
|
1.73%
|
|
1.72%
|
|
Net investment income
|
|
5.08%
|
|
4.43%
|
|
4.09%
|
|
2.62%
|
|
1.12%
|
|
Portfolio turnover rate
|
|
100%
|
|
81%
|
|
39%
|
|
23%
|
|
99%
|
|
(a)
|
Per share net investment income has been calculated using the average shares outstanding during the period.
|
|
(b)
|
A contingent deferred sales charge for Class C shares is not reflected in total return calculations.
|
|
(c)
|
Had certain expenses not been waived/reimbursed during the period, total returns would have been lower.
|
|
(d)
|
The investment adviser agreed to waive its fees and/or reimburse a portion of the Fund’s expenses during the period. Without this waiver/reimbursement, expenses would have been higher.
|
|
(e)
|
Effective July 1, 2024, the expense limit decreased from 1.68% to 1.67%.
|
|
(f)
|
Effective July 1, 2023, the expense limit decreased from 1.69% to 1.68%.
|
|
(g)
|
Effective July 1, 2022, the expense limit decreased from 1.70% to 1.69%.
|
|
(h)
|
Effective July 1, 2021, the expense limit decreased from 1.75% to 1.70%.
|
|
|
Class N
|
|||||||||
|
|
Year Ended
December 31, 2025 |
Year Ended
December 31, 2024 |
Year Ended
December 31, 2023 |
Year Ended
December 31, 2022 |
Year Ended
December 31, 2021 |
|||||
|
Net asset value, beginning of the year
|
$
|
12.02
|
$
|
11.90
|
$
|
11.63
|
$
|
14.17
|
$
|
14.01
|
|
INCOME (LOSS) FROM INVESTMENT OPERATIONS:
|
|
|
|
|
|
|
|
|
|
|
|
Net investment income(a)
|
|
0.74
|
|
0.66
|
|
0.60
|
|
0.47
|
|
0.31
|
|
Net realized and unrealized gain (loss)
|
|
0.50
|
|
0.17
|
|
0.34
|
|
(2.23)
|
|
0.27
|
|
Total from Investment Operations
|
|
1.24
|
|
0.83
|
|
0.94
|
|
(1.76)
|
|
0.58
|
|
LESS DISTRIBUTIONS FROM:
|
|
|
|
|
|
|
|
|
|
|
|
Net investment income
|
|
(0.66)
|
|
(0.71)
|
|
(0.67)
|
|
(0.78)
|
|
(0.42)
|
|
Net asset value, end of the period
|
$
|
12.60
|
$
|
12.02
|
$
|
11.90
|
$
|
11.63
|
$
|
14.17
|
|
Total return
|
|
10.62%(b)
|
|
7.20%(b)
|
|
8.45%(b)
|
|
(12.55)%
|
|
4.19%
|
|
RATIOS TO AVERAGE NET ASSETS:
|
|
|
|
|
|
|
|
|
|
|
|
Net assets, end of the period (000’s)
|
$
|
67,618
|
$
|
204,205
|
$
|
220,360
|
$
|
220,229
|
$
|
280,661
|
|
Net expenses
|
|
0.62%(c)
|
|
0.62%(c)(d)
|
|
0.64%(c)(e)
|
|
0.64%(f)
|
|
0.65%(g)
|
|
Gross expenses
|
|
0.66%
|
|
0.67%
|
|
0.66%
|
|
0.64%
|
|
0.65%
|
|
Net investment income
|
|
5.97%
|
|
5.48%
|
|
5.20%
|
|
3.77%
|
|
2.17%
|
|
Portfolio turnover rate
|
|
100%
|
|
81%
|
|
39%
|
|
23%
|
|
99%
|
|
(a)
|
Per share net investment income has been calculated using the average shares outstanding during the period.
|
|
(b)
|
Had certain expenses not been waived/reimbursed during the period, total returns would have been lower.
|
|
(c)
|
The investment adviser agreed to waive its fees and/or reimburse a portion of the Fund’s expenses during the period. Without this waiver/reimbursement, expenses would have been higher.
|
|
(d)
|
Effective July 1, 2024, the expense limit decreased from 0.63% to 0.62%.
|
|
(e)
|
Effective July 1, 2023, the expense limit decreased from 0.64% to 0.63%.
|
|
(f)
|
Effective July 1, 2022, the expense limit decreased from 0.65% to 0.64%.
|
|
(g)
|
Effective July 1, 2021, the expense limit decreased from 0.70% to 0.65%.
|
|
|
Class Y
|
|||||||||
|
|
Year Ended
December 31, 2025 |
Year Ended
December 31, 2024 |
Year Ended
December 31, 2023 |
Year Ended
December 31, 2022 |
Year Ended
December 31, 2021 |
|||||
|
Net asset value, beginning of the year
|
$
|
12.02
|
$
|
11.90
|
$
|
11.63
|
$
|
14.17
|
$
|
14.01
|
|
INCOME (LOSS) FROM INVESTMENT OPERATIONS:
|
|
|
|
|
|
|
|
|
|
|
|
Net investment income(a)
|
|
0.75
|
|
0.65
|
|
0.60
|
|
0.47
|
|
0.30
|
|
Net realized and unrealized gain (loss)
|
|
0.48
|
|
0.18
|
|
0.34
|
|
(2.24)
|
|
0.27
|
|
Total from Investment Operations
|
|
1.23
|
|
0.83
|
|
0.94
|
|
(1.77)
|
|
0.57
|
|
LESS DISTRIBUTIONS FROM:
|
|
|
|
|
|
|
|
|
|
|
|
Net investment income
|
|
(0.66)
|
|
(0.71)
|
|
(0.67)
|
|
(0.77)
|
|
(0.41)
|
|
Net asset value, end of the period
|
$
|
12.59
|
$
|
12.02
|
$
|
11.90
|
$
|
11.63
|
$
|
14.17
|
|
Total return(b)
|
|
10.56%
|
|
7.24%
|
|
8.30%
|
|
(12.60)%
|
|
4.12%
|
|
RATIOS TO AVERAGE NET ASSETS:
|
|
|
|
|
|
|
|
|
|
|
|
Net assets, end of the period (000’s)
|
$
|
1,742,859
|
$
|
1,629,062
|
$
|
1,586,092
|
$
|
1,816,763
|
$
|
3,058,635
|
|
Net expenses(c)
|
|
0.67%
|
|
0.67%(d)
|
|
0.69%(e)
|
|
0.70%(f)
|
|
0.71%(g)
|
|
Gross expenses
|
|
0.75%
|
|
0.75%
|
|
0.75%
|
|
0.73%
|
|
0.72%
|
|
Net investment income
|
|
6.10%
|
|
5.43%
|
|
5.13%
|
|
3.68%
|
|
2.10%
|
|
Portfolio turnover rate
|
|
100%
|
|
81%
|
|
39%
|
|
23%
|
|
99%
|
|
(a)
|
Per share net investment income has been calculated using the average shares outstanding during the period.
|
|
(b)
|
Had certain expenses not been waived/reimbursed during the period, total returns would have been lower.
|
|
(c)
|
The investment adviser agreed to waive its fees and/or reimburse a portion of the Fund’s expenses during the period. Without this waiver/reimbursement, expenses would have been higher.
|
|
(d)
|
Effective July 1, 2024, the expense limit decreased from 0.68% to 0.67%.
|
|
(e)
|
Effective July 1, 2023, the expense limit decreased from 0.69% to 0.68%.
|
|
(f)
|
Effective July 1, 2022, the expense limit decreased from 0.70% to 0.69%.
|
|
(g)
|
Effective July 1, 2021, the expense limit decreased from 0.75% to 0.70%.
|
|
|
Admin Class
|
|||||||||
|
|
Year Ended
December 31, 2025 |
Year Ended
December 31, 2024 |
Year Ended
December 31, 2023 |
Year Ended
December 31, 2022 |
Year Ended
December 31, 2021 |
|||||
|
Net asset value, beginning of the year
|
$
|
11.99
|
$
|
11.87
|
$
|
11.60
|
$
|
14.14
|
$
|
13.97
|
|
INCOME (LOSS) FROM INVESTMENT OPERATIONS:
|
|
|
|
|
|
|
|
|
|
|
|
Net investment income(a)
|
|
0.69
|
|
0.59
|
|
0.54
|
|
0.40
|
|
0.23
|
|
Net realized and unrealized gain (loss)
|
|
0.47
|
|
0.18
|
|
0.34
|
|
(2.23)
|
|
0.28
|
|
Total from Investment Operations
|
|
1.16
|
|
0.77
|
|
0.88
|
|
(1.83)
|
|
0.51
|
|
LESS DISTRIBUTIONS FROM:
|
|
|
|
|
|
|
|
|
|
|
|
Net investment income
|
|
(0.60)
|
|
(0.65)
|
|
(0.61)
|
|
(0.71)
|
|
(0.34)
|
|
Net asset value, end of the period
|
$
|
12.55
|
$
|
11.99
|
$
|
11.87
|
$
|
11.60
|
$
|
14.14
|
|
Total return(b)
|
|
9.95%
|
|
6.72%
|
|
7.78%
|
|
(13.07)%
|
|
3.68%
|
|
RATIOS TO AVERAGE NET ASSETS:
|
|
|
|
|
|
|
|
|
|
|
|
Net assets, end of the period (000’s)
|
$
|
59,042
|
$
|
61,083
|
$
|
66,181
|
$
|
68,788
|
$
|
95,250
|
|
Net expenses(c)
|
|
1.17%
|
|
1.18%(d)
|
|
1.19%(e)
|
|
1.20%(f)
|
|
1.21%(g)
|
|
Gross expenses
|
|
1.25%
|
|
1.26%
|
|
1.25%
|
|
1.23%
|
|
1.22%
|
|
Net investment income
|
|
5.58%
|
|
4.93%
|
|
4.65%
|
|
3.20%
|
|
1.60%
|
|
Portfolio turnover rate
|
|
100%
|
|
81%
|
|
39%
|
|
23%
|
|
99%
|
|
(a)
|
Per share net investment income has been calculated using the average shares outstanding during the period.
|
|
(b)
|
Had certain expenses not been waived/reimbursed during the period, total returns would have been lower.
|
|
(c)
|
The investment adviser agreed to waive its fees and/or reimburse a portion of the Fund’s expenses during the period. Without this waiver/reimbursement, expenses would have been higher.
|
|
(d)
|
Effective July 1, 2024, the expense limit decreased from 1.18% to 1.17%.
|
|
(e)
|
Effective July 1, 2023, the expense limit decreased from 1.19% to 1.18%.
|
|
(f)
|
Effective July 1, 2022, the expense limit decreased from 1.20% to 1.19%.
|
|
(g)
|
Effective July 1, 2021, the expense limit decreased from 1.25% to 1.20%.
|
|
|
Class A
|
|||||||||
|
|
Year Ended
December 31, 2025 |
Year Ended
December 31, 2024 |
Year Ended
December 31, 2023 |
Year Ended
December 31, 2022 |
Year Ended
December 31, 2021 |
|||||
|
Net asset value, beginning of the period
|
$
|
29.51
|
$
|
27.24
|
$
|
21.55
|
$
|
29.04
|
$
|
23.20
|
|
INCOME (LOSS) FROM INVESTMENT OPERATIONS:
|
|
|
|
|
|
|
|
|
|
|
|
Net investment income(a)
|
|
0.21
|
|
0.25
|
|
0.20
|
|
0.17
|
|
0.07
|
|
Net realized and unrealized gain (loss)
|
|
4.06
|
|
4.04
|
|
6.48
|
|
(4.00
)
|
|
7.81
|
|
Total from Investment Operations
|
|
4.27
|
|
4.29
|
|
6.68
|
|
(3.83
)
|
|
7.88
|
|
LESS DISTRIBUTIONS FROM:
|
|
|
|
|
|
|
|
|
|
|
|
Net investment income
|
|
(0.23
)
|
|
(0.26
)
|
|
(0.16
)
|
|
(0.20
)
|
|
(0.05
)
|
|
Net realized capital gains
|
|
(2.02
)
|
|
(1.76
)
|
|
(0.83
)
|
|
(3.46
)
|
|
(1.99
)
|
|
Total Distributions
|
|
(2.25
)
|
|
(2.02
)
|
|
(0.99
)
|
|
(3.66
)
|
|
(2.04
)
|
|
Net asset value, end of the period
|
$
|
31.53
|
$
|
29.51
|
$
|
27.24
|
$
|
21.55
|
$
|
29.04
|
|
Total return(b)(c)
|
|
14.86
%
|
|
15.82
%
|
|
30.96
%
|
|
(13.30
)%
|
|
33.97
%
|
|
RATIOS TO AVERAGE NET ASSETS:
|
|
|
|
|
|
|
|
|
|
|
|
Net assets, end of the period (000’s)
|
$
|
313,337
|
$
|
289,368
|
$
|
257,098
|
$
|
192,750
|
$
|
222,435
|
|
Net expenses(d)
|
|
1.03
%
|
|
1.04
%
(e)
|
|
1.05
%
|
|
1.05
%
|
|
1.12
%
(f)
|
|
Gross expenses
|
|
1.06
%
|
|
1.09
%
|
|
1.15
%
|
|
1.10
%
|
|
1.14
%
|
|
Net investment income
|
|
0.70
%
|
|
0.86
%
|
|
0.81
%
|
|
0.65
%
|
|
0.25
%
|
|
Portfolio turnover rate
|
|
53
%
|
|
51
%
|
|
40
%
|
|
69
%
|
|
23
%
|
|
(a)
|
Per share net investment income has been calculated using the average shares outstanding during the period.
|
|
(b)
|
A sales charge for Class A shares is not reflected in total return calculations.
|
|
(c)
|
Had certain expenses not been waived/reimbursed during the period, total returns would have been lower.
|
|
(d)
|
The investment adviser agreed to waive its fees and/or reimburse a portion of the Fund’s expenses during the period. Without this waiver/reimbursement, expenses would have been higher.
|
|
(e)
|
Effective July 1, 2024, the expense limit decreased from 1.05% to 1.03%.
|
|
(f)
|
Effective July 1, 2021, the expense limit decreased from 1.30% to 1.05%.
|
|
|
Class C
|
|||||||||
|
|
Year Ended
December 31, 2025 |
Year Ended
December 31, 2024 |
Year Ended
December 31, 2023 |
Year Ended
December 31, 2022 |
Year Ended
December 31, 2021 |
|||||
|
Net asset value, beginning of the period
|
$
|
22.18
|
$
|
20.92
|
$
|
16.74
|
$
|
23.50
|
$
|
19.17
|
|
INCOME (LOSS) FROM INVESTMENT OPERATIONS:
|
|
|
|
|
|
|
|
|
|
|
|
Net investment income (loss)(a)
|
|
(0.01
)
|
|
0.03
|
|
0.01
|
|
(0.02
)
|
|
(0.12
)
|
|
Net realized and unrealized gain (loss)
|
|
3.01
|
|
3.08
|
|
5.01
|
|
(3.23
)
|
|
6.44
|
|
Total from Investment Operations
|
|
3.00
|
|
3.11
|
|
5.02
|
|
(3.25
)
|
|
6.32
|
|
LESS DISTRIBUTIONS FROM:
|
|
|
|
|
|
|
|
|
|
|
|
Net investment income
|
|
(0.08
)
|
|
(0.09
)
|
|
(0.01
)
|
|
(0.05
)
|
|
(0.00
)
(b)
|
|
Net realized capital gains
|
|
(2.02
)
|
|
(1.76
)
|
|
(0.83
)
|
|
(3.46
)
|
|
(1.99
)
|
|
Total Distributions
|
|
(2.10
)
|
|
(1.85
)
|
|
(0.84
)
|
|
(3.51
)
|
|
(1.99
)
|
|
Net asset value, end of the period
|
$
|
23.08
|
$
|
22.18
|
$
|
20.92
|
$
|
16.74
|
$
|
23.50
|
|
Total return(c)(d)
|
|
14.03
%
|
|
14.95
%
|
|
29.99
%
|
|
(13.97
)%
|
|
32.99
%
|
|
RATIOS TO AVERAGE NET ASSETS:
|
|
|
|
|
|
|
|
|
|
|
|
Net assets, end of the period (000’s)
|
$
|
58,090
|
$
|
55,187
|
$
|
55,880
|
$
|
51,987
|
$
|
50,042
|
|
Net expenses(e)
|
|
1.78
%
|
|
1.79
%
(f)
|
|
1.80
%
|
|
1.80
%
|
|
1.87
%
(g)
|
|
Gross expenses
|
|
1.81
%
|
|
1.84
%
|
|
1.90
%
|
|
1.85
%
|
|
1.89
%
|
|
Net investment income (loss)
|
|
(0.05
)%
|
|
0.11
%
|
|
0.05
%
|
|
(0.10
)%
|
|
(0.49
)%
|
|
Portfolio turnover rate
|
|
53
%
|
|
51
%
|
|
40
%
|
|
69
%
|
|
23
%
|
|
(a)
|
Per share net investment income (loss) has been calculated using the average shares outstanding during the period.
|
|
(b)
|
Amount rounds to less than $0.01 per share.
|
|
(c)
|
A contingent deferred sales charge for Class C shares is not reflected in total return calculations.
|
|
(d)
|
Had certain expenses not been waived/reimbursed during the period, total returns would have been lower.
|
|
(e)
|
The investment adviser agreed to waive its fees and/or reimburse a portion of the Fund’s expenses during the period. Without this waiver/reimbursement, expenses would have been higher.
|
|
(f)
|
Effective July 1, 2024, the expense limit decreased from 1.80% to 1.78%.
|
|
(g)
|
Effective July 1, 2021, the expense limit decreased from 2.05% to 1.80%.
|
|
|
Class N
|
|||||||||
|
|
Year Ended
December 31, 2025 |
Year Ended
December 31, 2024 |
Year Ended
December 31, 2023 |
Year Ended
December 31, 2022 |
Year Ended
December 31, 2021 |
|||||
|
Net asset value, beginning of the period
|
$
|
32.29
|
$
|
29.63
|
$
|
23.36
|
$
|
31.13
|
$
|
24.72
|
|
INCOME (LOSS) FROM INVESTMENT OPERATIONS:
|
|
|
|
|
|
|
|
|
|
|
|
Net investment income(a)
|
|
0.33
|
|
0.38
|
|
0.30
|
|
0.26
|
|
0.23
|
|
Net realized and unrealized gain (loss)
|
|
4.47
|
|
4.39
|
|
7.03
|
|
(4.29
)
|
|
8.31
|
|
Total from Investment Operations
|
|
4.80
|
|
4.77
|
|
7.33
|
|
(4.03
)
|
|
8.54
|
|
LESS DISTRIBUTIONS FROM:
|
|
|
|
|
|
|
|
|
|
|
|
Net investment income
|
|
(0.33
)
|
|
(0.35
)
|
|
(0.23
)
|
|
(0.28
)
|
|
(0.14
)
|
|
Net realized capital gains
|
|
(2.02
)
|
|
(1.76
)
|
|
(0.83
)
|
|
(3.46
)
|
|
(1.99
)
|
|
Total Distributions
|
|
(2.35
)
|
|
(2.11
)
|
|
(1.06
)
|
|
(3.74
)
|
|
(2.13
)
|
|
Net asset value, end of the period
|
$
|
34.74
|
$
|
32.29
|
$
|
29.63
|
$
|
23.36
|
$
|
31.13
|
|
Total return(b)
|
|
15.20
%
|
|
16.17
%
|
|
31.35
%
|
|
(13.06
)%
|
|
34.54
%
|
|
RATIOS TO AVERAGE NET ASSETS:
|
|
|
|
|
|
|
|
|
|
|
|
Net assets, end of the period (000’s)
|
$
|
4,680
|
$
|
1,718
|
$
|
647
|
$
|
517
|
$
|
682
|
|
Net expenses(c)
|
|
0.73
%
|
|
0.74
%
(d)
|
|
0.75
%
|
|
0.75
%
|
|
0.80
%
(e)
|
|
Gross expenses
|
|
0.81
%
(f)
|
|
0.89
%
(g)
|
|
1.03
%
|
|
0.93
%
|
|
1.55
%
|
|
Net investment income
|
|
0.99
%
|
|
1.16
%
|
|
1.11
%
|
|
0.93
%
|
|
0.79
%
|
|
Portfolio turnover rate
|
|
53
%
|
|
51
%
|
|
40
%
|
|
69
%
|
|
23
%
|
|
(a)
|
Per share net investment income has been calculated using the average shares outstanding during the period.
|
|
(b)
|
Had certain expenses not been waived/reimbursed during the period, total returns would have been lower.
|
|
(c)
|
The investment adviser agreed to waive its fees and/or reimburse a portion of the Fund’s expenses during the period. Without this waiver/reimbursement, expenses would have been higher.
|
|
(d)
|
Effective July 1, 2024, the expense limit decreased from 0.75% to 0.73%.
|
|
(e)
|
Effective July 1, 2021, the expense limit decreased from 1.00% to 0.75%.
|
|
(f)
|
Includes transfer agent fees and expenses before expense offset. Without these expenses the ratio of gross expenses would have been 0.79%.
|
|
(g)
|
Includes transfer agent fees and expenses before expense offset. Without these expenses the ratio of gross expenses would have been 0.87%.
|
|
|
Class Y
|
|||||||||
|
|
Year Ended
December 31, 2025 |
Year Ended
December 31, 2024 |
Year Ended
December 31, 2023 |
Year Ended
December 31, 2022 |
Year Ended
December 31, 2021 |
|||||
|
Net asset value, beginning of the period
|
$
|
32.18
|
$
|
29.53
|
$
|
23.29
|
$
|
31.04
|
$
|
24.68
|
|
INCOME (LOSS) FROM INVESTMENT OPERATIONS:
|
|
|
|
|
|
|
|
|
|
|
|
Net investment income(a)
|
|
0.32
|
|
0.36
|
|
0.31
|
|
0.25
|
|
0.17
|
|
Net realized and unrealized gain (loss)
|
|
4.44
|
|
4.39
|
|
6.98
|
|
(4.28
)
|
|
8.31
|
|
Total from Investment Operations
|
|
4.76
|
|
4.75
|
|
7.29
|
|
(4.03
)
|
|
8.48
|
|
LESS DISTRIBUTIONS FROM:
|
|
|
|
|
|
|
|
|
|
|
|
Net investment income
|
|
(0.31
)
|
|
(0.34
)
|
|
(0.22
)
|
|
(0.26
)
|
|
(0.13
)
|
|
Net realized capital gains
|
|
(2.02
)
|
|
(1.76
)
|
|
(0.83
)
|
|
(3.46
)
|
|
(1.99
)
|
|
Total Distributions
|
|
(2.33
)
|
|
(2.10
)
|
|
(1.05
)
|
|
(3.72
)
|
|
(2.12
)
|
|
Net asset value, end of the period
|
$
|
34.61
|
$
|
32.18
|
$
|
29.53
|
$
|
23.29
|
$
|
31.04
|
|
Total return(b)
|
|
15.15
%
|
|
16.13
%
|
|
31.28
%
|
|
(13.10
)%
|
|
34.35
%
|
|
RATIOS TO AVERAGE NET ASSETS:
|
|
|
|
|
|
|
|
|
|
|
|
Net assets, end of the period (000’s)
|
$
|
825,265
|
$
|
525,267
|
$
|
323,867
|
$
|
103,213
|
$
|
99,008
|
|
Net expenses(c)
|
|
0.78
%
|
|
0.79
%
(d)
|
|
0.80
%
|
|
0.80
%
|
|
0.86
%
(e)
|
|
Gross expenses
|
|
0.81
%
|
|
0.84
%
|
|
0.90
%
|
|
0.85
%
|
|
0.89
%
|
|
Net investment income
|
|
0.96
%
|
|
1.12
%
|
|
1.13
%
|
|
0.89
%
|
|
0.56
%
|
|
Portfolio turnover rate
|
|
53
%
|
|
51
%
|
|
40
%
|
|
69
%
|
|
23
%
|
|
(a)
|
Per share net investment income has been calculated using the average shares outstanding during the period.
|
|
(b)
|
Had certain expenses not been waived/reimbursed during the period, total returns would have been lower.
|
|
(c)
|
The investment adviser agreed to waive its fees and/or reimburse a portion of the Fund’s expenses during the period. Without this waiver/reimbursement, expenses would have been higher.
|
|
(d)
|
Effective July 1, 2024, the expense limit decreased from 0.80% to 0.78%.
|
|
(e)
|
Effective July 1, 2021, the expense limit decreased from 1.05% to 0.80%.
|
|
|
Class A
|
|||||||||
|
|
Year Ended
December 31, 2025 |
Year Ended
December 31, 2024 |
Year Ended
December 31, 2023 |
Year Ended
December 31, 2022 |
Year Ended
December 31, 2021 |
|||||
|
Net asset value, beginning of the period
|
$
|
13.49
|
$
|
14.64
|
$
|
12.52
|
$
|
15.15
|
$
|
14.15
|
|
INCOME (LOSS) FROM INVESTMENT OPERATIONS:
|
|
|
|
|
|
|
|
|
|
|
|
Net investment income(a)
|
|
0.36
|
|
0.26
|
|
0.26
(b)
|
|
0.19
|
|
0.27
(c)
|
|
Net realized and unrealized gain (loss)
|
|
4.05
|
|
(1.01
)
|
|
2.11
|
|
(2.60
)
|
|
0.96
|
|
Total from Investment Operations
|
|
4.41
|
|
(0.75
)
|
|
2.37
|
|
(2.41
)
|
|
1.23
|
|
LESS DISTRIBUTIONS FROM:
|
|
|
|
|
|
|
|
|
|
|
|
Net investment income
|
|
(0.54
)
|
|
(0.40
)
|
|
(0.25
)
|
|
(0.22
)
|
|
(0.23
)
|
|
Net asset value, end of the period
|
$
|
17.36
|
$
|
13.49
|
$
|
14.64
|
$
|
12.52
|
$
|
15.15
|
|
Total return(d)(e)
|
|
32.60
%
|
|
(5.13
)%
|
|
18.94
%
(b)
|
|
(15.91
)%
|
|
8.73
%
(c)
|
|
RATIOS TO AVERAGE NET ASSETS:
|
|
|
|
|
|
|
|
|
|
|
|
Net assets, end of the period (000’s)
|
$
|
133,269
|
$
|
111,397
|
$
|
142,825
|
$
|
120,316
|
$
|
152,900
|
|
Net expenses(f)
|
|
1.28
%
(g)
|
|
1.15
%
|
|
1.15
%
|
|
1.15
%
|
|
1.17
%
(h)
|
|
Gross expenses
|
|
1.55
%
(g)
|
|
1.38
%
|
|
1.37
%
|
|
1.38
%
|
|
1.34
%
|
|
Net investment income
|
|
2.26
%
|
|
1.84
%
|
|
1.84
%
(b)
|
|
1.48
%
|
|
1.73
%
(c)
|
|
Portfolio turnover rate
|
|
68
%
|
|
35
%
|
|
26
%
|
|
33
%
|
|
37
%
|
|
(a)
|
Per share net investment income has been calculated using the average shares outstanding during the period.
|
|
(b)
|
Includes tax reclaims. Without these, net investment income per share would have been $0.25, total return would have been 18.78% and the ratio of net investment income to average net assets would have been 1.74%.
|
|
(c)
|
Includes a non-recurring dividend and tax reclaims. Without these, net investment income per share would have been $0.13, total return would have been 7.74% and the ratio of net investment income to average net assets would have been 0.84%.
|
|
(d)
|
A sales charge for Class A shares is not reflected in total return calculations.
|
|
(e)
|
Had certain expenses not been waived/reimbursed during the period, total returns would have been lower.
|
|
(f)
|
The investment adviser agreed to waive its fees and/or reimburse a portion of the Fund’s expenses during the period. Without this waiver/reimbursement, expenses would have been higher.
|
|
(g)
|
Includes tax reclaim IRS closing agreement expenses of 0.13%.
|
|
(h)
|
Effective July 1, 2021, the expense limit decreased from 1.20% to 1.15%.
|
|
|
Class C
|
|||||||||
|
|
Year Ended
December 31, 2025 |
Year Ended
December 31, 2024 |
Year Ended
December 31, 2023 |
Year Ended
December 31, 2022 |
Year Ended
December 31, 2021 |
|||||
|
Net asset value, beginning of the period
|
$
|
13.31
|
$
|
14.42
|
$
|
12.31
|
$
|
14.86
|
$
|
13.85
|
|
INCOME (LOSS) FROM INVESTMENT OPERATIONS:
|
|
|
|
|
|
|
|
|
|
|
|
Net investment income(a)
|
|
0.24
|
|
0.15
|
|
0.16
(b)
|
|
0.10
|
|
0.13
(c)
|
|
Net realized and unrealized gain (loss)
|
|
3.98
|
|
(1.00
)
|
|
2.06
|
|
(2.55
)
|
|
0.97
|
|
Total from Investment Operations
|
|
4.22
|
|
(0.85
)
|
|
2.22
|
|
(2.45
)
|
|
1.10
|
|
LESS DISTRIBUTIONS FROM:
|
|
|
|
|
|
|
|
|
|
|
|
Net investment income
|
|
(0.37
)
|
|
(0.26
)
|
|
(0.11
)
|
|
(0.10
)
|
|
(0.09
)
|
|
Net asset value, end of the period
|
$
|
17.16
|
$
|
13.31
|
$
|
14.42
|
$
|
12.31
|
$
|
14.86
|
|
Total return(d)(e)
|
|
31.66
%
|
|
(5.88
)%
|
|
18.01
%
(b)
|
|
(16.50
)%
|
|
7.92
%
(c)
|
|
RATIOS TO AVERAGE NET ASSETS:
|
|
|
|
|
|
|
|
|
|
|
|
Net assets, end of the period (000’s)
|
$
|
13,384
|
$
|
17,235
|
$
|
28,598
|
$
|
39,202
|
$
|
69,335
|
|
Net expenses(f)
|
|
2.00
%
(g)
|
|
1.90
%
|
|
1.90
%
|
|
1.90
%
|
|
1.93
%
(h)
|
|
Gross expenses
|
|
2.28
%
(g)
|
|
2.13
%
|
|
2.12
%
|
|
2.13
%
|
|
2.09
%
|
|
Net investment income
|
|
1.56
%
|
|
1.08
%
|
|
1.18
%
(b)
|
|
0.78
%
|
|
0.85
%
(c)
|
|
Portfolio turnover rate
|
|
68
%
|
|
35
%
|
|
26
%
|
|
33
%
|
|
37
%
|
|
(a)
|
Per share net investment income has been calculated using the average shares outstanding during the period.
|
|
(b)
|
Includes tax reclaims. Without these, net investment income per share would have been $0.15, total return would have been 17.85% and the ratio of net investment income to average net assets would have been 1.10%.
|
|
(c)
|
Includes a non-recurring dividend and tax reclaims. Without these, net investment income per share would have been $0.02, total return would have been 6.98% and the ratio of net investment income to average net assets would have been 0.13%.
|
|
(d)
|
A contingent deferred sales charge for Class C shares is not reflected in total return calculations.
|
|
(e)
|
Had certain expenses not been waived/reimbursed during the period, total returns would have been lower.
|
|
(f)
|
The investment adviser agreed to waive its fees and/or reimburse a portion of the Fund’s expenses during the period. Without this waiver/reimbursement, expenses would have been higher.
|
|
(g)
|
Includes tax reclaim IRS closing agreement expenses of 0.10%.
|
|
(h)
|
Effective July 1, 2021, the expense limit decreased from 1.95% to 1.90%.
|
|
|
Class N
|
|||||||||
|
|
Year Ended
December 31, 2025 |
Year Ended
December 31, 2024 |
Year Ended
December 31, 2023 |
Year Ended
December 31, 2022 |
Year Ended
December 31, 2021 |
|||||
|
Net asset value, beginning of the period
|
$
|
13.42
|
$
|
14.57
|
$
|
12.46
|
$
|
15.08
|
$
|
14.09
|
|
INCOME (LOSS) FROM INVESTMENT OPERATIONS:
|
|
|
|
|
|
|
|
|
|
|
|
Net investment income(a)
|
|
0.43
|
|
0.24
|
|
0.29
(b)
|
|
0.32
|
|
0.38
(c)
|
|
Net realized and unrealized gain (loss)
|
|
4.00
|
|
(0.94
)
|
|
2.11
|
|
(2.68
)
|
|
0.89
|
|
Total from Investment Operations
|
|
4.43
|
|
(0.70
)
|
|
2.40
|
|
(2.36
)
|
|
1.27
|
|
LESS DISTRIBUTIONS FROM:
|
|
|
|
|
|
|
|
|
|
|
|
Net investment income
|
|
(0.59
)
|
|
(0.45
)
|
|
(0.29
)
|
|
(0.26
)
|
|
(0.28
)
|
|
Net asset value, end of the period
|
$
|
17.26
|
$
|
13.42
|
$
|
14.57
|
$
|
12.46
|
$
|
15.08
|
|
Total return(d)
|
|
32.91
%
|
|
(4.82
)%
|
|
19.30
%
(b)
|
|
(15.65
)%
|
|
9.01
%
(c)
|
|
RATIOS TO AVERAGE NET ASSETS:
|
|
|
|
|
|
|
|
|
|
|
|
Net assets, end of the period (000’s)
|
$
|
454
|
$
|
407
|
$
|
348
|
$
|
222
|
$
|
704
|
|
Net expenses(e)
|
|
0.96
%
(f)
|
|
0.85
%
|
|
0.85
%
|
|
0.85
%
|
|
0.87
%
(g)
|
|
Gross expenses
|
|
1.38
%
(f)(h)
|
|
1.21
%
(i)
|
|
1.44
%
|
|
1.01
%
|
|
1.25
%
|
|
Net investment income
|
|
2.77
%
|
|
1.69
%
|
|
2.08
%
(b)
|
|
2.56
%
|
|
2.49
%
(c)
|
|
Portfolio turnover rate
|
|
68
%
|
|
35
%
|
|
26
%
|
|
33
%
|
|
37
%
|
|
(a)
|
Per share net investment income has been calculated using the average shares outstanding during the period.
|
|
(b)
|
Includes tax reclaims. Without these, net investment income per share would have been $0.27, total return would have been 19.14% and the ratio of net investment income to average net assets would have been 1.95%.
|
|
(c)
|
Includes a non-recurring dividend and tax reclaims. Without these, net investment income per share would have been $0.11, total return would have been 8.09% and the ratio of net investment income to average net assets would have been 0.70%.
|
|
(d)
|
Had certain expenses not been waived/reimbursed during the period, total returns would have been lower.
|
|
(e)
|
The investment adviser agreed to waive its fees and/or reimburse a portion of the Fund’s expenses during the period. Without this waiver/reimbursement, expenses would have been higher.
|
|
(f)
|
Includes tax reclaim IRS closing agreement expenses of 0.11%.
|
|
(g)
|
Effective July 1, 2021, the expense limit decreased from 0.90% to 0.85%.
|
|
(h)
|
Includes transfer agent fees and expenses before expense offset. Without these expenses the ratio of gross expenses would have been 1.37%.
|
|
(i)
|
Includes transfer agent fees and expenses before expense offset. Without these expenses the ratio of gross expenses would have been 1.19%.
|
|
|
Class Y
|
|||||||||
|
|
Year Ended
December 31, 2025 |
Year Ended
December 31, 2024 |
Year Ended
December 31, 2023 |
Year Ended
December 31, 2022 |
Year Ended
December 31, 2021 |
|||||
|
Net asset value, beginning of the period
|
$
|
13.41
|
$
|
14.56
|
$
|
12.45
|
$
|
15.07
|
$
|
14.08
|
|
INCOME (LOSS) FROM INVESTMENT OPERATIONS:
|
|
|
|
|
|
|
|
|
|
|
|
Net investment income(a)
|
|
0.39
|
|
0.29
|
|
0.29
(b)
|
|
0.22
|
|
0.30
(c)
|
|
Net realized and unrealized gain (loss)
|
|
4.04
|
|
(1.00
)
|
|
2.11
|
|
(2.58
)
|
|
0.96
|
|
Total from Investment Operations
|
|
4.43
|
|
(0.71
)
|
|
2.40
|
|
(2.36
)
|
|
1.26
|
|
LESS DISTRIBUTIONS FROM:
|
|
|
|
|
|
|
|
|
|
|
|
Net investment income
|
|
(0.58
)
|
|
(0.44
)
|
|
(0.29
)
|
|
(0.26
)
|
|
(0.27
)
|
|
Net asset value, end of the period
|
$
|
17.26
|
$
|
13.41
|
$
|
14.56
|
$
|
12.45
|
$
|
15.07
|
|
Total return(d)
|
|
32.94
%
|
|
(4.89
)%
|
|
19.26
%
(b)
|
|
(15.71
)%
|
|
8.97
%
(c)
|
|
RATIOS TO AVERAGE NET ASSETS:
|
|
|
|
|
|
|
|
|
|
|
|
Net assets, end of the period (000’s)
|
$
|
157,741
|
$
|
139,971
|
$
|
216,862
|
$
|
200,175
|
$
|
312,930
|
|
Net expenses(e)
|
|
1.03
%
(f)
|
|
0.90
%
|
|
0.90
%
|
|
0.90
%
|
|
0.92
%
(g)
|
|
Gross expenses
|
|
1.30
%
(f)
|
|
1.13
%
|
|
1.12
%
|
|
1.13
%
|
|
1.09
%
|
|
Net investment income
|
|
2.46
%
|
|
2.04
%
|
|
2.08
%
(b)
|
|
1.66
%
|
|
1.96
%
(c)
|
|
Portfolio turnover rate
|
|
68
%
|
|
35
%
|
|
26
%
|
|
33
%
|
|
37
%
|
|
(a)
|
Per share net investment income has been calculated using the average shares outstanding during the period.
|
|
(b)
|
Includes tax reclaims. Without these, net investment income per share would have been $0.28, total return would have been 19.18% and the ratio of net investment income to average net assets would have been 1.98%.
|
|
(c)
|
Includes a non-recurring dividend and tax reclaims. Without these, net investment income per share would have been $0.17, total return would have been 8.04% and the ratio of net investment income to average net assets would have been 1.07%.
|
|
(d)
|
Had certain expenses not been waived/reimbursed during the period, total returns would have been lower.
|
|
(e)
|
The investment adviser agreed to waive its fees and/or reimburse a portion of the Fund’s expenses during the period. Without this waiver/reimbursement, expenses would have been higher.
|
|
(f)
|
Includes tax reclaim IRS closing agreement expenses of 0.13%.
|
|
(g)
|
Effective July 1, 2021, the expense limit decreased from 0.95% to 0.90%.
|
|
|
Class A
|
|||||||||
|
|
Year Ended
December 31, 2025 |
Year Ended
December 31, 2024 |
Year Ended
December 31, 2023 |
Year Ended
December 31, 2022 |
Year Ended
December 31, 2021 |
|||||
|
Net asset value, beginning of the period
|
$
|
43.26
|
$
|
36.73
|
$
|
29.01
|
$
|
43.12
|
$
|
39.04
|
|
INCOME (LOSS) FROM INVESTMENT OPERATIONS:
|
|
|
|
|
|
|
|
|
|
|
|
Net investment income (loss)(a)
|
|
0.00
(b)
|
|
0.04
|
|
0.04
|
|
0.03
|
|
(0.11
)
|
|
Net realized and unrealized gain (loss)
|
|
7.24
|
|
9.26
|
|
10.66
|
|
(8.89
)
|
|
8.99
|
|
Total from Investment Operations
|
|
7.24
|
|
9.30
|
|
10.70
|
|
(8.86
)
|
|
8.88
|
|
LESS DISTRIBUTIONS FROM:
|
|
|
|
|
|
|
|
|
|
|
|
Net investment income
|
|
—
|
|
(0.05
)
|
|
(0.03
)
|
|
(0.03
)
|
|
—
|
|
Net realized capital gains
|
|
(2.82
)
|
|
(2.72
)
|
|
(2.95
)
|
|
(5.22
)
|
|
(4.80
)
|
|
Total Distributions
|
|
(2.82
)
|
|
(2.77
)
|
|
(2.98
)
|
|
(5.25
)
|
|
(4.80
)
|
|
Net asset value, end of the period
|
$
|
47.68
|
$
|
43.26
|
$
|
36.73
|
$
|
29.01
|
$
|
43.12
|
|
Total return(c)
|
|
17.32
%
|
|
25.23
%
|
|
37.01
%
|
|
(21.15
)%
|
|
23.14
%
|
|
RATIOS TO AVERAGE NET ASSETS:
|
|
|
|
|
|
|
|
|
|
|
|
Net assets, end of the period (000’s)
|
$
|
769,429
|
$
|
706,644
|
$
|
612,653
|
$
|
512,392
|
$
|
733,423
|
|
Net expenses
|
|
1.06
%
|
|
1.07
%
|
|
1.10
%
|
|
1.12
%
|
|
1.14
%
|
|
Gross expenses
|
|
1.06
%
|
|
1.07
%
|
|
1.10
%
|
|
1.12
%
|
|
1.14
%
|
|
Net investment income (loss)
|
|
0.00
%
(d)
|
|
0.09
%
|
|
0.11
%
|
|
0.09
%
|
|
(0.25
)%
|
|
Portfolio turnover rate
|
|
38
%
|
|
33
%
|
|
36
%
|
|
46
%
|
|
18
%
|
|
(a)
|
Per share net investment income (loss) has been calculated using the average shares outstanding during the period.
|
|
(b)
|
Amount rounds to less than $0.01 per share.
|
|
(c)
|
A sales charge for Class A shares is not reflected in total return calculations.
|
|
(d)
|
Amount rounds to less than 0.01%.
|
|
|
Class C
|
|||||||||
|
|
Year Ended
December 31, 2025 |
Year Ended
December 31, 2024 |
Year Ended
December 31, 2023 |
Year Ended
December 31, 2022 |
Year Ended
December 31, 2021 |
|||||
|
Net asset value, beginning of the period
|
$
|
14.09
|
$
|
13.51
|
$
|
12.12
|
$
|
21.82
|
$
|
21.89
|
|
INCOME (LOSS) FROM INVESTMENT OPERATIONS:
|
|
|
|
|
|
|
|
|
|
|
|
Net investment loss(a)
|
|
(0.11
)
|
|
(0.10
)
|
|
(0.09
)
|
|
(0.12
)
|
|
(0.24
)
|
|
Net realized and unrealized gain (loss)
|
|
2.18
|
|
3.41
|
|
4.43
|
|
(4.36
)
|
|
4.97
|
|
Total from Investment Operations
|
|
2.07
|
|
3.31
|
|
4.34
|
|
(4.48
)
|
|
4.73
|
|
LESS DISTRIBUTIONS FROM:
|
|
|
|
|
|
|
|
|
|
|
|
Net investment income
|
|
—
|
|
(0.01
)
|
|
—
|
|
—
|
|
—
|
|
Net realized capital gains
|
|
(2.82
)
|
|
(2.72
)
|
|
(2.95
)
|
|
(5.22
)
|
|
(4.80
)
|
|
Total Distributions
|
|
(2.82
)
|
|
(2.73
)
|
|
(2.95
)
|
|
(5.22
)
|
|
(4.80
)
|
|
Net asset value, end of the period
|
$
|
13.34
|
$
|
14.09
|
$
|
13.51
|
$
|
12.12
|
$
|
21.82
|
|
Total return(b)
|
|
16.42
%
|
|
24.32
%
|
|
35.98
%
|
|
(21.77
)%
|
|
22.27
%
|
|
RATIOS TO AVERAGE NET ASSETS:
|
|
|
|
|
|
|
|
|
|
|
|
Net assets, end of the period (000’s)
|
$
|
26,946
|
$
|
28,720
|
$
|
30,479
|
$
|
29,356
|
$
|
57,492
|
|
Net expenses
|
|
1.81
%
|
|
1.82
%
|
|
1.85
%
|
|
1.87
%
|
|
1.89
%
|
|
Gross expenses
|
|
1.81
%
|
|
1.82
%
|
|
1.85
%
|
|
1.87
%
|
|
1.89
%
|
|
Net investment loss
|
|
(0.75
)%
|
|
(0.65
)%
|
|
(0.64
)%
|
|
(0.66
)%
|
|
(0.99
)%
|
|
Portfolio turnover rate
|
|
38
%
|
|
33
%
|
|
36
%
|
|
46
%
|
|
18
%
|
|
(a)
|
Per share net investment loss has been calculated using the average shares outstanding during the period.
|
|
(b)
|
A contingent deferred sales charge for Class C shares is not reflected in total return calculations.
|
|
|
Class N
|
|||||||||
|
|
Year Ended
December 31, 2025 |
Year Ended
December 31, 2024 |
Year Ended
December 31, 2023 |
Year Ended
December 31, 2022 |
Year Ended
December 31, 2021 |
|||||
|
Net asset value, beginning of the period
|
$
|
58.31
|
$
|
48.71
|
$
|
37.72
|
$
|
54.14
|
$
|
47.84
|
|
INCOME (LOSS) FROM INVESTMENT OPERATIONS:
|
|
|
|
|
|
|
|
|
|
|
|
Net investment income(a)
|
|
0.19
|
|
0.20
|
|
0.20
|
|
0.18
|
|
0.03
|
|
Net realized and unrealized gain (loss)
|
|
9.86
|
|
12.30
|
|
13.89
|
|
(11.23
)
|
|
11.07
|
|
Total from Investment Operations
|
|
10.05
|
|
12.50
|
|
14.09
|
|
(11.05
)
|
|
11.10
|
|
LESS DISTRIBUTIONS FROM:
|
|
|
|
|
|
|
|
|
|
|
|
Net investment income
|
|
(0.13
)
|
|
(0.18
)
|
|
(0.15
)
|
|
(0.15
)
|
|
—
|
|
Net realized capital gains
|
|
(2.82
)
|
|
(2.72
)
|
|
(2.95
)
|
|
(5.22
)
|
|
(4.80
)
|
|
Total Distributions
|
|
(2.95
)
|
|
(2.90
)
|
|
(3.10
)
|
|
(5.37
)
|
|
(4.80
)
|
|
Net asset value, end of the period
|
$
|
65.41
|
$
|
58.31
|
$
|
48.71
|
$
|
37.72
|
$
|
54.14
|
|
Total return(b)
|
|
17.68
%
|
|
25.60
%
|
|
37.44
%
|
|
(20.88
)%
|
|
23.53
%
|
|
RATIOS TO AVERAGE NET ASSETS:
|
|
|
|
|
|
|
|
|
|
|
|
Net assets, end of the period (000’s)
|
$
|
2,951
|
$
|
2,206
|
$
|
224
|
$
|
167
|
$
|
177
|
|
Net expenses(c)
|
|
0.75
%
|
|
0.76
%
|
|
0.78
%
|
|
0.81
%
|
|
0.83
%
|
|
Gross expenses
|
|
0.79
%
|
|
0.82
%
|
|
1.39
%
|
|
1.34
%
|
|
1.38
%
|
|
Net investment income
|
|
0.31
%
|
|
0.35
%
|
|
0.43
%
|
|
0.41
%
|
|
0.06
%
|
|
Portfolio turnover rate
|
|
38
%
|
|
33
%
|
|
36
%
|
|
46
%
|
|
18
%
|
|
(a)
|
Per share net investment income has been calculated using the average shares outstanding during the period.
|
|
(b)
|
Had certain expenses not been waived/reimbursed during the period, total returns would have been lower.
|
|
(c)
|
The investment adviser agreed to waive its fees and/or reimburse a portion of the Fund’s expenses during the period. Without this waiver/reimbursement, expenses would have been higher.
|
|
|
Class Y
|
|||||||||
|
|
Year Ended
December 31, 2025 |
Year Ended
December 31, 2024 |
Year Ended
December 31, 2023 |
Year Ended
December 31, 2022 |
Year Ended
December 31, 2021 |
|||||
|
Net asset value, beginning of the period
|
$
|
58.10
|
$
|
48.54
|
$
|
37.60
|
$
|
53.99
|
$
|
47.74
|
|
INCOME (LOSS) FROM INVESTMENT OPERATIONS:
|
|
|
|
|
|
|
|
|
|
|
|
Net investment income(a)
|
|
0.16
|
|
0.19
|
|
0.17
|
|
0.15
|
|
0.00
(b)
|
|
Net realized and unrealized gain (loss)
|
|
9.82
|
|
12.24
|
|
13.84
|
|
(11.20
)
|
|
11.05
|
|
Total from Investment Operations
|
|
9.98
|
|
12.43
|
|
14.01
|
|
(11.05
)
|
|
11.05
|
|
LESS DISTRIBUTIONS FROM:
|
|
|
|
|
|
|
|
|
|
|
|
Net investment income
|
|
(0.10
)
|
|
(0.15
)
|
|
(0.12
)
|
|
(0.12
)
|
|
—
|
|
Net realized capital gains
|
|
(2.82
)
|
|
(2.72
)
|
|
(2.95
)
|
|
(5.22
)
|
|
(4.80
)
|
|
Total Distributions
|
|
(2.92
)
|
|
(2.87
)
|
|
(3.07
)
|
|
(5.34
)
|
|
(4.80
)
|
|
Net asset value, end of the period
|
$
|
65.16
|
$
|
58.10
|
$
|
48.54
|
$
|
37.60
|
$
|
53.99
|
|
Total return
|
|
17.62
%
|
|
25.54
%
|
|
37.35
%
|
|
(20.95
)%
|
|
23.48
%
|
|
RATIOS TO AVERAGE NET ASSETS:
|
|
|
|
|
|
|
|
|
|
|
|
Net assets, end of the period (000’s)
|
$
|
519,836
|
$
|
391,084
|
$
|
322,106
|
$
|
191,912
|
$
|
284,738
|
|
Net expenses
|
|
0.81
%
|
|
0.82
%
|
|
0.85
%
|
|
0.87
%
|
|
0.89
%
|
|
Gross expenses
|
|
0.81
%
|
|
0.82
%
|
|
0.85
%
|
|
0.87
%
|
|
0.89
%
|
|
Net investment income
|
|
0.25
%
|
|
0.34
%
|
|
0.37
%
|
|
0.35
%
|
|
0.00
%
(c)
|
|
Portfolio turnover rate
|
|
38
%
|
|
33
%
|
|
36
%
|
|
46
%
|
|
18
%
|
|
(a)
|
Per share net investment income has been calculated using the average shares outstanding during the period.
|
|
(b)
|
Amount rounds to less than $0.01 per share.
|
|
(c)
|
Amount rounds to less than 0.01%.
|
|
•
|
The redemption and repurchase occur in the same account.
|
|
•
|
The redemption proceeds are used to process an: IRA contribution, excess contributions, conversion, recharacterizing of contributions, or distribution, and the repurchase is done in an account within the same Edward Jones grouping for ROA.
|
|
•
|
The Right of Reinstatement excludes systematic or automatic transactions including, but not limited to, purchases made through payroll deductions, liquidations to cover account fees, and reinvestments from non-mutual fund products.
|
|
•
|
Shares of mutual funds available for purchase by employer-sponsored retirement, deferred compensation, and employee benefit plans (including health
|
|
savings accounts) and trusts used to fund those plans provided the shares are not held in a commission-based brokerage account and shares are held for the benefit of the plan. For purposes of this provision, employer-sponsored retirement plans do not include SEP IRAs, Simple IRAs, SAR-SEPs or Keogh plans;
|
|
•
|
Shares purchased through a Merrill investment advisory program;
|
|
•
|
Brokerage class shares exchanged from advisory class shares due to the holdings moving from a Merrill investment advisory program to a Merrill brokerage account;
|
|
•
|
Shares purchased through the Merrill Edge Self-Directed platform;
|
|
•
|
Shares purchased through the systematic reinvestment of capital gains distributions and dividend reinvestment when purchasing shares of the same mutual fund in the same account;
|
|
•
|
Shares exchanged from level-load shares to front-end load shares of the same mutual fund in accordance with the description in the Merrill SLWD Supplement;
|
|
•
|
Shares purchased by eligible employees of Merrill or its affiliates and their family members who purchase shares in accounts within the employee’s Merrill Household (as defined in the Merrill SLWD Supplement);
|
|
•
|
Shares purchased by eligible persons associated with the fund as defined in this prospectus (e.g. the fund’s officers or trustees);
|
|
•
|
Shares purchased from the proceeds of a mutual fund redemption in front-end load shares provided (1) the repurchase is in a mutual fund within the same fund family; (2) the repurchase occurs within 90 calendar days from the redemption trade date, and (3) the redemption and purchase occur in the same account (known as Rights of Reinstatement). Automated transactions (i.e. systematic purchases and withdrawals) and purchases made after shares are automatically sold to pay Merrill’s account maintenance fees are not eligible for Rights of Reinstatement.
|
|
•
|
Shares sold due to the client’s death or disability (as defined by Internal Revenue Code Section 22(e)(3));
|
|
•
|
Shares sold pursuant to a systematic withdrawal program subject to Merrill’s maximum systematic withdrawal limits as described in the Merrill SLWD Supplement;
|
|
•
|
Shares sold due to return of excess contributions from an IRA account;
|
|
•
|
Shares sold as part of a required minimum distribution for IRA and retirement accounts due to the investor reaching the qualified age based on applicable IRS regulation;
|
|
•
|
Front-end or level-load shares held in commission-based, non-taxable retirement brokerage accounts (e.g. traditional, Roth, rollover, SEP IRAs, Simple IRAs, SAR-SEPs or Keogh plans) that are transferred to fee-based accounts or platforms and exchanged for a lower cost share class of the same mutual fund.
|
|
•
|
Breakpoint discounts, as described in this prospectus, where the sales load is at or below the maximum sales load that Merrill permits to be assessed to a front-end load purchase, as described in the Merrill SLWD Supplement;
|
|
•
|
Rights of Accumulation (ROA), as described in the Merrill SLWD Supplement, which entitle clients to breakpoint discounts based on the aggregated holdings of mutual fund family assets held in accounts in their Merrill Household; On or about May 1, 2026, assets not held at Merrill will no longer be included in the ROA calculation. For more detail on the timing and calculation, please refer to the Merrill SLWD Supplement.
|
|
•
|
Letters of Intent (LOI), which allow for breakpoint discounts on eligible new purchases based on anticipated future eligible purchases within a fund family at Merrill, in accounts within your Merrill Household, as further described in the Merrill SLWD Supplement. On or about May 1, 2026, Merrill will no longer accept new LOIs. For more detail on the timing, please refer to the Merrill SLWD Supplement.
|
|
•
|
Wells Fargo Advisors employee and employee-related accounts according to Wells Fargo Advisor’s employee account linking rules. Legacy accounts and positions receiving affiliate discounts prior to the effective date will continue to receive discounts. Going forward employees of affiliate businesses will not be offered NAV.
|
|
•
|
Shares purchased through reinvestment of dividends and capital gains distributions when purchasing shares of the same fund.
|
|
•
|
Shares purchased through a rollover from another 529 plan.
|
|
•
|
Recontribution(s) of distributed funds are only allowed during the NAV reinstatement period as dictated by the sponsor’s specifications outlined by the plan.
|
|
•
|
Contingent deferred sales charges (CDSC) imposed on fund redemptions will not be rebated based on future purchases.
|
|
•
|
SEP or SIMPLE IRAs will not be aggregated as a group plan. They will aggregate with the client’s personal accounts based on Social Security Number. Previously established SEP and SIMPLE IRAs may still be aggregated as a group plan.
|
|
•
|
Employer-sponsored retirement plan (e.g., 401(k) plans, 457 plans, employer-sponsored 403(b) plans, profit sharing and money purchase pension plans and defined benefit plans) accounts will aggregate with other plan accounts under the same Tax ID and will not be aggregated with other retirement plan accounts under a different Tax ID or personal accounts. For purposes of this provision, employer-sponsored retirement plans do not include SEP IRAs, SIMPLE IRAs, SAR-SEPs or Keogh plans.
|
|
•
|
Gift of shares will not be considered when determining breakpoint discounts.
|
|
Bloomberg U.S. Aggregate Bond Index
|
A broad-based benchmark that measures the investment grade, US dollar-denominated, fixed-rate taxable bond market. The index includes Treasuries, government-related and corporate securities, mortgage-backed securities (agency fixed-rate pass-throughs), asset-backed securities and commercial mortgage-backed securities (agency and non-agency).
|
|
Bloomberg U.S. Corporate High-Yield Bond Index
|
Measures the market of U.S. dollar-denominated, non-investment grade, fixed-rate, taxable corporate bonds. Securities are classified as high yield if the middle rating of Moody’s, Fitch, and S&P is Ba1/BB+/BB+ or below, excluding emerging market debt.
|
|
ICE BofA 3-Month U.S.Treasury Bill Index
|
The index measures the performance of a single issue of outstanding Treasury bill which matures closest to, but not beyond, three months from the rebalancing date. The issue is purchased at the beginning of the month and held for a full month. At the end of the month that issue is sold and rolled into a newly selected issue.
|
|
MSCI All Country World ex USA Index (Net)
|
A free float-adjusted market capitalization weighted index that captures large and mid-cap representation across both developed and emerging markets, excluding the United States.
|
|
MSCI World ex USA Index (Net)
|
A free float-adjusted market capitalization weighted index that captures large and mid-cap representation across developed markets. The United States and emerging markets are excluded.
|
|
Russell 1000® Index
|
The index measures the performance of the large-cap segment of the U.S. equity universe. It is a subset of the Russell 3000® Index and includes approximately 1,000 of the largest securities based on a combination of their market cap and current index membership.
|
|
S&P 500® Index
|
The index measures the performance of 500 widely held stocks in the U.S. equity market. Standard and Poor’s chooses member companies for the index based on market size, liquidity and industry group representation.
|
|
Investment Company Act File No. 811-04323
Investment Company Act File No. 811-00242
Investment Company Act File No. 811-06241
|
XLH51-0526
|

|
*(1)
|
Purchase any security (other than U.S. government securities) if, as a result, 25% or more of the Fund’s total assets (taken at current value) would be invested in any one industry. For purposes of this restriction, telephone, gas and electric public utilities are each regarded as separate industries and finance companies whose financing activities are related primarily to the activities of their parent companies are classified in the industry of their parents. For purposes of this restriction with regard to bank obligations, bank obligations are considered to be one industry, and asset-backed securities are not considered to be bank obligations.
|
|
*(2)
|
Make short sales of securities or maintain a short position or purchase securities on margin, except that the Fund may obtain short-term credits as necessary for the clearance of security transactions, and the Fund may make any short sales or maintain any short positions where the short sales or short positions would not constitute “senior securities” under the 1940 Act.
|
|
†*(3)
|
Borrow money, except to the extent permitted under the 1940 Act.
|
|
*(4)
|
Make loans, except that the Fund may purchase or hold debt instruments in accordance with its investment objectives and policies, provided however, this restriction does not apply to repurchase agreements or loans of portfolio securities.
|
|
*(5)
|
Act as an underwriter of securities of other issuers except that, in the disposition of portfolio securities, it may be deemed to be an underwriter under the federal securities laws.
|
|
*(6)
|
Purchase or sell real estate, although it may purchase securities of issuers which deal in real estate, securities which are secured by interests in real estate, and securities which represent interests in real estate, and it may acquire and dispose of real estate or interests in real estate acquired through the exercise of its rights as a holder of debt obligations secured by real estate or interests therein.
|
|
*(7)
|
Purchase or sell commodities, except that the Fund may purchase and sell futures contracts and options, may enter into foreign exchange contracts and may enter into swap agreements and other financial transactions not requiring the delivery of physical commodities.
|
|
*(8)
|
Issue senior securities, except for permitted borrowings or as otherwise permitted under the 1940 Act.
|
|
*(1)
|
Purchase any security (other than U.S. government securities) if, as a result, 25% or more of the Fund’s total assets (taken at current value) would be invested in any one industry. For purposes of this restriction, telephone, gas and electric public utilities are each regarded as separate industries and finance companies whose financing activities are related primarily to the activities of their parent companies are classified in the industry of their parents, finance companies whose financing activities are not related primarily to the activities of their parent companies are classified in the industry the Fund’s adviser believes is most applicable to such finance companies, and each foreign country’s government (together with all subdivisions thereof) will be considered to be a separate industry. For purposes of this restriction, asset-backed securities are not considered to be bank obligations.
|
|
*(2)
|
Make short sales of securities or maintain a short position, except that the Fund may make any short sales or maintain any short positions where the short sales or short positions would not constitute “senior securities” under the 1940 Act.
|
|
†*(3)
|
Borrow money, except to the extent permitted under the 1940 Act.
|
|
*(4)
|
Make loans, except that the Fund may purchase or hold debt instruments in accordance with its investment objectives and policies, provided, however, this restriction does not apply to repurchase agreements or loans of portfolio securities.
|
|
*(5)
|
Act as an underwriter of securities of other issuers except that, in the disposition of portfolio securities, it may be deemed to be an underwriter under the federal securities laws.
|
|
*(6)
|
Purchase or sell real estate, although it may purchase securities of issuers which deal in real estate, securities which are secured by interests in real estate, and securities which represent interests in real estate, and it may acquire and dispose of real estate or interests in real estate acquired through the exercise of its rights as a holder of debt obligations secured by real estate or interests therein.
|
|
*(7)
|
Issue senior securities, except for permitted borrowings or as otherwise permitted under the 1940 Act.
|
|
*(8)
|
Purchase and sell commodities to the maximum extent permitted by applicable law.
|
|
*(1)
|
Purchase any security (other than U.S. government securities) if, as a result, more than 25% of the Fund’s total assets (taken at current value) would be invested in any one industry. For purposes of this restriction, telephone, gas and electric public utilities are each regarded as separate industries, finance companies whose financing activities are related primarily to the activities of their parent companies are classified in the industry of their parents and each foreign country’s government (together with all subdivisions thereof) will be considered to be a separate industry). For purposes of this restriction, securities and other obligations of issuers in the banking industry are considered to be one industry, and asset-backed securities are not considered to be bank obligations.
|
|
*(2)
|
Make short sales of securities or maintain a short position or purchase securities on margin, except that the Fund may obtain short-term credits as necessary for the clearance of security transactions, and the Fund may make any short sales or maintain any short positions where the short sales or short positions would not constitute “senior securities” under the 1940 Act.
|
|
†*(3)
|
Borrow money except to the extent permitted under the 1940 Act.
|
|
*(4)
|
Make loans, except that the Fund may purchase or hold debt instruments in accordance with its investment objectives and policies, provided however, this restriction does not apply to repurchase agreements or loans of portfolio securities.
|
|
*(5)
|
Purchase or sell commodities, except that the Fund may buy and sell futures contracts and options, may enter into foreign exchange contracts and may enter into swap agreements and other financial transactions not requiring the delivery of physical commodities.
|
|
*(6)
|
Act as underwriter of securities of other issuers except that, in the disposition of portfolio securities, it may be deemed to be an underwriter under the federal securities laws.
|
|
*(7)
|
Purchase or sell real estate, although it may purchase securities of issuers which deal in real estate, securities which are secured by interests in real estate, and securities which represent interests in real estate, and it may acquire and dispose of real estate or interests in real estate acquired through the exercise of its rights as a holder of debt obligations secured by real estate or interests therein.
|
|
*(8)
|
Issue senior securities, except for permitted borrowings or as otherwise permitted under the 1940 Act.
|
|
(1)
|
With respect to 75% of its total assets, invest in the securities of any one issuer (other than the U.S. government and its agencies and instrumentalities) if, immediately after and as a result of such investment, more than 5% of the total assets of the Fund would be invested in such issuer.
|
|
*(2)
|
Purchase any security (other than U.S. government securities) if, as a result, more than 25% of the Fund’s total assets (taken at current value) would be invested in any one industry (in the utilities category, gas, electric, water and telephone companies will be considered as being in separate industries, and each foreign country’s government (together with all subdivisions thereof) will be considered to be a separate industry.)
|
|
(3)
|
Purchase securities on margin (but it may obtain such short-term credits as may be necessary for the clearance of purchases and sales of securities). (For this purpose, the deposit or payment by the Fund of initial or variation margin in connection with futures contracts or related options transactions is not considered the purchase of a security on margin.)
|
|
(4)
|
Acquire more than 10% of any class of securities of an issuer (other than U.S. government securities and taking all preferred stock issues of an issuer as a single class and all debt issues of an issuer as a single class) or, with respect to 75% of its total assets, acquire more than 10% of the outstanding voting securities of an issuer.
|
|
†*(5)
|
Borrow money in excess of 33 1/3% of its total assets, and then only as a temporary measure for extraordinary or emergency purposes.
|
|
*(6)
|
Make loans, except by entering into repurchase agreements or by purchase of bonds, debentures, commercial paper, corporate notes and similar evidences of indebtedness, which are a part of an issue to the public or to financial institutions, or through the lending of the Fund’s portfolio securities.
|
|
*(7)
|
Buy or sell oil, gas or other mineral leases, rights or royalty contracts, real estate or commodities or commodity contracts, except that the Fund may buy and sell futures contracts and related options, swap contracts, currency forward contracts, structured notes and other similar instruments. (This restriction does not prevent the Fund from purchasing securities of companies investing in the foregoing.)
|
|
*(8)
|
Act as underwriter, except to the extent that, in connection with the disposition of portfolio securities, it may be deemed to be an underwriter under certain federal securities laws.
|
|
(9)
|
Except to the extent permitted by rule or order of the SEC, participate on a joint or joint and several basis in any trading account in securities. (The “bunching” of orders for the purchase or sale of portfolio securities with any investment adviser or subadviser of the Fund or accounts under any such investment adviser’s or subadviser’s management to reduce brokerage commissions, to average prices among them or to facilitate such transactions is not considered a trading account in securities for purposes of this restriction.)
|
|
†(10)
|
Purchase any illiquid security if, as a result, more than 15% of its net assets (taken at current value) would be invested in such securities.
|
|
*(11)
|
Issue senior securities. For the purpose of this restriction none of the following is deemed to be a senior security: any pledge or other encumbrance of assets permitted by restriction (6) above; any borrowing permitted by restriction (5) above; any collateral arrangements with respect to options or futures contracts, and with respect to initial and variation margin; the purchase or sale of options, forward contracts, futures contracts, swap contracts or other similar instruments; and the issuance of shares of beneficial interest permitted from time to time by the provisions of the Trust’s Declaration of Trust and by the 1940 Act, the rules thereunder, or any exemption therefrom. (The Fund is required, under regulatory provisions applicable to it as interpreted by the staff of the SEC, to set aside in a segregated account with its custodian bank liquid assets in amounts sufficient at all times to satisfy its obligations under options, futures contracts, forward contracts, swap contracts and other similar instruments.)
|
|
(12)
|
Pledge its assets to the maximum extent permitted by applicable law.
|
|
Fund
|
Date of Agreement
|
Advisory fee payable by Fund to Natixis Advisors (as a % of average daily net assets of the Fund)
|
|
Mid Cap Fund
|
10/31/08, as amended 7/1/21
|
0.75% of the first $1.5 billion
0.70% of the amounts in excess of $1.5 billion |
|
Small Cap Fund
|
10/30/00, as amended 7/1/21
|
0.85%
|
|
Fund
|
Date of Agreement
|
Advisory fee payable by Fund to Gateway
(as a % of average daily net assets of the Fund) |
|
Equity Call Premium Fund
|
9/30/14, as amended 7/1/21
|
0.58%
|
|
Gateway Fund
|
2/16/08, as amended 7/1/21
|
0.60% of the first $5 billion
0.55% of the next $5 billion 0.53% of amounts in excess of $10 billion |
|
Fund
|
Date of Agreement
|
Advisory fee payable by Fund to Mirova US
(as a % of average daily net assets of the Fund) |
|
Global Megatrends Fund
|
03/29/19
|
0.80%
|
|
Fund
|
Expense Limit
|
Date of Undertaking
|
|
Equity Call Premium Fund1
|
||
|
Class A
|
0.93%
|
May 1, 2026
|
|
Class C
|
1.68%
|
May 1, 2026
|
|
Class N
|
0.63%
|
May 1, 2026
|
|
Class Y
|
0.68%
|
May 1, 2026
|
|
Gateway Fund
|
||
|
Class A
|
0.94%
|
May 1, 2026
|
|
Class C
|
1.70%
|
May 1, 2026
|
|
Class N
|
0.65%
|
May 1, 2026
|
|
Class Y
|
0.70%
|
May 1, 2026
|
|
Fund
|
Expense Limit
|
Date of Undertaking
|
|
Global Megatrends Fund2
|
||
|
Class A
|
1.20%
|
May 1, 2026
|
|
Class C
|
1.95%
|
May 1, 2026
|
|
Class N
|
0.90%
|
May 1, 2026
|
|
Class Y
|
0.95%
|
May 1, 2026
|
|
Mid Cap Fund3
|
||
|
Class A
|
1.15%
|
May 1, 2026
|
|
Class C
|
1.90%
|
May 1, 2026
|
|
Class N
|
0.85%
|
May 1, 2026
|
|
Class Y
|
0.90%
|
May 1, 2026
|
|
Small Cap Fund3
|
||
|
Class A
|
1.25%
|
May 1, 2026
|
|
Class C
|
2.00%
|
May 1, 2026
|
|
Class N
|
0.95%
|
May 1, 2026
|
|
Class Y
|
1.00%
|
May 1, 2026
|
| 1 | Natixis Advisors will bear a portion of the waiver/reimbursement. The Natixis Advisors portion of the waiver/reimbursement will be equal to the ratio of the Natixis Advisors Support Services Fee divided by the management fee earned by Gateway. |
| 2 | Natixis Advisors will bear a portion of the waiver/reimbursement. The Natixis Advisors portion of the waiver/reimbursement will be equal to the ratio of the Natixis Advisors Support Services Fee divided by the management fee earned by Mirova US. |
| 3 | Natixis Advisors and Vaughan Nelson have agreed to bear the waiver/reimbursement jointly on a pro rata basis relative to their advisory and sub-advisory fees, respectively. |
|
Fund
|
Subadviser
|
Date of Subadvisory Agreement
|
Subadvisory fee payable to Subadviser
(as a % of average daily net assets of the Fund/Segment) |
|
Mid Cap Fund
|
Vaughan Nelson
|
10/31/08, as amended
07/01/21 |
0.47% of the first $1.5 billion
0.44% of the amounts in excess of $1.5 billion |
|
Small Cap Fund
|
Vaughan Nelson
|
03/01/04, as amended
07/01/21 |
0.52%
|
|
|
Fiscal Year Ended
|
||
|
|
12/31/23
|
12/31/24
|
12/31/25
|
|
EQUITY CALL PREMIUM FUND
|
|||
|
Total Advisory Fee
|
$1,331,624
|
$1,764,570
|
$1,551,355
|
|
Fee Reduced
|
$372,113
|
$405,439
|
$321,187
|
|
Total Paid
|
$959,511
|
$1,359,131
|
$1,230,168
|
|
GATEWAY FUND
|
|||
|
Total Advisory Fee
|
$37,243,672
|
$38,718,490
|
$40,078,439
|
|
Fee Reduced
|
$2,100,511
|
$1,567,550
|
$1,644,870
|
|
Total Paid
|
$35,143,161
|
$37,150,940
|
$38,433,569
|
|
GLOBAL MEGATRENDS FUND
|
|||
|
Total Advisory Fee
|
$7,814,183
|
$8,602,808
|
$7,196,903
|
|
Fee Reduced
|
$0
|
$0
|
$0
|
|
Total Paid
|
$7,814,183
|
$8,602,808
|
$7,196,903
|
|
MID CAP FUND
|
|||
|
Total Advisory Fee
|
$1,868,542
|
$1,911,523
|
1,613,400
|
|
|
Fiscal Year Ended
|
||
|
|
12/31/23
|
12/31/24
|
12/31/25
|
|
Natixis Advisors
|
|||
|
Fee Earned
|
$697,589
|
$713,636
|
$602,336
|
|
Fee Reduced
|
$76,219
|
$90,648
|
$114,760
|
|
Total Paid
|
$621,370
|
$622,988
|
$487,576
|
|
Vaughan Nelson
|
|||
|
Fee Earned
|
$1,170,953
|
$1,197,887
|
$1,011,064
|
|
Fee Reduced
|
$127,940
|
$152,158
|
$114,760
|
|
Total Paid
|
$1,043,013
|
$1,045,729
|
$896,304
|
|
SMALL CAP FUND
|
|||
|
Total Advisory Fee
|
$2,975,008
|
$8,955,710
|
11,034,612
|
|
Natixis Advisors
|
|||
|
Fee Earned
|
$1,155,003
|
$3,476,923
|
$4,284,026
|
|
Fee Reduced
|
$157,099
|
$0
|
$0
|
|
Total Paid
|
$997,904
|
$3,476,923
|
$4,284,026
|
|
Vaughan Nelson
|
|||
|
Fee Earned
|
$1,820,005
|
$5,478,787
|
$6,750,586
|
|
Fee Reduced
|
$247,551
|
$0
|
$0
|
|
Total Paid
|
$1,572,454
|
$5,478,787
|
$6,750,586
|
|
|
Fiscal Year Ended
|
||
|
Fund
|
12/31/23
|
12/31/24
|
12/31/25
|
|
Equity Call Premium Fund
|
$—
|
$—
|
$—
|
|
Gateway Fund
|
$81,624
|
$70,409
|
$66,867
|
|
Global Megatrends Fund
|
$309,437
|
$291,817
|
$390,301
|
|
Mid Cap Fund
|
$—
|
$—
|
$—
|
|
Small Cap Fund
|
$—
|
$561,194
|
$611,758
|
|
|
Fiscal Year Ended
|
||
|
Fund
|
12/31/23
|
12/31/24
|
12/31/25
|
|
Small Cap Fund
|
$—
|
$2,423
|
$—
|
|
|
Fiscal Year Ended
|
||
|
|
12/31/23
|
12/31/24
|
12/31/25
|
|
Equity Call Premium Fund
|
|||
|
Brokerage Transactions
|
|
|
|
|
Allocated to Brokers Providing Research Services
|
$—
|
$—
|
$—
|
|
Brokerage Commissions
|
|
|
|
|
Total Brokerage Commissions Paid
|
$60,604
|
$65,933
|
$49,642
|
|
Commissions Paid to Brokers Providing Research Services
|
$—
|
$—
|
$—
|
|
|
Fiscal Year Ended
|
||
|
|
12/31/23
|
12/31/24
|
12/31/25
|
|
Gateway Fund
|
|||
|
Brokerage Transactions
|
|
|
|
|
Allocated to Brokers Providing Research Services
|
$3,383,269,084
|
$—
|
$—
|
|
Brokerage Commissions
|
|
|
|
|
Total Brokerage Commissions Paid
|
$1,849,209
|
$1,383,777
|
$1,980,846
|
|
Commissions Paid to Brokers Providing Research Services
|
$739,794
|
$—
|
$—
|
|
Global Megatrends Fund*
|
|||
|
Brokerage Transactions
|
|
|
|
|
Allocated to Brokers Providing Research Services
|
$—
|
$—
|
$—
|
|
Brokerage Commissions
|
|
|
|
|
Total Brokerage Commissions Paid
|
$61,867
|
$69,073
|
$80,506
|
|
Commissions Paid to Brokers Providing Research Services
|
$—
|
$—
|
$—
|
|
Mid Cap Fund
|
|||
|
Brokerage Transactions
|
|
|
|
|
Allocated to Brokers Providing Research Services
|
$314,797,751
|
$313,069,994
|
$430,036,859
|
|
Brokerage Commissions
|
|
|
|
|
Total Brokerage Commissions Paid
|
$162,957
|
$215,922
|
$194,407
|
|
Commissions Paid to Brokers Providing Research Services
|
$137,973
|
$171,371
|
$148,479
|
|
Small Cap Fund
|
|||
|
Brokerage Transactions
|
|
|
|
|
Allocated to Brokers Providing Research Services
|
$359,404,985
|
$874,961,400
|
$1,670,123,062
|
|
Brokerage Commissions
|
|
|
|
|
Total Brokerage Commissions Paid
|
$346,561
|
$778,718*
|
$1,290,826*
|
|
Commissions Paid to Brokers Providing Research Services
|
$254,015
|
$492,359
|
$936,850
|
| * | The aggregate brokerage commissions paid significantly increased from 2024 to 2025 due to an increase in trading volume and total assets. |
|
Fund
|
Regular Broker-Dealer
|
Aggregate Value of Securities of Each Regular Broker-Dealer (or its Parent) Held by Fund
|
|
Equity Call Premium Fund
|
Bank of America Corp.
|
$2,393,270
|
|
Gateway Fund
|
Bank of America Corp.
|
$84,227,825
|
|
|
Morgan Stanley
|
$73,547,661
|
|
|
Fiscal Year Ended
|
||
|
Fund
|
12/31/23
|
12/31/24
|
12/31/25
|
|
Equity Call Premium Fund
|
|||
|
Class A
|
$4,981
|
$6,464
|
$8,433
|
|
Class C
|
$10,492
|
$11,687
|
$9,273
|
|
Total
|
$15,473
|
$18,151
|
$17,706
|
|
Gateway Fund
|
|||
|
Class A
|
$2,023,389
|
$1,742,564
|
$1,642,443
|
|
Class C
|
$702,274
|
$566,568
|
$446,561
|
|
Total
|
$2,725,663
|
$2,309,132
|
$2,089,004
|
|
Global Megatrends Fund
|
|||
|
Class A
|
$73,677
|
$84,218
|
$87,395
|
|
Class C
|
$110,572
|
$108,894
|
$81,880
|
|
Total
|
$184,249
|
$193,112
|
$169,275
|
|
Mid Cap Fund
|
|||
|
Class A
|
$85,732
|
$103,886
|
$101,071
|
|
Class C
|
$58,217
|
$27,509
|
$23,769
|
|
Total
|
$143,949
|
$131,395
|
$124,840
|
|
Small Cap Fund
|
|||
|
Class A
|
$211,518
|
$312,237
|
$637,217
|
|
Class C
|
$43,981
|
$116,149
|
$116,881
|
|
Total
|
$255,499
|
$428,386
|
$754,098
|
|
Fund
|
Compensation to Broker-Dealers
|
Retained by Distributor1
|
Total
|
|
Equity Call Premium Fund
|
$17,706
|
$0
|
$17,706
|
|
Gateway Fund
|
$2,089,004
|
$0
|
$2,089,004
|
|
Global Megatrends Fund
|
$169,275
|
$0
|
$169,275
|
|
Mid Cap Fund
|
$124,840
|
$0
|
$124,840
|
|
Small Cap Fund
|
$754,098
|
$0
|
$754,098
|
| 1 | Distributor retains Rule 12b-1 fees on Class C shares for the first 12 months. |
|
FUND
|
SHAREHOLDER
|
PERCENTAGE
|
|
Equity Call Premium Fund1
|
|
|
|
Class A
|
Charles Schwab & Co. Inc.
Special Custody Account FBO Customers San Francisco, CA 94105 1901 |
15.67%
|
|
|
Charles Schwab & Co. Inc.
Special Custody Account FBO Customers San Francisco, CA 94105 1901 |
12.40%
|
|
|
Merrill Lynch Pierce Fenner & Smith Inc.
Jacksonville, FL 32246-6484 |
9.47%
|
|
|
National Financial Services LLC
Jersey City, NJ 07310-1995 |
8.51%
|
|
|
National Financial Services LLC
Jersey City, NJ 07310-1995 |
6.49%
|
|
|
Raymond James
St. Petersburg, FL 33716-1100 |
5.44%
|
|
Class C
|
LPL Financial
Omnibus Customer Account San Diego, CA 92121-3091 |
42.16%
|
|
|
American Enterprise Investments SVC
Windsor, CT 06095-4773 |
18.51%
|
|
|
National Financial Services LLC
Jersey City, NJ 07310-1995 |
17.31%
|
|
|
National Financial Services LLC
Jersey City, NJ 07310-1995 |
7.62%
|
|
Class N
|
Voya Retirement, Insurance & Annuity Co.
Windsor, CT 06095-4773 |
98.97%
|
|
Class Y
|
Charles Schwab & Co. Inc.
Special Custody Account FBO Customers San Francisco, CA 94105-1905 |
24.17%
|
|
Gateway Fund
|
||
|
Class A
|
Morgan Stanley Smith Barney LLC
For the Exclusive Benefit of its Customers New York, NY 10004-1932 |
14.59%
|
|
|
Merrill Lynch Pierce Fenner & Smith Inc.
For the Sole Benefit of its Customers Jacksonville, FL 32246-6484 |
13.47%
|
|
|
[Charles Schwab & Co. Inc.
Special Custody Account FBO Customers San Francisco, CA 94105-1905] |
12.02%
|
|
|
Raymond James
St. Petersburg, FL 33716-1100 |
10.74%
|
|
|
UBS WM USA
Omni Account M/F Weehawken, NJ 07086-6761 |
6.26%
|
|
Class C
|
Morgan Stanley Smith Barney LLC
For the Exclusive Benefit of its Customers New York, NY 10004-1932 |
20.65%
|
|
|
Raymond James
Omnibus for Mutual Funds St. Petersburg, FL 33716-1100 |
16.73%
|
|
|
Wells Fargo Clearing Services LLC
Special Custody Account FBO Customers St. Louis, MO 63103-2523 |
14.33%
|
|
|
Merrill Lynch Pierce Fenner & Smith Inc.
For the Sole Benefit of its Customers Jacksonville, FL 32246-6484 |
13.14%
|
|
|
LPL Financial
Omnibus Customer Account San Diego, CA 92121-3091 |
8.37%
|
|
|
Charles Schwab & Co. Inc.
Special Custody Account FBO Customers San Francisco, CA 94105-1905 |
6.64%
|
|
|
JP Morgan Securities LLC
For the Exclusive Benefit of its Customers Brooklyn, NY 11245-0003 |
5.41%
|
|
Class N
|
JP Morgan Securities LLC
For the Exclusive Benefit of its Customers Brooklyn, NY 11245-0003 |
25.42%
|
|
|
Pershing LLC
Jersey City, NJ 07399-0001 |
16.48%
|
|
|
SEI Private Trust Co.
Oaks, PA 19456-9989 |
12.29%
|
|
|
Wells Fargo Clearing Services LLC Special
Custody Account FBO Customers St. Louis, MO 63103-2523 |
8.42%
|
|
|
Mori & Co.
Kansas City, MO 64106-1802 |
7.97%
|
|
|
NA Bank & Co.
Tulsa, OK 74101-2180 |
6.20%
|
|
Class Y
|
Charles Schwab & Co. Inc.
San Francisco, CA 94104-4151 |
17.41%
|
|
|
Morgan Stanley Smith Barney LLC
For the Exclusive Benefit of its Customers New York, NY 10004-1901 |
12.87%
|
|
|
LPL Financial
Omnibus Customer Account San Diego, CA 92121-3091 |
7.06%
|
|
|
SEI Private Trust Co.
Oaks, PA 19456-9989 |
6.64%
|
|
|
Merrill Lynch Pierce Fenner & Smith Inc.
For the Sole Benefit of its Customers Jacksonville, FL 32246-6484 |
5.88%
|
|
|
UBS WM USA
Omni Account M/F Weehawken, NJ 07086-6761 |
5.55%
|
|
Global Megatrends Fund
|
||
|
Class A
|
Merrill Lynch Pierce Fenner & Smith Inc
Jacksonville, FL 32246-6484 |
47.79%
|
|
|
Charles Schwab & Co. Inc.
Special Custody Account FBO Customers San Francisco, CA 94104-4151 |
23.64%
|
|
Class C
|
Merrill Lynch Pierce Fenner & Smith Inc
Jacksonville, FL 32246-6484 |
50.55%
|
|
|
JP Morgan Securities LLC
For the Exclusive Benefit of its Customers Brooklyn, NY 11245-0003 |
16.09%
|
|
|
Pershing LLC
Jersey City, NJ 07399-0001 |
8.30%
|
|
|
LPL Financial Omnibus Customer Account
San Diego, CA 92121-3091 |
7.62%
|
|
Class N
|
JP Morgan Securities LLC
For the Exclusive Benefit of its Customers Brooklyn, NY 11245-0003 |
41.62%
|
|
|
CFA Institute
Charlottesville, VA 22902-4818 |
20.26%
|
|
|
National Financial Services LLC
Jersey City, NJ 07310-1995 |
12.01%
|
|
|
Saxon & Co
Cleveland, OH 44101-4597 |
7.17%
|
|
Class Y
|
American Enterprise Investments SVC
Windsor, CT 06095-4773 |
28.84%
|
|
|
Merrill Lynch Pierce Fenner & Smith Inc
Jacksonville, FL 32246-6484 |
18.47%
|
|
|
UBS WM USA
Omni Account M/F Weehawken, NJ 07086-6761 |
13.66%
|
|
|
Charles Schwab & Co. Inc.
Special Custody Account FBO Customers San Francisco, CA 94104-4151 |
12.73%
|
|
|
Empower Trust
For the Benefit IRA Advantage Greenwood Village, CO 80111-5002 |
6.92%
|
|
Mid Cap Fund2
|
||
|
Class A
|
Charles Schwab & Co. Inc.
Special Custody Account FBO Customers San Francisco, CA 94104-4151 |
33.09%
|
|
|
Morgan Stanley Smith Barney
For the Exclusive Benefits of its Customers New York, NY 10004-1932 |
9.30%
|
|
|
LPL Financial Omnibus Customer Account
San Diego, CA 92121-3091 |
8.97%
|
|
|
Pershing LLC
Jersey City, NJ 07399-0001 |
5.98%
|
|
|
Wells Fargo Clearing Services LLC
For the Exclusive Benefit of its Customers St. Louis, MO 63103-2523 |
5.38%
|
|
|
Raymond James
Omnibus for Mutual Funds St. Petersburg, FL 33716-1100 |
5.35%
|
|
|
American Enterprise Investment Svc. FBO
Minneapolis, MN 55402-2405 |
5.27%
|
|
Class C
|
Wells Fargo Clearing Services LLC
For the Exclusive Benefit of its Customers St. Louis, MO 63103-2523 |
64.26%
|
|
|
American Enterprise Investment Svc. FBO
Minneapolis, MN 55402-2405 |
19.16%
|
|
|
LPL Financial
Omnibus Customer Account San Diego, CA 92121-3091 |
5.37%
|
|
Class N
|
National Financial Services LLC
Jersey City, NJ 07310-1995 |
66.66%
|
|
|
Capinco C/O US Bank NA
Milwaukee, WI 53201-1787 |
27.01%
|
|
Class Y
|
Charles Schwab & Co. Inc.
Special Custody Account FBO Customers San Francisco, CA 94104-4151 |
19.72%
|
|
|
American Enterprise Investment Svc. FBO
Minneapolis, MN 55402-2405 |
14.35%
|
|
|
National Financial Services LLC
Jersey City, NJ 07310-1995 |
10.94%
|
|
|
LPL Financial
San Diego, CA 92121-3091 |
9.92%
|
|
Small Cap Fund
|
||
|
Class A
|
National Financial Services LLC
Jersey City, NJ 07310-1995 |
42.91%
|
|
|
Charles Schwab & Co. Inc.
For the Exclusive Benefit of its Customers San Francisco, CA 94105-1901 |
19.09%
|
|
Class C
|
Morgan Stanley Smith Barney
For the Exclusive Benefit of its Customers New York, NY 10004-1932 |
39.35%
|
|
|
Raymond James
Omnibus for Mutual Funds St. Petersburg, FL 33716-1100 |
22.08%
|
|
|
American Enterprise Investment SVC
Minneapolis, MN 55402-2405 |
13.14%
|
|
|
Wells Fargo Clearing Services LLC
For the Exclusive Benefit of its Customers St. Louis, MO 63103-2523 |
7.13%
|
|
Class N
|
SEI Private Trust Company
Oaks, PA 19456-9989 |
59.28%
|
|
|
National Financial Services LLC
Jersey City, NJ 07310-1995 |
18.63%
|
|
Class Y
|
American Enterprise Investment SVC
Minneapolis, MN 55402-2405 |
17.60%
|
|
|
LPL Financial
Omnibus Customer Account San Diego, CA 92121-3091 |
13.79%
|
|
|
Morgan Stanley Smith Barney
For the Exclusive Benefit of its Customers New York, NY 10004-1932 |
9.26%
|
|
|
Raymond James
St. Petersburg, FL 33716-1100 |
8.99%
|
|
|
UBS WM USA
Omnibus Account M/F Weehawken, NJ 07086-6761 |
8.41%
|
|
|
Wells Fargo Clearing Services LLC
For the Exclusive Benefit of its Customer Saint Louis, MO 63103-2523 |
7.79%
|
|
|
Charles Schwab & Co. Inc.
Special Custody Account FBO Customers San Francisco, CA 94105 1901 |
5.91%
|
| 1 | As of April 1, 2026, National Financial Services LLC, Jersey City, NJ 07310-1995, owned 61.04% of the Equity Call Premium Fund and therefore may be presumed to “control” the Fund, as that term is defined in the 1940 Act. However, such ownership may be beneficially held by individuals or entities other than National Financial Services LLC. |
| 2 | As of April 1, 2026, National Financial Services LLC, Jersey City, NJ 07310-1995, owned 27.72% of the Mid Cap Fund and therefore may be presumed to “control” the Fund, as that term is defined in the 1940 Act. However, such ownership may be beneficially held by individuals or entities other than National Financial Services LLC. |
|
Trust Name
|
Date
|
|
The New England Life Government Securities Trust
|
June 1985 to October 1986
|
|
The New England Funds
|
October 1986 to January 1994
|
|
New England Funds Trust I
|
January 1994 to January 2000
|
|
Nvest Funds Trust I
|
February 2000 to March 2001
|
|
CDC Nvest Funds Trust I
|
March 2001 to April 2005
|
|
IXIS Advisor Funds Trust I
|
May 2005 to August 2007
|
|
Natixis Funds Trust I
|
August 2007 to present
|
|
Trust Name
|
Date
|
|
Investment Trust of Boston
|
May 1931 to November 1988
|
|
Investment Trust of Boston Funds
|
December 1988 to April 1992
|
|
TNE Funds Trust
|
April 1992 to March 1994
|
|
New England Funds Trust II
|
April 1994 to January 2000
|
|
Nvest Funds Trust II
|
February 2000 to March 2001
|
|
CDC Nvest Funds Trust II
|
March 2001 to April 2005
|
|
IXIS Advisor Funds Trust II
|
May 2005 to August 2007
|
|
Trust Name
|
Date
|
|
Natixis Funds Trust II
|
August 2007 to present
|
|
Fund Name
|
Date
|
|
Gateway Option Income Fund, Inc.
|
August 1977 to May 1986
|
|
Gateway Option Income Fund
|
May 1986 to February 1988
|
|
Gateway Option Index Fund
|
February 1988 until March 1990
|
|
Gateway Index Plus Fund
|
March 1990 to April 1998
|
|
Gateway Fund
|
April 1998 to present
|
|
Investment-Grade Fixed-Income Securities. To be considered investment-grade quality, at least one of the three major rating agencies (Fitch Ratings, Inc. (“Fitch”), Moody’s or S&P) must have rated the security in one of its respective top four rating categories at the time a Fund acquires the security or, if the security is unrated, the Fund’s Adviser or Subadviser must have determined it to be of comparable quality.
|
|
Below Investment-Grade Fixed-Income Securities. Below investment-grade fixed-income securities (commonly referred to as “junk bonds”) are rated below investment-grade quality. To be considered below investment-grade quality, none of the three major rating agencies (Fitch, Moody’s and S&P) must have rated the security in one of its respective top four rating categories at the time a Fund acquires the security or, if the security is unrated, the Fund’s Adviser or Subadviser must have determined it to be of comparable quality.
|
|
U.S. Treasury Bills – Direct obligations of the U.S. Treasury that are issued in maturities of one year or less. No interest is paid on Treasury bills; instead, they are issued at a discount and repaid at full face value when they mature. They are backed by the full faith and credit of the U.S. government.
|
|
U.S. Treasury Notes and Bonds – Direct obligations of the U.S. Treasury issued in maturities that vary between one and thirty years, with interest normally payable every six (6) months. These obligations are backed by the full faith and credit of the U.S. government.
|
|
U.S. Treasury Floating Rate Notes – Treasury Floating Rate Notes are relatively new instruments authorized by amendments to the U.S. Treasury’s marketable securities auction rules. As with other floating rate securities, at certain intervals the interest payment on a Treasury Floating Rate Note will increase when the applicable index increases, and will decrease when the applicable index decreases. Treasury Floating Rate Notes are a relatively new type of financial instrument. As such, there is no significant trading history of these securities, and there can be no assurance that a liquid market in these securities will develop. Lack of a liquid market may impose the risk of higher transaction costs and the possibility that a Fund may be forced to liquidate positions when it would not be advantageous to do so.
|
|
Treasury Inflation-Protected Securities (“TIPS”) – Fixed-income securities whose principal value is periodically adjusted according to the rate of inflation. The interest rate on TIPS is fixed at issuance, but over the life of the bond this interest may be paid on an increasing or decreasing principal value that has been adjusted for inflation. Although repayment of the original bond principal upon maturity is guaranteed, the market value of TIPS is not guaranteed, and will fluctuate.
|
|
“Ginnie Maes” – Debt securities issued by a mortgage banker or other mortgagee that represent an interest in a pool of mortgages insured by the Federal Housing Administration or the Rural Housing Service or guaranteed by the Veterans Administration. The GNMA guarantees the timely payment of principal and interest when such payments are due, whether or not these amounts are collected by the issuer of these certificates on the underlying mortgages. It is generally understood that a guarantee by GNMA is backed by the full faith and credit of the United States. Mortgages included in single-family or multi-family residential mortgage pools backing an issue of Ginnie Maes have a maximum maturity of 30 years. Scheduled payments of principal and interest are made to the registered holders of Ginnie Maes (such as the Funds) each month. Unscheduled prepayments may be made by homeowners, or as a result of a default. Prepayments are passed through to the registered holder (such as the Funds, which reinvest any prepayments) of Ginnie Maes along with regular monthly payments of principal and interest.
|
|
“Fannie Maes” – The FNMA is a government-sponsored corporation owned entirely by private stockholders that purchases residential mortgages from a list of approved seller/servicers, including state and federally chartered savings and loan associations, mutual savings banks, commercial banks, credit unions and mortgage banks. Fannie Maes are pass-through securities issued by FNMA that are guaranteed as to timely payment of principal and interest by FNMA, but these obligations are not backed by the full faith and credit of the U.S. government.
|
|
“Freddie Macs” – The Federal Home Loan Mortgage Corporation (“FHLMC”) is a corporate instrumentality of the U.S. government. Freddie Macs are participation certificates issued by FHLMC that represent an interest in residential mortgages from FHLMC’s National Portfolio. FHLMC guarantees the timely payment of interest and ultimate collection of principal, but these obligations are not backed by the full faith and credit of the U.S. government.
|
|
Entity
|
Fund(s)
|
Type
|
Frequency
|
Purpose
|
|
Abel Noser
|
Certain Funds
|
Transactions
|
Daily
|
Trade cost analysis
|
|
ACA Group (formally Global Trading Analytics)
|
Certain Funds
|
Transactions
|
Quarterly
|
Trade cost analysis
|
|
Advent
|
Certain Funds
|
Full portfolio holdings
|
Daily
|
Electronic reconciliation of portfolio holdings of the Funds
|
|
Bloomberg
|
Certain Funds
|
Full portfolio
holdings |
Daily
|
Attribution analysis and portfolio analytics
|
|
Broadridge Financial Solutions, Inc.
|
All Funds
|
Full portfolio holdings
|
As needed
|
Proxy voting recordkeeping services
|
|
CAPIS
|
Certain Funds
|
Transactions
|
Daily
|
Trade cost analysis
|
|
Confluence Technologies, Inc.
|
All Funds
|
Full portfolio
holdings |
Quarterly, or more frequently as needed
|
Performing certain functions related to quarterly Form N-PORT filings and production of shareholder reports
|
|
Dinkum Management Consultants Co., Ltd.
|
Certain Funds
|
Holdings in
Taiwan-based issuers |
Annually
|
Performing certain duties for compliance with Taiwan’s tax laws
|
|
Donnelley Financial Solutions
|
All Funds
|
Full portfolio
holdings |
Quarterly, or more frequently as needed
|
Certain functions related to the production of the Funds’ financial statements, quarterly Form N-PORT filings and other related items
|
|
Ernst & Young LLP
|
All Funds
|
Foreign equity
holdings |
Annually, or more frequently as needed
|
Performing certain functions related to the production of the Funds’ Federal income and excise tax returns
|
|
eVestment
|
Certain Funds
|
Full portfolio holdings
|
Quarterly
|
Provides research management services
|
|
FactSet
|
All Funds
|
Full portfolio
holdings |
Daily
|
Performing attribution analysis and portfolio analytics
|
|
Gateway
|
Certain Funds
|
Full portfolio holdings
|
Daily
|
Fund Advisor
|
|
Gresham Technologies plc
|
Certain Funds
|
Full portfolio
holdings |
Daily
|
Certain electronic reconciliations of portfolio holdings of the Funds
|
|
ICE Data Services
|
All Funds
|
Full portfolio
holdings |
Daily
|
Performing functions related to the liquidity classification of investments, and facilitating reporting to Natixis as disclosed previously in this section
|
|
Entity
|
Fund(s)
|
Type
|
Frequency
|
Purpose
|
|
Institutional Shareholder Services, Inc. (ISS)
|
All Funds
|
Full portfolio holdings
|
As needed
|
Proxy voting administration and research
|
|
KPMG LLP
|
All Funds
|
Full portfolio
holdings |
Annually, or more frequently as needed
|
Performing certain duties related to tax compliance services
|
|
KPMG Global Services Private Limited
|
All Funds
|
Full portfolio
holdings |
Annually, or more frequently as needed
|
Performing certain duties related to tax compliance services
|
|
Lipper
|
Certain Funds
|
Full portfolio holdings
|
Monthly
|
Industry wide services
|
|
Mirova
|
Certain Funds
|
Full portfolio holdings
|
Daily
|
Fund Advisor
|
|
Natixis Advisors, LLC
|
All Funds
|
Full portfolio holdings
|
Daily
|
Fund Advisor and/or Administrator
|
|
NIM-os, LLC
|
Certain Funds
|
Full portfolio
holdings |
Daily
|
Hosting of Portfolio Accounting and Trade Order Management and Compliance Systems, Corporate Actions, Trade Settlements, Pricing, and Reconciliation
|
|
NIM-os EU
|
All Funds
|
Full portfolio holdings
|
Daily
|
Risk Analysis
|
|
OnCorps, Inc.
|
All Funds
|
Full portfolio holdings
|
Quarterly, or more frequently as needed
|
Performing certain functions related to the production of the Funds’ financial statements and quarterly Form N-PORT filings
|
|
Pricewaterhouse
Coopers, LLP |
All Funds
|
Full portfolio holdings
|
Annually, or more frequently as needed
|
Funds’ independent public accountant
|
|
Qontigo
|
Certain Funds
|
Full portfolio holdings
|
Daily
|
Compliance testing related to the Funds’ use of derivatives.
|
|
Ropes & Gray LLP
|
All Funds
|
Full portfolio holdings
|
As needed
|
Funds’ outside counsel
|
|
Stradley Ronan Stevens & Young, LLP
|
All Funds
|
Full portfolio holdings
|
As needed
|
Counsel to the independent Trustees
|
|
State Street Bank & Trust Co.
|
All Funds
|
Full portfolio holdings
|
Daily
|
Funds’ custodian, fund accounting agent, and sub-administrator
|
|
Vaughan Nelson
|
Certain Funds
|
Full portfolio holdings
|
Daily
|
Fund Sub-Advisor
|
|
Name and Year of Birth
|
Position(s) Held with
the Trust(s), Length of Time Served and Term of Office1 |
Principal
Occupation(s) During Past 5 Years |
Number of
Portfolios in Fund Complex Overseen2 and Other Directorships Held During Past 5 Years |
Experience,
Qualifications, Attributes, Skills for Board Membership |
|
INDEPENDENT TRUSTEES
|
||||
|
Edmond J. English
(1953)
|
Trustee since 2013
Contract Review Committee
Member
|
Executive Chairman of Bob’s Discount Furniture (retail)
|
36
Director, Burlington Stores, Inc. (retail); Director, Rue La La, Inc. (e-commerce retail)
|
Significant experience on the Board and on the boards of other business organizations (including retail companies and a bank); executive experience (including at a retail company)
|
|
Richard A. Goglia
(1951)
|
Trustee since 2015
Chairperson of the
Audit Committee |
Retired
|
36
Director, Ardian Access LLC (investment management/private markets industry)
|
Significant experience on the Board and executive experience (including his role as Vice President and treasurer of a defense company and experience at a financial services company)
|
|
Martin T. Meehan
(1956)
|
Trustee since 2012
Chairperson of the Governance Committee and Contract Review Committee Member
|
President, University of Massachusetts
|
36
None
|
Significant experience on the Board and on the boards of other business organizations; experience as President of the University of Massachusetts; government experience (including as a member of the U.S. House of Representatives);academic experience
|
|
Name and Year of Birth
|
Position(s) Held with
the Trust(s), Length of Time Served and Term of Office1 |
Principal
Occupation(s) During Past 5 Years |
Number of
Portfolios in Fund Complex Overseen2 and Other Directorships Held During Past 5 Years |
Experience,
Qualifications, Attributes, Skills for Board Membership |
|
Maureen B. Mitchell
(1951)
|
Trustee since 2017
Chairperson of the Contract Review Committee
|
Retired
|
36
Director, Sterling Bancorp (bank)
|
Significant experience on the Board; financial services industry and executive experience (including role as President of global sales and marketing at a financial services company)
|
|
James P. Palermo
(1955)
|
Trustee since 2016
Audit Committee Member and Governance Committee Member
|
Founding Partner, Breton Capital Management, LLC (private equity); formerly, Partner, STEP Partners, LLC (private equity)
|
36
Director, Candidly (chemicals and biofuels)
|
Significant experience on the Board; financial services industry and executive experience (including roles as Chief Executive Officer of client management and asset servicing for a banking and financial services company)
|
|
Erik R. Sirri
(1958)
|
Chairperson of the Board since 2021
Trustee since 2009
Ex Officio Member of the Audit Committee, Contract Review Committee and Governance Committee
|
Retired; formerly, Professor of Finance at Babson College
|
36
None
|
Significant experience on the Board; experience as Director of the Division of Trading and Markets at the SEC; academic experience; training as an economist
|
|
Kirk A. Sykes
(1958)
|
Trustee since 2019
Contract Review Committee Member and Governance Committee Member
|
Managing Director of Accordia Partners, LLC (real estate development); President of Primary Corporation (real estate development); Managing Principal of Merrick Capital Partners (infrastructure finance)
|
36
Advisor/Risk Management Committee, Eastern Bank (bank); Director, Apartment Investment and Management Company (real estate investment trust)
|
Significant experience on the Board and significant experience on the boards of other business organizations (including real estate companies and banks)
|
|
Name and Year of Birth
|
Position(s) Held with
the Trust(s), Length of Time Served and Term of Office1 |
Principal
Occupation(s) During Past 5 Years |
Number of
Portfolios in Fund Complex Overseen2 and Other Directorships Held During Past 5 Years |
Experience,
Qualifications, Attributes, Skills for Board Membership |
|
Cynthia L. Walker
(1956)
|
Trustee since 2005
Audit Committee Member and Governance Committee Member
|
Executive Consultant for Finance & Administration, Dartmouth’s Geisel School of Medicine; formerly, Deputy Dean for Finance and Administration, Yale University School of Medicine
|
36
None
|
Significant experience on the Board; executive experience in a variety of academic organizations (including roles as dean for finance and administration)
|
|
INTERESTED TRUSTEES
|
||||
|
Kevin P. Charleston3
(1965)
One Financial Center
Boston, MA 02111 |
Trustee since 2015
President and Chief Executive Officer of Loomis Sayles Funds I since 2015
|
President, Chief Executive Officer and Chairman of the Board of Directors, Loomis, Sayles & Company, L. P.
|
36
None
|
Significant experience on the Board; continuing service as President, Chief Executive Officer and Chairman of the Board of Directors of Loomis Sayles
|
|
David L. Giunta4
(1965)
|
Trustee since 2011
President and Chief Executive Officer of Natixis Funds Trust I, Executive Vice President of Loomis Sayles Funds I and President of Loomis Sayles Funds II since 2008; Chief Executive Officer of Loomis Sayles Funds II since 2015
|
President and Chief Executive Officer, Natixis Advisors, and Natixis Distribution, LLC
|
36
None
|
Significant experience on the Board; experience as President and Chief Executive Officer of Natixis Advisors, and Natixis Distribution, LLC
|
|
Marina Gross5
(1976) |
Trustee since 2024
|
Executive Vice President - Head of Solutions, US, Natixis Investment Managers
|
36
None
|
Experience as Executive Vice President - Head of Solutions, US, Natixis Investment Managers
|
| 1 | Each Trustee serves until retirement, resignation, or removal from the Board. The current retirement age is 75. The position of Chairperson of the Board is appointed for a three-year term. |
| 2 | The Trustees of the Trusts serve as Trustees of a fund complex that includes all series of the Natixis Funds Trust I, Natixis Funds Trust II, Natixis Funds Trust IV and Gateway Trust, (collectively, the “Natixis Funds Trusts”), Loomis Sayles Funds I and Loomis Sayles Funds II (collectively, the “Loomis Sayles Funds Trusts”), and Natixis ETF Trust and Natixis ETF Trust II (collectively, the “Natixis ETF Trusts”) (collectively, the “Fund Complex”). |
| 3 | Mr. Charleston is deemed an “interested person” of the Trusts because he holds the following positions with an affiliated person of the Trusts: President, Chief Executive Officer and Chairman of the Board of Directors of Loomis, Sayles & Company, L.P. |
| 4 | Mr. Giunta is deemed an “interested person” of the Trusts because he holds the following positions with an affiliated person of the Trusts: President and Chief Executive Officer, Natixis Advisors, LLC and Natixis Distribution, LLC. |
| 5 | Ms. Gross is deemed an “interested person” of the Trusts because she holds the following position with an affiliated person of the Trusts: Executive Vice President and Head of Solutions, US, Natixis Investment Managers. |
|
Name and Year of Birth
|
Position(s) Held with the Trust(s)
|
Term of Office1 and Length of Time Served
|
Principal Occupation(s)
During Past 5 Years2 |
|
OFFICERS OF THE TRUST
|
|||
|
Matthew J. Block
(1981)
|
Treasurer, Principal Financial and Accounting Officer
|
Since 2022
|
Senior Vice President, Natixis Advisors and Natixis Distribution, LLC; formerly, Vice President, Natixis Advisors, LLC and Natixis Distribution, LLC; Assistant Treasurer of the Fund Complex
|
|
Susan McWhan Tobin
(1963)
|
Secretary and Chief Legal Officer
Chief Compliance Officer and Anti-Money Laundering Officer
|
Since 2022
Since 2025
|
Executive Vice President, General Counsel and Secretary, Natixis Advisors, LLC and Natixis Distribution, LLC; formerly, Executive Vice President and Chief Compliance Officer of Natixis Investment Managers (March 2019 - May 2022)
|
| 1 | Each officer of the Trusts serves for an indefinite term in accordance with the Trusts’ current by-laws until the date his or her successor is elected and qualified, or until he or she sooner dies, retires, is removed or becomes disqualified. |
| 2 | Each person listed above, except as noted, holds the same position(s) with the Fund Complex. Previous positions during the past five years with Natixis Distribution, LLC, Natixis Advisors or Loomis, Sayles & Company, L.P. are omitted, if not materially different from an officer’s current position with such entity. |
|
Audit Committee
|
Contract Review Committee
|
Governance Committee
|
|
Richard A. Goglia – Chairperson
|
Maureen B. Mitchell – Chairperson
|
Martin T. Meehan – Chairperson
|
|
James P. Palermo
|
Edmond J. English
|
James P. Palermo
|
|
Cynthia L. Walker
|
Martin T. Meehan
|
Kirk A. Sykes
|
|
|
Kirk A. Sykes
|
Cynthia L. Walker
|
|
Dollar Range of Fund Shares1
|
Edmond
J. English2 |
Richard
A. Goglia2 |
Martin
T. Meehan2 |
Maureen
B. Mitchell |
James
P. Palermo2 |
Erik
R. Sirri2 |
Peter
J. Smail |
Kirk
A. Sykes2 |
Cynthia
L. Walker2 |
|
Independent Trustees
|
|||||||||
|
Equity Call Premium Fund
|
A
|
A
|
A
|
A
|
A
|
A
|
A
|
A
|
A
|
|
Gateway Fund
|
A
|
A
|
A
|
A
|
A
|
A
|
A
|
A
|
E
|
|
Global Megatrends Fund
|
A
|
A
|
A
|
A
|
A
|
A
|
A
|
A
|
A
|
|
Mid Cap Fund
|
A
|
A
|
A
|
A
|
A
|
C
|
A
|
A
|
A
|
|
Small Cap Fund
|
A
|
A
|
A
|
C
|
A
|
A
|
A
|
A
|
A
|
|
Aggregate Dollar Range of Fund Shares in Fund Complex Overseen by Trustee
|
E
|
E
|
E
|
E
|
E
|
E
|
E
|
D
|
E
|
| 1 | A. None B. $1 – $10,000 C. $10,001 – $50,000 D. $50,001 – $100,000 E. over $100,000 |
| 2 | Amounts include economic value of notional investments held through the deferred compensation plan. |
|
Dollar Range of Fund Shares1
|
Kevin P. Charleston
|
David L. Giunta
|
Marina Gross
|
|
Interested Trustees
|
|||
|
Equity Call Premium Fund
|
A
|
B
|
B
|
|
Gateway Fund
|
A
|
E
|
E
|
|
Global Megatrends Fund
|
A
|
A
|
D
|
|
Mid Cap Fund
|
A
|
A
|
C
|
|
Small Cap Fund
|
A
|
B
|
B
|
|
Aggregate Dollar Range of Fund Shares in Fund Complex Overseen by Trustee
|
E
|
E
|
E
|
| 1 | A. None B. $1 – $10,000 C. $10,001 – $50,000 D. $50,001 – $100,000 E. over $100,000 |
|
|
Aggregate
Compensation from Natixis Funds Trust I1 |
Aggregate
Compensation from Natixis Funds Trust II1 |
Aggregate
Compensation from Gateway Trust1 |
Pension or
Retirement Benefits Accrued as Part of Fund Expenses |
Estimated
Annual Benefits Upon Retirement |
Total
Compensation from the Fund Complex2 |
|
INDEPENDENT TRUSTEES
|
||||||
|
Edmond J. English
|
$47,711
|
$22,059
|
$26,520
|
$0
|
$0
|
$310,000
|
|
Richard A. Goglia
|
$52,340
|
$24,137
|
$29,136
|
$0
|
$0
|
$340,000
|
|
Martin T. Meehan
|
$52,340
|
$24,137
|
$29,136
|
$0
|
$0
|
$340,000
|
|
Maureen B. Mitchell
|
$52,340
|
$24,137
|
$29,136
|
$0
|
$0
|
$340,000
|
|
James P. Palermo
|
$49,254
|
$22,751
|
$27,392
|
$0
|
$0
|
$320,000
|
|
Erik R. Sirri
|
$64,820
|
$19,707
|
$40,255
|
$0
|
$0
|
$410,000
|
|
Peter J. Smail
|
$47,711
|
$22,059
|
$26,520
|
$0
|
$0
|
$310,000
|
|
Kirk A. Sykes
|
$49,254
|
$22,751
|
$27,392
|
$0
|
$0
|
$320,000
|
|
Cynthia L. Walker
|
$49,254
|
$22,751
|
$27,392
|
$0
|
$0
|
$320,000
|
|
INTERESTED TRUSTEES
|
||||||
|
Kevin P. Charleston
|
$0
|
$0
|
$0
|
$0
|
$0
|
$0
|
|
David L. Giunta
|
$0
|
$0
|
$0
|
$0
|
$0
|
$0
|
|
Marina Gross
|
$0
|
$0
|
$0
|
$0
|
$0
|
$0
|
| 1 | Amounts include payments deferred by Trustees for the fiscal year ended December 31, 2025, with respect to the Trusts. The total amount of deferred compensation accrued for Natixis Funds Trust I as of December 31, 2025 for the Trustees is as follows: English $134,962, Goglia $186,892, Meehan $246,446, Palermo $449,565, Sirri $225,830, Sykes $18,672 and Walker $981,886. The total amount of deferred compensation accrued for Natixis Funds Trust II as of December 31, 2025 for the Trustees is as follows: English $239,054, Goglia $230,023, Meehan $298,998, Palermo $343,310, Sirri $319,510, Sykes $10,016 and Walker $1,030,325. The total amount of deferred compensation accrued for Gateway Trust as of December 31, 2025 for the Trustees is as follows: English $107,114, Goglia $130,118, Meehan $176,622, Palermo $276,883, Sirri $152,739, Sykes $10,856 and Walker $605,655. |
| 2 | Total Compensation represents amounts paid during the fiscal year ended December 31, 2025 to a Trustee for serving on the board of eight (8) trusts with a total of thirty-six (36) funds as of December 31, 2025. |
| A. | Gateway’s portfolio management team has decided to override the ISS Governance vote recommendation for a Client(s) based on its own determination that the Client(s) would best be served with a vote contrary to the ISS Governance recommendation based on Gateway’s higher degree of analysis of ISS Governance’s vote recommendation. Such decision(s) will be documented by Gateway (and communicated to ISS Governance if a decision(s) led to a vote override). Gateway’s CIO will determine, on an annual basis, as to which classification level an ISS Governance vote recommendation should be analyzed further by Gateway (which may include highly contested matters regarding mergers and acquisitions, dissolutions, conversions, consolidations, or contested elections of directors); or |
| B. | Gateway’s portfolio management team has decided to override ISS Governance’s vote recommendation for a Client(s) based on its own determination that the Client(s) would best be served with a vote contrary to ISS Governance’s recommendation based on Gateway’s consideration of certain additional information. Specifically, in the event Gateway becomes aware that an issuer has filed additional soliciting material with the SEC regarding ISS Governance’s vote recommendation and if such additional information would reasonably be expected to affect Gateway’s voting determination, Gateway will consider this supplemental information if such additional material was submitted to Gateway via ISS no later than five (5) calendar days prior to the vote submission deadline. Only additional information from issuers that apply to the classification levels determined by the CIO would be considered information reasonably expected to affect Gateway’s voting determination. Information received within the five (5) calendar days before the cutoff time frame, but before the vote submission deadline, may be considered, but only on a best-efforts basis. Decision(s) as to whether this additional information affects whether or not Gateway follows ISS Governance’s vote recommendation will be documented by Gateway (and communicated to ISS Governance if the analysis led to a vote override); or |
| C. | ISS Governance does not give a vote recommendation, in which case Gateway will independently determine how a particular issue should be voted. In these instances, Gateway, through its portfolio management team, will document the reason(s) used in determining a vote and communicate Gateway’s voting instruction to ISS Governance. Gateway will generally seek to vote in accordance with ISS Governance’s guidelines; or if voting on any particular security compromises Gateway’s ability to later transact in such security (e.g. shareblocking practices) or if, in Gateway’s judgment, the expected cost associated with the vote exceeds the expected benefits of the vote (e.g. non-U.S. security restrictions), then Gateway will abstain from voting on a particular security; or |
| D. | If voting would impose costs on the Client, such as opportunity costs for the Client resulting from restricting the use of securities for lending in order to preserve the right to vote, then Gateway will not make efforts to vote these securities on behalf of the Client. |
|
Governance Structure and Balance of Power
|
Mirova’s voting decisions generally will favor the appointment of directors allowing for: (1) a balance in the composition of the board among the company’s different strategic stakeholders; (2) effective supervision of decisions taken in the long-term interests of the company and the respect for the rights of all stakeholders; and (3) better integration of CSR issues in strategic considerations.
|
|
Distribution of Value
|
Mirova generally will support votes concerning aspects of the compensation of executives that are: (1) tied to the long-term strategy of the company; (2) correlated with long-term economic, but also environmental and social objectives (with pertinent and stable measurement indicators); (3) consistent with the creation of real value and its distribution among the different stakeholders; and (4) consistent with the company’s social policy.
Mirova generally will not support votes on dividend policies that: (1) are not correlated with the creation of value; (2) are detrimental to the company’s capacity to invest or to its solvency; and/or (3) are not consistent with the company’s social policy.
Mirova generally will support all resolutions aiming to maintain the loyalty of long-term shareholders and to develop employee shareholding.
|
|
Transparency of Information
|
Mirova generally will not support a resolution approving the annual report if the annual report does not integrate audited and certified information on the environmental and social performance of the company
|
|
Cumulative Investment
|
Maximum
Sales Charge Paid by Investors (% of offering price) |
Maximum
Reallowance or Commission (% of offering price) |
Maximum
First Year Service Fee (% of net investment) |
Maximum
First Year Compensation (% of offering price) |
|
All Funds
|
||||
|
Less than $50,000
|
5.75%
|
5.00%
|
0.25%
|
5.25%
|
|
$50,000 – $99,999
|
4.50%
|
4.00%
|
0.25%
|
4.25%
|
|
$100,000 – $249,999
|
3.50%
|
3.00%
|
0.25%
|
3.25%
|
|
$250,000 – $499,999
|
2.50%
|
2.15%
|
0.25%
|
2.40%
|
|
$500,000 – $999,999
|
2.00%
|
1.70%
|
0.25%
|
1.95%
|
|
Investments of $1,000,000 or more1,2
|
||||
|
Up to $2,999,999
|
None
|
1.00%
|
0.25%
|
1.25%
|
|
$3,000,000 to $4,999,999
|
None
|
0.75%
|
0.25%
|
1.00%
|
|
Excess over $5,000,000
|
None
|
0.50%
|
0.25%
|
0.75%
|
|
Investments with No Sales Charge3
|
None
|
0.00%
|
0.25%
|
0.25%
|
| 1 | Commissions are based on cumulative investments over the life of the account with no adjustment for redemptions, transfers or market declines. For example, if a shareholder has accumulated investments in excess of $5,000,000 and subsequently redeems all or a portion of the account(s), purchases following the redemption will generate a dealer commission of 0.50%. |
| 2 | A securities dealer may elect, at the time of the investment, to waive their commission on investments of $1,000,000 or more. In such cases, investments will be processed as “Investment with no Sales Charge” as described above. No CDSC will be applied to these investments. |
| 3 | Refers to any investments made by investors not subject to a sales charge as described in each Fund’s Prospectus for Class A shares in the section “How Sales Charges Are Calculated.” Also refers to any Class C share accounts established prior to December 1, 2000. |
|
Cumulative Investment
|
Maximum
Sales Charge Paid by Investors (% of offering price) |
Maximum
Reallowance or Commission (% of offering price) |
Maximum
First Year Service Fee (% of net investment) |
Maximum
First Year Compensation (% of offering price) |
|
All amounts for Class C
|
None
|
1.00%
|
0.00%
|
1.00%
|
|
|
12/31/23
|
12/31/24
|
12/31/25
|
|
NATIXIS FUNDS TRUST I†
|
|||
|
Total commissions on sales of Class A shares
|
$77,788
|
$96,706
|
$60,724
|
|
Amount reallowed to other securities dealers
|
$67,694
|
$83,929
|
$52,496
|
|
Amount retained by Distributor
|
$10,094
|
$12,777
|
$8,228
|
|
Total CDSCs on redemptions of Classes A and C shares
|
$2,802
|
$2,046
|
$4,277
|
|
Amount retained by Distributor1
|
$2,802
|
$2,046
|
$4,277
|
|
NATIXIS FUNDS TRUST II†
|
|||
|
Total commissions on sales of Class A shares
|
$3,553
|
$9,001
|
$398
|
|
Amount reallowed to other securities dealers
|
$3,139
|
$7,766
|
$345
|
|
Amount retained by Distributor
|
$414
|
$1,234
|
$53
|
|
Total CDSCs on redemptions of Classes A and C shares
|
$515
|
$177
|
$243
|
|
Amount retained by Distributor1
|
$515
|
$177
|
$243
|
|
|
12/31/23
|
12/31/24
|
12/31/25
|
|
GATEWAY TRUST†
|
|||
|
Total commissions on sales of Class A shares
|
$47,031
|
$61,529
|
$100,200
|
|
Amount reallowed to other securities dealers
|
$40,794
|
$53,193
|
$86,774
|
|
Amount retained by Distributor
|
$6,237
|
$8,336
|
$13,426
|
|
Total CDSCs on redemptions of Classes A and C shares
|
$32,826
|
$2,905
|
$6,956
|
|
Amount retained by Distributor1
|
$32,826
|
$2,905
|
$6,956
|
| † | Information is only provided for the Funds in this Statement as listed on the cover page. |
| 1 | See the section “Other Arrangements” for information about amounts received by the Distributor from the Trusts’ Advisers and Subadvisers or the Funds directly for providing certain administrative services relating to the Trusts. |
|
|
Fiscal Year Ended
|
||
|
Fund
|
12/31/23
|
12/31/24
|
12/31/25
|
|
|
Fee
|
Fee
|
Fee
|
|
Equity Call Premium Fund
|
|||
|
Administrative Fees
|
$106,333
|
$134,840
|
$114,541
|
|
Gateway Fund
|
|||
|
Administrative Fees
|
$2,925,931
|
$2,917,074
|
$2,927,204
|
|
Global Megatrends Fund
|
|||
|
Administrative Fees
|
$452,405
|
$476,643
|
$385,588
|
|
Mid Cap Fund
|
|||
|
Administrative Fees
|
$115,399
|
$112,873
|
$92,233
|
|
Small Cap Fund
|
|||
|
Administrative Fees
|
$162,073
|
$465,271
|
$556,203
|
|
Registered
Investment Companies |
Other Pooled
Investment Vehicles |
Other Accounts
|
||||||||||
|
Other Accounts Managed
|
Advisory fee
is based on performance |
Other Accounts Managed
|
Advisory fee
is based on performance |
Other Accounts Managed
|
Advisory fee
is based on performance |
|||||||
|
Name of Portfolio
Manager (Firm) |
# of Accts
|
Total Assets
|
# of Accts
|
Total Assets
|
# of Accts
|
Total Assets
|
# of Accts
|
Total Assets
|
# of Accts
|
Total Assets
|
# of Accts
|
Total Assets
|
|
Dennis G. Alff
(Vaughan Nelson) |
2
|
$1.5
billion |
0
|
$0
|
1
|
$30.9 million
|
0
|
$0
|
29
|
$628.5
million |
1
|
$27.6
million |
|
Daniel M. Ashcraft (Gateway)
|
4
|
$2,087.2
million |
0
|
$0
|
0
|
$0
|
0
|
$0
|
70
|
$607.8
million |
0
|
$0
|
|
Michael T. Buckius
(Gateway) |
4
|
$2,087.2
million |
0
|
$0
|
0
|
$0
|
0
|
$0
|
87
|
$826.0
million |
0
|
$0
|
|
Hua Cheng
(Mirova US) |
1
|
$847.3
million |
0
|
$0
|
26
|
$12.8
billion |
0
|
$0
|
0
|
$0
|
0
|
$0
|
|
James Eisenman
(Vaughan Nelson) |
3
|
$970.1
million |
0
|
$0
|
3
|
$266.4
million |
0
|
$0
|
88
|
$2.5
billion |
0
|
$0
|
|
Sundeep Khanna
(Vaughan Nelson) |
2
|
$1.5
billion |
0
|
$0
|
1
|
$30.9
million |
0
|
$0
|
29
|
$628.5
million |
1
|
$27.6
million |
|
Jens Peers
(Mirova US) |
1
|
$847.3
million |
0
|
$0
|
26
|
$12.8
billion |
0
|
$0
|
0
|
$0
|
0
|
$0
|
|
Kenneth H. Toft
(Gateway) |
4
|
$2,087.2
million |
0
|
$0
|
0
|
$0
|
0
|
$0
|
16
|
$320.3
million |
0
|
$0
|
|
Mitchell J. Trotta
(Gateway) |
3
|
$1,994.0
million |
0
|
$0
|
0
|
$0
|
0
|
$0
|
43
|
$554.7
million |
0
|
$0
|
|
Chris D. Wallis
(Vaughan Nelson) |
9
|
$3.3
billion |
0
|
$0
|
9
|
$61.1
million |
0
|
$0
|
254
|
$7.7
billion |
21
|
$333.6 million
|
|
●
|
Cash bonuses awarded to portfolio managers and analysts, with the allocation based upon quantitative (collective and individual) as well as qualitative criteria. Quantitative criteria include the excess performance of the portfolio versus the benchmark, for both one-year and three-year periods. Qualitative criteria are defined annually to assess the contribution of each team to the overall performance of all portfolios, not just their own.
|
|
●
|
A long-term incentive plan (“LTIP”) is awarded to key people, i.e., people whose yearly performance and contribution to Mirova’s results are high. The LTIP is indexed to Mirova’s operating income before tax.
|
|
●
|
Performance of the strategy managed (both absolute and relative to peers)
|
|
●
|
Amount of revenue derived from the strategy managed
|
|
●
|
Contribution to the development and execution of the firm’s investment philosophy and process
|
|
●
|
Participation and effectiveness in performing client service activities and marketing initiatives
|
|
Name of Portfolio Manager
|
Fund(s) Managed
|
Dollar Range of Equity Securities Invested*
|
|
Dennis G. Alff
(Vaughan Nelson) |
Mid Cap Fund
|
F
|
|
Daniel M. Ashcraft
(Gateway) |
Equity Call Premium Fund
Gateway Fund |
C
C |
|
Michael T. Buckius
(Gateway) |
Equity Call Premium Fund
Gateway Fund |
G
G |
|
Hua Cheng
(Mirova US) |
Global Megatrends Fund
|
E
|
|
James Eisenman
(Vaughan Nelson) |
Small Cap Fund
|
E
|
|
Sundeep Khanna**
(Vaughan Nelson) |
Mid Cap Fund
|
E
|
|
Soliane Varlet
(Mirova US) |
Global Megatrends Fund
|
A
|
|
Jens Peers
(Mirova US) |
Global Megatrends Fund
|
E
|
|
Kenneth H. Toft
(Gateway) |
Equity Call Premium Fund
Gateway Fund |
F
F |
|
Mitchell J. Trotta
(Gateway) |
Equity Call Premium Fund
Gateway Fund |
B
B |
|
Chris D. Wallis
(Vaughan Nelson) |
Small Cap Fund
Mid Cap Fund |
A
A |
|
●
|
price;
|
|
●
|
the size of the transaction;
|
|
●
|
the nature of the market for the security;
|
|
●
|
the amount of commission;
|
|
●
|
the timing of the transaction taking into account market prices and trends;
|
|
●
|
the reputation, experience and financial stability of the broker-dealer involved;
|
|
●
|
the quality of service rendered by the broker-dealer in other transactions.
|
|
●
|
Equity securities (including shares of closed-end investment companies and ETFs), exchange-traded notes, rights, and warrants — listed equity securities are valued at the last sale price quoted on the exchange where they are traded most extensively or, if there is no reported sale during the day, the closing bid quotation as reported by a third-party pricing service. Securities traded on the NASDAQ Global Select Market, NASDAQ Global Market and NASDAQ Capital Market are valued at the NASDAQ Official Closing Price (“NOCP”), or if lacking an NOCP, at the most recent bid quotations on the applicable NASDAQ Market. Unlisted equity securities (except unlisted preferred equity securities discussed below) are valued at the last sale price quoted in the market where they are traded most extensively or, if there is no reported sale during the day, the closing bid quotation as reported by a third-party pricing service. If there is no sale price or closing bid quotation available, unlisted equity securities will be valued using evaluated bids furnished by a third-party pricing service, if available. In some foreign markets, an official close price and a last sale price may be available from the foreign exchange or market. In those cases, the official close price is used. Valuations based on information from foreign markets may be subject to the Fund’s fair value policies described below. If a right is not traded on any exchange, its value is based on the market value of the underlying security, less the cost to subscribe to the underlying security (e.g., to exercise the right), adjusted for the subscription ratio. If a warrant is not traded on any exchange, a price is obtained from a broker-dealer.
|
|
●
|
Debt securities and unlisted preferred equity securities — evaluated bids furnished to a Fund by a third-party pricing service using market information, transactions for comparable securities and various relationships between securities, if available, or bid prices obtained from broker-dealers.
|
|
●
|
Senior Loans — bid prices supplied by a third-party pricing service, if available, or bid prices obtained from broker-dealers.
|
|
●
|
Bilateral Swaps — bilateral credit default swaps are valued based on mid prices (between the bid and ask prices) supplied by a third-party pricing service. Bilateral interest rate swaps and bilateral standardized commodity and equity index total return swaps are valued based on prices supplied by a third-party pricing service. If prices from a third-party pricing service are not available, prices from a broker-dealer may be used.
|
|
●
|
Centrally Cleared Swaps — settlement prices of the clearing house on which the contracts were traded or prices obtained from broker-dealers.
|
|
●
|
Options — domestic exchange-traded index and single name equity options contracts (including options on ETFs) are valued at the mean of the National Best Bid and Offer quotations as determined by the Options Price Reporting Authority. Foreign exchange-traded single name equity options contracts are valued at the most recent settlement price. Options contracts on foreign indices are priced at the most recent settlement price. Options on futures contracts are valued using the current settlement price on the exchange on which, over time, they are traded most extensively. Other exchange-traded options are valued at the average of the closing bid and ask quotations on the exchange on which, over time, they are traded most extensively. OTC currency options and swaptions are valued at mid-prices (between the bid and ask prices) supplied by a third-party pricing service, if available. Other OTC options contracts (including currency options and swaptions not priced through a third-party pricing service) are valued based on prices obtained from broker-dealers. Valuations based on information from foreign markets may be subject to the Funds’ fair value policies described below.
|
|
●
|
Futures — most recent settlement price on the exchange on which the valuation designee believes that, over time, they are traded most extensively. Valuations based on information from foreign markets may be subject to the Funds’ fair value policies described below.
|
|
●
|
Forward Foreign Currency Contracts — interpolated rates determined based on information provided by a third-party pricing service.
|
|
●
|
Mutual Funds — net asset value.
|
|
●
|
The likelihood of payment—the capacity and willingness of the obligor to meet its financial commitments on an obligation in accordance with the terms of the obligation;
|
|
●
|
The nature and provisions of the financial obligation, and the promise we impute; and
|
|
●
|
The protection afforded by, and relative position of, the financial obligation in the event of a bankruptcy, reorganization, or other arrangement under the laws of bankruptcy and other laws affecting creditors’ rights.
|
|
●
|
Amortization schedule—the larger the final maturity relative to other maturities, the more likely it will be treated as a note; and
|
|
●
|
Source of payment—the more dependent the issue is on the market for its refinancing, the more likely it will be treated as a note.
|
|
●
|
Preliminary ratings may be assigned to obligations, most commonly structured and project finance issues, pending receipt of final documentation and legal opinions.
|
|
●
|
Preliminary ratings may be assigned to obligations that will likely be issued upon the obligor’s emergence from bankruptcy or similar reorganization, based on late-stage reorganization plans, documentation, and discussions with the obligor. Preliminary ratings may also be assigned to the obligors. These ratings consider the anticipated general credit quality of the reorganized or post-bankruptcy issuer as well as attributes of the anticipated obligation(s).
|
|
●
|
Preliminary ratings may be assigned to entities that are being formed or that are in the process of being independently established when, in S&P Global Ratings’ opinion, documentation is close to final. Preliminary ratings may also be assigned to the obligations of these entities.
|
|
●
|
Preliminary ratings may be assigned when a previously unrated entity is undergoing a well-formulated restructuring, recapitalization, significant financing, or other transformative event, generally at the point that investor or lender commitments are invited. The preliminary rating may be assigned to the entity and to its proposed obligation(s). These preliminary ratings consider the anticipated general credit quality of the obligor, as well as attributes of the anticipated obligation(s), assuming successful completion of the transformative event. Should the transformative event not occur, S&P Global Ratings would likely withdraw these preliminary ratings.
|
|
●
|
A preliminary recovery rating may be assigned to an obligation that has a preliminary issue credit rating.
|
| * | By their terms, hybrid securities allow for the omission of scheduled dividends, interest, or principal payments, which can potentially result in impairment if such an omission occurs. Hybrid securities may also be subject to contractually allowable write-downs of principal that could result in impairment. Together with the hybrid indicator, the long-term obligation rating assigned to a hybrid security is an expression of the relative credit risk associated with that security. |
|
●
|
The issuer has entered into a grace or cure period following non-payment of a material financial obligation;
|
|
●
|
The formal announcement by the issuer or their agent of a DDE; and
|
|
●
|
A closed financing vehicle where payment capacity is irrevocably impaired such that it is not expected to pay interest and/or principal in full during the life of the transaction, but where no payment default is imminent.
|
|
●
|
An uncured payment default or DDE on a bond, loan or other material financial obligation, but
|
|
●
|
Has not entered into bankruptcy filings, administration, receivership, liquidation, or other formal winding-up procedure, and
|
|
●
|
Has not otherwise ceased operating. This would include:
|
|
○
|
The selective payment default on a specific class or currency of debt;
|
|
○
|
The uncured expiry of any applicable original grace period, cure period or default forbearance period following a payment default on a bank loan, capital markets security or other material financial obligation.
|
|
●
|
The ratings do not predict a specific percentage of default likelihood or failure likelihood over any given time period.
|
|
●
|
The ratings do not opine on the market value of an issuer’s securities or stock, or the likelihood that this value may change.
|
|
●
|
The ratings do not opine on the liquidity of an issuer’s securities or stock.
|
|
●
|
Obligation ratings assigned on the Probability of Default only scale do not opine on the possible loss severity on such obligation should an issuer (or an obligation with respect to structured finance transactions) default, except in limited circumstances for U.S. public finance obligations where Chapter 9 of the Bankruptcy Code provides reliably superior prospects for ultimate recovery to local government obligations that benefit from a statutory lien on revenues or during the pendency of a bankruptcy proceeding under the Code if there is sufficient visibility on potential recovery prospects.
|
|
●
|
The ratings do not opine on the suitability of an issuer as a counterparty to trade credit.
|
|
The ratings do not opine on any quality related to an issuer’s business, operational or financial profile other than the agency’s opinion on its relative vulnerability to default or in the case of Viability Ratings (VRs) on its relative vulnerability to failure. For the avoidance of doubt, not all defaults will be considered a default for rating purposes. Typically, a default relates to a liability payable to an unaffiliated, outside investor.
|
|
The ratings do not opine on any quality related to a transaction’s profile other than the agency’s opinion on the relative vulnerability to default of an issuer and/or of each rated tranche or security.
|
|
The ratings do not predict a specific percentage of extraordinary support likelihood over any given period.
|
|
In the case of Government and Shareholder Support Ratings, the ratings do not opine on any quality related to an issuer’s business, operational or financial profile other than the agency’s opinion on its relative likelihood of receiving external extraordinary support.
|
|
●
|
‘Matured’ – Denoted as ‘NR’. This action is used when an issue has reached its redemption date and rating coverage is discontinued. This indicates that a previously rated issue has been repaid, but other issues of the same program (rated or unrated) may remain outstanding. For the convenience of investors, Fitch may also include issues relating to a rated issuer or transaction that are not and have not been rated on its section of the web page relating to the respective issuer or transaction. Such issues will also be denoted ‘NR’.
|
|
●
|
‘Paid-In-Full’ – Denoted as ‘PIF’. This action indicates that an issue has been paid in full. In covered bonds, PIF is only used when all issues of a program have been repaid.
|
| * | A Rating Action or Review must be recorded for each rating in a required cycle to be considered compliant with Fitch policy concerning aging of ratings. Not all Rating Actions, Data Actions, or changes in rating modifiers, meet this requirement. Actions or Reviews that can meet this requirement are noted with an *. |

|
*(1)
|
Buy more than 10% of the voting securities or more than 10% of all of the securities of any issuer, or invest to control or manage any company.
|
|
*(2)
|
Purchase securities on “margin,” except for short-term credits as needed to clear securities purchases.
|
|
*(3)
|
Invest in securities issued by other investment companies, except in connection with a merger, consolidation, acquisition, or reorganization, or by purchase in the open market of securities of closed-end investment companies where no underwriter or dealer commission or profit, other than a customary brokerage commission, is involved and only if immediately thereafter not more than 10% of the value of its total assets would be invested in such securities.
|
|
*(4)
|
Purchase securities, other than shares of the Fund, from or sell portfolio securities to its directors or officers, or firms they are affiliated with as principals, except as permitted by the regulations of the SEC.
|
|
*(5)
|
Purchase or sell commodities or commodity contracts, or write, purchase or sell options, except that the Fund may (a) buy or sell futures contracts on securities or on securities indices and (b) write, purchase or sell put or call options on securities, on securities indices or on futures contracts of the type referred to in clause (a) of this restriction.
|
|
*(6)
|
Make loans, except loans of portfolio securities and except to the extent that the purchase of notes, repurchase agreements, bonds, or other evidences of indebtedness or deposits with banks or other financial institutions may be considered loans.
|
|
*(7)
|
Make short sales of securities or maintain a short position.
|
|
*(8)
|
Purchase or sell real estate, provided that the Fund may invest in securities secured by real estate or interests therein or in securities issued by companies that invest in real estate or interests therein.
|
|
*(9)
|
Purchase or sell interests in oil and gas or other mineral exploration or development programs, provided that the Fund may invest in securities issued by companies which do invest in or sponsor such programs.
|
|
*(10)
|
Underwrite the securities of other issuers.
|
|
*(11)
|
Invest more than 10% of the value of its total assets, in the aggregate, in repurchase agreements maturing in more than seven days and restricted securities.
|
|
*(12)
|
Purchase any security (other than U.S. government securities) if, as a result, more than 25% of the Fund’s total assets (taken at current value) would be invested in any one industry (in the utilities category, gas, electric, water, and telephone companies will be considered as being in separate industries).
|
|
*†(13)
|
Borrow money, except as a temporary measure for extraordinary or emergency purposes, up to an amount not in excess of
33 1/3% of its total assets. |
|
*(14)
|
Issue senior securities. For the purpose of this restriction, none of the following is deemed to be a senior security: any borrowing permitted by restriction (13) above; any collateral arrangements with respect to options, forward contracts, futures contracts, swap contracts and other similar contracts and options on futures contracts and with respect to initial and variation margin; the purchase or sale of options, forward contracts, futures contracts, swap contracts or similar contracts or options on futures contracts; and the issuance of shares of beneficial interest permitted from time to time by the provisions of Loomis Sayles Funds II’s First Amended and Restated Agreement and Declaration of Trust and by the 1940 Act, the rules thereunder, or any exemption therefrom.
|
|
†(15)
|
Invest more than 15% of the Fund’s total net assets in illiquid securities.
|
|
*(1)
|
Purchase any security (other than U.S. government securities) if, as a result, 25% or more of the Fund’s total assets (taken at current value) would be invested in any one industry. For purposes of this restriction, telephone, gas and electric public utilities are each regarded as separate industries and finance companies whose financing activities are related primarily to the activities of their parent companies are classified in the industry of their parents, finance companies whose financing activities are not related primarily to the activities of their parent companies are classified in the industry the Fund’s adviser believes is most applicable to such finance companies, and each foreign country’s government (together with all subdivisions thereof) will be considered to be a separate industry. For purposes of this restriction, asset-backed securities are not considered to be bank obligations.
|
|
*(2)
|
Make short sales of securities or maintain a short position, except that the Fund may make any short sales or maintain any short positions where the short sales or short positions would not constitute “senior securities” under the 1940 Act.
|
|
*†(3)
|
Borrow money, except to the extent permitted under the 1940 Act.
|
|
*(4)
|
Make loans, except that the Fund may purchase or hold debt instruments in accordance with its investment objectives and policies, provided, however, this restriction does not apply to repurchase agreements or loans of portfolio securities.
|
|
*(5)
|
Act as an underwriter of securities of other issuers except that, in the disposition of portfolio securities, it may be deemed to be an underwriter under the federal securities laws.
|
|
*(6)
|
Purchase or sell real estate, although it may purchase securities of issuers which deal in real estate, securities which are secured by interests in real estate, and securities which represent interests in real estate, and it may acquire and dispose of real estate or interests in real estate acquired through the exercise of its rights as a holder of debt obligations secured by real estate or interests therein.
|
|
*(7)
|
Issue senior securities, except for permitted borrowings or as otherwise permitted under the 1940 Act.
|
|
*(8)
|
Purchase and sell commodities to the maximum extent permitted by applicable law.
|
|
*(1)
|
Act as underwriter, except to the extent that, in connection with the disposition of portfolio securities, it may be deemed to be an underwriter under certain federal securities laws.
|
|
*(2)
|
Invest in oil, gas or other mineral leases, rights or royalty contracts or in real estate, commodities or commodity contracts. (This restriction does not prevent the Fund from engaging in transactions in futures contracts relating to securities indices, interest rates or financial instruments or options, or from investing in issuers that invest or deal in the foregoing types of assets or from purchasing securities that are secured by real estate.)
|
|
*(3)
|
Make loans, except that the Fund may lend its portfolio securities to the extent permitted under the 1940 Act. (For purposes of this investment restriction, neither (i) entering into repurchase agreements nor (ii) purchasing debt obligations in which the Fund may invest consistent with its investment policies is considered the making of a loan.)
|
|
(4)
|
With respect to 75% of its assets, purchase any security (other than U.S. government securities) if, as a result, more than 5% of the Fund’s assets (taken at current value) would then be invested in securities of a single issuer.
|
|
(5)
|
With respect to 75% of its assets, acquire more than 10% of the outstanding voting securities of an issuer.
|
|
*(6)
|
Purchase any security (other than U.S. government securities) if, as a result, more than 25% of the Fund’s assets (taken at current value) would be invested in any one industry (in the utilities category, gas, electric, water and telephone companies will be considered as being in separate industries.)
|
|
*(7)
|
Borrow in excess of 10% of its assets (taken at cost) or 5% of its assets (taken at current value), whichever is lower, nor borrow any money except as a temporary measure for extraordinary or emergency purposes.
|
|
(8)
|
Purchase securities on margin (except such short-term credits as are necessary for clearance of transactions) or make short sales (except where, by virtue of ownership of other securities, it has the right to obtain, without payment of additional consideration, securities equivalent in kind and amount to those sold.)
|
|
(9)
|
Participate on a joint or joint and several basis in any trading account in securities. (The “bunching” of orders for the purchase or sale of portfolio securities with Loomis Sayles or accounts under its management to reduce brokerage commissions, to average prices among them or to facilitate such transactions is not considered a trading account in securities for purposes of this restriction.)
|
|
†(10)
|
Purchase any illiquid security, including any security that is not readily marketable, if, as a result, more than 15% of the Fund’s net assets (based on current value) would then be invested in such securities.
|
|
(11)
|
Write or purchase puts, calls, or combinations of both, except that the Fund may (1) acquire warrants or rights to subscribe to securities of companies issuing such warrants or rights, or of parents or subsidiaries of such companies, (2) purchase and sell put and call options on securities, and (3) write, purchase and sell put and call options on currencies and enter into currency forward contracts.
|
|
*(12)
|
Issue senior securities. (For purposes of this restriction, none of the following is deemed to be a senior security: any pledge or other encumbrance of assets permitted by restriction (14) below; any borrowing permitted by restriction (7) above; any collateral arrangements with respect to options, futures contracts, and options on futures contracts and with respect to initial and variation margin; and the purchase or sale of options, forward contracts, futures contracts, or options on futures contracts.)
|
|
(13)
|
Pledge its assets to the maximum extent permitted by applicable law.
|
|
*(1)
|
Purchase any security (other than U.S. government securities) if, as a result, 25% or more of the Fund’s total assets (taken at current value) would be invested in any one industry. For purposes of this restriction, telephone, gas and electric public utilities are each regarded as separate industries, finance companies whose financing activities are related primarily to the activities of their parent companies are classified in the industry of their parents, finance companies whose financing activities are not related primarily to the activities of their parent companies are classified in the industry the adviser believes is most applicable to such finance companies and each foreign country’s government (together with all subdivisions thereof) will be considered to be a separate industry. For purposes of this restriction, asset-backed securities are not considered to be bank obligations.
|
|
*(2)
|
Make short sales of securities or maintain a short position, except that the Fund may make any short sales or maintain any short positions where the short sales or short positions would not constitute “senior securities” under the 1940 Act.
|
|
*†(3)
|
Borrow money, except to the extent permitted under the 1940 Act.
|
|
*(4)
|
Make loans, except that the Fund may purchase or hold debt instruments in accordance with its investment objective and policies, provided however, this restriction does not apply to repurchase agreements or loans of portfolio securities.
|
|
*(5)
|
Act as an underwriter of securities of other issuers except that, in the disposition of portfolio securities, it may be deemed to be an underwriter under the federal securities laws.
|
|
*(6)
|
Purchase or sell real estate, although it may purchase securities of issuers that deal in real estate, securities that are secured by interests in real estate, and securities that represent interests in real estate, and it may acquire and dispose of real estate or interests in real estate acquired through the exercise of its rights as a holder of debt obligations secured by real estate or interests therein.
|
|
*(7)
|
Issue senior securities, except for permitted borrowings or as otherwise permitted under the 1940 Act.
|
|
*(8)
|
Purchase and sell commodities to the maximum extent permitted by applicable law.
|
|
*(1)
|
Purchase any security (other than U.S. government securities) if, as a result, more than 25% of the Fund’s total assets (taken at current value) would be invested in any one industry (in the utilities category, gas, electric, water and telephone companies will be considered as being in separate industries, and each foreign country’s government (together with subdivisions thereof) will be considered to be a separate industry).
|
|
(2)
|
Purchase securities on margin (but it may obtain such short-term credits as may be necessary for the clearance of purchases and sales of securities), or make short sales except where, by virtue of ownership of other securities, it has the right to obtain, without payment of further consideration, securities equivalent in kind and amount to those sold, and the Fund will not deposit or pledge more than 10% of its total assets (taken at current value) as collateral for such sales. (For this purpose, the deposit or payment by the Fund of initial or variation margin in connection with futures contracts or related options transactions is not considered the purchase of a security on margin.)
|
|
(3)
|
With respect to 75% of its total assets, purchase any security if, as a result, more than 5% of its total assets (based on current value) would be invested in the securities of a single issuer or acquire more than 10% of the outstanding voting securities of any issuer (in each case excluding U.S. government securities, cash and cash equivalents and the securities of other investment companies).
|
|
*(4)
|
Borrow money in excess of 25% of its total assets, and then only as a temporary measure for extraordinary or emergency purposes.
|
|
*(5)
|
Make loans, except by entering into repurchase agreements or by purchase of bonds, debentures, commercial paper, corporate notes and similar evidences of indebtedness, which are a part of an issue to the public or to financial institutions, or through the lending of the Fund’s portfolio securities.
|
|
*(6)
|
Buy or sell oil, gas or other mineral leases, rights or royalty contracts, real estate or commodities or commodity contracts, except that the Fund may buy and sell futures contracts and related options. (This restriction does not prevent the Fund from purchasing securities of companies investing in the foregoing.)
|
|
*(7)
|
Act as underwriter, except to the extent that, in connection with the disposition of portfolio securities, it may be deemed to be an underwriter under certain federal securities laws.
|
|
(8)
|
Except to the extent permitted by rule or order of the SEC, participate on a joint or joint and several basis in any trading account in securities. (The “bunching” of orders for the purchase or sale of portfolio securities with any investment adviser of the Fund or accounts under any such investment adviser’s management to reduce brokerage commissions, to average prices among them or to facilitate such transactions is not considered a trading account in securities for purposes of this restriction.)
|
|
(9)
|
Write, purchase or sell options, except that the Fund may (a) write, purchase and sell put and call options on securities, securities indices, currencies, futures contracts, swap contracts and other similar instruments and (b) enter into currency forward contracts.
|
|
†(10)
|
Invest more than 15% of its net assets (taken at current value) in illiquid securities (excluding Rule 144A securities and certain Section 4(2) commercial paper deemed to be liquid under guidelines established by the Trust’s Trustees).
|
|
*(11)
|
Issue senior securities. (For the purpose of this restriction none of the following is deemed to be a senior security: any pledge or other encumbrance of assets permitted by restriction (2); any borrowing permitted by restriction (4) above; any collateral arrangements with respect to forward contracts, options, futures contracts, swap contracts or other similar contracts and options on futures contracts, swap contracts or other similar contracts and with respect to initial and variation margin; the purchase or sale of options, forward contracts, futures contracts, swap contracts or other similar contracts or options on futures contracts, swap contracts or other similar contracts; and the issuance of shares of beneficial interest permitted from time to time by the provisions of the Loomis Sayles Funds II’s First Amended and Restated Agreement and Declaration of Trust and by the 1940 Act, the rules thereunder, or any exemption therefrom.)
|
|
(12)
|
Pledge its assets to the maximum extent permitted by applicable law.
|
|
*(1)
|
With respect to 75% of its total assets, purchase any security if, as a result, more than 5% of its total assets (based on current value) would then be invested in the securities of a single issuer or acquire more than 10% of the outstanding voting securities of any issuer; provided however, this limitation does not apply to government securities as defined in the 1940 Act.
|
|
*(2)
|
Purchase any security (other than U.S. government securities) if, as a result, more than 25% of the Fund’s total assets (taken at current value) would be invested in any one industry. For purposes of this restriction, telephone, gas and electric public utilities are each regarded as separate industries and finance companies whose financing activities are related primarily to the activities of their parent companies are classified in the industry of their parents. For the purpose of this restriction with regard to bank obligations, bank obligations are considered to be one industry, and asset-backed securities are not considered to be bank obligations.
|
|
*(3)
|
Make short sales of securities, maintain a short position or purchase securities on margin, except that the Fund may obtain short-term credits as necessary for the clearance of security transactions, and the Fund may make any short sales or maintain any short positions where the short sales or short positions would not constitute “senior securities” under the 1940 Act.
|
|
*(4)
|
Purchase or sell real estate, although it may purchase securities of issuers that deal in real estate, securities that are secured by interests in real estate, and securities that represent interests in real estate, and it may acquire and dispose of real estate or interests in real estate acquired through the exercise of its rights as a holder of debt obligations secured by real estate interests therein.
|
|
*(5)
|
Purchase or sell commodities, except that the Fund may purchase and sell futures contracts and options, may enter into foreign exchange contracts and may enter into swap agreements and other financial transactions not requiring the delivery of physical commodities.
|
|
*(6)
|
Act as underwriter, except to the extent that, in connection with the disposition of portfolio securities, it may be deemed to be an underwriter under certain federal securities laws.
|
|
*(7)
|
Make loans, except that the Fund may purchase or hold debt instruments in accordance with its investment objective and policies; provided however, this restriction does not apply to repurchase agreements or loans of portfolio securities.
|
|
†*(8)
|
Borrow money except for temporary or emergency purposes; provided however, that the Fund may loan securities, engage in reverse repurchase agreements and dollar rolls, in an amount not exceeding 33 1/3% of its total assets taken at cost.
|
|
*(9)
|
Issue senior securities, except for permitted borrowings or as otherwise permitted under the 1940 Act.
|
|
†(10)
|
Invest more than 15% of the Fund’s total net assets in illiquid securities.
|
|
*(1)
|
Purchase any security (other than U.S. government securities) if, as a result, 25% or more of the Fund’s total assets (taken at current value) would be invested in any one industry. For purposes of this restriction, telephone, gas and electric public utilities are each regarded as separate industries, finance companies whose financing activities are related primarily to the activities of their parent companies are classified in the industry of their parents, finance companies whose financing activities are not related primarily to the activities of their parent companies are classified in the industry the Fund’s adviser or subadviser believes is most applicable to such finance companies, and each foreign country’s government (together with all subdivisions thereof) will be considered to be a separate industry. For purposes of this restriction, securities and other obligations of issuers in the banking industry are considered to be one industry, and asset-backed securities are not considered to be bank obligations.
|
|
*(2)
|
Make short sales of securities or maintain a short position, except that the Fund may make any short sales or maintain any short positions where the short sales or short positions would not constitute “senior securities” under the 1940 Act.
|
|
†*(3)
|
Borrow money, except to the extent permitted under the 1940 Act.
|
|
*(4)
|
Make loans, except that the Fund may purchase or hold debt instruments in accordance with its investment objective and policies, provided, however, this restriction does not apply to repurchase agreements or loans of portfolio securities.
|
|
*(5)
|
Act as an underwriter of securities of other issuers except that, in the disposition of portfolio securities, it may be deemed to be an underwriter under the federal securities laws.
|
|
*(6)
|
Purchase or sell real estate, although it may purchase securities of issuers which deal in real estate, securities which are secured by interests in real estate, and securities which represent interests in real estate, and it may acquire and dispose of real estate or interests in real estate acquired through the exercise of its rights as a holder of debt obligations secured by real estate or interests therein.
|
|
*(7)
|
Issue senior securities, except for permitted borrowings or as otherwise permitted under the 1940 Act.
|
|
*(8)
|
Purchase and sell commodities to the maximum extent permitted by applicable law.
|
|
*(1)
|
With respect to 75% of its total assets, invest in the securities of any one issuer (other than the U.S. government and its agencies and instrumentalities) if, immediately after and as a result of such investment, more than 5% of the total assets of the Fund would be invested in such issuer.
|
|
*(2)
|
Purchase any security (other than U.S. government securities) if, as a result, more than 25% of the Fund’s total assets (taken at current value) would be invested in any one industry (in the utilities category, gas, electric, water and telephone companies will be considered as being in separate industries, and each foreign country’s government (together with subdivisions thereof) will be considered to be a separate industry.)
|
|
(3)
|
Purchase securities on margin (but it may obtain such short-term credits as may be necessary for the clearance of purchases and sales of securities), or make short sales except when, by virtue of ownership of other securities, it has the right to obtain, without payment of further consideration, securities equivalent in kind and amount to those sold, and the Fund will not deposit or pledge more than 10% of its total assets (taken at current value) as collateral for such sales. (For this purpose, the deposit or payment by the Fund of initial or variation margin in connection with futures contracts or related options transactions is not considered the purchase of a security on margin.)
|
|
(4)
|
Acquire more than 10% of any class of securities of an issuer (other than U.S. government securities and taking all preferred stock issues of an issuer as a single class and all debt issues of an issuer as a single class) or with respect to 75% of its total assets, acquire more than 10% of the outstanding voting securities of an issuer.
|
|
*(5)
|
Borrow money in excess of 25% of its total assets, and then only as a temporary measure for extraordinary or emergency purposes.
|
|
*(6)
|
Make loans, except by entering into repurchase agreements or by purchase of bonds, debentures, commercial paper, corporate notes and similar evidences of indebtedness, which are a part of an issue to the public or to financial institutions, or through the lending of the Fund’s portfolio securities.
|
|
*(7)
|
Buy or sell oil, gas or other mineral leases, rights or royalty contracts, real estate or commodities or commodity contracts, except that the Fund may buy and sell futures contracts and related options. (This restriction does not prevent the Fund from purchasing securities of companies investing in the foregoing.)
|
|
*(8)
|
Act as underwriter, except to the extent that, in connection with the disposition of portfolio securities, it may be deemed to be an underwriter under certain federal securities laws.
|
|
(9)
|
Except to the extent permitted by rule or order of the SEC, participate on a joint or joint and several basis in any trading account in securities. (The “bunching” of orders for the purchase or sale of portfolio securities with any investment adviser or subadviser of the Fund or accounts under any such investment adviser’s or subadviser’s management to reduce brokerage commissions, to average prices among them or to facilitate such transactions is not considered a trading account in securities for purposes of this restriction.)
|
|
(10)
|
Write, purchase or sell options, except that the Fund may (a) write, purchase and sell put and call options on securities, securities indices, currencies, futures contracts, swap contracts and other similar instruments and (b) enter into currency forward contracts.
|
|
†(11)
|
Purchase any illiquid security if, as a result, more than 15% of its net assets (taken at current value) would be invested in such securities.
|
|
*(12)
|
Issue senior securities. For the purpose of this restriction none of the following is deemed to be a senior security: any pledge or other encumbrance of assets permitted by restrictions (3) or (6) above; any borrowing permitted by restriction (5) above; any collateral arrangements with respect to forward contracts, options, futures contracts and options on futures contracts and with respect to initial and variation margin; the purchase or sale of options, forward contracts, futures contracts or options on futures contracts; and the issuance of shares of beneficial interest permitted from time to time by the provisions of the Trust’s Declaration of Trust and by the 1940 Act, the rules thereunder, or any exemption therefrom.
|
|
(13)
|
Pledge its assets to the maximum extent permitted by applicable law.
|
|
Fund
|
Date of Agreement
|
Advisory fee payable by Fund to Loomis Sayles (as a % of average daily net assets of the Fund)
|
|
High Income Fund
|
9/12/03, as amended, 7/1/23
|
0.55%
|
|
International Growth Fund
|
12/15/20
|
0.75%
|
|
Investment Grade Bond Fund
|
10/30/00, as amended, 1/1/26
|
0.38% of the first $15 billion
0.35% of amounts in excess of $15 billion |
|
Strategic Alpha Fund
|
12/14/10, as amended, 7/1/17
|
0.60% of the first $1.25 billion
0.55% of amounts in excess of $1.25 billion |
|
Strategic Income Fund
|
9/12/03, as amended, 7/1/23
|
0.64% of the first $200 million
0.59% of the next $1.8 billion 0.54% of the next $23 billion 0.53% thereafter |
|
Fund
|
Date of Agreement
|
Advisory fee payable by Fund to Natixis Advisors (as a % of average daily net assets of the Fund)
|
|
Natixis Oakmark Fund
|
10/30/00
|
0.70% of the first $200 million
0.65% of the next $300 million 0.60% of the amounts in excess of $500 million |
|
Natixis Oakmark International Fund
|
12/13/2010, as amended 7/1/19
|
0.85% of the first $150 million
0.75% of the next $850 million 0.70% of the amounts in excess of $1 billion |
|
U.S. Equity Opportunities Fund
|
10/30/00, as amended 7/1/23
|
0.67%
|
|
Fund
|
Expense Limit
|
Date of Undertaking
|
|
High Income Fund*
|
||
|
Class A
|
0.95%
|
May 1, 2026
|
|
Class C
|
1.70%
|
May 1, 2026
|
|
Class N
|
0.65%
|
May 1, 2026
|
|
Class Y
|
0.70%
|
May 1, 2026
|
|
International Growth Fund*
|
||
|
Class A
|
1.20%
|
May 1, 2026
|
|
Class C
|
1.95%
|
May 1, 2026
|
|
Class N
|
0.90%
|
May 1, 2026
|
|
Class Y
|
0.95%
|
May 1, 2026
|
|
Investment Grade Bond Fund*
|
||
|
Class A
|
0.73%
|
July 1, 2025
|
|
Class C
|
1.48%
|
July 1, 2025
|
|
Class N
|
0.43%
|
July 1, 2025
|
|
Class Y
|
0.48%
|
July 1, 2025
|
|
Admin Class
|
0.98%
|
July 1, 2025
|
|
Strategic Alpha Fund*
|
||
|
Class A
|
0.98%
|
May 1, 2026
|
|
Class C
|
1.73%
|
May 1, 2026
|
|
Class N
|
0.68%
|
May 1, 2026
|
|
Class Y
|
0.73%
|
May 1, 2026
|
|
Strategic Income Fund*
|
||
|
Class A
|
0.92%
|
May 1, 2026
|
|
Class C
|
1.67%
|
May 1, 2026
|
|
Class N
|
0.62%
|
May 1, 2026
|
|
Class Y
|
0.67%
|
May 1, 2026
|
|
Admin Class
|
1.17%
|
May 1, 2026
|
|
Natixis Oakmark Fund**
|
||
|
Class A
|
1.03%
|
May 1, 2026
|
|
Class C
|
1.78%
|
May 1, 2026
|
|
Class N
|
0.73%
|
May 1, 2026
|
|
Class Y
|
0.78%
|
May 1, 2026
|
|
Fund
|
Expense Limit
|
Date of Undertaking
|
|
Natixis Oakmark International Fund**
|
||
|
Class A
|
1.15%
|
May 1, 2026
|
|
Class C
|
1.90%
|
May 1, 2026
|
|
Class N
|
0.85%
|
May 1, 2026
|
|
Class Y
|
0.90%
|
May 1, 2026
|
|
U.S. Equity Opportunities Fund***
|
||
|
Class A
|
1.08%
|
May 1, 2026
|
|
Class C
|
1.83%
|
May 1, 2026
|
|
Class N
|
0.78%
|
May 1, 2026
|
|
Class Y
|
0.83%
|
May 1, 2026
|
| * | Natixis Advisors will bear a portion of the waiver and/or expense reimbursement. The Natixis Advisors portion of the waiver and/or expense reimbursement will be equal to the ratio of the Natixis Advisors Support Services Fee divided by the management fee earned by Loomis Sayles. |
| ** | Natixis Advisors and Harris Associates L.P. (“Harris Associates”) have agreed to bear the fee waiver and/or expense reimbursement jointly on a pro rata basis relative to their advisory and sub-advisory fees, respectively. |
| *** | Natixis Advisors and each subadviser have agreed to bear the fee waiver and/or expense reimbursement jointly on a pro rata basis relative to their advisory and sub-advisory fees, respectively. |
|
Fund
|
Subadviser
|
Date of
Subadvisory Agreement |
Subadvisory fee payable to Subadviser (as a % of average daily net assets of the Fund/Sleeve)
|
|
Natixis Oakmark Fund
|
Harris Associates
|
10/29/02, as amended 2/28/14
|
0.52% of the first $200 million
0.50% of the amounts in excess of $200 million |
|
Natixis Oakmark International Fund
|
Harris Associates
|
12/13/10, as amended 7/1/19
|
0.60% of the first $150 million
0.50% of the next $850 million 0.45% of the amounts in excess of $1 billion |
|
U.S. Equity Opportunities Fund
|
Harris Associates – Large Cap Value Sleeve
|
10/30/00, as amended 7/1/23
|
0.51% on all assets of the Large Cap Value sleeve
|
|
|
Loomis Sayles – All Cap Growth Sleeve
|
5/18/01, as amended 2/28/14
|
0.35% on all assets of the All Cap Growth sleeve
|
|
|
Fiscal Year Ended
|
||
|
|
12/31/23
|
12/31/24
|
12/31/25
|
|
HIGH INCOME FUND
|
|||
|
Total Advisory Fee
|
$332,827
|
$245,163
|
$407,455
|
|
Fee Waived
|
$244,170
|
$245,163
|
$275,449
|
|
Total Paid
|
$88,657
|
$—
|
$132,006
|
|
INVESTMENT GRADE BOND FUND
|
|||
|
Total Advisory Fee
|
$34,166,102
|
$51,116,844
|
$63,560,765
|
|
Fee Waived
|
$5,251,753
|
$7,580,274
|
$8,792,655
|
|
Total Paid
|
$28,914,349
|
$43,536,570
|
$54,768,110
|
|
|
Fiscal Year Ended
|
||
|
|
12/31/23
|
12/31/24
|
12/31/25
|
|
STRATEGIC INCOME FUND
|
|||
|
Total Advisory Fee
|
$17,579,531
|
$16,281,287
|
$15,459,372
|
|
Fee Waived
|
$1,897,037
|
$2,129,409
|
$2,105,341
|
|
Total Paid
|
$15,682,494
|
$14,151,878
|
$13,354,031
|
|
International GROWTH FUND
|
|||
|
Total Advisory Fee
|
$214,448
|
$286,279
|
$231,223
|
|
Fee Waived
|
$166,923
|
$190,445
|
$212,601
|
|
Total Paid
|
$47,525
|
$95,834
|
$18,622
|
|
STRATEGIC ALPHA FUND
|
|||
|
Total Advisory Fee
|
$4,429,769
|
$3,430,960
|
$4,947,160
|
|
Fee Waived
|
$213,189
|
$306,652
|
$400,677
|
|
Total Paid
|
$4,216,580
|
$3,124,308
|
$4,546,483
|
|
NATIXIS OAKMARK FUND
|
|||
|
Total Advisory Fee
|
$3,011,450
|
$5,278,165
|
$6,762,075
|
|
Natixis Advisors
|
|||
|
Fees Earned
|
$727,221
|
$1,131,361
|
$1,378,679
|
|
Fee Waived
|
$105,581
|
$86,608
|
$0
|
|
Total Paid
|
$621,640
|
$1,044,753
|
$1,378,679
|
|
Harris Associates
|
|||
|
Fees Earned
|
$2,284,229
|
$4,146,804
|
$5,383,396
|
|
Fee Waived
|
$332,874
|
$315,163
|
$0
|
|
Total Paid
|
$1,951,355
|
$3,831,641
|
$5,383,396
|
|
NATIXIS OAKMARK INTERNATIONAL FUND
|
|||
|
Total Advisory Fee
|
$3,024,746
|
$2,850,799
|
$2,321,545
|
|
Natixis Advisors
|
|||
|
Fee Earned
|
$958,249
|
$900,266
|
$723,848
|
|
Fee Waived
|
$272,994
|
$256,929
|
$243,914
|
|
Total Paid
|
$685,255
|
$643,337
|
$479,934
|
|
Harris Associates
|
|||
|
Fee Earned
|
$2,066,497
|
$1,950,533
|
$1,597,697
|
|
Fee Waived
|
$588,721
|
$556,795
|
$538,132
|
|
Total Paid
|
$1,477,776
|
$1,393,738
|
$1,059,565
|
|
U.S. EQUITY OPPORTUNITIES FUND
|
|||
|
Total Advisory Fee
|
$5,769,710
|
$7,057,328
|
$8,108,060
|
|
Natixis Advisors
|
|||
|
Total Paid
|
$2,061,401
|
$2,482,248
|
$2,868,616
|
|
Harris Associates
|
|||
|
Total Paid
|
$2,362,131
|
$2,831,826
|
$3,199,900
|
|
Loomis Sayles
|
|||
|
Total Paid
|
$1,346,178
|
$1,743,254
|
$2,039,544
|
|
|
Fiscal Year Ended
|
||
|
Fund
|
12/31/23
|
12/31/24
|
12/31/25
|
|
Natixis Oakmark Fund
|
$—
|
$—
|
$317,375
|
|
|
Fiscal Year Ended
|
||
|
Fund
|
12/31/23
|
12/31/24
|
12/31/25
|
|
Natixis Oakmark Fund
|
$—
|
$—
|
$163
|
|
|
Fiscal Year Ended
|
|
|
|
|
12/31/23
|
12/31/24
|
12/31/25
|
|
Loomis Sayles High Income Fund
|
|||
|
Brokerage Transactions
|
|
|
|
|
Allocated to Brokers Providing Research Services
|
$—
|
$—
|
$—
|
|
Brokerage Commissions
|
|
|
|
|
Total Brokerage Commissions Paid
|
$1421
|
$2181
|
$1,4391
|
|
Commissions Paid to Brokers Providing Research Services
|
$—
|
$—
|
$—
|
|
Loomis Sayles Investment Grade Bond Fund
|
|||
|
Brokerage Transactions
|
|
|
|
|
Allocated to Brokers Providing Research Services
|
$—
|
$—
|
$—
|
|
Brokerage Commissions
|
|
|
|
|
Total Brokerage Commissions Paid
|
$811,7941
|
$1,661,1821
|
$1,353,1401
|
|
Commissions Paid to Brokers Providing Research Services
|
$—
|
$—
|
$—
|
|
Loomis Sayles Strategic Income Fund
|
|||
|
Brokerage Transactions
|
|
|
|
|
Allocated to Brokers Providing Research Services
|
$—
|
$—
|
$—
|
|
Brokerage Commissions
|
|
|
|
|
Total Brokerage Commissions Paid
|
$235,428
|
$488,5762
|
$762,3502
|
|
Commissions Paid to Brokers Providing Research Services
|
$—
|
$—
|
$—
|
|
Loomis Sayles International Growth Fund
|
|||
|
Brokerage Transactions
|
|
|
|
|
Allocated to Brokers Providing Research Services
|
$3,257,326
|
$32,518,424
|
$5,260,398
|
|
Brokerage Commissions
|
|
|
|
|
Total Brokerage Commissions Paid
|
$3,0123
|
$26,7683
|
$4,6943
|
|
Commissions Paid to Brokers Providing Research Services
|
$3,012
|
$26,764
|
$4,693
|
|
Loomis Sayles Strategic Alpha Fund
|
|||
|
Brokerage Transactions
|
|
|
|
|
Allocated to Brokers Providing Research Services
|
$—
|
$—
|
$—
|
|
Brokerage Commissions
|
|
|
|
|
Total Brokerage Commissions Paid
|
$107,845
|
$115,1092
|
$273,1092
|
|
Commissions Paid to Brokers Providing Research Services
|
$—
|
$—
|
$—
|
|
Natixis Oakmark Fund
|
|||
|
Brokerage Transactions
|
|
|
|
|
Allocated to Brokers Providing Research Services
|
$468,061,261
|
$785,182,693
|
$1,211,173,796
|
|
Brokerage Commissions
|
|
|
|
|
Total Brokerage Commissions Paid
|
$123,204
|
$280,610
|
$344,032
|
|
Commissions Paid to Brokers Providing Research Services
|
$114,805
|
$265,261
|
$338,326
|
|
|
Fiscal Year Ended
|
|
|
|
|
12/31/23
|
12/31/24
|
12/31/25
|
|
Natixis Oakmark International Fund
|
|||
|
Brokerage Transactions
|
|
|
|
|
Allocated to Brokers Providing Research Services
|
$226,477,163
|
$331,474,634
|
$394,144,826
|
|
Brokerage Commissions
|
|
|
|
|
Total Brokerage Commissions Paid
|
$96,529
|
$152,484
|
$183,952
|
|
Commissions Paid to Brokers Providing Research Services
|
$96,112
|
$148,974
|
$177,701
|
|
Natixis U.S. Equity Opportunities Fund
|
|||
|
Brokerage Transactions
|
|
|
|
|
Allocated to Brokers Providing Research Services
|
$610,584,468
|
$755,560,947
|
$762,233,860
|
|
Brokerage Commissions
|
|
|
|
|
Total Brokerage Commissions Paid
|
$238,194
|
$217,467
|
$215,702
|
|
Commissions Paid to Brokers Providing Research Services
|
$233,506
|
$205,886
|
$199,440
|
| 1 | The aggregate brokerage commissions paid changed significantly from 2023 and 2024 to 2025 as a result of increased futures trading in the Fund’s portfolio. |
| 2 | The aggregate brokerage commissions paid changed significantly from 2024 to 2025 as a result of increased futures trading in the Fund’s portfolio. |
| 3 | The aggregate brokerage commissions paid changed significantly from 2023 and 2025 as a result of increased trading in the Fund’s portfolio. |
|
Fund
|
Regular Broker-Dealer
|
Aggregate Value of Securities of each Regular Broker-Dealer (or its Parent) Held by Fund
|
|
Investment Grade Bond Fund
|
Morgan Stanley
|
$324,705,117
|
|
|
JPMorgan Chase & Co.
|
$132,156,208
|
|
|
UBS Group AG
|
$108,632,250
|
|
|
Wells Fargo & Co.
|
$93,251,585
|
|
|
Bank of America Corp.
|
$40,617,581
|
|
|
Goldman Sachs Group, Inc.
|
$14,892,583
|
|
|
Citadel LP
|
$22,151,539
|
|
|
Citigroup, Inc.
|
$1,632,281
|
|
Strategic Alpha Fund
|
Barclays PLC
|
$10,837,430
|
|
|
BNP Paribas SA
|
$9,801,608
|
|
|
Morgan Stanley
|
$9,547,562
|
|
|
JPMorgan Chase & Co.
|
$7,384,305
|
|
|
Citigroup, Inc.
|
$5,407,589
|
|
|
UBS Group AG
|
$5,038,944
|
|
|
Wells Fargo & Co.
|
$9,227,382
|
|
|
Goldman Sachs Group, Inc.
|
$3,463,964
|
|
|
Bank of America Corp.
|
$3,291,101
|
|
|
Citadel LP
|
$583,781
|
|
Strategic Income Fund
|
Barclays PLC
|
$46,742,170
|
|
|
JPMorgan Chase & Co.
|
$35,243,682
|
|
|
Citigroup, Inc.
|
$28,507,647
|
|
|
Goldman Sachs Group, Inc.
|
$15,148,078
|
|
|
Morgan Stanley
|
$14,085,838
|
|
|
UBS Group AG
|
$11,233,454
|
|
|
Wells Fargo & Co.
|
$15,648,462
|
|
|
Citadel LP
|
$3,917,204
|
|
|
Nomura America Finance LLC
|
$3,801,839
|
|
Natixis Oakmark Fund
|
Citigroup, Inc.
|
$31,866,639
|
|
|
Bank of America Corp.
|
$19,006,295
|
|
|
Wells Fargo & Co.
|
$17,805,394
|
|
U.S. Equity Opportunities Fund
|
Citigroup, Inc.
|
$27,900,579
|
|
|
Bank of America Corp.
|
$22,055,000
|
|
High Income Fund
|
Wells Fargo & Co.
|
$135,456
|
|
|
Fiscal Year Ended
|
||
|
Fund
|
12/31/23
|
12/31/24
|
12/31/25
|
|
High Income Fund
|
|||
|
Class A
|
$42,422
|
$40,989
|
$40,201
|
|
Class C
|
$10,073
|
$6,451
|
$4,815
|
|
Total
|
$52,495
|
$47,440
|
$45,016
|
|
International Growth Fund
|
|||
|
Class A
|
$348
|
$451
|
$1,159
|
|
Class C
|
$8
|
$11
|
$11
|
|
Total
|
$356
|
$462
|
$1,170
|
|
Investment Grade Bond Fund
|
|||
|
Class A
|
$1,688,026
|
$1,884,392
|
$1,887,246
|
|
Class C
|
$622,908
|
$735,359
|
$780,753
|
|
Admin Class1
|
$640,954
|
$505,526
|
$454,850
|
|
Total
|
$2,951,888
|
$3,125,277
|
$3,122,849
|
|
Strategic Alpha Fund
|
|||
|
Class A
|
$60,591
|
$42,237
|
$41,503
|
|
Class C
|
$27,095
|
$24,548
|
$23,375
|
|
Total
|
$87,686
|
$66,785
|
$64,878
|
|
Strategic Income Fund
|
|||
|
Class A
|
$2,520,093
|
$2,232,485
|
$2,061,790
|
|
Class C
|
$420,884
|
$295,507
|
$242,397
|
|
Admin Class1
|
$332,550
|
$319,164
|
$301,246
|
|
Total
|
$3,273,527
|
$2,847,156
|
$2,605,433
|
|
Natixis Oakmark Fund
|
|||
|
Class A
|
$548,432
|
$697,967
|
$735,442
|
|
Class C
|
$520,712
|
$575,608
|
$548,955
|
|
Total
|
$1,069,144
|
$1,273,575
|
$1,284,397
|
|
Natixis Oakmark International Fund
|
|||
|
Class A
|
$343,505
|
$328,016
|
$308,767
|
|
Class C
|
$352,056
|
$226,685
|
$155,619
|
|
Total
|
$695,561
|
$554,701
|
$464,386
|
|
U.S. Equity Opportunities Fund
|
|||
|
Class A
|
$1,409,846
|
$1,646,873
|
$1,823,148
|
|
Class C
|
$298,791
|
$310,420
|
$267,063
|
|
Total
|
$1,708,637
|
$1,957,293
|
$2,090,211
|
| 1 | Up to 50% of the fees paid to the Distributor are administrative service fees and are not paid pursuant to a 12b-1 plan. |
|
Fund
|
Compensation to Broker-Dealers
|
Retained by Distributor
|
Total
|
|
High Income Fund
|
$45,016
|
$0
|
$45,016
|
|
International Growth Fund
|
$1,170
|
$0
|
$1,170
|
|
Investment Grade Bond Fund
|
$3,122,849
|
$0
|
$3,122,849
|
|
Natixis Oakmark Fund
|
$1,284,397
|
$0
|
$1,284,397
|
|
Natixis Oakmark International Fund
|
$464,386
|
$0
|
$464,386
|
|
Strategic Alpha Fund
|
$64,878
|
$0
|
$64,878
|
|
Strategic Income Fund
|
$2,605,433
|
$0
|
$2,605,433
|
|
U.S. Equity Opportunities Fund
|
$2,090,211
|
$0
|
$2,090,211
|
|
FUND
|
SHAREHOLDER
|
PERCENTAGE
|
|
High Income Fund1
|
||
|
Class A
|
Deferred Compensation Plan for General
Agents of New England Fin Met Life Securities Accounting Boston, MA 02111-2621 |
26.69%
|
|
|
LPL Financial
Omnibus Customer Account San Diego, CA 92121-3091 |
7.61%
|
|
|
Raymond James
Omnibus Account for Mutual Funds St. Petersburg, FL 33716-1100 |
5.26%
|
|
|
Pershing LLC
Jersey City, NJ 07399-0001 |
5.14%
|
|
Class C
|
Pershing LLC
Jersey City, NJ 07399-0001 |
42.68%
|
|
|
Charles Schwab & Co. Inc.
Special Custody Account For the Exclusive Benefit of Its Customers San Francisco, CA 94105-1901 |
19.06%
|
|
|
National Financial Services LLC
Jersey City, NJ 07310-1995 |
7.75%
|
|
|
Wells Fargo Clearing Services LLC
Special Custody Account For the Exclusive Benefit of Its Customers Saint Louis, MO 63103-2523 |
7.51%
|
|
Class N
|
SEI Private Trust Company
C/O Regions Bank Oaks, PA 19456-9989 |
99.35%
|
|
Class Y
|
Pershing LLC
Jersey City, NJ 07399-0001 |
53.93%
|
|
|
The Vanguard Fiduciary Trust Co.
Wayne, PA 19087-1816 |
7.12%
|
|
Investment Grade Bond Fund
|
||
|
Class A
|
Merrill Lynch Pierce Fenner & Smith Inc.
Jacksonville, FL 32246-6484 |
22.93%
|
|
|
Morgan Stanley Smith Barney LLC
For The Exclusive Benefit of Its Customers New York, NY 10004-1932 |
13.28%
|
|
|
Charles Schwab & Co. Inc.
San Francisco, CA 94104-4151 |
12.20%
|
|
Class C
|
Morgan Stanley Smith Barney LLC
For The Exclusive Benefit of Its Customers New York, NY 10004-1932 |
31.68%
|
|
|
Wells Fargo Clearing Services LLC
Special Custody Account For the Exclusive Benefit of Its Customers Saint Louis, MO 63103-2523 |
16.87%
|
|
|
LPL Financial
Omnibus Customer Account San Diego, CA 92121-3091 |
8.66%
|
|
|
Merrill Lynch Pierce Fenner & Smith Inc.
Jacksonville, FL 32246-6484 |
7.59%
|
|
|
Raymond James
Omnibus Account for Mutual Funds St. Petersburg, FL 33716-1100 |
7.54%
|
|
|
Pershing LLC
Jersey City, NJ 07399-0001 |
6.04%
|
|
|
American Enterprise Investment Svc.
For The Exclusive Benefit of Its Customers Minneapolis, MN 55402-2405 |
5.24%
|
|
Class N
|
Edward D. Jones and Co.
For The Exclusive Benefit of Its Customers Saint Louis, MO 63131-3710 |
71.73%
|
|
Class Y
|
Morgan Stanley Smith Barney
For The Exclusive Benefit of Its Customers New York, NY 10004-1932 |
14.64%
|
|
|
LPL Financial
Omnibus Customer Account San Diego, CA 92121-3091 |
12.46%
|
|
|
American Enterprise Investment Svc.
For The Exclusive Benefit of Its Customers Minneapolis, MN 55402-2405 |
8.92%
|
|
|
UBS WM USA
Omnibus Account M/F Weehawken, NJ 07086-6761 |
7.19%
|
|
|
Charles Schwab & Co. Inc.
Special Custody Account For The Exclusive Benefits of Its Customers San Francisco, CA 94104-4151 |
6.43%
|
|
|
Merrill Lynch Pierce Fenner & Smith Inc.
Jacksonville, FL 32246-6484 |
6.32%
|
|
|
Pershing LLC
Jersey City, NJ 07399-0001 |
5.44%
|
|
|
Wells Fargo Clearing Services LLC
Special Custody Account For The Exclusive Benefit of Its Customers Saint Louis, MO 63103-2523 |
5.22%
|
|
Admin Class
|
Minnesota Life Insurance Company
Saint Paul, MN 55101-2099 |
84.87%
|
|
|
State Street Bank and Trust Co. TTE
and/or Cust FBO ADP Access Product |
8.37%
|
|
Strategic Income Fund2
|
||
|
Class A
|
Merrill Lynch Pierce Fenner & Smith Inc.
For the Sole Benefit of Its Customers Jacksonville, FL 32246-6484 |
25.29%
|
|
|
Morgan Stanley Smith Barney LLC
For the Exclusive Benefit of Its Customers New York, NY 10004-1932 |
15.92%
|
|
|
Wells Fargo Clearing Services LLC
Special Custody Account For The Exclusive Benefit of Its Customers Saint Louis, MO 63103-2523 |
7.92%
|
|
|
UBS WM USA
Omnibus Account M/F Weehawken, NJ 07086-6761 |
7.50%
|
|
Class C
|
Wells Fargo Clearing Services LLC
For The Exclusive Benefit of Its Customers Saint Louis, MO 63103-2523 |
28.24%
|
|
|
Merrill Lynch Pierce Fenner & Smith
For the Sole Benefit of Its Customers Jacksonville, FL 32246-6484 |
15.41%
|
|
|
Morgan Stanley Smith Barney
For The Exclusive Benefit of Its Customers New York, NY 10004-1932 |
13.15%
|
|
|
Raymond James
Omnibus Account for Mutual Funds St. Petersburg, FL 33716-1100 |
10.79%
|
|
|
LPL Financial
Omnibus Customer Account San Diego, CA 92121-3091 |
10.08%
|
|
|
Charles Schwab & Co. Inc.
Special Custody Account For The Exclusive Benefits of Its Customers San Francisco, CA 94104-4151 |
7.43%
|
|
Class N
|
Merrill Lynch Pierce Fenner & Smith LLC
Jacksonville, FL 32246-6484 |
33.73%
|
|
|
National Financial Services, LLC
Jersey City, NJ 07310-1995 |
12.80%
|
|
|
Edward D. Jones & Co
For the Benefit of Customers Saint Louis, MO 63131-3710 |
12.75%
|
|
|
DCGT as TTEE and/or Cust FBO
PLIC Various Retirement Plans Omnibus Des Moines, IA 50392-0001 |
10.97%
|
|
|
State Street Bank and Trust Co. TTEE
And/or Customer FBO ADP Access Product Boston, MA 02111-2901 |
7.37%
|
|
Class Y
|
Merrill Lynch Pierce Fenner & Smith Inc.
For The Sole Benefit of Its Customers Jacksonville, FL 32246-6484 |
27.40%
|
|
|
Morgan Stanley Smith Barney
For The Exclusive Benefit of Its Customers New York, NY 10004-1932 |
14.97%
|
|
|
UBS WM USA
Omnibus Account for Mutual Funds Weehawken, NJ 07086-6761 |
13.47%
|
|
|
Wells Fargo Clearing Services LLC
For The Exclusive Benefit of Its Customers St. Louis, MO 63103-2523 |
6.38%
|
|
Admin Class
|
Voya Institutional Trust Company
Windsor, CT 06095-4773 |
86.42%
|
|
Strategic Alpha Fund
|
||
|
Class A
|
Merrill Lynch Pierce Fenner & Smith Inc.
For The Sole Benefit of Its Customers Jacksonville, FL 32246-6484 |
28.98%
|
|
|
Wells Fargo Clearing Services LLC
For The Exclusive Benefit of Its Customers St. Louis, MO 63103-2523 |
13.76%
|
|
|
Morgan Stanley Smith Barney
For The Exclusive Benefit of Its Customers New York, NY 10004-1932 |
9.50%
|
|
|
UBS WM USA
Omnibus Account for Mutual Funds Weehawken, NJ 07086-6761 |
8.88%
|
|
|
LPL Financial
Omnibus Customer Account San Diego, CA 92121-3091 |
7.18%
|
|
|
Raymond James
Omnibus for Mutual Funds St. Petersburg, FL 33716-1100 |
6.65%
|
|
|
Charles Schwab & Co. Inc.
Special Custody Account For The Exclusive Benefits of Its Customers San Francisco, CA 94104-4151 |
5.95%
|
|
Class C
|
Raymond James
Omnibus for Mutual Funds St. Petersburg, FL 33716-1100 |
49.02%
|
|
|
Wells Fargo Clearing Services LLC
For The Exclusive Benefit of Its Customers St. Louis, MO 63103-2523 |
18.54%
|
|
|
Merrill Lynch Pierce Fenner & Smith Inc.
Jacksonville, FL 32246-6484 |
14.93%
|
|
|
Morgan Stanley Smith Barney
For The Exclusive Benefit of Its Customers New York, NY 10004-1932 |
5.32%
|
|
|
American Enterprise Investment Services
For The Exclusive Benefit of Its Customers Minneapolis, MN 55402-2405 |
5.10%
|
|
Class N
|
Charles Schwab & Co. Inc.
San Francisco, CA 94105-1905 |
32.46%
|
|
|
Band & Co C/O US Bank NA
Milwaukee, WI 53201-1787 |
18.45%
|
|
|
Capinco & Co C/O US Bank NA
Milwaukee, WI 53201-1787 |
15.69%
|
|
|
National Financial Services, LLC
Jersey City, NJ 07310-1995 |
13.04%
|
|
|
California Lutheran University
Thousand Oaks, CA 91360-2787 |
12.82%
|
|
Class Y
|
Charles Schwab & Co. Inc.
Special Custody Account For The Exclusive Benefit of Its Customers San Francisco, CA 94105-1905 |
20.78%
|
|
|
Wells Fargo Clearing Services LLC
Special Custody Account For The Exclusive Benefit of Its Customers St. Louis, MO 63103-2523 |
16.83%
|
|
|
Merrill Lynch Pierce Fenner & Smith Inc.
Jacksonville, FL 32246-6484 |
10.55%
|
|
|
Raymond James
Omnibus for Mutual Funds St. Petersburg, FL 33716-1100 |
9.88%
|
|
|
LPL Financial
Omnibus Customer Account San Diego, CA 92121-3091 |
9.31%
|
|
Natixis Oakmark Fund
|
||
|
Class A
|
Morgan Stanley Smith Barney
For The Exclusive Benefit of Its Customers New York, NY 10004-1932 |
10.15%
|
|
|
Merrill Lynch Pierce Fenner & Smith
For The Sole Benefit of Its Customers Jacksonville, FL 32246-6484 |
7.42%
|
|
|
Raymond James
Omnibus for Mutual Funds St. Petersburg, FL 33716-1100 |
6.19%
|
|
|
Pershing LLC
Jersey City, NJ 07399-0001 |
6.15%
|
|
|
Wells Fargo Clearing Services LLC
Special Custody Account For The Exclusive Benefit of Its Customers St. Louis, MO 63103-2523 |
5.65%
|
|
|
LPL Financial
Omnibus Customer Account San Diego, CA 92121-3091 |
5.22%
|
|
Class C
|
Morgan Stanley Smith Barney
For The Exclusive Benefit of Its Customers New York, NY 10004-1932 |
23.10%
|
|
|
Raymond James
Omnibus for Mutual Funds St. Petersburg, FL 33716-1100 |
13.55%
|
|
|
Wells Fargo Clearing Services LLC
Special Custody Account For The Exclusive Benefit of Its Customers St. Louis, MO 63103-2523 |
12.85%
|
|
|
LPL Financial
Omnibus Customer Account San Diego, CA 92121-3091 |
11.25%
|
|
|
Merrill Lynch Pierce Fenner & Smith
For The Sole Benefit of Its Customers Jacksonville, FL 32246-6484 |
7.67%
|
|
|
Pershing LLC
Jersey City, NJ 07399-0001 |
7.23%
|
|
|
American Enterprise Investment Services
For The Exclusive Benefit of Its Customers Minneapolis, MN 55402-2405 |
5.87%
|
|
|
RBC Capital Markets LLC
Mutual Fund Omnibus Processing Minneapolis, MN 55401-7582 |
5.06%
|
|
Class N
|
Empower Trust
FBO Employee Benefits Clients 401K Greenwood Village, CO 80111-5002 |
29.38%
|
|
|
JP Morgan Securities LLC
Omnibus Account For The Exclusive Benefit of Its Customers Brooklyn, NY 11245-0003 |
13.09%
|
|
|
Voya Institutional Trust Company
Windsor, CT 06095-4773 |
13.02%
|
|
Class Y
|
LPL Financial
Omnibus Customer Account San Diego, CA 92121-3091 |
34.28%
|
|
|
American Enterprise Investment Services
For The Exclusive Benefit of Its Customers Minneapolis, MN 55402-2405 |
24.71%
|
|
|
Raymond James
Omnibus for Mutual Funds St. Petersburg, FL 33716-1100 |
10.24%
|
|
|
Pershing LLC
Jersey City, NJ 07399-0001 |
7.59%
|
|
Natixis Oakmark International Fund
|
||
|
Class A
|
Merrill Lynch Pierce Fenner & Smith
Jacksonville, FL 32246-6484 |
34.67%
|
|
|
Morgan Stanley Smith Barney
For The Exclusive Benefit of Its Customers New York, NY 10004-1932 |
17.47%
|
|
|
Wells Fargo Clearing Services LLC
Special Custody Account For The Exclusive Benefit of Its Customers St. Louis, MO 63103-2523 |
6.32%
|
|
|
Charles Schwab & Co. Inc.
Special Custody Account For The Exclusive Benefit of Its Customers San Francisco, CA 94105-1905 |
6.12%
|
|
|
Pershing LLC
Jersey City, NJ 07399-0001 |
6.04%
|
|
|
UBS WM USA
Omnibus Account M/F Weehawken, NJ 07086-6761 |
5.26%
|
|
Class C
|
Morgan Stanley Smith Barney
For The Exclusive Benefit of Its Customers New York, NY 10004-1932 |
28.08%
|
|
|
Wells Fargo Clearing Services LLC
For The Exclusive Benefit of Its Customers St. Louis, MO 63103-2523 |
26.74%
|
|
|
UBS WM USA
Omnibus Account for Mutual Funds Weehawken, NJ 07086-6761 |
9.51%
|
|
|
Raymond James
Omnibus Account for Mutual Funds St. Petersburg, FL 33716-1100 |
7.22%
|
|
|
Merrill Lynch Pierce Fenner & Smith Inc.
Jacksonville, FL 32246-6484 |
6.06%
|
|
|
Charles Schwab & Co. Inc.
Special Custody Account For The Exclusive Benefit of Its Customers San Francisco, CA 94105-1905 |
6.03%
|
|
|
LPL Financial
Omnibus Customer Account for Mutual Funds San Diego, CA 92121-3091 |
5.88%
|
|
Class N
|
Voya Retirement
Windsor, CT 06095-4773 |
49.07%
|
|
|
Merrill Lynch Pierce Fenner & Smith
Jacksonville, FL 32246-6484 |
27.26%
|
|
|
JP Morgan Securities LLC
Omnibus Account For The Exclusive Benefit of Its Customers Brooklyn, NY 11245-0003 |
23.31%
|
|
Class Y
|
Morgan Stanley Smith Barney
For The Exclusive Benefit of Its Customers New York, NY 10004-1932 |
11.00%
|
|
|
UBS WM USA
Omnibus Account for Mutual Funds Weehawken, NJ 07086-6761 |
8.64%
|
|
|
Raymond James
Omnibus Account for Mutual Funds St. Petersburg, FL 33716-1100 |
8.55%
|
|
|
American Enterprise Investment Svc.
For The Exclusive Benefit of Its Customers Minneapolis, MN 55402-2405 |
8.38%
|
|
|
Wells Fargo Clearing Services LLC
Special Custody Account For The Exclusive Benefit of Its Customers Saint Louis, MO 63103-2523 |
7.55%
|
|
International Growth Fund3
|
||
|
Class A
|
Pershing LLC
Jersey City, NJ 07399-0001 |
52.62%
|
|
|
Charles Schwab & Co. Inc.
Special Custody Account For The Exclusive Benefit of Its Customers San Francisco, CA 94105-1905 |
46.24%
|
|
Class C
|
Natixis Advisors, LLC
Boston, MA 02199-8197 |
99.90%
|
|
Class N
|
Natixis Investment Managers, LLC
Boston, MA 02199-8197 |
61.51%
|
|
|
Aziz Veysi Hamzaogullari & Nurgul Hamzaogullari
Wellesley, MA 02481-4819 |
38.48%
|
|
Class Y
|
Charles Schwab & Co. Inc.
Special Custody Account For The Exclusive Benefit of Its Customers San Francisco, CA 94105-1905 |
79.93%
|
|
|
Pershing LLC
Jersey City, NJ 07399-0001 |
6.67%
|
|
U.S. Equity Opportunities Fund
|
||
|
Class A
|
LPL Financial
Omnibus Customer Account San Diego, CA 92121-3091 |
5.74%
|
|
Class C
|
Wells Fargo Clearing Services LLC
Special Custody Account For The Exclusive Benefit of Its Customers St. Louis, MO 63103-2523 |
26.10%
|
|
|
Pershing LLC
Jersey City, NJ 07399-0001 |
17.79%
|
|
|
Merrill Lynch Pierce Fenner & Smith
For The Exclusive Benefit of Its Customers Jacksonville, FL 32246-6484 |
12.23%
|
|
|
Morgan Stanley Smith Barney
For The Exclusive Benefit of Its Customers New York, NY 10004-1932 |
11.22%
|
|
|
LPL Financial
Omnibus Customer Account for Mutual Funds San Diego, CA 92121-3091 |
8.58%
|
|
|
Raymond James
Omnibus Account for Mutual Funds St. Petersburg, FL 33716-1100 |
7.53%
|
|
|
American Enterprise Investment Svc.
For The Exclusive Benefit of Its Customers Minneapolis, MN 55402-2405 |
6.27%
|
|
Class N
|
CBNA
As Custodian FBO Utica, NY 13502-6317 |
43.82%
|
|
|
Merrill Lynch Pierce Fenner & Smith
For The Exclusive Benefit of Its Customers Jacksonville, FL 32246-6484 |
25.15%
|
|
|
Charles Schwab & Co. Inc.
Special Custody Account For The Exclusive Benefit of Its Customers San Francisco, CA 94105-1905 |
24.10%
|
|
Class Y
|
LPL Financial
Omnibus Customer Account San Diego, CA 92121-3091 |
9.34%
|
|
|
UBS WM USA
Omnibus Account M/F Weehawken, NJ 07086-6761 |
8.58%
|
|
|
Raymond James
Omnibus Account for Mutual Funds St. Petersburg, FL 33716-1100 |
8.27%
|
|
|
American Enterprise Investment Svc.
For The Exclusive Benefit of Its Customers Minneapolis, MN 55402-2405 |
8.20%
|
|
|
Morgan Stanley Smith Barney
For The Exclusive Benefit of Its Customers New York, NY 10004-1932 |
7.64%
|
|
|
Merrill Lynch Pierce Fenner & Smith
For the Sole Benefit of Its Customers Jacksonville, FL 32246-6484 |
6.82%
|
|
|
Pershing LLC
Jersey City, NJ 07399-0001 |
6.40%
|
|
|
Wells Fargo Clearing Services LLC
Special Custody Account For The Exclusive Benefit of Its Customers Saint Louis, MO 63103-2523 |
6.20%
|
| 1 | As of April 1, 2026, SEI Private Trust Company, Oaks, PA 19456-9989 owned 46.82% of the High Income Fund and therefore may be presumed to “control” the Fund, as that term is defined in the 1940 Act. However, such ownership may be beneficially held by individuals or entities other than SEI Private Trust Company. |
| 2 | As of April 1, 2026, Merrill Lynch Pierce Fenner & Smith, Jacksonville, FL 32246-6484 owned 26.31% of the Strategic Income Fund and therefore may be presumed |
| to “control” the Fund, as that term is defined in the 1940 Act. However, such ownership may be beneficially held by individuals or entities other than Merrill Lynch Pierce Fenner & Smith. |
| 3 | As of April 1, 2026, Charles Schwab & Co., Inc., San Francisco, CA 94105-1901, owned 48.46% of the International Growth Fund and therefore may be presumed to “control” the Fund, as that term is defined in the 1940 Act. However, such ownership may be beneficially held by individuals or entities other than Charles Schwab & Co., Inc. |
|
Trust Name
|
Date
|
|
The New England Life Government Securities Trust
|
June 1985 to October 1986
|
|
The New England Funds
|
October 1986 to January 1994
|
|
New England Funds Trust I
|
January 1994 to January 2000
|
|
Nvest Funds Trust I
|
February 2000 to March 2001
|
|
CDC Nvest Funds Trust I
|
March 2001 to April 2005
|
|
IXIS Advisor Funds Trust I
|
May 2005 to August 2007
|
|
Natixis Funds Trust I
|
August 2007 to present
|
|
Trust Name
|
Date
|
|
Investment Trust of Boston
|
May 1931 to November 1988
|
|
Investment Trust of Boston Funds
|
December 1988 to April 1992
|
|
TNE Funds Trust
|
April 1992 to March 1994
|
|
New England Funds Trust II
|
April 1994 to January 2000
|
|
Nvest Funds Trust II
|
February 2000 to March 2001
|
|
CDC Nvest Funds Trust II
|
March 2001 to April 2005
|
|
IXIS Advisor Funds Trust II
|
May 2005 to August 2007
|
|
Natixis Funds Trust II
|
August 2007 to present
|
|
U.S. Treasury Bills — Direct obligations of the U.S. Treasury that are issued in maturities of one year or less. No interest is paid on Treasury bills; instead, they are issued at a discount and repaid at full face value when they mature. They are backed by the full faith and credit of the U.S. government.
|
|
U.S. Treasury Notes and Bonds — Direct obligations of the U.S. Treasury issued in maturities that vary between one and thirty years, with interest normally payable every six (6) months. These obligations are backed by the full faith and credit of the U.S. government.
|
|
U.S. Treasury Floating Rate Notes — Treasury Floating Rate Notes are relatively new instruments authorized by amendments to the U.S. Treasury’s marketable securities auction rules. As with other floating rate securities, at certain intervals the interest payment on a Treasury Floating Rate Note will increase when the applicable index increases, and will decrease when the applicable index decreases. Treasury Floating Rate Notes are a relatively new type of financial instrument. As such, there is no significant trading history of these securities, and there can be no assurance that a liquid market in these securities will develop. Lack of a liquid market may impose the risk of higher transaction costs and the possibility that a Fund may be forced to liquidate positions when it would not be advantageous to do so.
|
|
Treasury Inflation-Protected Securities (“TIPS”) — Fixed-income securities whose principal value is periodically adjusted according to the rate of inflation. The interest rate on TIPS is fixed at issuance, but over the life of the bond this interest may be paid on an increasing or decreasing principal value that has been adjusted for inflation. Although repayment of the original bond principal upon maturity is guaranteed, the market value of TIPS is not guaranteed, and will fluctuate.
|
|
“Ginnie Maes” — Debt securities issued by a mortgage banker or other mortgagee that represent an interest in a pool of mortgages insured by the Federal Housing Administration or the Rural Housing Service or guaranteed by the Veterans Administration. The GNMA guarantees the timely payment of principal and interest when such payments are due, whether or not these amounts are
|
|
collected by the issuer of these certificates on the underlying mortgages. It is generally understood that a guarantee by GNMA is backed by the full faith and credit of the United States. Mortgages included in single family or multi-family residential mortgage pools backing an issue of Ginnie Maes have a maximum maturity of 30 years. Scheduled payments of principal and interest are made to the registered holders of Ginnie Maes (such as the Funds) each month. Unscheduled prepayments may be made by homeowners, or as a result of a default. Prepayments are passed through to the registered holder (such as the Funds, which reinvest any prepayments) of Ginnie Maes along with regular monthly payments of principal and interest.
|
|
“Fannie Maes” — The FNMA is a government-sponsored corporation owned entirely by private stockholders that purchases residential mortgages from a list of approved seller/servicers, including state and federally chartered savings and loan associations, mutual savings banks, commercial banks, credit unions and mortgage banks. Fannie Maes are pass-through securities issued by FNMA that are guaranteed as to timely payment of principal and interest by FNMA, but these obligations are not backed by the full faith and credit of the U.S. government.
|
|
“Freddie Macs” — The Federal Home Loan Mortgage Corporation (“FHLMC”) is a corporate instrumentality of the U.S. government. Freddie Macs are participation certificates issued by FHLMC that represent an interest in residential mortgages from FHLMC’s National Portfolio. FHLMC guarantees the timely payment of interest and ultimate collection of principal, but these obligations are not backed by the full faith and credit of the U.S. government.
|
|
Entity
|
Fund(s)
|
Type
|
Frequency
|
Purpose
|
|
ACA Group (formerly Global Trading Analytics)
|
Certain Funds
|
Transactions
|
Quarterly
|
Trade cost analysis
|
|
Bloomberg
|
All Funds
|
Full
portfolio holdings |
Daily
|
Attribution analysis and portfolio analytics; pricing vendor services and risk management
|
|
Broadridge Financial Solutions, Inc.
|
All Funds
|
Full
portfolio holdings |
As needed
|
Proxy voting recordkeeping services
|
|
CAPIS
|
Certain Funds
|
Transactions
|
Daily
|
Trade cost analysis
|
|
Charles River Systems, Inc.
|
Certain Funds
|
Full
portfolio holdings |
Daily
|
Trade order management services
|
|
Confluence Technologies, Inc.
|
All Funds
|
Full
portfolio holdings |
Quarterly, or more
frequently as needed |
Performing certain functions related to quarterly Form N-PORT filings and production of shareholder reports
|
|
Deloitte Haskins & Sells LLP
|
Certain Funds
|
Holdings in
India-based issuers |
Quarterly
|
Performing certain duties for compliance with the India Income-Tax Act
|
|
Dinkum Management Consultants Co., Ltd
|
Certain Funds
|
Holdings in
Taiwan- based issuers |
Annually
|
Performing certain duties for compliance with Taiwan’s tax laws
|
|
Donnelley Financial Solutions
|
All Funds
|
Full
portfolio holdings |
Quarterly, or more
frequently as needed |
Performing certain functions related to the production of the Funds’ financial statements, quarterly Form N-PORT filings and other related items
|
|
Ernst & Young LLP
|
All Funds
|
Foreign
equity holdings |
Annually, or more
frequently as needed |
Performing certain functions related to the production of the Funds’ federal income and excise tax returns
|
|
FactSet
|
All Funds
|
Full
portfolio holdings |
Daily
|
Performing attribution analysis and portfolio analytics
|
|
Fidelity National Information Services, Inc. (“FIS”) XSPrisa
|
Certain Funds
|
Full
portfolio holdings |
Daily
|
Corporate action services
|
|
FundApps
|
Certain Funds
|
Full
portfolio holdings |
Daily
|
Regulatory reporting services
|
|
Gresham Technologies plc
|
All Funds
|
Full
portfolio holdings |
Daily
|
Certain electronic reconciliations of portfolio holdings of the Funds
|
|
Harris
|
Certain Funds
|
Full
portfolio holdings |
Daily
|
Fund Sub-Advisor
|
|
ICE Data Services
|
All Funds
|
Full
portfolio holdings |
Daily
|
Performing functions related to the liquidity classification of investments, and facilitating reporting to Natixis as disclosed previously in this section
|
|
Institutional Shareholder Services, Inc. (ISS)
|
All Funds
|
Full
portfolio holdings |
As needed
|
Proxy voting administration and research
|
|
Entity
|
Fund(s)
|
Type
|
Frequency
|
Purpose
|
|
Intersystems
|
Certain Funds
|
Full
portfolio holdings |
Daily
|
Database management
|
|
JP Morgan Chase & Co.
|
Certain Funds
|
Full
portfolio holdings |
Daily
|
Providing Private Credit Pricing Services
|
|
KPMG LLP
|
All Funds
|
Full
portfolio holdings |
Annually, or more
frequently as needed |
Performing certain duties related to tax compliance services
|
|
KPMG Global Services Private Limited
|
All Funds
|
Full
portfolio holdings |
Annually, or more
frequently as needed |
Performing certain duties related to tax compliance services
|
|
Lipper
|
Certain Funds
|
Full
portfolio holdings |
Monthly
|
Industry wide services
|
|
Loomis Sayles
|
Certain Funds
|
Full
portfolio holdings |
Daily
|
Fund Advisor/Sub-Advisor
|
|
Natixis Advisors, LLC
|
All Funds
|
Full
portfolio holdings |
Daily
|
Fund Advisor and/or Administrator
|
|
NIM-os, LLC
|
All Funds
|
Full
portfolio holdings |
Daily
|
Hosting of Portfolio Accounting and Trade Order Management and Compliance Systems, Corporate Actions, Trade Settlements, Pricing, Reconciliations
|
|
NIM-os EU
|
All Funds
|
Full
portfolio holdings |
Daily
|
Risk Analysis
|
|
OnCorps, Inc.
|
All Funds
|
Full
portfolio holdings |
Quarterly, or more
frequently as needed |
Performing certain functions related to quarterly N-PORT filings and production of shareholder reports
|
|
PricewaterhouseCoopers, LLP
|
All Funds
|
Full
portfolio holdings |
Annually, or more
frequently as needed |
Funds’ independent public accountant
|
|
Qontigo
|
All Funds
|
Full
portfolio holdings |
Daily
|
Compliance testing related to the Funds’ use of derivatives
|
|
Ropes & Gray LLP
|
All Funds
|
Full
portfolio holdings |
As needed
|
Funds’ outside counsel
|
|
Stradley Ronan Stevens & Young, LLP
|
All Funds
|
Full
portfolio holdings |
As needed
|
Counsel to the independent Trustees
|
|
State Street Bank & Trust Co.
|
All Funds
|
Full
portfolio holdings |
Daily
|
Funds’ custodian, fund accounting agent, and sub-administrator
|
|
Name and Year of Birth
|
Position(s) Held with
the Trust(s), Length of Time Served and Term of Office1 |
Principal
Occupation(s) During Past 5 Years |
Number of
Portfolios in Fund Complex Overseen2 and Other Directorships Held During Past 5 Years |
Experience,
Qualifications, Attributes, Skills for Board Membership |
|
INDEPENDENT TRUSTEES
|
||||
|
Edmond J. English
(1953)
|
Trustee since 2013
Contract Review Committee
Member
|
Executive Chairman of Bob’s Discount Furniture (retail)
|
36
Director, Burlington Stores, Inc. (retail); Director, Rue La La, Inc. (e-commerce retail)
|
Significant experience on the Board and on the boards of other business organizations (including retail companies and a bank); executive experience (including at a retail company)
|
|
Richard A. Goglia
(1951)
|
Trustee since 2015
Chairperson of the
Audit Committee |
Retired
|
36
Director, Ardian Access LLC (investment management/private markets industry)
|
Significant experience on the Board and executive experience (including his role as Vice President and treasurer of a defense company and experience at a financial services company)
|
|
Martin T. Meehan
(1956)
|
Trustee since 2012
Chairperson of the Governance Committee and Contract Review Committee Member
|
President, University of Massachusetts
|
36
None
|
Significant experience on the Board and on the boards of other business organizations; experience as President of the University of Massachusetts; government experience (including as a member of the U.S. House of Representatives);academic experience
|
|
Maureen B. Mitchell
(1951)
|
Trustee since 2017
Chairperson of the Contract Review Committee
|
Retired
|
36
Director, Sterling Bancorp (bank)
|
Significant experience on the Board; financial services industry and executive experience (including role as President of global sales and marketing at a financial services company)
|
|
James P. Palermo
(1955)
|
Trustee since 2016
Audit Committee Member and Governance Committee Member
|
Founding Partner, Breton Capital Management, LLC (private equity); formerly, Partner, STEP Partners, LLC (private equity)
|
36
Director, Candidly (chemicals and biofuels)
|
Significant experience on the Board; financial services industry and executive experience (including roles as Chief Executive Officer of client management and asset servicing for a banking and financial services company)
|
|
Name and Year of Birth
|
Position(s) Held with
the Trust(s), Length of Time Served and Term of Office1 |
Principal
Occupation(s) During Past 5 Years |
Number of
Portfolios in Fund Complex Overseen2 and Other Directorships Held During Past 5 Years |
Experience,
Qualifications, Attributes, Skills for Board Membership |
|
Erik R. Sirri
(1958)
|
Chairperson of the Board since 2021
Trustee since 2009
Ex Officio Member of the Audit Committee, Contract Review Committee and Governance Committee
|
Retired; formerly, Professor of Finance at Babson College
|
36
None
|
Significant experience on the Board; experience as Director of the Division of Trading and Markets at the SEC; academic experience; training as an economist
|
|
Kirk A. Sykes
(1958)
|
Trustee since 2019
Contract Review Committee Member and Governance Committee Member
|
Managing Director of Accordia Partners, LLC (real estate development); President of Primary Corporation (real estate development); Managing Principal of Merrick Capital Partners (infrastructure finance)
|
36
Advisor/Risk Management Committee, Eastern Bank (bank); Director, Apartment Investment and Management Company (real estate investment trust)
|
Significant experience on the Board and significant experience on the boards of other business organizations (including real estate companies and banks)
|
|
Cynthia L. Walker
(1956)
|
Trustee since 2005
Audit Committee Member and Governance Committee Member
|
Executive Consultant for Finance & Administration, Dartmouth’s Geisel School of Medicine; formerly, Deputy Dean for Finance and Administration, Yale University School of Medicine
|
36
None
|
Significant experience on the Board; executive experience in a variety of academic organizations (including roles as dean for finance and administration)
|
|
INTERESTED TRUSTEES
|
||||
|
Kevin P. Charleston3
(1965)
One Financial Center
Boston, MA 02111 |
Trustee since 2015
President and Chief Executive Officer of Loomis Sayles Funds I since 2015
|
President, Chief Executive Officer and Chairman of the Board of Directors, Loomis, Sayles & Company, L. P.
|
36
None
|
Significant experience on the Board; continuing service as President, Chief Executive Officer and Chairman of the Board of Directors of Loomis Sayles
|
|
Name and Year of Birth
|
Position(s) Held with
the Trust(s), Length of Time Served and Term of Office1 |
Principal
Occupation(s) During Past 5 Years |
Number of
Portfolios in Fund Complex Overseen2 and Other Directorships Held During Past 5 Years |
Experience,
Qualifications, Attributes, Skills for Board Membership |
|
David L. Giunta4
(1965)
|
Trustee since 2011
President and Chief Executive Officer of Natixis Funds Trust I, Executive Vice President of Loomis Sayles Funds I and President of Loomis Sayles Funds II since 2008; Chief Executive Officer of Loomis Sayles Funds II since 2015
|
President and Chief Executive Officer, Natixis Advisors, and Natixis Distribution, LLC
|
36
None
|
Significant experience on the Board; experience as President and Chief Executive Officer of Natixis Advisors, and Natixis Distribution, LLC
|
|
Marina Gross5
(1976) |
Trustee since 2024
|
Executive Vice President - Head of Solutions, US, Natixis Investment Managers
|
36
None
|
Experience as Executive Vice President - Head of Solutions, US, Natixis Investment Managers
|
| 1 | Each Trustee serves until retirement, resignation, or removal from the Board. The current retirement age is 75. The position of Chairperson of the Board is appointed for a three-year term. |
| 2 | The Trustees of the Trusts serve as Trustees of a fund complex that includes all series of the Natixis Funds Trust I, Natixis Funds Trust II, Natixis Funds Trust IV and Gateway Trust, (collectively, the “Natixis Funds Trusts”), Loomis Sayles Funds I and Loomis Sayles Funds II (collectively, the “Loomis Sayles Funds Trusts”), and Natixis ETF Trust and Natixis ETF Trust II (collectively, the “Natixis ETF Trusts”) (collectively, the “Fund Complex”). |
| 3 | Mr. Charleston is deemed an “interested person” of the Trusts because he holds the following positions with an affiliated person of the Trusts: President, Chief Executive Officer and Chairman of the Board of Directors of Loomis, Sayles & Company, L.P. |
| 4 | Mr. Giunta is deemed an “interested person” of the Trusts because he holds the following positions with an affiliated person of the Trusts: President and Chief Executive Officer, Natixis Advisors, LLC and Natixis Distribution, LLC. |
| 5 | Ms. Gross is deemed an “interested person” of the Trusts because she holds the following position with an affiliated person of the Trusts: Executive Vice President and Head of Solutions, US, Natixis Investment Managers. |
|
Name and Year of Birth
|
Position(s) Held with the Trust(s)
|
Term of Office1 and Length of Time Served
|
Principal Occupation(s)
During Past 5 Years2 |
|
OFFICERS OF THE TRUST
|
|||
|
Matthew J. Block
(1981)
|
Treasurer, Principal Financial and Accounting Officer
|
Since 2022
|
Senior Vice President, Natixis Advisors and Natixis Distribution, LLC; formerly, Vice President, Natixis Advisors, LLC and Natixis Distribution, LLC; Assistant Treasurer of the Fund Complex
|
|
Susan McWhan Tobin
(1963)
|
Secretary and Chief Legal Officer
Chief Compliance Officer and Anti-Money Laundering Officer
|
Since 2022
Since 2025
|
Executive Vice President, General Counsel and Secretary, Natixis Advisors, LLC and Natixis Distribution, LLC; formerly, Executive Vice President and Chief Compliance Officer of Natixis Investment Managers (March 2019 - May 2022)
|
| 1 | Each officer of the Trusts serves for an indefinite term in accordance with the Trusts’ current by-laws until the date his or her successor is elected and qualified, or until he or she sooner dies, retires, is removed or becomes disqualified. |
| 2 | Each person listed above, except as noted, holds the same position(s) with the Fund Complex. Previous positions during the past five years with Natixis Distribution, LLC, Natixis Advisors or Loomis, Sayles & Company, L.P. are omitted, if not materially different from an officer’s current position with such entity. |
|
Audit Committee
|
Contract Review Committee
|
Governance Committee
|
|
Richard A. Goglia – Chairperson
|
Maureen B. Mitchell – Chairperson
|
Martin T. Meehan – Chairperson
|
|
James P. Palermo
|
Edmond J. English
|
James P. Palermo
|
|
Cynthia L. Walker
|
Martin T. Meehan
|
Kirk A. Sykes
|
|
|
Kirk A. Sykes
|
Cynthia L. Walker
|
|
Dollar Range of Fund Shares1
|
Edmond
J. English2 |
Richard
A. Goglia2 |
Martin
T. Meehan2 |
Maureen
B. Mitchell |
James
P. Palermo2 |
Erik
R. Sirri2 |
Peter
J. Smail |
Kirk
A. Sykes2 |
Cynthia
L. Walker2 |
|
Independent Trustees
|
|||||||||
|
High Income Fund
|
A
|
A
|
A
|
A
|
A
|
A
|
A
|
A
|
A
|
|
International Growth Fund
|
A
|
A
|
A
|
A
|
A
|
A
|
A
|
C
|
A
|
|
Investment Grade Bond Fund
|
E
|
E
|
A
|
A
|
A
|
A
|
A
|
A
|
A
|
|
Natixis Oakmark Fund
|
A
|
E
|
A
|
E
|
A
|
A
|
E
|
A
|
A
|
|
Natixis Oakmark International Fund
|
E
|
A
|
A
|
C
|
A
|
A
|
A
|
A
|
A
|
|
Strategic Alpha Fund
|
A
|
A
|
A
|
A
|
A
|
A
|
A
|
A
|
A
|
|
Strategic Income Fund
|
E
|
A
|
A
|
A
|
A
|
A
|
A
|
A
|
E
|
|
U.S. Equity Opportunities Fund
|
A
|
A
|
E
|
A
|
E
|
A
|
A
|
A
|
E
|
|
Aggregate Dollar Range of Fund Shares in Fund Complex Overseen by Trustee
|
E
|
E
|
E
|
E
|
E
|
E
|
E
|
D
|
E
|
| 1 | A. None B. $1 – $10,000 C. $10,001 – $50,000 D. $50,001 – $100,000 E. over $100,000 |
| 2 | Amounts include economic value of notional investments held through the deferred compensation plan. |
|
Dollar Range of Fund Shares*
|
Kevin P. Charleston
|
David L. Giunta
|
Marina Gross
|
|
Interested Trustees
|
|||
|
High Income Fund
|
A
|
A
|
A
|
|
International Growth Fund
|
A
|
A
|
A
|
|
Investment Grade Bond Fund
|
A
|
B
|
B
|
|
Natixis Oakmark Fund
|
A
|
A
|
A
|
|
Natixis Oakmark International Fund
|
A
|
A
|
A
|
|
Strategic Alpha Fund
|
E
|
A
|
A
|
|
Strategic Income Fund
|
A
|
A
|
A
|
|
U.S. Equity Opportunities Fund
|
A
|
A
|
A
|
|
Aggregate Dollar Range of Fund Shares in Fund Complex Overseen by Trustee
|
E
|
E
|
E
|
| * | A. None B. $1 - $10,000 C. $10,001 - $50,000 D. $50,001 - $100,000 E. over $100,000 |
|
|
Aggregate
Compensation from Natixis Funds Trust I1 |
Aggregate
Compensation from Natixis Funds Trust II1 |
Aggregate
Compensation from Loomis Sayles Funds II1 |
Pension or
Retirement Benefits Accrued as Part of Fund Expenses |
Estimated
Annual Benefits Upon Retirement |
Total
Compensation from the Fund Complex2 |
|
INDEPENDENT TRUSTEES
|
||||||
|
Edmond J. English
|
$47,711
|
$22,059
|
$149,524
|
$0
|
$0
|
$310,000
|
|
Richard A. Goglia
|
$52,340
|
$24,137
|
$164,324
|
$0
|
$0
|
$340,000
|
|
Martin T. Meehan
|
$52,340
|
$24,137
|
$164,324
|
$0
|
$0
|
$340,000
|
|
Maureen B. Mitchell
|
$52,340
|
$24,137
|
$164,324
|
$0
|
$0
|
$340,000
|
|
James P. Palermo
|
$49,254
|
$22,751
|
$154,457
|
$0
|
$0
|
$320,000
|
|
Erik R. Sirri
|
$64,820
|
$19,707
|
$234,188
|
$0
|
$0
|
$410,000
|
|
Peter J. Smail
|
$47,711
|
$22,059
|
$149,524
|
$0
|
$0
|
$310,000
|
|
Kirk A. Sykes
|
$49,254
|
$22,751
|
$154,457
|
$0
|
$0
|
$320,000
|
|
Cynthia L. Walker
|
$49,254
|
$22,751
|
$154,457
|
$0
|
$0
|
$320,000
|
|
INTERESTED TRUSTEES
|
||||||
|
Kevin P. Charleston
|
$0
|
$0
|
$0
|
$0
|
$0
|
$0
|
|
David L. Giunta
|
$0
|
$0
|
$0
|
$0
|
$0
|
$0
|
|
Marina Gross
|
$0
|
$0
|
$0
|
$0
|
$0
|
$0
|
| 1 | Amounts include payments deferred by Trustees for the fiscal year ended December 31, 2025, with respect to the Trusts. The total amount of deferred compensation accrued for Natixis Funds Trust I as of December 31, 2025 for the Trustees is as follows: English $134,962, Goglia $186,892, Meehan $246,446, Palermo $449,565, Sirri $225,830, Sykes $18,672, and Walker $981,886. The total amount of deferred compensation accrued for Natixis Funds Trust II as of December 31, 2025 for the Trustees is as follows: English $239,054, Goglia $230,023, Meehan $298,998, Palermo $343,310, Sirri $319,510, Sykes $10,016 and Walker $1,030,325. The total amount of deferred compensation accrued for Loomis Sayles Funds II as of December 31, 2025 for the Trustees is as follows: English $418,173, Goglia $475,850, Meehan $735,163, Palermo $1,186,135, Sirri $695,706, Sykes $52,809 and Walker $2,807,187. |
| 2 | Total Compensation represents amounts paid during the fiscal year ended December 31, 2025 to a Trustee for serving on the board of eight (8) trusts with a total of thirty-six (36) funds as of December 31, 2025. |
|
●
|
With respect to a company’s board of directors, Harris believes that boards should have a majority of independent directors and that audit, compensation and nominating committees should generally consist solely of independent directors, and it will usually vote in favor of proposals that ensure such independence.
|
|
●
|
With respect to auditors, Harris believes that the relationship between an issuer and its auditors should be limited primarily to the audit engagement, although it may include certain closely related activities such as financial statement preparation and tax-related services that do not raise any appearance of impaired independence.
|
|
●
|
With respect to equity based compensation plans, Harris believes that appropriately designed equity-based compensation plans approved by shareholders can be an effective way to align the interests of long-term shareholders and the interests of management, employees and directors. However, Harris is opposed to plans if they have historically been used to provide participants with excessive awards or have inherently objectionable structural features.
|
|
●
|
With respect to corporate structure and shareholder rights, Harris generally believes that all shareholders of an issuer should have an equal voice and that barriers which limit the ability of shareholders to effect change and to realize full value are not desirable.
|
|
●
|
With respect to “social responsibility” issues, Harris believes that matters related to a company’s day-to-day business operations are primarily the responsibility of management. Harris is focused on maximizing long-term shareholder value and will usually vote against shareholder proposals requesting that a company disclose or amend certain business practices unless Harris believes the proposal would have a substantial positive economic impact on the company.
|
|
Cumulative Investment
|
Maximum
Sales Charge Paid by Investors (% of offering price) |
Maximum
Reallowance or Commission (% of offering price) |
Maximum
First Year Service Fee (% of net investment) |
Maximum
First Year Compensation (% of offering price) |
|
International Growth Fund, Natixis
Oakmark Fund, Natixis Oakmark International Fund and U.S. Equity Opportunities Fund |
||||
|
Less than $50,000
|
5.75%
|
5.00%
|
0.25%
|
5.25%
|
|
$50,000 - $99,999
|
4.50%
|
4.00%
|
0.25%
|
4.25%
|
|
$100,000 - $249,999
|
3.50%
|
3.00%
|
0.25%
|
3.25%
|
|
$250,000 - $499,999
|
2.50%
|
2.15%
|
0.25%
|
2.40%
|
|
$500,000 - $999,999
|
2.00%
|
1.70%
|
0.25%
|
1.95%
|
|
Investments of $1 million or more1,2
|
||||
|
Up to $2,999,999
|
None
|
1.00%
|
0.25%
|
1.25%
|
|
$3,000,000 to $4,999,999
|
None
|
0.75%
|
0.25%
|
1.00%
|
|
Excess over $5,000,000
|
None
|
0.50%
|
0.25%
|
0.75%
|
|
Investments with no Sales Charge3
|
None
|
0.00%
|
0.25%
|
0.25%
|
| 1 | Commissions are based on cumulative investments over the life of the account with no adjustment for redemptions, transfers or market declines. For example, if a shareholder has accumulated investments in excess of $5 million and subsequently redeems all or a portion of the account(s), purchases following the redemption will generate a dealer commission of 0.50%. |
| 2 | A securities dealer may elect, at the time of the investment, to waive their commission on investments of $1,000,000 or more. In such cases, investments will be processed as “Investment with no Sales Charge” as described above. No CDSC will be applied to these investments. |
| 3 | Refers to any investments made by investors not subject to a sales charge as described in the Prospectus for Class A shares of the Funds in the section “How Sales Charges Are Calculated.” |
|
Cumulative Investment
|
Maximum
Sales Charge Paid by Investors (% of offering price) |
Maximum
Reallowance or Commission (% of offering price) |
Maximum
First Year Service Fee (% of net investment) |
Maximum
First Year Compensation (% of offering price) |
|
High Income Fund, Investment Grade
Bond Fund, Strategic Alpha Fund and Strategic Income Fund |
||||
|
Less than $100,000
|
4.25%
|
3.75%
|
0.25%
|
4.00%
|
|
$100,000 - $249,999
|
3.50%
|
3.00%
|
0.25%
|
3.25%
|
|
$250,000 - $499,999
|
2.50%
|
2.15%
|
0.25%
|
2.40%
|
|
$500,000 - $999,999
|
2.00%
|
1.70%
|
0.25%
|
1.95%
|
|
Investments of $1 million or more1,2
|
||||
|
Up to $2,999,999 million
|
None
|
1.00%
|
0.25%
|
1.25%
|
|
$3,000,000 to $4,999,999
|
None
|
0.75%
|
0.25%
|
1.00%
|
|
Excess over $5,000,000
|
None
|
0.50%
|
0.25%
|
0.75%
|
|
Cumulative Investment
|
Maximum
Sales Charge Paid by Investors (% of offering price) |
Maximum
Reallowance or Commission (% of offering price) |
Maximum
First Year Service Fee (% of net investment) |
Maximum
First Year Compensation (% of offering price) |
|
Investments with no Sales Charge3
|
None
|
0.00%
|
0.25%
|
0.25%
|
| 1 | Commissions are based on cumulative investments over the life of the account with no adjustment for redemptions, transfers or market declines. For example, if a shareholder has accumulated investments in excess of $5 million and subsequently redeems all or a portion of the account(s), purchases following the redemption will generate a dealer commission of 0.50%. |
| 2 | A securities dealer may elect, at the time of the investment, to waive their commission on investments of $1,000,000 or more. In such cases, investments will be processed as “Investment with no Sales Charge” as described above. No CDSC will be applied to these investments. |
| 3 | Refers to any investments made by investors not subject to a sales charge as described in the Prospectus for Class A shares of the Funds in the section “How Sales Charges Are Calculated.” |
|
Investment
|
Maximum
Front–End Sales Charge Paid by Investors (% of offering price) |
Maximum
Reallowance or Commission (% of offering price) |
Maximum
First Year Service Fee (% of net investment) |
Maximum
First Year Compensation (% of offering price) |
|
All amounts for Class C
|
None
|
1.00%
|
0.00%
|
1.00%
|
|
|
12/31/23
|
12/31/24
|
12/31/25
|
|
NATIXIS FUNDS TRUST I†
|
|||
|
Total commissions on sales of Class A shares
|
$213,152
|
$192,583
|
$220,739
|
|
Amount reallowed to other securities dealers
|
$185,518
|
$167,244
|
$191,432
|
|
Amount retained by Distributor
|
$27,634
|
$25,339
|
$29,307
|
|
Total CDSCs on redemptions of Classes A and C shares
|
$7,431
|
$14,188
|
$7,631
|
|
Amount retained by Distributor*
|
$7,431
|
$14,188
|
$7,631
|
|
NATIXIS FUNDS TRUST II‡
|
|||
|
Total commissions on sales of Class A shares
|
$303,491
|
$386,625
|
$230,516
|
|
Amount reallowed to other securities dealers
|
$263,881
|
$335,381
|
$201,004
|
|
Amount retained by Distributor
|
$39,610
|
$51,244
|
$29,512
|
|
Total CDSCs on redemptions of Classes A and C shares
|
$15,903
|
$4,995
|
$29,047
|
|
Amount retained by Distributor**
|
$15,903
|
$4,995
|
$29,047
|
|
LOOMIS SAYLES FUNDS II‡
|
|||
|
Total commissions on sales of Class A shares
|
$392,608
|
$491,813
|
$388,961
|
|
Amount reallowed to other securities dealers
|
$340,154
|
$427,940
|
$338,584
|
|
Amount retained by Distributor
|
$52,454
|
$63,873
|
$50,377
|
|
Total CDSCs on redemptions of Classes A and C shares
|
$34,832
|
$20,233
|
$31,134
|
|
Amount retained by Distributor***
|
$34,832
|
$20,233
|
$31,134
|
| * | See the section “Other Arrangements” for information about amounts received by the Distributor from Natixis Funds Trust I’s investment advisers and subadvisers or the Funds directly for providing certain administrative services relating to Natixis Funds Trust I. |
| ** | See the section “Other Arrangements” for information about amounts received by the Distributor from Natixis Funds Trust II’s investment advisers and subadvisers or the Funds directly for providing certain administrative services relating to Natixis Funds Trust II. |
| *** | See the section “Other Arrangements” for information about amounts received by the Distributor from Loomis Sayles Funds II’s investment advisers and subadvisers or the Funds directly for providing certain administrative services relating to Loomis Sayles Funds II. |
| † | Information is provided for the Funds in this Statement as listed on the cover page. |
| ‡ | Information is only provided for the Funds in this Statement as listed on the cover page. |
|
|
Fiscal Year Ended
|
||
|
|
12/31/23
|
12/31/24
|
12/31/205
|
|
|
Fee
|
Fee
|
Fee
|
|
High Income Fund
|
|||
|
Administrative Fees
|
$26,568
|
$19,746
|
$31,722
|
|
International Growth Fund
|
|||
|
Administrative Fees
|
$13,245
|
$16,890
|
$13,206
|
|
Investment Grade Bond Fund
|
|||
|
Administrative Fees
|
$3,956,030
|
$5,649,771
|
$6,854,033
|
|
Natixis Oakmark Fund
|
|||
|
Administrative Fees
|
$207,874
|
$363,520
|
$457,502
|
|
Natixis Oakmark International Fund
|
|||
|
Administrative Fees
|
$177,532
|
$159,695
|
$124,039
|
|
Strategic Alpha Fund
|
|||
|
Administrative Fees
|
$341,981
|
$253,433
|
$352,840
|
|
Strategic Income Fund
|
|||
|
Administrative Fees
|
$1,400,053
|
$1,245,536
|
$1,139,538
|
|
U.S. Equity Opportunities Fund
|
|||
|
Administrative Fees
|
$390,705
|
$466,367
|
$518,173
|
|
Registered
Investment Companies |
Other Pooled
Investment Vehicles |
Other Accounts
|
||||||||||
|
Other Accounts Managed
|
Advisory fee
is based on performance |
Other Accounts Managed
|
Advisory fee
is based on performance |
Other Accounts Managed
|
Advisory fee
is based on performance |
|||||||
|
Name of Portfolio
Manager (Firm) |
# of Accts
|
Total Assets
|
# of Accts
|
Total Assets
|
# of Accts
|
Total Assets
|
# of Accts
|
Total Assets
|
# of Accts
|
Total Assets
|
# of Accts
|
Total Assets
|
|
Matthew J. Eagan
(Loomis Sayles) |
17
|
$19.7
billion |
0
|
$0
|
35
|
$13.6
billion |
0
|
$0
|
100
|
$31.8
billion |
3
|
$346.5
million |
|
Robert F. Bierig
(Harris Associates) |
4
|
$49.4
billion |
0
|
$0
|
9
|
$4.8
billion |
0
|
$0
|
462
|
$4.2
billion |
0
|
$0
|
|
Aziz V.
Hamzaogullari (Loomis Sayles) |
17
|
$32.4
billion |
0
|
$0
|
21
|
$21.2
billion |
3
|
$555.6
million |
157
|
$42.9
billion |
1
|
$375.1
million |
|
David Herro
(Harris Associates) |
10
|
$20.6
billion |
0
|
$0
|
29
|
$10.5
billion |
2
|
$109.6
million |
14
|
$1.3
billion |
1
|
$301.4
million |
|
Brian P. Kennedy
(Loomis Sayles) |
13
|
$18.6
billion |
0
|
$0
|
17
|
$12.7
billion |
0
|
$0
|
104
|
$31.7
billion |
3
|
$346.5
million |
|
Anthony P. Coniaris
(Harris Associates) |
8
|
$19.3
billion |
0
|
$0
|
31
|
$10.3
billion |
0
|
$0
|
367
|
$3.5
billion |
0
|
$0
|
|
Eric Liu
(Harris Associates) |
8
|
$19.3
billion |
0
|
$0
|
27
|
$10.1
billion |
2
|
$109.6
million |
11
|
$1.1
billion |
1
|
$301.4
million |
|
Michael Nicolas
(Harris Associates) |
4
|
$47.4
billion |
0
|
$0
|
6
|
$4.7
billion |
0
|
$0
|
83
|
$1.2
billion |
0
|
$0
|
|
William C. Nygren
(Harris Associates) |
4
|
$49.4
billion |
0
|
$0
|
5
|
$4.6
billion |
0
|
$0
|
83
|
$1.2
billion |
0
|
$0
|
|
Peter S. Sheehan
(Loomis Sayles) |
5
|
$1.2
billion |
0
|
$0
|
21
|
$1.5
billion |
0
|
$0
|
32
|
$5.5
billion |
3
|
$346.5
million |
|
Eric Williams
(Loomis Sayles) |
4
|
$1.1
billion |
0
|
$0
|
21
|
$1.5
billion |
0
|
$0
|
28
|
$5.4
billion |
3
|
$346.5
million |
|
Name of Portfolio Manager
|
Fund(s) Managed
|
Dollar Range of Equity Securities Invested
|
|
Matthew J. Eagan
(Loomis Sayles) |
High Income Fund
Investment Grade Bond Fund Strategic Alpha Fund Strategic Income Fund |
E
C E A |
|
Aziz V. Hamzaogullari
(Loomis Sayles) |
International Growth Fund
U.S. Equity Opportunities Fund |
G
G |
|
David G. Herro
(Harris Associates) |
Natixis Oakmark International Fund
|
A
|
|
Robert F. Bierig
(Harris Associates) |
Natixis Oakmark Fund
U.S. Equity Opportunities Fund |
A
A |
|
Brian P. Kennedy
(Loomis Sayles) |
High Income Fund
Investment Grade Bond Fund Strategic Alpha Fund Strategic Income Fund |
D
E D A |
|
Eric Liu
(Harris Associates) |
Natixis Oakmark International Fund
|
A
|
|
Michael Nicolas
(Harris Associates) |
Natixis Oakmark Fund
U.S. Equity Opportunities Fund |
A
A |
|
William C. Nygren
(Harris Associates) |
Natixis Oakmark Fund
U.S. Equity Opportunities Fund |
A
A |
|
Peter S. Sheehan
(Loomis Sayles) |
High Income Fund
|
A
|
|
Anthony P. Coniaris
(Harris Associates) |
Natixis Oakmark International Fund
|
A
|
|
Eric Williams
|
Loomis Sayles High Income Fund
|
C
|
|
●
|
Equity securities (including shares of closed-end investment companies and ETFs), exchange-traded notes, rights, and warrants — listed equity securities are valued at the last sale price quoted on the exchange where they are traded most extensively or, if there is no reported sale during the day, the closing bid quotation as reported by a third-party pricing service. Securities traded on the NASDAQ Global Select Market, NASDAQ Global Market and NASDAQ Capital Market are valued at the NASDAQ Official Closing Price (“NOCP”), or if lacking an NOCP, at the most recent bid quotations on the applicable NASDAQ Market. Unlisted equity securities (except unlisted preferred equity securities discussed below) are valued at the last sale price quoted in the market where they are traded most extensively or, if there is no reported sale during the day, the closing bid quotation as reported by a third-party pricing service. If there is no sale price or closing bid quotation available, unlisted equity securities will be valued using evaluated bids furnished by a third-party pricing service, if available. In some foreign markets, an official close price and a last sale price may be available from the foreign exchange or market. In those cases, the official close price is used. Valuations based on information from foreign markets may be subject to the Fund’s fair value policies described below. If a right is not traded on any exchange, its value is based on the market value of the underlying security, less the cost to subscribe to the underlying security (e.g., to exercise the right), adjusted for the subscription ratio. If a warrant is not traded on any exchange, a price is obtained from a broker-dealer.
|
|
●
|
Debt Securities and unlisted preferred equity securities — evaluated bids furnished to a Fund by a third-party pricing service using market information, transactions for comparable securities and various relationships between securities, if available, or bid prices obtained from broker-dealers.
|
|
●
|
Equity-Linked Notes — valued using broker-dealer bid prices.
|
|
●
|
Senior Loans — bid prices supplied by a third-party pricing service, if available, or bid prices obtained from broker-dealers.
|
|
●
|
Bilateral Swaps — bilateral credit default swaps are valued based on mid prices (between the bid and ask prices) supplied by a third-party pricing service. Bilateral interest rate swaps and bilateral standardized commodity and equity index total return swaps are valued based on prices supplied by a third-party pricing service. If prices from a third-party pricing service are not available, prices from a broker-dealer may be used.
|
|
●
|
Centrally Cleared Swaps – settlement prices of the clearing house on which the contracts were traded or prices obtained from broker-dealers.
|
|
●
|
Options — domestic exchange-traded index and single name equity options contracts (including options on ETFs) are valued at the mean of the National Best Bid and Offer quotations as determined by the Options Price Reporting Authority. Foreign exchange-traded single name equity options contracts are valued at the most recent settlement price. Options contracts on foreign indices are priced at the most recent settlement price. Options on futures contracts are valued using the current settlement price on the exchange on which, over time, they are traded most extensively. Other exchange-traded options are valued at the average of the closing bid and ask quotations on the exchange on which, over time, they are traded most extensively. OTC currency options and swaptions are valued at mid prices (between the bid and ask prices) supplied by a third-party pricing service, if available. Other OTC option contracts (including currency options and swaptions not priced through a third-party pricing service) are valued based on prices obtained from broker-dealers. Valuations based on information from foreign markets may be subject to the Funds’ fair value policies described below.
|
|
●
|
Futures — most recent settlement price on the exchange on which the valuation designee believes that, over time, they are traded most extensively. Valuations based on information from foreign markets may be subject to the Funds’ fair value policies described below.
|
|
●
|
Forward Foreign Currency Contracts — interpolated rates determined based on information provided by a third-party pricing service.
|
|
●
|
Mutual Funds - net asset value.
|
|
●
|
The likelihood of payment—the capacity and willingness of the obligor to meet its financial commitments on an obligation in accordance with the terms of the obligation;
|
|
●
|
The nature and provisions of the financial obligation, and the promise we impute; and
|
|
●
|
The protection afforded by, and relative position of, the financial obligation in the event of a bankruptcy, reorganization, or other arrangement under the laws of bankruptcy and other laws affecting creditors’ rights.
|
|
●
|
Amortization schedule—the larger the final maturity relative to other maturities, the more likely it will be treated as a note; and
|
|
●
|
Source of payment—the more dependent the issue is on the market for its refinancing, the more likely it will be treated as a note.
|
|
●
|
Preliminary ratings may be assigned to obligations, most commonly structured and project finance issues, pending receipt of final documentation and legal opinions.
|
|
●
|
Preliminary ratings may be assigned to obligations that will likely be issued upon the obligor’s emergence from bankruptcy or similar reorganization, based on late-stage reorganization plans, documentation, and discussions with the obligor. Preliminary ratings may also be assigned to the obligors. These ratings consider the anticipated general credit quality of the reorganized or post-bankruptcy issuer as well as attributes of the anticipated obligation(s).
|
|
●
|
Preliminary ratings may be assigned to entities that are being formed or that are in the process of being independently established when, in S&P Global Ratings’ opinion, documentation is close to final. Preliminary ratings may also be assigned to the obligations of these entities.
|
|
●
|
Preliminary ratings may be assigned when a previously unrated entity is undergoing a well-formulated restructuring, recapitalization, significant financing, or other transformative event, generally at the point that investor or lender commitments are invited. The preliminary rating may be assigned to the entity and to its proposed obligation(s). These preliminary ratings consider the anticipated general credit quality of the obligor, as well as attributes of the anticipated obligation(s), assuming successful completion of the transformative event. Should the transformative event not occur, S&P Global Ratings would likely withdraw these preliminary ratings.
|
|
●
|
A preliminary recovery rating may be assigned to an obligation that has a preliminary issue credit rating.
|
| * | By their terms, hybrid securities allow for the omission of scheduled dividends, interest, or principal payments, which can potentially result in impairment if such an omission occurs. Hybrid securities may also be subject to contractually allowable write-downs of principal that could result in impairment. Together with the hybrid indicator, the long-term obligation rating assigned to a hybrid security is an expression of the relative credit risk associated with that security. |
|
●
|
The issuer has entered into a grace or cure period following non-payment of a material financial obligation;
|
|
●
|
The formal announcement by the issuer or their agent of a DDE; and
|
|
●
|
A closed financing vehicle where payment capacity is irrevocably impaired such that it is not expected to pay interest and/or principal in full during the life of the transaction, but where no payment default is imminent.
|
|
●
|
An uncured payment default or DDE on a bond, loan or other material financial obligation, but
|
|
●
|
Has not entered into bankruptcy filings, administration, receivership, liquidation, or other formal winding-up procedure, and
|
|
●
|
Has not otherwise ceased operating. This would include:
|
|
○
|
The selective payment default on a specific class or currency of debt;
|
|
○
|
The uncured expiry of any applicable original grace period, cure period or default forbearance period following a payment default on a bank loan, capital markets security or other material financial obligation.
|
|
●
|
The ratings do not predict a specific percentage of default likelihood or failure likelihood over any given time period.
|
|
●
|
The ratings do not opine on the market value of an issuer’s securities or stock, or the likelihood that this value may change.
|
|
●
|
The ratings do not opine on the liquidity of an issuer’s securities or stock.
|
|
●
|
Obligation ratings assigned on the Probability of Default Only scale do not opine on the possible loss severity on such obligation should an issuer (or an obligation with respect to structured finance transactions) default, except in limited circumstances for US public finance obligations where Chapter 9 of the Bankruptcy Code provides reliably superior prospects for ultimate recovery to local government obligations that benefit from a statutory lien on revenues or during the pendency of a bankruptcy proceeding under the Code if there is sufficient visibility on potential recovery prospects.
|
|
●
|
The ratings do not opine on the suitability of an issuer as a counterparty to trade credit.
|
|
●
|
The ratings do not opine on any quality related to an issuer’s business, operational or financial profile other than the agency’s opinion on its relative vulnerability to default or in the case of Viability Ratings (“VRs”) on its relative vulnerability to failure. For the avoidance of doubt, not all defaults will be considered a default for rating purposes. Typically, a default relates to a liability payable to an unaffiliated, outside investor.
|
|
●
|
The ratings do not opine on any quality related to a transaction’s profile other than the agency’s opinion on the relative vulnerability to default of an issuer and/or of each rated tranche or security.
|
|
●
|
The ratings do not predict a specific percentage of extraordinary support likelihood over any given period.
|
|
●
|
In the case of Government and Shareholder Support Ratings, the ratings do not opine on any quality related to an issuer’s business, operational or financial profile other than the agency’s opinion on its relative likelihood of receiving external extraordinary support.
|
|
●
|
The ratings do not opine on the suitability of any security for investment or any other purposes.
|
|
●
|
‘Matured’ – Denoted as ‘NR’. This action is used when an issue has reached its redemption date and rating coverage is discontinued. This indicates that a previously rated issue has been repaid, but other issues of the same program (rated or unrated) may remain outstanding. For the convenience of investors, Fitch may also include issues relating to a rated issuer or transaction that are not and have not been rated on its section of the web page relating to the respective issuer or transaction. Such issues will also be denoted ‘NR’.
|
|
●
|
‘Paid-In-Full’ – Denoted as ‘PIF’. This action indicates that an issue has been paid in full. In covered bonds, PIF is only used when all issues of a program have been repaid.
|
| * | A Rating Action or Review must be recorded for each rating in a required cycle to be considered compliant with Fitch policy concerning aging of ratings. Not all Rating Actions, Data Actions, or changes in rating modifiers, meet this requirement. Actions or Reviews that can meet this requirement are noted with an *. |
Registration Nos. 002-98326
811-04323
NATIXIS FUNDS TRUST I
PART C
OTHER INFORMATION
Item 28. Exhibits.
| (2) | Code of Ethics dated October 1, 2007, as amended January 2026 for Natixis Advisors and Natixis Distribution is filed herewith. | ||
| (3) | Code of Ethics dated January 14, 2000, as amended December 2025 for Loomis Sayles is filed herewith. | ||
| (4) | Code of Ethics dated September 30, 2005 as amended October 1, 2025 for Harris Associates is filed herewith. | ||
|
(5)
|
Code of Ethics dated May 20, 2008 as amended August 15, 2025 for Vaughan Nelson is incorporated by reference to exhibit (o)(5) to PEA No. 165 to the Registration Statement filed on January 27, 2026. | ||
| (6) | Code of Ethics dated December 15, 2022 as amended March 15, 2024 for Mirova US is incorporated by reference to exhibit (o)(6) to PEA No. 164 to the Registration Statement filed on April 29, 2025. | ||
| (p) | Powers of Attorney. | ||
| (1) |
|
Power of Attorney for Kevin P. Charleston, Edmond J. English, David L. Giunta, Richard A. Goglia, Marina Gross, Martin T. Meehan, Maureen B. Mitchell, James P. Palermo, Erik R. Sirri, Peter J. Smail, Kirk A. Sykes, and Cynthia L. Walker dated January 02, 2026, and effective January 02, 2026, designating Michael G. Doherty, Matthew J. Block, and Susan McWhan Tobin as attorneys to sign for each Trustee is incorporated by reference to exhibit (p)(1) to PEA No. 165 to the Registration Statement filed on January 27, 2026. |
| EX-101.INS | XBRL Instance Document - the instance document does not appear in the Interactive Data File because its XBRL tags are embedded within the inline XBRL |
| EX-101.SCH | XBRL Taxonomy Extension Schema Document |
| EX-101.CAL | XBRL Taxonomy Extension Calculation Linkbase |
| EX-101.DEF | XBRL Taxonomy Extension Definition Linkbase |
| EX-101.LAB | XBRL Taxonomy Extension Labels Linkbase |
| EX-101.PRE | XBRL Taxonomy Extension Presentation Linkbase |
Item 29. Persons Controlled by or Under Common Control with the Registrant.
The Registrant is not aware of any person controlled by or under common control with any of its series. As of April 1, 2026, no person owned 25% or more of the outstanding voting securities of one or more series of the Registrant and thus may be deemed to “control” the series within the meaning of section 2(a)(9) of the 1940 Act.
Item 30. Indemnification.
Under Article 5 of the Registrant’s By-laws, any past or present Trustee or officer of the Registrant (hereinafter referred to as a “Covered Person”) shall be indemnified to the fullest extent permitted by law against all liability and all expenses reasonably incurred by him or her in connection with any claim, action, suit or proceeding to which he or she may be a party or otherwise involved by reason of his or her being or having been a Covered Person. That provision does not authorize indemnification when it is determined that such Covered Person would otherwise be liable to the Registrant or its shareholders by reason of willful misfeasance, bad faith, gross negligence or reckless disregard of his or her duties. This description is modified in its entirety by the provision of Article 5 of the Registrant’s By-laws incorporated by reference to exhibit (b)(1) to PEA No. 76 to the Registration Statement filed on December 3, 2008.
The Distribution Agreement, the Custodian Agreement, the Transfer Agency and Service Agreement and the Administrative Services Agreement (the “Agreements”) contained herein and in various PEAs and incorporated herein by reference, provide for indemnification. The general effect of these provisions is to indemnify entities contracting with the Registrant against liability and expenses in certain circumstances. This description is modified in its entirety by the provisions of the Agreements as contained in this Registration Statement and incorporated herein by reference.
Insofar as indemnification for liabilities arising under the Securities Act of 1933, as amended (the “Securities Act”), may be permitted to Trustees, officers and controlling persons of the Registrant pursuant to the foregoing provisions or otherwise, the Registrant has been advised that in the opinion of the Securities and Exchange Commission such indemnification is against public policy as expressed in the Securities Act and is, therefore, unenforceable. In the event that a claim for indemnification against such liabilities (other than the payment by the Registrant of expenses incurred or paid by a Trustee, officer or controlling person of the Registrant in connection with the successful defense of any claim, action, suit or proceeding) is asserted against the Registrant by such Trustee, officer or controlling person in connection with the shares being registered, the Registrant will, unless in the opinion of its counsel the matter has been settled by controlling precedent, submit to a court of appropriate jurisdiction the question whether such indemnification by it is against public policy as expressed in the Securities Act and will be governed by the final adjudication of such issue.
The Registrant and its Trustees, officers and employees are insured, under a policy of insurance maintained by the Registrant in conjunction with Natixis Investment Managers, LLC and its affiliates, within the limits and subject to the limitations of the policy, against certain expenses in connection with the defense of actions, suits or proceedings, and certain liabilities that might be imposed as a result of such actions, suits or proceedings, to which they are parties by reason of being or having been such Trustees or officers. The policy expressly excludes coverage for any
Trustee or officer for any claim arising out of any fraudulent act or omission, any dishonest act or omission or any criminal act or omission of the Trustee or officer.
Item 31. Business and Other Connections of Investment Adviser.
| (a) | Natixis Advisors, a wholly owned subsidiary Natixis Investment Managers, LLC, serves as investment adviser to the Registrant’s Natixis Oakmark International Fund, Natixis U.S. Equity Opportunities Fund and Vaughan Nelson Small Cap Value Fund. Natixis Advisors was organized in 1995. |
| The list required by this Item 31 regarding any other business, profession, vocation or employment of a substantial nature engaged in by officers and partners of Natixis Advisors during the past two years is incorporated herein by reference to schedules A, C and D of Form ADV filed by Natixis Advisors pursuant to the Investment Advisers Act of 1940, as amended (the “Advisers Act”) (SEC File No. 801-48408; IARD/CRD No. 106800). | |
| (b) | Loomis Sayles, adviser of the Registrant’s Loomis Sayles Core Plus Bond Fund and subadviser of the Registrant’s Natixis U.S. Equity Opportunities Fund, provides investment advice to a number of other registered investment companies and to other organizations and individuals. |
| The list required by this Item 31 regarding any other business, profession, vocation or employment of a substantial nature engaged in by officers and partners of Loomis Sayles during the past two years is incorporated herein by reference to schedules A, C and D of Form ADV filed by Loomis Sayles pursuant to the Advisers Act (SEC File No. 801-170; IARD/CRD No. 105377). | |
| (c) | Harris Associates serves as a subadviser to the Registrant’s Natixis U.S. Equity Opportunities Fund and Natixis Oakmark International Fund. Harris Associates serves as investment adviser to mutual funds, individuals, trusts, retirement plans, endowments and foundations, and manages several private partnerships, and is a registered commodity trading adviser and commodity pool operator. |
| The list required by this Item 31 regarding any other business, profession, vocation or employment of a substantial nature engaged in by officers and partners of Harris Associates during the past two years is incorporated herein by reference to schedules A, C and D of Form ADV filed by Harris Associates pursuant to the Advisers Act (SEC File No. 801-50333; IARD/CRD No. 106960). | |
| (d) | Vaughan Nelson serves as a subadviser to the Registrant’s Vaughan Nelson Small Cap Value Fund, provides investment advice to a number of other registered investment companies and to other organizations and individuals. |
|
|
The list required by this Item 31 regarding any other business, profession, vocation or employment of a substantial nature engaged in by officers and partners of |
|
|
Vaughan Nelson during the past two years is incorporated herein by reference to schedules A, C and D of Form ADV filed by Vaughan Nelson pursuant to the Advisers Act (File No. 801-51795; IARD/CRD No. 106975). |
| (e) |
Mirova US, serves as investment adviser to the Registrant’s Mirova Global Sustainable Equity Fund, Mirova International Sustainable Equity Fund, and Mirova Global Green Bond Fund and provides investment advice to a number of other organizations and individuals.
The list required by this Item 31 regarding any other business, profession, vocation or employment of a substantial nature engaged in by officers and partners of Mirova US during the past two years is incorporated herein by reference to schedules A, C, and D of Form ADV filed by Mirova US pursuant to the Advisers Act (SEC file No. 801-114631; IARD/ CRD no. 300152). |
Item 32. Principal Underwriter.
| (a) | Natixis Distribution, LLC, the principal underwriter of the Registrant, also serves as principal underwriter for: |
Natixis Funds Trust II
Natixis Funds Trust IV
Loomis Sayles Funds I
Loomis Sayles Funds II
Gateway Trust
Investment Managers Series Trust
Loomis Sayles Credit Income Opportunities Fund
| (b) | The officers of the Registrant’s principal underwriter, Natixis Distribution, LLC, and their addresses are as follows: |
| Name | Positions
and Offices with Principal Underwriter |
Positions
and Offices with the Registrant |
| David L. Giunta | President and Chief Executive Officer, Natixis Investment Managers, U.S. | President and Chief Executive Officer |
| Susan McWhan Tobin | Executive Vice President, General Counsel | Secretary and Chief Legal Officer, Chief Compliance Officer and Anti-Money Laundering Officer |
| Name | Positions
and Offices with Principal Underwriter |
Positions
and Offices with the Registrant |
| Matthew J. Block | Senior Vice President | Treasurer, Principal Financial and Accounting Officer |
| Warren Besser | Executive Vice President, Treasurer and Chief Financial Officer | None |
| Molly Gorman | Senior Vice President, Deputy General Counsel, Secretary and Clerk | None |
| Anthony Loureiro | Senior Vice President, Chief Compliance Officer – Broker-Dealer, and Anti-Money Laundering Compliance Officer | None |
| Marilyn Rosh | Senior Vice President and Controller |
None
|
| Sara Kaufman | Vice President and Assistant Controller | None |
| Marina Gross | Executive Vice President and Head of Natixis Investment Managers Solutions | None |
| Cate McManus | Senior Vice President and Director of Operations | None |
| David Vallon | Senior Vice President and Chief Compliance Officer – Advisor | None |
| Matthew Coldren | Executive Vice President | None |
| James Cove | Executive Vice President | None |
| Abhijeet Dalvi | Executive Vice President | None |
| Kenneth Herold | Executive Vice President | None |
| Robert Hussey | Executive Vice President | None |
| Liana Magner | Executive Vice President | None |
| Susan St. Germain | Executive Vice President | None |
| Name | Positions
and Offices with Principal Underwriter |
Positions
and Offices with the Registrant |
| Bonnie Bate | Senior Vice President | None |
| Graham Brewster | Senior Vice President | None |
| Mark Cintolo | Senior Vice President | None |
| Jeff Clough | Senior Vice President | None |
| James Dolan | Senior Vice President | None |
| Matthew Doucette | Senior Vice President | None |
| Tracy F. Duffy | Senior Vice President | None |
| Dineen Dusablon | Senior Vice President | None |
| Nick Elward | Senior Vice President | None |
| Gregory Fecteau | Senior Vice President | None |
| Matt Garzone | Senior Vice President | None |
| Alaina Giampapa | Senior Vice President | None |
| John Janasiewicz | Senior Vice President | None |
| Jeff Keselman | Senior Vice President | None |
| Mike Kroupa | Senior Vice President | None |
| Joseph Labresh | Senior Vice President | None |
| Karyn Lee | Senior Vice President | None |
| Robert Lyons | Senior Vice President | None |
| Neil Martin | Senior Vice President | None |
| Dianne Masel | Senior Vice President | None |
| Mark Mason | Senior Vice President | None |
| Brian O’Mara | Senior Vice President | None |
| Paige Skilling | Senior Vice President | None |
| Name | Positions
and Offices with Principal Underwriter |
Positions
and Offices with the Registrant |
| Meghan Peachey | Senior Vice President | None |
| Rebecca Poulin | Senior Vice President | None |
| Jennifer Round | Senior Vice President | None |
| Steven Schedin | Senior Vice President | None |
| Manav Sehgal | Senior Vice President | None |
| Christopher Sharpe | Senior Vice President | None |
| Jebb Tether | Senior Vice President | None |
| Jay Wightman | Senior Vice President | None |
| Michael Yip | Senior Vice President | None |
| Kevin Finney | Managing Director | None |
| Pat Fitzsimons | Managing Director | None |
| Robert Hinckle | Managing Director | None |
| Christopher Hunter | Managing Director | None |
| Daniel Lynch | Managing Director | None |
| Ian MacDuff | Managing Director | None |
| Kent Mappin | Managing Director | None |
| Shawn McClain | Managing Director | None |
| Ryan McNeill | Managing Director | None |
| Mike Muti | Managing Director | None |
| Chuck Nanick | Managing Director | None |
| Bill Slimbaugh | Managing Director | None |
The principal business address of all the above persons or entities is 888 Boylston Street, Boston, Massachusetts 02199-8197.
| (c) | Not Applicable. |
Item 33. Location of Accounts and Records.
The following companies, in the aggregate, maintain possession of the documents required to be maintained by Section 31(a) of the 1940 Act and the rules thereunder:
| (a) | For all series of Registrant: | |
|
(i) Natixis Funds Trust I 888 Boylston Street Boston, MA 02199-8197 | ||
|
(ii) Natixis Distribution, LLC 888 Boylston Street Boston, Massachusetts 02199-8197 | ||
|
(iii) Natixis Advisors, LLC 888 Boylston Street Boston, Massachusetts 02199-8197 (excluding Loomis Sayles Core Plus Bond Fund) | ||
|
(iv) State Street Bank and Trust Company One Congress Street, Suite 1 Boston, Massachusetts 02114-2016 | ||
|
(v) SS&C Global Investor & Distribution Solutions, Inc. 30 Braintree Hill Office Park, Suite 400 Braintree, MA 02184 | ||
| (b) |
For the series of the Registrant managed by Harris Associates: Harris Associates L. P. 111 S. Wacker Drive, Suite 4600 Chicago, Illinois 60606 | |
| (c) |
For the series of the Registrant managed by Loomis Sayles: Loomis, Sayles & Company, L.P. One Financial Center Boston, Massachusetts 02111 | |
| (d) |
For the series of the Registrant managed by Vaughan Nelson: Vaughan Nelson Investment Management, L.P. 600 Travis Street, Suite 3800 Houston, Texas 77002 |
| (e) |
For the series of the Registrant managed by Mirova US: Mirova US, LLC 888 Boylston Street Boston, Massachusetts 02199-8197 |
Item 34. Management Services.
None.
Item 35. Undertakings.
The Registrant undertakes to provide a copy of the annual report of any of its series to any person who receives a prospectus for such series and who requests the annual report.
NATIXIS FUNDS TRUST I
SIGNATURES
Pursuant to the requirements of the Securities Act of 1933, as amended, and the Investment Company Act of 1940, as amended, the Registrant certifies that it meets all of the requirements for effectiveness of this Post-Effective Amendment to its Registration Statement under Rule 485(b) under the Securities Act of 1933, as amended, and has duly caused this Post-Effective Amendment to its Registration Statement to be signed on its behalf by the undersigned, duly authorized, in the City of Boston, and the Commonwealth of Massachusetts on the 29th day of April, 2026.
| NATIXIS FUNDS TRUST I | ||
| By: | /s/ David L. Giunta | |
| David L. Giunta | ||
| President and Chief Executive Officer | ||
Pursuant to the requirements of the Securities Act of 1933, as amended, this amendment to the Registration Statement has been signed below by the following persons in the capacities and on the date indicated.
|
Signature |
Title | Date | |
| /s/ David L. Giunta | |||
| David L. Giunta | President, Chief Executive Officer and Trustee | April 29, 2026 | |
| /s/ Matthew J. Block | |||
| Matthew J. Block | Treasurer, Principal Financial and Accounting Officer | April 29, 2026 | |
| Kevin P. Charleston* | |||
| Kevin P. Charleston | Trustee | April 29, 2026 | |
| Edmond J. English* | |||
| Edmond J. English | Trustee | April 29, 2026 | |
| Marina Gross* | |||
| Marina Gross | Trustee | April 29, 2026 | |
| Richard A. Goglia* | |||
| Richard A. Goglia | Trustee | April 29, 2026 | |
| Martin T. Meehan* | |||
| Martin T. Meehan | Trustee | April 29, 2026 | |
| Maureen B. Mitchell* | |||
|
Maureen B. Mitchell
|
Trustee | April 29, 2026 | |
| James P. Palermo* | |||
| James P. Palermo | Trustee | April 29, 2026 |
| Erik R. Sirri* | |||
| Erik R. Sirri | Trustee, Chairperson of the Board | April 29, 2026 | |
| Peter J. Smail* | |||
| Peter J. Smail | Trustee | April 29, 2026 | |
| Kirk A. Sykes* | |||
| Kirk A. Sykes | Trustee | April 29, 2026 | |
| Cynthia L. Walker* | |||
| Cynthia L. Walker | Trustee | April 29, 2026 |
| *By: | /s/ Susan McWhan Tobin | |
| Susan McWhan Tobin | ||
| Attorney-In-Fact 1 | ||
| April 29, 2026 |
| 1 | Power of Attorney for Kevin P. Charleston, Edmond J. English, David L. Giunta, Richard A. Goglia, Marina Gross, Martin T. Meehan, Maureen B. Mitchell, James P. Palermo, Erik R. Sirri, Peter J. Smail, Kirk A. Sykes, and Cynthia L. Walker dated January 02, 2026 and effective January 02, 2026, designating Michael G. Doherty, Matthew J. Block and Susan McWhan Tobin as attorneys to sign for each Trustee is incorporated by reference to exhibit (p)(1) to PEA No. 165 to the Registration Statement filed on January 27, 2026. |