United States Securities
and Exchange Commission
Washington, D.C. 20549
Form
Certified Shareholder Report
of Registered Management Investment Companies
811-4539
(Investment Company Act File Number)
(Exact Name of Registrant as Specified in Charter)
Federated Hermes Funds
4000 Ericsson
Drive
Warrendale, PA 15086-7561
(Address of Principal Executive Offices)
(412) 288-1900
(Registrant’s Telephone
Number)
Peter J. Germain, Esquire
1001 Liberty
Avenue
Pittsburgh, Pennsylvania 15222-3779
(Name and Address of Agent for Service)
(Notices should be sent to the Agent
for Service)
Date of Fiscal Year End: 2026-08-31
Date of Reporting Period: Six
months ended
| Item 1. | Reports to Stockholders |

| Item 2. | Code of Ethics |
Not Applicable
| Item 3. | Audit Committee Financial Expert |
Not Applicable
| Item 4. | Principal Accountant Fees and Services |
Not Applicable
| Item 5. | Audit Committee of Listed Registrants |
Not Applicable
| Item 6. | Schedule of Investments |
(a) The registrant’s Schedule of Investments is included as part of the Financial Statements filed under Item 7 of this form.
(b) Not Applicable
| Item 7. | Financial Statements and Financial Highlights for Open-End Management Companies |
and Additional Information

|
Share
Class | Ticker
|
A | FEUGX
|
Institutional | FEUNX
|
|
|
Federated Hermes Adjustable Rate Fund
A Portfolio of Federated Hermes Adjustable Rate Securities Trust
|
Principal
Amount
or
Shares |
|
|
Value
|
|
|
1
|
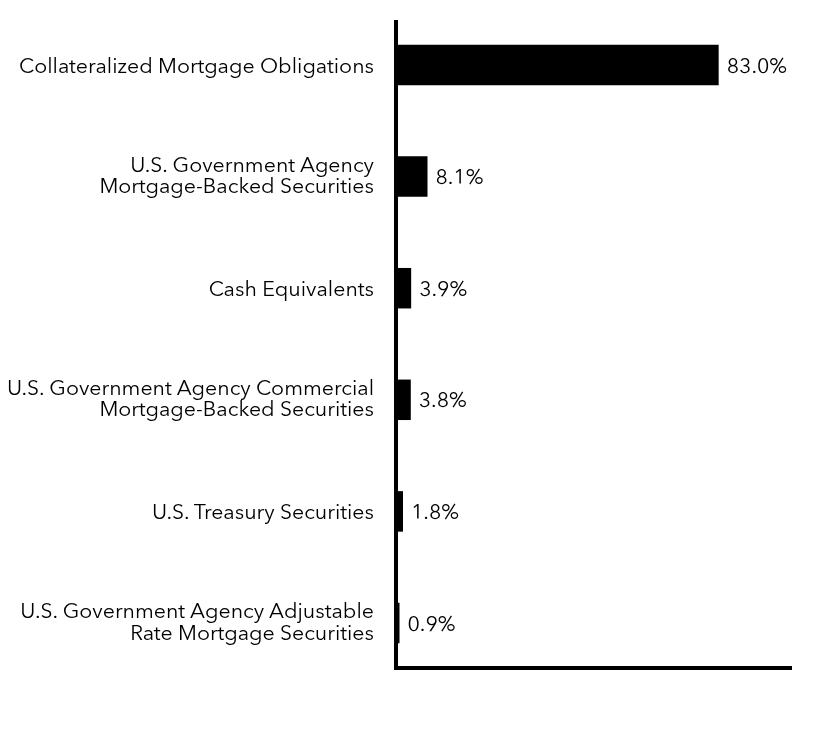
COLLATERALIZED
MORTGAGE OBLIGATIONS—83.0% |
|
|
|
|
Federal
Home Loan Mortgage Corporation—31.1% |
|
|
$ 28,975
|
|
REMIC,
Series 2380, Class FL, 4.372% (30-DAY AVERAGE SOFR +0.714%), 11/15/2031 |
$ 29,029
|
|
48,512
|
|
REMIC,
Series 2434, Class FA, 4.772% (30-DAY AVERAGE SOFR +1.114%), 3/15/2032 |
48,946
|
|
20,061
|
|
REMIC,
Series 2448, Class FA, 4.772% (30-DAY AVERAGE SOFR +1.114%), 1/15/2032 |
20,256
|
|
21,225
|
|
REMIC,
Series 2452, Class FC, 4.772% (30-DAY AVERAGE SOFR +1.114%), 1/15/2032 |
21,432
|
|
58,426
|
|
REMIC,
Series 2459, Class FP, 4.772% (30-DAY AVERAGE SOFR +1.114%), 6/15/2032 |
58,999
|
|
15,247
|
|
REMIC,
Series 2470, Class EF, 4.772% (30-DAY AVERAGE SOFR +1.114%), 3/15/2032 |
15,383
|
|
69,781
|
|
REMIC,
Series 2475, Class F, 4.772% (30-DAY AVERAGE SOFR +1.114%), 2/15/2032 |
70,396
|
|
43,007
|
|
REMIC,
Series 2475, Class FD, 4.322% (30-DAY AVERAGE SOFR +0.664%), 6/15/2031 |
43,115
|
|
43,918
|
|
REMIC,
Series 2480, Class NF, 4.772% (30-DAY AVERAGE SOFR +1.114%), 1/15/2032 |
44,306
|
|
15,013
|
|
REMIC,
Series 2498, Class AF, 4.772% (30-DAY AVERAGE SOFR +1.114%), 3/15/2032 |
15,147
|
|
71,986
|
|
REMIC,
Series 3085, Class UF, 4.222% (30-DAY AVERAGE SOFR +0.564%), 12/15/2035 |
71,921
|
|
150,406
|
|
REMIC,
Series 3156, Class HF, 4.257% (30-DAY AVERAGE SOFR +0.599%), 8/15/2035 |
150,052
|
|
254,157
|
|
REMIC,
Series 3208, Class FD, 4.172% (30-DAY AVERAGE SOFR +0.514%), 8/15/2036 |
253,464
|
|
247,288
|
|
REMIC,
Series 3208, Class FG, 4.172% (30-DAY AVERAGE SOFR +0.514%), 8/15/2036 |
246,614
|
|
61,031
|
|
REMIC,
Series 3213, Class GF, 4.202% (30-DAY AVERAGE SOFR +0.544%), 9/15/2036 |
60,871
|
|
344,503
|
|
REMIC,
Series 3284, Class AF, 4.082% (30-DAY AVERAGE SOFR +0.424%), 3/15/2037 |
341,791
|
|
538,481
|
|
REMIC,
Series 3314, Class FE, 4.042% (30-DAY AVERAGE SOFR +0.384%), 5/15/2037 |
533,173
|
|
397,514
|
|
REMIC,
Series 3346, Class FT, 4.122% (30-DAY AVERAGE SOFR +0.464%), 10/15/2033 |
396,236
|
|
161,421
|
|
REMIC,
Series 3380, Class FP, 4.122% (30-DAY AVERAGE SOFR +0.464%), 11/15/2036 |
160,442
|
|
194,013
|
|
REMIC,
Series 3550, Class GF, 4.522% (30-DAY AVERAGE SOFR +0.864%), 7/15/2039 |
195,535
|
|
231,608
|
|
REMIC,
Series 3556, Class FA, 4.682% (30-DAY AVERAGE SOFR +1.024%), 7/15/2037 |
234,573
|
|
105,365
|
|
REMIC,
Series 3593, Class CF, 4.372% (30-DAY AVERAGE SOFR +0.714%), 2/15/2036 |
105,539
|
|
3,353,648
|
|
REMIC,
Series 4056, Class FL, 4.222% (30-DAY AVERAGE SOFR +0.564%), 5/15/2042 |
3,342,163
|
|
2,135,664
|
|
REMIC,
Series 4077, Class HF, 4.172% (30-DAY AVERAGE SOFR +0.514%), 7/15/2042 |
2,116,177
|
|
825,285
|
|
REMIC,
Series 4242, Class F, 4.172% (30-DAY AVERAGE SOFR +0.514%), 8/15/2043 |
820,731
|
|
2,576,938
|
|
REMIC,
Series 4255, Class KF, 4.222% (30-DAY AVERAGE SOFR +0.564%), 10/15/2043 |
2,559,563
|
|
2,678,960
|
|
REMIC,
Series 4315, Class KF, 4.222% (30-DAY AVERAGE SOFR +0.564%), 8/15/2041 |
2,658,851
|
|
1,209,583
|
|
REMIC,
Series 4407, Class CF, 4.072% (30-DAY AVERAGE SOFR +0.414%), 6/15/2044 |
1,199,309
|
|
1,174,420
|
|
REMIC,
Series 4508, Class CF, 4.172% (30-DAY AVERAGE SOFR +0.514%), 9/15/2045 |
1,167,669
|
|
2,707,226
|
|
REMIC,
Series 4614, Class FG, 4.272% (30-DAY AVERAGE SOFR +0.614%), 9/15/2046 |
2,692,875
|
|
2,135,657
|
|
REMIC,
Series 4619, Class NF, 4.172% (30-DAY AVERAGE SOFR +0.514%), 3/15/2044 |
2,125,916
|
|
2,150,197
|
|
REMIC,
Series 4661, Class GF, 4.222% (30-DAY AVERAGE SOFR +0.564%), 2/15/2047 |
2,136,736
|
|
1,279,913
|
|
REMIC,
Series 4752, Class PF, 4.072% (30-DAY AVERAGE SOFR +0.414%), 11/15/2047 |
1,260,292
|
|
3,195,777
|
|
REMIC,
Series 4803, Class FA, 4.072% (30-DAY AVERAGE SOFR +0.414%), 6/15/2048 |
3,133,383
|
|
436,557
|
|
REMIC,
Series 4829, Class FA, 4.022% (30-DAY AVERAGE SOFR +0.364%), 7/15/2037 |
431,697
|
|
940,575
|
|
REMIC,
Series 4845, Class WF, 4.072% (30-DAY AVERAGE SOFR +0.414%), 12/15/2048 |
931,943
|
|
1,522,843
|
|
REMIC,
Series 4846, Class PF, 4.122% (30-DAY AVERAGE SOFR +0.464%), 12/15/2048 |
1,502,052
|
|
3,004,493
|
|
REMIC,
Series 4911, Class FB, 4.231% (30-DAY AVERAGE SOFR +0.564%), 9/25/2049 |
2,977,284
|
|
804,755
|
|
REMIC,
Series 4915, Class FG, 4.231% (30-DAY AVERAGE SOFR +0.564%), 9/25/2049 |
797,034
|
|
695,381
|
|
REMIC,
Series 4921, Class FN, 4.231% (30-DAY AVERAGE SOFR +0.564%), 10/25/2049 |
683,676
|
|
5,021,263
|
|
REMIC,
Series 4929, Class FB, 4.231% (30-DAY AVERAGE SOFR +0.564%), 9/25/2049 |
4,972,267
|
|
4,369,179
|
|
REMIC,
Series 4944, Class F, 4.231% (30-DAY AVERAGE SOFR +0.564%), 1/25/2050 |
4,348,377
|
|
430,502
|
|
REMIC,
Series 4959, Class JF, 4.231% (30-DAY AVERAGE SOFR +0.564%), 3/25/2050 |
426,223
|
|
5,886,493
|
|
REMIC,
Series 4983, Class FJ, 4.231% (30-DAY AVERAGE SOFR +0.564%), 6/25/2050 |
5,776,112
|
|
3,242,472
|
|
REMIC,
Series 4988, Class KF, 4.131% (30-DAY AVERAGE SOFR +0.464%), 7/25/2050 |
3,216,530
|
|
1,877,982
|
|
REMIC,
Series 4998, Class KF, 4.017% (30-DAY AVERAGE SOFR +0.350%), 8/25/2050 |
1,831,693
|
|
4,294,033
|
|
REMIC,
Series 5269, Class FL, 4.487% (30-DAY AVERAGE SOFR +0.820%), 10/25/2052 |
4,285,937
|
|
Principal
Amount
or
Shares |
|
|
Value
|
|
|
1
|
COLLATERALIZED
MORTGAGE OBLIGATIONS—continued
|
|
|
|
|
Federal
Home Loan Mortgage Corporation—continued |
|
|
$ 9,401,394
|
|
REMIC,
Series 5296, Class KF, 4.417% (30-DAY AVERAGE SOFR +0.750%), 3/25/2053 |
$ 9,407,915
|
|
5,211,620
|
|
REMIC,
Series 5338, Class FH, 4.072% (30-DAY AVERAGE SOFR +0.414%), 4/15/2045 |
5,168,488
|
|
1,943,747
|
|
REMIC,
Series 5342, Class FB, 4.231% (30-DAY AVERAGE SOFR +0.564%), 11/25/2049 |
1,915,072
|
|
4,068,924
|
|
REMIC,
Series 5393, Class HF, 4.617% (30-DAY AVERAGE SOFR +0.950%), 3/25/2054 |
4,095,685
|
|
842,074
|
|
REMIC,
Series 5400, Class FA, 4.417% (30-DAY AVERAGE SOFR +0.750%), 4/25/2054 |
841,744
|
|
4,297,659
|
|
REMIC,
Series 5457, Class GF, 4.767% (30-DAY AVERAGE SOFR +1.100%), 10/25/2054 |
4,317,126
|
|
5,591,028
|
|
REMIC,
Series 5466, Class FL, 4.617% (30-DAY AVERAGE SOFR +0.950%), 2/25/2054 |
5,609,062
|
|
6,324,022
|
|
REMIC,
Series 5476, Class FA, 4.767% (30-DAY AVERAGE SOFR +1.100%), 11/25/2054 |
6,353,789
|
|
3,641,068
|
|
REMIC,
Series 5499, Class BF, 4.567% (30-DAY AVERAGE SOFR +0.900%), 2/25/2055 |
3,644,065
|
|
5,423,227
|
|
REMIC,
Series 5508, Class FM, 4.817% (30-DAY AVERAGE SOFR +1.150%), 2/25/2055 |
5,460,927
|
|
7,389,988
|
|
REMIC,
Series 5522, Class BF, 4.717% (30-DAY AVERAGE SOFR +1.050%), 3/25/2055 |
7,425,655
|
|
6,975,288
|
|
REMIC,
Series 5633, Class FH, 4.417% (30-DAY AVERAGE SOFR +0.750%), 2/25/2056 |
6,983,132
|
|
|
|
TOTAL
|
121,734,370
|
|
|
|
Federal
National Mortgage Association—33.9% |
|
|
29,117
|
|
REMIC,
Series 2001-32, Class FA, 4.331% (30-DAY AVERAGE SOFR +0.664%), 7/25/2031 |
29,157
|
|
21,543
|
|
REMIC,
Series 2001-57, Class FA, 4.231% (30-DAY AVERAGE SOFR +0.564%), 6/25/2031 |
21,487
|
|
17,294
|
|
REMIC,
Series 2001-62, Class FC, 4.431% (30-DAY AVERAGE SOFR +0.764%), 11/25/2031 |
17,364
|
|
22,725
|
|
REMIC,
Series 2001-71, Class FS, 4.381% (30-DAY AVERAGE SOFR +0.714%), 11/25/2031 |
22,798
|
|
73,604
|
|
REMIC,
Series 2002-7, Class FG, 4.681% (30-DAY AVERAGE SOFR +1.014%), 1/25/2032 |
74,084
|
|
38,189
|
|
REMIC,
Series 2002-8, Class FA, 4.522% (30-DAY AVERAGE SOFR +0.864%), 3/18/2032 |
38,453
|
|
42,741
|
|
REMIC,
Series 2002-52, Class FG, 4.281% (30-DAY AVERAGE SOFR +0.614%), 9/25/2032 |
42,833
|
|
126,904
|
|
REMIC,
Series 2002-58, Class FG, 4.781% (30-DAY AVERAGE SOFR +1.114%), 8/25/2032 |
128,091
|
|
20,622
|
|
REMIC,
Series 2002-60, Class FH, 4.781% (30-DAY AVERAGE SOFR +1.114%), 8/25/2032 |
20,815
|
|
41,044
|
|
REMIC,
Series 2002-77, Class FA, 4.772% (30-DAY AVERAGE SOFR +1.114%), 12/18/2032 |
41,421
|
|
15,126
|
|
REMIC,
Series 2002-77, Class FG, 4.322% (30-DAY AVERAGE SOFR +0.664%), 12/18/2032 |
15,158
|
|
31,515
|
|
REMIC,
Series 2005-67, Class FM, 4.131% (30-DAY AVERAGE SOFR +0.464%), 8/25/2035 |
31,504
|
|
1,039,048
|
|
REMIC,
Series 2005-95, Class FH, 4.081% (30-DAY AVERAGE SOFR +0.414%), 11/25/2035 |
1,032,729
|
|
51,567
|
|
REMIC,
Series 2006-11, Class FB, 4.081% (30-DAY AVERAGE SOFR +0.414%), 3/25/2036 |
51,501
|
|
1,444,728
|
|
REMIC,
Series 2006-42, Class CF, 4.231% (30-DAY AVERAGE SOFR +0.564%), 6/25/2036 |
1,440,929
|
|
741,403
|
|
REMIC,
Series 2006-50, Class FE, 4.181% (30-DAY AVERAGE SOFR +0.514%), 6/25/2036 |
740,013
|
|
261,052
|
|
REMIC,
Series 2006-65, Class DF, 4.131% (30-DAY AVERAGE SOFR +0.464%), 7/25/2036 |
259,868
|
|
104,543
|
|
REMIC,
Series 2006-76, Class QF, 4.181% (30-DAY AVERAGE SOFR +0.514%), 8/25/2036 |
104,195
|
|
655,472
|
|
REMIC,
Series 2006-81, Class FA, 4.131% (30-DAY AVERAGE SOFR +0.464%), 9/25/2036 |
652,577
|
|
353,219
|
|
REMIC,
Series 2006-85, Class PF, 4.161% (30-DAY AVERAGE SOFR +0.494%), 9/25/2036 |
352,369
|
|
303,289
|
|
REMIC,
Series 2006-103, Class FB, 4.181% (30-DAY AVERAGE SOFR +0.514%), 10/25/2036 |
301,957
|
|
605,185
|
|
REMIC,
Series 2006-123, Class CF, 4.041% (30-DAY AVERAGE SOFR +0.374%), 1/25/2037 |
599,782
|
|
800,491
|
|
REMIC,
Series 2006-W1, Class 2AF1, 4.001% (30-DAY AVERAGE SOFR +0.334%), 2/25/2046 |
793,829
|
|
1,179,658
|
|
REMIC,
Series 2007-15, Class CF, 4.151% (30-DAY AVERAGE SOFR +0.484%), 3/25/2037 |
1,172,859
|
|
50,480
|
|
REMIC,
Series 2007-20, Class F, 4.041% (30-DAY AVERAGE SOFR +0.374%), 3/25/2037 |
50,179
|
|
580,637
|
|
REMIC,
Series 2007-71, Class WF, 4.231% (30-DAY AVERAGE SOFR +0.564%), 7/25/2037 |
579,968
|
|
138,234
|
|
REMIC,
Series 2007-88, Class FW, 4.331% (30-DAY AVERAGE SOFR +0.664%), 9/25/2037 |
137,503
|
|
35,577
|
|
REMIC,
Series 2007-102, Class FA, 4.351% (30-DAY AVERAGE SOFR +0.684%), 11/25/2037 |
35,664
|
|
156,655
|
|
REMIC,
Series 2008-69, Class FB, 4.781% (30-DAY AVERAGE SOFR +1.114%), 6/25/2037 |
158,941
|
|
20,750
|
|
REMIC,
Series 2008-75, Class DF, 5.031% (30-DAY AVERAGE SOFR +1.364%), 9/25/2038 |
21,239
|
|
265,143
|
|
REMIC,
Series 2009-78, Class UF, 4.551% (30-DAY AVERAGE SOFR +0.884%), 10/25/2039 |
267,179
|
|
356,494
|
|
REMIC,
Series 2009-87, Class FX, 4.531% (30-DAY AVERAGE SOFR +0.864%), 11/25/2039 |
358,923
|
|
483,319
|
|
REMIC,
Series 2009-87, Class HF, 4.631% (30-DAY AVERAGE SOFR +0.964%), 11/25/2039 |
488,439
|
|
603,703
|
|
REMIC,
Series 2009-106, Class FN, 4.531% (30-DAY AVERAGE SOFR +0.864%), 1/25/2040 |
608,718
|
|
210,783
|
|
REMIC,
Series 2010-39, Class EF, 4.301% (30-DAY AVERAGE SOFR +0.634%), 6/25/2037 |
210,628
|
|
1,375,064
|
|
REMIC,
Series 2010-68, Class BF, 4.281% (30-DAY AVERAGE SOFR +0.614%), 7/25/2040 |
1,373,162
|
|
Principal
Amount
or
Shares |
|
|
Value
|
|
|
1
|
COLLATERALIZED
MORTGAGE OBLIGATIONS—continued
|
|
|
|
|
Federal
National Mortgage Association—continued |
|
|
$ 607,429
|
|
REMIC,
Series 2011-4, Class PF, 4.331% (30-DAY AVERAGE SOFR +0.664%), 2/25/2041 |
$ 607,860
|
|
1,325,515
|
|
REMIC,
Series 2011-101, Class FH, 4.281% (30-DAY AVERAGE SOFR +0.614%), 10/25/2041 |
1,322,957
|
|
6,855,253
|
|
REMIC,
Series 2011-131, Class FT, 4.241% (30-DAY AVERAGE SOFR +0.574%), 12/25/2041 |
6,844,271
|
|
253,088
|
|
REMIC,
Series 2012-65, Class FB, 4.301% (30-DAY AVERAGE SOFR +0.634%), 6/25/2042 |
252,801
|
|
710,163
|
|
REMIC,
Series 2012-122, Class LF, 4.181% (30-DAY AVERAGE SOFR +0.514%), 11/25/2042 |
704,020
|
|
1,044,121
|
|
REMIC,
Series 2012-130, Class DF, 4.181% (30-DAY AVERAGE SOFR +0.514%), 12/25/2042 |
1,030,966
|
|
3,297,637
|
|
REMIC,
Series 2013-28, Class YF, 4.131% (30-DAY AVERAGE SOFR +0.464%), 7/25/2042 |
3,274,815
|
|
1,035,265
|
|
REMIC,
Series 2014-20, Class FB, 4.181% (30-DAY AVERAGE SOFR +0.514%), 4/25/2044 |
1,028,498
|
|
3,938,629
|
|
REMIC,
Series 2014-38, Class F, 4.181% (30-DAY AVERAGE SOFR +0.514%), 7/25/2044 |
3,901,924
|
|
2,776,648
|
|
REMIC,
Series 2016-11, Class CF, 4.131% (30-DAY AVERAGE SOFR +0.464%), 3/25/2046 |
2,766,778
|
|
3,392,109
|
|
REMIC,
Series 2016-25, Class FL, 4.281% (30-DAY AVERAGE SOFR +0.614%), 5/25/2046 |
3,374,048
|
|
590,465
|
|
REMIC,
Series 2016-32, Class FA, 4.181% (30-DAY AVERAGE SOFR +0.514%), 10/25/2034 |
589,333
|
|
3,070,356
|
|
REMIC,
Series 2016-57, Class FN, 4.231% (30-DAY AVERAGE SOFR +0.564%), 6/25/2046 |
3,047,311
|
|
617,768
|
|
REMIC,
Series 2016-83, Class FA, 4.281% (30-DAY AVERAGE SOFR +0.614%), 11/25/2046 |
613,163
|
|
849,736
|
|
REMIC,
Series 2017-30, Class FA, 4.131% (30-DAY AVERAGE SOFR +0.464%), 5/25/2047 |
839,157
|
|
496,499
|
|
REMIC,
Series 2017-96, Class FA, 4.181% (30-DAY AVERAGE SOFR +0.514%), 12/25/2057 |
486,515
|
|
1,299,989
|
|
REMIC,
Series 2018-15, Class JF, 4.081% (30-DAY AVERAGE SOFR +0.414%), 3/25/2048 |
1,274,664
|
|
3,291,281
|
|
REMIC,
Series 2018-57, Class FL, 4.081% (30-DAY AVERAGE SOFR +0.414%), 8/25/2048 |
3,232,756
|
|
1,944,766
|
|
REMIC,
Series 2018-70, Class HF, 4.131% (30-DAY AVERAGE SOFR +0.464%), 10/25/2058 |
1,912,291
|
|
1,853,913
|
|
REMIC,
Series 2019-5, Class FA, 4.181% (30-DAY AVERAGE SOFR +0.514%), 3/25/2049 |
1,840,236
|
|
1,973,113
|
|
REMIC,
Series 2019-21, Class FB, 4.231% (30-DAY AVERAGE SOFR +0.564%), 5/25/2049 |
1,956,120
|
|
3,716,670
|
|
REMIC,
Series 2019-25, Class PF, 4.231% (30-DAY AVERAGE SOFR +0.564%), 6/25/2049 |
3,685,167
|
|
1,330,992
|
|
REMIC,
Series 2019-33, Class FB, 4.231% (30-DAY AVERAGE SOFR +0.564%), 7/25/2049 |
1,318,585
|
|
2,968,968
|
|
REMIC,
Series 2019-34, Class FC, 4.181% (30-DAY AVERAGE SOFR +0.514%), 7/25/2049 |
2,945,220
|
|
752,627
|
|
REMIC,
Series 2019-35, Class EF, 4.231% (30-DAY AVERAGE SOFR +0.564%), 7/25/2049 |
746,663
|
|
3,005,957
|
|
REMIC,
Series 2019-35, Class FA, 4.181% (30-DAY AVERAGE SOFR +0.514%), 7/25/2049 |
2,980,657
|
|
321,093
|
|
REMIC,
Series 2019-41, Class FC, 4.231% (30-DAY AVERAGE SOFR +0.564%), 8/25/2049 |
317,061
|
|
737,018
|
|
REMIC,
Series 2019-42, Class LF, 4.131% (30-DAY AVERAGE SOFR +0.464%), 8/25/2049 |
736,759
|
|
9,013,822
|
|
REMIC,
Series 2019-43, Class FD, 4.868% (30-DAY AVERAGE SOFR +0.000%), 8/25/2049 |
8,956,802
|
|
1,269,527
|
|
REMIC,
Series 2019-59, Class F, 4.241% (30-DAY AVERAGE SOFR +0.544%), 10/25/2049 |
1,252,054
|
|
9,061,588
|
|
REMIC,
Series 2019-60, Class F, 4.231% (30-DAY AVERAGE SOFR +0.564%), 10/25/2049 |
9,018,141
|
|
5,806,914
|
|
REMIC,
Series 2020-27, Class FD, 4.231% (30-DAY AVERAGE SOFR +0.564%), 5/25/2050 |
5,734,802
|
|
1,128,733
|
|
REMIC,
Series 2020-29, Class FC, 4.714% (30-DAY AVERAGE SOFR +0.914%), 5/25/2050 |
1,138,083
|
|
1,447,344
|
|
REMIC,
Series 2020-34, Class FA, 4.231% (30-DAY AVERAGE SOFR +0.564%), 6/25/2050 |
1,428,937
|
|
4,063,390
|
|
REMIC,
Series 2020-37, Class FD, 4.181% (30-DAY AVERAGE SOFR +0.514%), 6/25/2050 |
4,047,827
|
|
1,921,757
|
|
REMIC,
Series 2023-42, Class FA, 4.081% (30-DAY AVERAGE SOFR +0.414%), 10/25/2048 |
1,901,487
|
|
992,089
|
|
REMIC,
Series 2024-13, Class FA, 4.667% (30-DAY AVERAGE SOFR +1.000%), 10/25/2053 |
995,431
|
|
695,367
|
|
REMIC,
Series 2024-25, Class FA, 4.767% (30-DAY AVERAGE SOFR +1.100%), 5/25/2054 |
698,594
|
|
6,633,695
|
|
REMIC,
Series 2024-40, Class FA, 4.817% (30-DAY AVERAGE SOFR +1.150%), 3/25/2054 |
6,679,695
|
|
6,061,020
|
|
REMIC,
Series 2024-82, Class CF, 5.017% (30-DAY AVERAGE SOFR +1.350%), 11/25/2054 |
6,113,860
|
|
3,936,084
|
|
REMIC,
Series 2024-82, Class FH, 4.817% (30-DAY AVERAGE SOFR +1.150%), 11/25/2054 |
3,957,670
|
|
3,069,956
|
|
REMIC,
Series 2024-103, Class FC, 4.817% (30-DAY AVERAGE SOFR +1.150%), 1/25/2055 |
3,089,822
|
|
6,648,247
|
|
REMIC,
Series 2025-7, Class FD, 4.667% (30-DAY AVERAGE SOFR +1.000%), 9/25/2054 |
6,668,483
|
|
4,813,619
|
|
REMIC,
Series 2025-13, Class FA, 5.650% (30-DAY AVERAGE SOFR +0.000%), 3/25/2055 |
4,852,109
|
|
|
|
TOTAL
|
132,440,709
|
|
|
|
Government
National Mortgage Association—18.0% |
|
|
1,879,997
|
|
REMIC,
Series 2010-115, Class FP, 4.381% (CME Term SOFR 1 Month +0.714%), 9/20/2040 |
1,883,942
|
|
227,398
|
|
REMIC,
Series 2012-42, Class HF, 4.151% (CME Term SOFR 1 Month +0.484%), 3/20/2042 |
226,161
|
|
992,078
|
|
REMIC,
Series 2014-2, Class BF, 4.131% (CME Term SOFR 1 Month +0.464%), 1/20/2044 |
987,732
|
|
1,573,796
|
|
REMIC,
Series 2015-119, Class FN, 4.031% (CME Term SOFR 1 Month +0.364%), 8/20/2045 |
1,550,495
|
|
Principal
Amount
or
Shares |
|
|
Value
|
|
|
1
|
COLLATERALIZED
MORTGAGE OBLIGATIONS—continued
|
|
|
|
|
Government
National Mortgage Association—continued |
|
|
$ 1,874,570
|
|
REMIC,
Series 2022-175, Class FA, 4.561% (30-DAY AVERAGE SOFR +0.900%), 10/20/2052 |
$ 1,876,602
|
|
5,865,909
|
|
REMIC,
Series 2022-197, Class JF, 4.361% (30-DAY AVERAGE SOFR +0.700%), 11/20/2052 |
5,865,895
|
|
272,008
|
|
REMIC,
Series 2022-213, Class FB, 4.211% (30-DAY AVERAGE SOFR +0.550%), 12/20/2052 |
271,757
|
|
3,691,704
|
|
REMIC,
Series 2023-4, Class FG, 4.411% (30-DAY AVERAGE SOFR +0.750%), 1/20/2053 |
3,694,388
|
|
3,306,389
|
|
REMIC,
Series 2023-35, Class FH, 4.211% (30-DAY AVERAGE SOFR +0.550%), 2/20/2053 |
3,291,540
|
|
3,804,262
|
|
REMIC,
Series 2023-112, Class AF, 4.711% (30-DAY AVERAGE SOFR +1.050%), 8/20/2053 |
3,831,672
|
|
935,040
|
|
REMIC,
Series 2023-117, Class F, 4.611% (30-DAY AVERAGE SOFR +0.950%), 5/20/2053 |
938,899
|
|
14,296,721
|
|
REMIC,
Series 2024-64, Class FM, 4.711% (30-DAY AVERAGE SOFR +1.050%), 4/20/2054 |
14,368,819
|
|
5,755,254
|
|
REMIC,
Series 2024-71, Class AF, 5.098% (30-DAY AVERAGE SOFR +0.000%), 4/20/2054 |
5,775,439
|
|
3,357,754
|
|
REMIC,
Series 2025-28, Class FM, 4.661% (30-DAY AVERAGE SOFR +1.000%), 2/20/2055 |
3,370,023
|
|
9,904,971
|
|
REMIC,
Series 2025-190, Class DF, 4.461% (30-DAY AVERAGE SOFR +0.800%), 11/20/2055 |
9,939,741
|
|
7,480,376
|
|
REMIC,
Series 2026-3, Class FB, 4.421% (30-DAY AVERAGE SOFR +0.760%), 1/20/2056 |
7,488,043
|
|
4,961,807
|
|
REMIC,
Series 2026-10, Class MF, 4.361% (30-DAY AVERAGE SOFR +0.700%), 1/20/2056 |
4,961,796
|
|
|
|
TOTAL
|
70,322,944
|
|
|
|
TOTAL
COLLATERALIZED MORTGAGE OBLIGATIONS
(IDENTIFIED
COST $323,216,145) |
324,498,023
|
|
|
|
MORTGAGE-BACKED
SECURITIES—8.1% |
|
|
|
|
Federal
Home Loan Mortgage Corporation—4.4% |
|
|
1,278,384
|
|
5.000%,
4/1/2053 |
1,288,349
|
|
3,168,094
|
|
5.500%,
8/1/2053 |
3,233,987
|
|
1,585,791
|
|
5.500%,
6/1/2054 |
1,614,685
|
|
6,521,505
|
|
5.500%,
12/1/2054 |
6,648,484
|
|
1,873,421
|
|
5.500%,
8/1/2055 |
1,904,776
|
|
2,348,639
|
|
5.500%,
12/1/2055 |
2,390,149
|
|
|
|
TOTAL
|
17,080,430
|
|
|
|
Federal
National Mortgage Association—3.6% |
|
|
870,110
|
|
4.000%,
11/1/2052 |
846,479
|
|
408,543
|
|
4.000%,
4/1/2053 |
398,469
|
|
2,129,489
|
|
4.500%,
5/1/2040 |
2,139,033
|
|
2,906,053
|
|
5.000%,
8/1/2055 |
2,921,214
|
|
1,944,131
|
|
5.500%,
5/1/2053 |
1,984,324
|
|
1,210,205
|
|
5.500%,
1/1/2054 |
1,234,242
|
|
1,258,237
|
|
5.500%,
4/1/2054 |
1,281,811
|
|
2,678,602
|
|
5.500%,
12/1/2054 |
2,724,898
|
|
682,108
|
|
6.000%,
10/1/2053 |
700,675
|
|
|
|
TOTAL
|
14,231,145
|
|
|
|
Government
National Mortgage Association—0.1% |
|
|
357,381
|
|
5.500%,
8/20/2053 |
364,373
|
|
|
|
TOTAL
MORTGAGE-BACKED SECURITIES
(IDENTIFIED
COST $31,068,896) |
31,675,948
|
|
|
1
|
COMMERCIAL
MORTGAGE-BACKED SECURITIES—3.8% |
|
|
|
|
Agency
Commercial Mortgage-Backed Securities—3.8% |
|
|
454,910
|
|
FHLMC
REMIC, Series KF90, Class AS, 4.059% (30-DAY AVERAGE SOFR +0.380%), 9/25/2030 |
452,611
|
|
1,320,135
|
|
FHLMC
REMIC, Series KF94, Class AL, 4.093% (30-DAY AVERAGE SOFR +0.414%), 11/25/2030 |
1,316,296
|
|
1,448,917
|
|
FHLMC
REMIC, Series KF148, Class AS, 4.519% (30-DAY AVERAGE SOFR +0.840%), 11/25/2032 |
1,460,332
|
|
1,366,654
|
|
FHLMC
REMIC, Series KF149, Class AS, 4.319% (30-DAY AVERAGE SOFR +0.640%), 12/25/2032 |
1,367,957
|
|
1,374,540
|
|
FHLMC
REMIC, Series KF154, Class AS, 4.319% (30-DAY AVERAGE SOFR +0.640%), 12/25/2032 |
1,377,543
|
|
1,239,071
|
|
FHLMC
REMIC, Series KF155, Class AS, 4.349% (30-DAY AVERAGE SOFR +0.670%), 2/25/2030 |
1,240,191
|
|
2,131,841
|
|
FHLMC
REMIC, Series KF157, Class AS, 4.339% (30-DAY AVERAGE SOFR +0.660%), 4/25/2033 |
2,146,503
|
|
1,500,000
|
|
FHLMC
REMIC, Series KF165, Class AS, 4.239% (30-DAY AVERAGE SOFR +0.560%), 1/25/2035 |
1,498,651
|
|
3,830,000
|
|
FHLMC
REMIC, Series KF169, Class AS, 4.239% (30-DAY AVERAGE SOFR +0.560%), 11/25/2035 |
3,829,997
|
|
Principal
Amount
or
Shares |
|
|
Value
|
|
|
1
|
COMMERCIAL
MORTGAGE-BACKED SECURITIES—continued
|
|
|
|
|
Agency
Commercial Mortgage-Backed Securities—continued |
|
|
$ 55,979
|
|
FNMA
REMIC, Series 2020-M5, Class FA, 4.255% (30-DAY AVERAGE SOFR +0.574%), 1/25/2027 |
$ 55,843
|
|
|
|
TOTAL
COMMERCIAL MORTGAGE-BACKED SECURITIES
(IDENTIFIED
COST $14,721,968) |
14,745,924
|
|
|
|
U.S.
TREASURY—1.8% |
|
|
|
|
U.S.
Treasury Notes—1.8% |
|
|
7,000,000
|
|
3.875%,
5/31/2027
(IDENTIFIED
COST $7,002,503) |
7,033,586
|
|
|
1
|
ADJUSTABLE
RATE MORTGAGES—0.9% |
|
|
|
|
Federal
Home Loan Mortgage Corporation ARM—0.1% |
|
|
56,707
|
|
6.325%,
7/1/2038 |
58,091
|
|
419,100
|
|
6.631%,
5/1/2035 |
433,126
|
|
|
|
TOTAL
|
491,217
|
|
|
|
Federal
National Mortgage Association ARM—0.8% |
|
|
29,741
|
|
5.605%,
5/1/2035 |
30,524
|
|
132,597
|
|
5.623%,
12/1/2034 |
136,766
|
|
48,550
|
|
5.840%,
12/1/2033 |
50,139
|
|
271,886
|
|
5.840%,
5/1/2039 |
279,234
|
|
142,488
|
|
5.844%,
6/1/2034 |
146,224
|
|
31,411
|
|
5.845%,
11/1/2035 |
31,947
|
|
14,060
|
|
5.869%,
2/1/2036 |
14,458
|
|
75,034
|
|
5.882%,
8/1/2034 |
76,821
|
|
162,297
|
|
5.883%,
9/1/2033 |
165,813
|
|
94,829
|
|
5.962%,
12/1/2034 |
98,080
|
|
294,810
|
|
5.965%,
10/1/2034 |
301,290
|
|
62,992
|
|
5.999%,
7/1/2035 |
65,143
|
|
74,036
|
|
6.047%,
10/1/2035 |
76,579
|
|
211,564
|
|
6.057%,
1/1/2035 |
218,583
|
|
94,420
|
|
6.065%,
10/1/2037 |
97,141
|
|
134,131
|
|
6.070%,
2/1/2042 |
140,732
|
|
22,390
|
|
6.105%,
5/1/2038 |
23,058
|
|
153,990
|
|
6.164%,
1/1/2040 |
161,493
|
|
196,890
|
|
6.210%,
11/1/2039 |
206,502
|
|
54,393
|
|
6.215%,
6/1/2033 |
56,024
|
|
179,318
|
|
6.243%,
7/1/2035 |
184,588
|
|
126,145
|
|
6.270%,
1/1/2035 |
129,539
|
|
47,434
|
|
6.315%,
5/1/2035 |
48,921
|
|
122,869
|
|
6.363%,
7/1/2035 |
127,081
|
|
153,876
|
|
6.392%,
7/1/2035 |
159,362
|
|
85,407
|
|
6.398%,
10/1/2035 |
88,552
|
|
17,069
|
|
6.506%,
4/1/2034 |
17,630
|
|
|
|
TOTAL
|
3,132,224
|
|
|
|
Government
National Mortgage Association—0.0% |
|
|
6,463
|
|
5.125%,
10/20/2029 |
6,522
|
|
1,364
|
|
5.625%,
5/20/2029 |
1,376
|
|
4,978
|
|
5.625%,
1/20/2030 |
5,024
|
|
|
|
TOTAL
|
12,922
|
|
|
|
TOTAL
ADJUSTABLE RATE MORTGAGES
(IDENTIFIED
COST $3,616,188) |
3,636,363
|
|
Principal
Amount
or
Shares |
|
|
Value
|
|
|
|
INVESTMENT
COMPANY—3.9% |
|
|
15,499,650
|
|
Federated
Hermes Government Obligations Fund, Premier Shares, 3.59%2
(IDENTIFIED
COST $15,499,650) |
$ 15,499,650
|
|
|
|
TOTAL
INVESTMENT IN SECURITIES—101.5%
(IDENTIFIED
COST $395,125,350)3
|
397,089,494
|
|
|
|
OTHER
ASSETS AND LIABILITIES - NET—(1.5)%4
|
(6,018,208)
|
|
|
|
NET
ASSETS—100% |
$391,071,286
|
|
|
Federated
Hermes
Government
Obligations
Fund,
Premier
Shares |
|
Value
as of 8/31/2025 |
$15,512,813
|
|
Purchases
at Cost |
$122,292,426
|
|
Proceeds
from Sales |
$(122,305,589)
|
|
Change
in Unrealized Appreciation/Depreciation |
$—
|
|
Net
Realized Gain/(Loss) |
$—
|
|
Value
as of 2/28/2026 |
$15,499,650
|
|
Shares
Held as of 2/28/2026 |
15,499,650
|
|
Dividend
Income |
$171,047
|
|
1
|
Floating/adjustable
note with current rate and current maturity or next reset date shown. Adjustable rate mortgage security coupons are based on the weighted
average
note rates of the underlying mortgages less the guarantee and servicing fees. These securities do not indicate an index and spread in
their description
above.
|
|
2
|
7-day
net yield. |
|
3
|
The
cost of investments for federal tax purposes amounts to $395,123,547. |
|
4
|
Assets,
other than investments in securities, less liabilities. See Statement of Assets and Liabilities. |
The following is a summary of the inputs used, as of February 28, 2026, in valuing the Fund’s assets carried at fair value:
|
Valuation
Inputs | ||||
|
|
Level
1—
Quoted
Prices
|
Level
2—
Other
Significant
Observable
Inputs
|
Level
3—
Significant
Unobservable
Inputs
|
Total
|
|
Debt
Securities: |
|
|
|
|
|
Collateralized
Mortgage Obligations |
$—
|
$324,498,023
|
$—
|
$324,498,023
|
|
Mortgage-Backed
Securities |
—
|
31,675,948
|
—
|
31,675,948
|
|
Commercial
Mortgage-Backed Securities |
—
|
14,745,924
|
—
|
14,745,924
|
|
U.S.
Treasury |
—
|
7,033,586
|
—
|
7,033,586
|
|
Adjustable
Rate Mortgages |
—
|
3,636,363
|
—
|
3,636,363
|
|
Investment
Company |
15,499,650
|
—
|
—
|
15,499,650
|
|
TOTAL
SECURITIES |
$15,499,650
|
$381,589,844
|
$—
|
$397,089,494
|
|
The
following acronym(s) are used throughout this portfolio: |
| |
|
ARM
|
—Adjustable
Rate Mortgage | |
|
FHLMC
|
—Federal
Home Loan Mortgage Corporation | |
|
FNMA
|
—Federal
National Mortgage Association | |
|
REMIC
|
—Real
Estate Mortgage Investment Conduit | |
|
SOFR
|
—Secured
Overnight Financing Rate | |
|
|
Six
Months
Ended
(unaudited)
2/28/2026
|
Year Ended August 31,
| ||||
|
|
2025
|
2024
|
2023
|
2022
|
2021
| |
|
Net Asset
Value, Beginning of Period |
$9.36
|
$9.36
|
$9.22
|
$9.48
|
$9.63
|
$9.65
|
|
Income
From Investment Operations: |
|
|
|
|
|
|
|
Net
investment income (loss)2
|
0.20
|
0.44
|
0.49
|
0.37
|
0.05
|
0.02
|
|
Net
realized and unrealized gain (loss) |
0.07
|
0.003
|
0.14
|
(0.26)
|
(0.15)
|
(0.01)
|
|
Total
From Investment Operations |
0.27
|
0.44
|
0.63
|
0.11
|
(0.10)
|
0.01
|
|
Less Distributions:
|
|
|
|
|
|
|
|
Distributions
from net investment income |
(0.21)
|
(0.44)
|
(0.49)
|
(0.37)
|
(0.05)
|
(0.03)
|
|
Net
Asset Value, End of Period |
$9.42
|
$9.36
|
$9.36
|
$9.22
|
$9.48
|
$9.63
|
|
Total
Return4
|
2.86%
|
4.87%
|
7.06%
|
1.25%
|
(1.08)%
|
0.09%
|
|
Ratios
to Average Net Assets: |
|
|
|
|
|
|
|
Net
expenses5
|
0.56%6
|
0.55%
|
0.55%
|
0.55%
|
0.55%
|
0.53%
|
|
Net
investment income |
4.40%6
|
4.69%
|
5.31%
|
3.96%
|
0.48%
|
0.26%
|
|
Expense
waiver/reimbursement7
|
0.17%6
|
0.22%
|
0.29%
|
0.29%
|
0.26%
|
0.31%
|
|
Supplemental
Data: |
|
|
|
|
|
|
|
Net
assets, end of period (000 omitted) |
$129,224
|
$106,542
|
$36,450
|
$29,438
|
$33,685
|
$74,655
|
|
Portfolio
turnover8
|
14%
|
44%
|
48%
|
44%
|
54%
|
82%
|
|
Portfolio
turnover (excluding purchases and sales from dollar-roll transactions)8
|
12%
|
29%
|
25%
|
42%
|
53%
|
51%
|
|
1
|
Effective
at the start of business on July 28, 2022, the Fund’s Service Shares were re-designated as Class A Shares. |
|
2
|
Per
share numbers have been calculated using the average shares method. |
|
3
|
Represents
less than $0.01. |
|
4
|
Based
on net asset value, which does not reflect the sales charge, redemption fee or contingent deferred sales charge, if applicable. Total
returns for periods of
less
than one year are not annualized. |
|
5
|
Amount
does not reflect net expenses incurred by investment companies in which the Fund may invest. |
|
6
|
Computed
on an annualized basis. |
|
7
|
This
expense decrease is reflected in both the net expense and the net investment income ratios shown above. Amount does not reflect expense
waiver/
reimbursement
recorded by investment companies in which the Fund may invest. |
|
8
|
Securities
that mature are considered sales for purposes of this calculation. |
|
|
Six
Months
Ended
(unaudited)
2/28/2026
|
Year Ended August 31,
| ||||
|
|
2025
|
2024
|
2023
|
2022
|
2021
| |
|
Net Asset
Value, Beginning of Period |
$9.36
|
$9.36
|
$9.22
|
$9.48
|
$9.63
|
$9.65
|
|
Income
From Investment Operations: |
|
|
|
|
|
|
|
Net
investment income (loss)1
|
0.22
|
0.47
|
0.52
|
0.38
|
0.09
|
0.05
|
|
Net
realized and unrealized gain (loss) |
0.06
|
0.002
|
0.14
|
(0.24)
|
(0.17)
|
(0.02)
|
|
Total
From Investment Operations |
0.28
|
0.47
|
0.66
|
0.14
|
(0.08)
|
0.03
|
|
Less Distributions:
|
|
|
|
|
|
|
|
Distributions
from net investment income |
(0.22)
|
(0.47)
|
(0.52)
|
(0.40)
|
(0.07)
|
(0.05)
|
|
Net
Asset Value, End of Period |
$9.42
|
$9.36
|
$9.36
|
$9.22
|
$9.48
|
$9.63
|
|
Total
Return3
|
2.99%
|
5.13%
|
7.33%
|
1.50%
|
(0.84)%
|
0.31%
|
|
Ratios
to Average Net Assets: |
|
|
|
|
|
|
|
Net
expenses4
|
0.31%5
|
0.30%
|
0.30%
|
0.30%
|
0.30%
|
0.30%
|
|
Net
investment income |
4.65%5
|
4.98%
|
5.57%
|
4.10%
|
0.93%
|
0.47%
|
|
Expense
waiver/reimbursement6
|
0.17%5
|
0.22%
|
0.28%
|
0.29%
|
0.26%
|
0.31%
|
|
Supplemental
Data: |
|
|
|
|
|
|
|
Net
assets, end of period (000 omitted) |
$261,847
|
$208,888
|
$135,402
|
$95,018
|
$156,311
|
$65,393
|
|
Portfolio
turnover7
|
14%
|
44%
|
48%
|
44%
|
54%
|
82%
|
|
Portfolio
turnover (excluding purchases and sales from dollar-roll transactions)7
|
12%
|
29%
|
25%
|
42%
|
53%
|
51%
|
|
1
|
Per
share numbers have been calculated using the average shares method. |
|
2
|
Represents
less than $0.01. |
|
3
|
Based
on net asset value. Total returns for periods of less than one year are not annualized. |
|
4
|
Amount
does not reflect net expenses incurred by investment companies in which the Fund may invest. |
|
5
|
Computed
on an annualized basis. |
|
6
|
This
expense decrease is reflected in both the net expense and the net investment income ratios shown above. Amount does not reflect expense
waiver/
reimbursement
recorded by investment companies in which the Fund may invest. |
|
7
|
Securities
that mature are considered sales for purposes of this calculation. |
|
Assets:
|
|
|
Investment
in securities, at value including $15,499,650 of investments in affiliated holdings* (identified
cost $395,125,350, including
$15,499,650
of identified cost in affiliated holdings) |
$397,089,494
|
|
Income
receivable |
575,239
|
|
Income
receivable from affiliated holdings |
16,666
|
|
Receivable
for investments sold |
2,095
|
|
Receivable
for shares sold |
1,018,492
|
|
Total
Assets |
398,701,986
|
|
Liabilities:
|
|
|
Payable
for investments purchased |
6,983,459
|
|
Payable
for shares redeemed |
303,486
|
|
Payable
to bank |
519
|
|
Income
distribution payable |
293,405
|
|
Payable
for investment adviser fee (Note 5)
|
1,978
|
|
Payable
for administrative fee (Note 5)
|
1,646
|
|
Payable
for other service fees (Notes 2 and 5)
|
24,011
|
|
Accrued
expenses (Note 5)
|
22,196
|
|
Total
Liabilities |
7,630,700
|
|
Net
assets for 41,496,118 shares outstanding |
$391,071,286
|
|
Net Assets
Consist of: |
|
|
Paid-in
capital |
$394,721,674
|
|
Total
distributable earnings (loss) |
(3,650,388)
|
|
Net
Assets |
$391,071,286
|
|
Net Asset
Value, Offering Price and Redemption Proceeds Per Share: |
|
|
Class A
Shares: |
|
|
Net
asset value per share ($129,224,457 ÷ 13,711,581 shares outstanding), no par value, unlimited shares authorized |
$9.42
|
|
Offering
price per share (100/99.00 of $9.42) |
$9.52
|
|
Redemption
proceeds per share |
$9.42
|
|
Institutional
Shares: |
|
|
Net
asset value per share ($261,846,829 ÷ 27,784,537 shares outstanding), no par value, unlimited shares authorized |
$9.42
|
|
Offering
price per share |
$9.42
|
|
Redemption
proceeds per share |
$9.42
|
|
*
|
See
information listed after the Fund’s Portfolio of Investments. |
|
Investment
Income: |
|
|
Interest
|
$8,371,569
|
|
Dividends
received from affiliated holdings* |
171,047
|
|
TOTAL
INCOME |
8,542,616
|
|
Expenses:
|
|
|
Investment
adviser fee (Note 5)
|
431,119
|
|
Administrative
fee (Note 5)
|
135,024
|
|
Custodian
fees |
14,143
|
|
Transfer
agent fees |
80,851
|
|
Directors’/Trustees’
fees (Note 5)
|
4,651
|
|
Auditing
fees |
19,867
|
|
Legal
fees |
5,118
|
|
Portfolio
accounting fees |
76,427
|
|
Other
service fees (Notes 2 and 5)
|
148,728
|
|
Share
registration costs |
26,389
|
|
Printing
and postage |
11,789
|
|
Miscellaneous
(Note 5)
|
16,829
|
|
TOTAL
EXPENSES |
970,935
|
|
Waiver
and Reimbursement: |
|
|
Waiver/reimbursement
of investment adviser fee (Note 5) |
(292,389)
|
|
Net
expenses |
678,546
|
|
Net
investment income |
7,864,070
|
|
Realized
and Unrealized Gain (Loss) on Investments: |
|
|
Net
realized loss on investments |
(147,151)
|
|
Net
change in unrealized depreciation of investments |
2,725,878
|
|
Net
realized and unrealized gain (loss) on investments |
2,578,727
|
|
Change
in net assets resulting from operations |
$10,442,797
|
|
*
|
See
information listed after the Fund’s Portfolio of Investments. |
|
|
Six
Months
Ended
(unaudited)
2/28/2026
|
Year
Ended
8/31/2025
|
|
Increase
(Decrease) in Net Assets |
|
|
|
Operations:
|
|
|
|
Net
investment income |
$7,864,070
|
$12,042,063
|
|
Net
realized gain (loss) |
(147,151)
|
(7,245)
|
|
Net
change in unrealized appreciation/depreciation |
2,725,878
|
117,217
|
|
CHANGE
IN NET ASSETS RESULTING FROM OPERATIONS |
10,442,797
|
12,152,035
|
|
Distributions
to Shareholders: |
|
|
|
Class
A Shares |
(2,625,651)
|
(3,174,457)
|
|
Institutional
Shares |
(5,254,812)
|
(8,868,795)
|
|
CHANGE
IN NET ASSETS RESULTING FROM DISTRIBUTIONS TO SHAREHOLDERS |
(7,880,463)
|
(12,043,252)
|
|
Share Transactions:
|
|
|
|
Proceeds
from sale of shares |
108,366,136
|
245,852,208
|
|
Net
asset value of shares issued to shareholders in payment of distributions declared |
6,363,073
|
9,677,173
|
|
Cost
of shares redeemed |
(41,650,630)
|
(112,060,391)
|
|
CHANGE
IN NET ASSETS RESULTING FROM SHARE TRANSACTIONS |
73,078,579
|
143,468,990
|
|
Change
in net assets |
75,640,913
|
143,577,773
|
|
Net Assets:
|
|
|
|
Beginning
of period |
315,430,373
|
171,852,600
|
|
End
of period |
$391,071,286
|
$315,430,373
|
|
|
Other
Service
Fees
Incurred |
|
Class
A Shares |
$148,728
|
|
|
Six
Months Ended
2/28/2026
|
Year
Ended
8/31/2025
| ||
|
Class
A Shares: |
Shares
|
Amount
|
Shares
|
Amount
|
|
Shares
sold |
3,199,515
|
$30,010,340
|
9,015,653
|
$84,206,850
|
|
Shares
issued to shareholders in payment of distributions declared |
272,059
|
2,553,667
|
325,078
|
3,036,820
|
|
Shares
redeemed |
(1,145,186)
|
(10,742,180)
|
(1,849,597)
|
(17,264,764)
|
|
NET
CHANGE RESULTING FROM CLASS A SHARE TRANSACTIONS |
2,326,388
|
$21,821,827
|
7,491,134
|
$69,978,906
|
|
|
Six
Months Ended
2/28/2026
|
Year
Ended
8/31/2025
| ||
|
Institutional
Shares: |
Shares
|
Amount
|
Shares
|
Amount
|
|
Shares
sold |
8,350,971
|
$78,355,796
|
17,306,891
|
$161,645,358
|
|
Shares
issued to shareholders in payment of distributions declared |
405,835
|
3,809,406
|
710,813
|
6,640,353
|
|
Shares
redeemed |
(3,294,456)
|
(30,908,450)
|
(10,161,177)
|
(94,795,627)
|
|
NET
CHANGE RESULTING FROM INSTITUTIONAL SHARE TRANSACTIONS |
5,462,350
|
$51,256,752
|
7,856,527
|
$73,490,084
|
|
NET
CHANGE RESULTING FROM TOTAL FUND SHARE TRANSACTIONS |
7,788,738
|
$73,078,579
|
15,347,661
|
$143,468,990
|
|
Short-Term
|
Long-Term
|
Total
|
|
$4,897,069
|
$589,766
|
$5,486,835
|
|
Administrative
Fee |
Average
Daily Net Assets
of
the Investment Complex |
|
0.100%
|
on
assets up to $50 billion |
|
0.075%
|
on
assets over $50 billion |
|
Purchases
|
$—
|
|
Sales
|
$4,235,450
|

Federated Hermes Funds
4000 Ericsson Drive
Warrendale, PA 15086-7561
or call 1-800-341-7400.
CUSIP 314082306
| Item 8. | Changes in and Disagreements with Accountants for Open-End Management Investment Companies |
Federated Hermes Adjustable Rate Fund: Not Applicable.
| Item 9. | Proxy Disclosures for Open-End Management Investment Companies. |
Federated Hermes Adjustable Rate Fund: Not Applicable.
| Item 10. | Remuneration Paid to Directors, Officers, and Others of Open-End Management Investment Companies. |
Federated Hermes Adjustable Rate Fund: The Fund’s disclosure of remuneration items is included as part of the Financial Statements filed under Item 7 of this form.
| Item 11. | Statement Regarding Basis for Approval of Investment Advisory Contract. |
Federated Hermes Adjustable Rate Fund: The Fund’s Evaluation and Approval of Advisory Contract summary by fund appear in the Financial Statements filed under Item 7 of this form.
| Item 12. | Disclosure of Proxy Voting Policies and Procedures for Closed-End Management Investment Companies |
Not Applicable
| Item 13. | Portfolio Managers of Closed-End Management Investment Companies. |
Not Applicable
| Item 14. | Purchases of Equity Securities by Closed-End Management Investment Company and Affiliated Purchasers. |
Not Applicable
| Item 15. | Submission of Matters to a Vote of Security Holders. |
No Changes to Report
| Item 16. | Controls and Procedures. |
(a) The registrant’s Principal Executive Officer and Principal Financial Officer have concluded that the registrant’s disclosure controls and procedures (as defined in Rule 30a-3(c) under the Act) are effective in design and operation and are sufficient to form the basis of the certifications required by Rule 30a-(2) under the Act, based on their evaluation of these disclosure controls and procedures as of a date within 90 days of this report on Form N-CSR.
(b) There were no changes in the registrant’s internal control over financial reporting (as defined in Rule 30a-3(d) under the Act) during the period covered by this report that have materially affected, or are reasonably likely to materially affect, the registrant’s internal control over financial reporting.
| Item 17. | Disclosure of Securities Lending Activities for Closed-End Management Investment Companies. |
Not Applicable
| Item 18. | Recovery of Erroneously Awarded Compensation |
(a) Not Applicable
(b) Not Applicable
| Item 19. | Exhibits |
(a)(1) Not Applicable.
(a)(2) Not Applicable.
(a)(3) Certifications of Principal Executive Officer and Principal Financial Officer.
(a)(4) Not Applicable.
(a)(5) Not Applicable.
(b) Certifications pursuant to 18 U.S.C. Section 1350.
SIGNATURES
Pursuant to the requirements of the Securities Exchange Act of 1934 and the Investment Company Act of 1940, the registrant has duly caused this report to be signed on its behalf by the undersigned, thereunto duly authorized.
Registrant: Federated Hermes Adjustable Rate Securities Trust
By: /s/ Jeremy D. Boughton
Jeremy D. Boughton, Principal Financial Officer
Date: April 23, 2026
Pursuant to the requirements of the Securities Exchange Act of 1934 and the Investment Company Act of 1940, this report has been signed below by the following persons on behalf of the registrant and in the capacities and on the dates indicated.
By: /s/ J. Christopher
Donahue
J. Christopher Donahue, Principal Executive Officer
Date: April 23, 2026
By: /s/ Jeremy D. Boughton
Jeremy D. Boughton, Principal Financial Officer
Date: April 23, 2026