Shareholder Report
|
6 Months Ended |
|
Feb. 28, 2026
USD ($)
Holding
|
|---|
| Shareholder Report [Line Items] |
|
|
| Document Type |
N-CSRS
|
|
| Amendment Flag |
false
|
|
| Registrant Name |
EATON VANCE MUNICIPALS TRUST
|
|
| Entity Central Index Key |
0000778365
|
|
| Entity Investment Company Type |
N-1A
|
|
| Document Period End Date |
Feb. 28, 2026
|
|
| Shareholder Report Annual or Semi-Annual |
Semi-Annual Shareholder Report
|
|
| C000013178 |
|
|
| Shareholder Report [Line Items] |
|
|
| Fund Name |
Eaton Vance Georgia Municipal Income Fund
|
|
| Class Name |
Class A
|
|
| Trading Symbol |
ETGAX
|
|
| Annual or Semi-Annual Statement [Text Block] |
This semi-annual shareholder report contains important information about the Eaton Vance Georgia Municipal Income Fund for the period of September 1, 2025 to February 28, 2026.
|
|
| Additional Information [Text Block] |
You can find additional information about the Fund at www.eatonvance.com/open-end-mutual-fund-documents.php. You can also request this information by contacting us at 1-800-262-1122.
|
|
| Additional Information Phone Number |
1-800-262-1122
|
|
| Additional Information Website |
<span style="box-sizing: border-box; color: rgb(0, 0, 0); display: inline; flex-wrap: nowrap; font-size: 10.6667px; font-weight: 400; grid-area: auto; line-height: 16px; margin: 0px; overflow: visible; text-align: left; text-align-last: auto; white-space-collapse: preserve-breaks;">www.eatonvance.com/open-end-mutual-fund-documents.php</span>
|
|
| Expenses [Text Block] |
What were the Fund costs for the last six months?(based on a hypothetical $10,000 investment)
Table Summary
Class Name |
Costs of a $10,000 investment |
Costs paid as a percentage of a $10,000 investment |
Class A |
$37 |
0.72%Footnote Reference1 |
| Footnote |
Description |
Footnote1 |
Annualized | |
|
| Expenses Paid, Amount |
$ 37
|
|
| Expense Ratio, Percent |
0.72%
|
[1] |
| AssetsNet |
$ 138,280,991
|
|
| Holdings Count | Holding |
123
|
|
| InvestmentCompanyPortfolioTurnover |
15.00%
|
|
| Additional Fund Statistics [Text Block] |
Table Summary
Total Net Assets |
$138,280,991 |
# of Portfolio Holdings |
123 |
Portfolio Turnover Rate |
15% | |
|
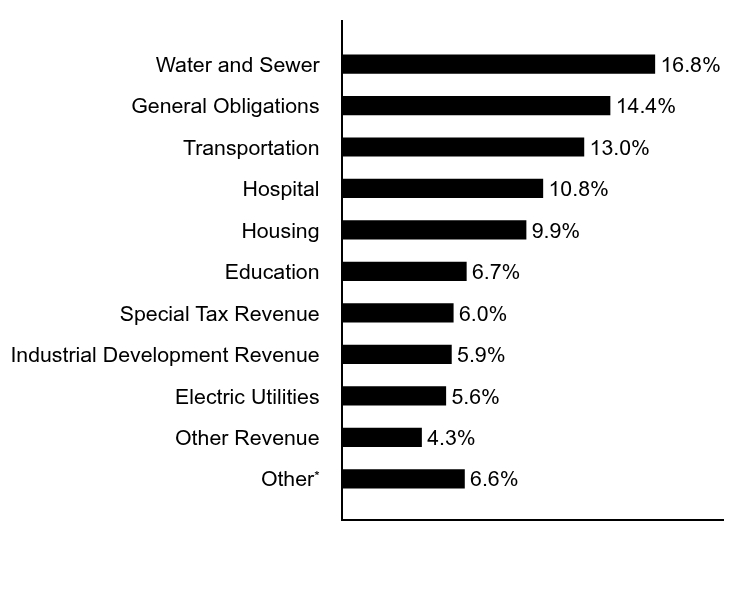
| Holdings [Text Block] |
Sector Allocation (% of total investments)
Table Summary
Value |
Value |
OtherFootnote Reference* |
6.6% |
Other Revenue |
4.3% |
Electric Utilities |
5.6% |
Industrial Development Revenue |
5.9% |
Special Tax Revenue |
6.0% |
Education |
6.7% |
Housing |
9.9% |
Hospital |
10.8% |
Transportation |
13.0% |
General Obligations |
14.4% |
Water and Sewer |
16.8% |
| Footnote |
Description |
Footnote* |
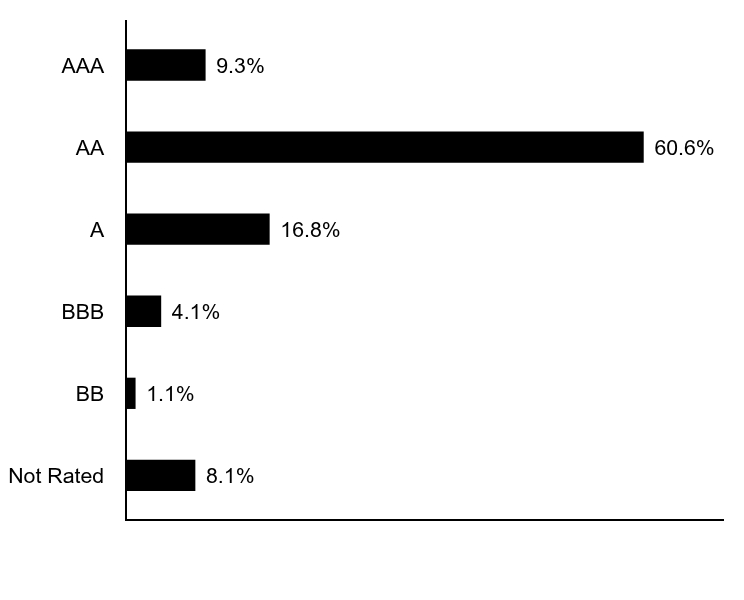
Sectors less than 3% each | Credit Quality (% of total investments)Footnote Referencea
Table Summary
Value |
Value |
Not Rated |
8.1% |
BB |
1.1% |
BBB |
4.1% |
A |
16.8% |
AA |
60.6% |
AAA |
9.3% |
| Footnote |
Description |
Footnotea |
Ratings are based on Moody’s Investors Service, Inc. (“Moody’s”), S&P Global Ratings (“S&P”) or Fitch Ratings (“Fitch”). If securities are rated differently by the ratings agencies, the highest rating is applied. Moody's ratings are converted to the S&P and Fitch scale with ratings ranging from AAA, being the highest, to D, being the lowest. Ratings of BBB or higher are considered to be investment-grade quality. Holdings designated as “Not Rated” (if any) are not rated by the national ratings agencies stated above. | |
|
| Material Fund Change [Text Block] |
|
|
| Updated Prospectus Phone Number |
1-800-262-1122
|
|
| C000013180 |
|
|
| Shareholder Report [Line Items] |
|
|
| Fund Name |
Eaton Vance Georgia Municipal Income Fund
|
|
| Class Name |
Class C
|
|
| Trading Symbol |
ECGAX
|
|
| Annual or Semi-Annual Statement [Text Block] |
This semi-annual shareholder report contains important information about the Eaton Vance Georgia Municipal Income Fund for the period of September 1, 2025 to February 28, 2026.
|
|
| Additional Information [Text Block] |
You can find additional information about the Fund at www.eatonvance.com/open-end-mutual-fund-documents.php. You can also request this information by contacting us at 1-800-262-1122.
|
|
| Additional Information Phone Number |
1-800-262-1122
|
|
| Additional Information Website |
<span style="box-sizing: border-box; color: rgb(0, 0, 0); display: inline; flex-wrap: nowrap; font-size: 10.6667px; font-weight: 400; grid-area: auto; line-height: 16px; margin: 0px; overflow: visible; text-align: left; text-align-last: auto; white-space-collapse: preserve-breaks;">www.eatonvance.com/open-end-mutual-fund-documents.php</span>
|
|
| Expenses [Text Block] |
What were the Fund costs for the last six months?(based on a hypothetical $10,000 investment)
Table Summary
Class Name |
Costs of a $10,000 investment |
Costs paid as a percentage of a $10,000 investment |
Class C |
$75 |
1.47%Footnote Reference1 |
| Footnote |
Description |
Footnote1 |
Annualized | |
|
| Expenses Paid, Amount |
$ 75
|
|
| Expense Ratio, Percent |
1.47%
|
[2] |
| AssetsNet |
$ 138,280,991
|
|
| Holdings Count | Holding |
123
|
|
| InvestmentCompanyPortfolioTurnover |
15.00%
|
|
| Additional Fund Statistics [Text Block] |
Table Summary
Total Net Assets |
$138,280,991 |
# of Portfolio Holdings |
123 |
Portfolio Turnover Rate |
15% | |
|
| Holdings [Text Block] |
Sector Allocation (% of total investments)
Table Summary
Value |
Value |
OtherFootnote Reference* |
6.6% |
Other Revenue |
4.3% |
Electric Utilities |
5.6% |
Industrial Development Revenue |
5.9% |
Special Tax Revenue |
6.0% |
Education |
6.7% |
Housing |
9.9% |
Hospital |
10.8% |
Transportation |
13.0% |
General Obligations |
14.4% |
Water and Sewer |
16.8% |
| Footnote |
Description |
Footnote* |
Sectors less than 3% each | Credit Quality (% of total investments)Footnote Referencea
Table Summary
Value |
Value |
Not Rated |
8.1% |
BB |
1.1% |
BBB |
4.1% |
A |
16.8% |
AA |
60.6% |
AAA |
9.3% |
| Footnote |
Description |
Footnotea |
Ratings are based on Moody’s Investors Service, Inc. (“Moody’s”), S&P Global Ratings (“S&P”) or Fitch Ratings (“Fitch”). If securities are rated differently by the ratings agencies, the highest rating is applied. Moody's ratings are converted to the S&P and Fitch scale with ratings ranging from AAA, being the highest, to D, being the lowest. Ratings of BBB or higher are considered to be investment-grade quality. Holdings designated as “Not Rated” (if any) are not rated by the national ratings agencies stated above. | |
|
| Material Fund Change [Text Block] |
|
|
| Updated Prospectus Phone Number |
1-800-262-1122
|
|
| C000063956 |
|
|
| Shareholder Report [Line Items] |
|
|
| Fund Name |
Eaton Vance Georgia Municipal Income Fund
|
|
| Class Name |
Class I
|
|
| Trading Symbol |
EIGAX
|
|
| Annual or Semi-Annual Statement [Text Block] |
This semi-annual shareholder report contains important information about the Eaton Vance Georgia Municipal Income Fund for the period of September 1, 2025 to February 28, 2026.
|
|
| Additional Information [Text Block] |
You can find additional information about the Fund at www.eatonvance.com/open-end-mutual-fund-documents.php. You can also request this information by contacting us at 1-800-262-1122.
|
|
| Additional Information Phone Number |
1-800-262-1122
|
|
| Additional Information Website |
<span style="box-sizing: border-box; color: rgb(0, 0, 0); display: inline; flex-wrap: nowrap; font-size: 10.6667px; font-weight: 400; grid-area: auto; line-height: 16px; margin: 0px; overflow: visible; text-align: left; text-align-last: auto; white-space-collapse: preserve-breaks;">www.eatonvance.com/open-end-mutual-fund-documents.php</span>
|
|
| Expenses [Text Block] |
What were the Fund costs for the last six months?(based on a hypothetical $10,000 investment)
Table Summary
Class Name |
Costs of a $10,000 investment |
Costs paid as a percentage of a $10,000 investment |
Class I |
$27 |
0.52%Footnote Reference1 |
| Footnote |
Description |
Footnote1 |
Annualized | |
|
| Expenses Paid, Amount |
$ 27
|
|
| Expense Ratio, Percent |
0.52%
|
[3] |
| AssetsNet |
$ 138,280,991
|
|
| Holdings Count | Holding |
123
|
|
| InvestmentCompanyPortfolioTurnover |
15.00%
|
|
| Additional Fund Statistics [Text Block] |
Table Summary
Total Net Assets |
$138,280,991 |
# of Portfolio Holdings |
123 |
Portfolio Turnover Rate |
15% | |
|
| Holdings [Text Block] |
Sector Allocation (% of total investments)
Table Summary
Value |
Value |
OtherFootnote Reference* |
6.6% |
Other Revenue |
4.3% |
Electric Utilities |
5.6% |
Industrial Development Revenue |
5.9% |
Special Tax Revenue |
6.0% |
Education |
6.7% |
Housing |
9.9% |
Hospital |
10.8% |
Transportation |
13.0% |
General Obligations |
14.4% |
Water and Sewer |
16.8% |
| Footnote |
Description |
Footnote* |
Sectors less than 3% each | Credit Quality (% of total investments)Footnote Referencea
Table Summary
Value |
Value |
Not Rated |
8.1% |
BB |
1.1% |
BBB |
4.1% |
A |
16.8% |
AA |
60.6% |
AAA |
9.3% |
| Footnote |
Description |
Footnotea |
Ratings are based on Moody’s Investors Service, Inc. (“Moody’s”), S&P Global Ratings (“S&P”) or Fitch Ratings (“Fitch”). If securities are rated differently by the ratings agencies, the highest rating is applied. Moody's ratings are converted to the S&P and Fitch scale with ratings ranging from AAA, being the highest, to D, being the lowest. Ratings of BBB or higher are considered to be investment-grade quality. Holdings designated as “Not Rated” (if any) are not rated by the national ratings agencies stated above. | |
|
| Material Fund Change [Text Block] |
|
|
| Updated Prospectus Phone Number |
1-800-262-1122
|
|
| C000013104 |
|
|
| Shareholder Report [Line Items] |
|
|
| Fund Name |
Eaton Vance Maryland Municipal Income Fund
|
|
| Class Name |
Class A
|
|
| Trading Symbol |
ETMDX
|
|
| Annual or Semi-Annual Statement [Text Block] |
This semi-annual shareholder report contains important information about the Eaton Vance Maryland Municipal Income Fund for the period of September 1, 2025 to February 28, 2026.
|
|
| Additional Information [Text Block] |
You can find additional information about the Fund at www.eatonvance.com/open-end-mutual-fund-documents.php. You can also request this information by contacting us at 1-800-262-1122.
|
|
| Additional Information Phone Number |
1-800-262-1122
|
|
| Additional Information Website |
<span style="box-sizing: border-box; color: rgb(0, 0, 0); display: inline; flex-wrap: nowrap; font-size: 10.6667px; font-weight: 400; grid-area: auto; line-height: 16px; margin: 0px; overflow: visible; text-align: left; text-align-last: auto; white-space-collapse: preserve-breaks;">www.eatonvance.com/open-end-mutual-fund-documents.php</span>
|
|
| Expenses [Text Block] |
What were the Fund costs for the last six months?(based on a hypothetical $10,000 investment)
Table Summary
Class Name |
Costs of a $10,000 investment |
Costs paid as a percentage of a $10,000 investment |
Class A |
$39 |
0.75%Footnote Reference1 |
| Footnote |
Description |
Footnote1 |
Annualized | |
|
| Expenses Paid, Amount |
$ 39
|
|
| Expense Ratio, Percent |
0.75%
|
[4] |
| AssetsNet |
$ 90,620,049
|
|
| Holdings Count | Holding |
107
|
|
| InvestmentCompanyPortfolioTurnover |
32.00%
|
|
| Additional Fund Statistics [Text Block] |
Table Summary
Total Net Assets |
$90,620,049 |
# of Portfolio Holdings |
107 |
Portfolio Turnover Rate |
32% | |
|
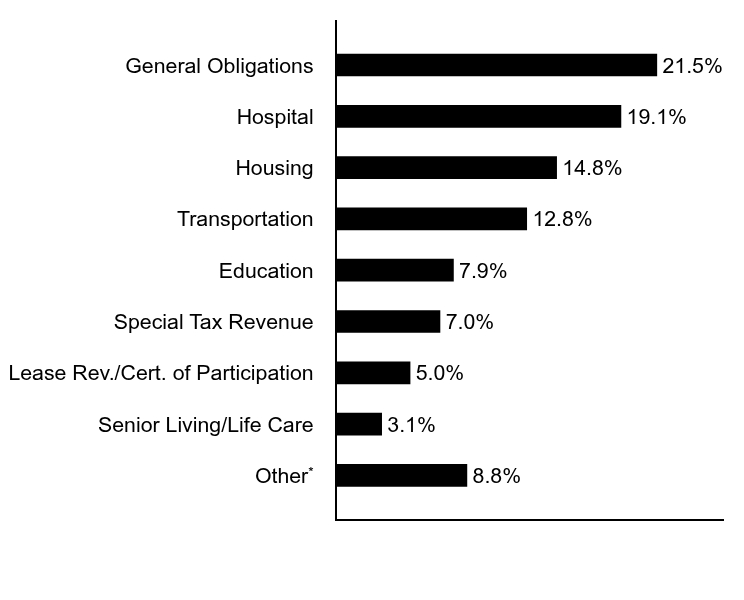
| Holdings [Text Block] |
Sector Allocation (% of total investments)
Table Summary
Value |
Value |
OtherFootnote Reference* |
8.8% |
Senior Living/Life Care |
3.1% |
Lease Rev./Cert. of Participation |
5.0% |
Special Tax Revenue |
7.0% |
Education |
7.9% |
Transportation |
12.8% |
Housing |
14.8% |
Hospital |
19.1% |
General Obligations |
21.5% |
| Footnote |
Description |
Footnote* |
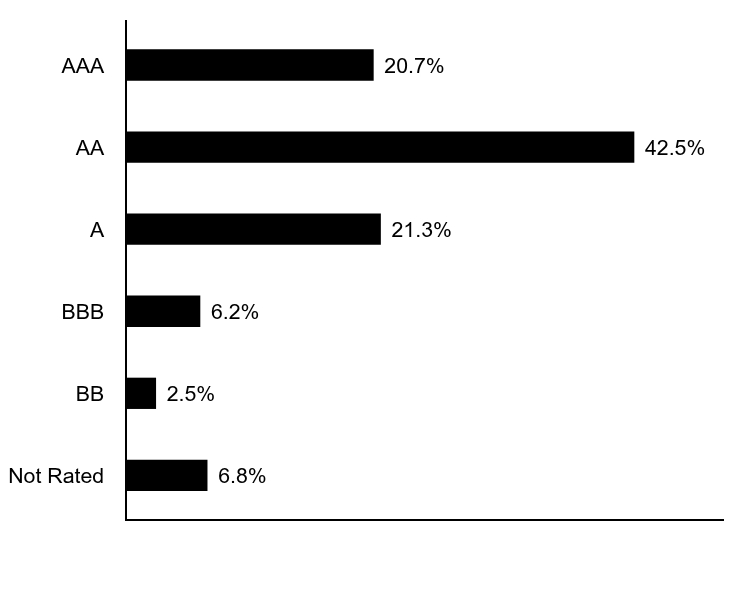
Sectors less than 3% each | Credit Quality (% of total investments)Footnote Referencea
Table Summary
Value |
Value |
Not Rated |
6.8% |
BB |
2.5% |
BBB |
6.2% |
A |
21.3% |
AA |
42.5% |
AAA |
20.7% |
| Footnote |
Description |
Footnotea |
Ratings are based on Moody’s Investors Service, Inc. (“Moody’s”), S&P Global Ratings (“S&P”) or Fitch Ratings (“Fitch”). If securities are rated differently by the ratings agencies, the highest rating is applied. Moody's ratings are converted to the S&P and Fitch scale with ratings ranging from AAA, being the highest, to D, being the lowest. Ratings of BBB or higher are considered to be investment-grade quality. Holdings designated as “Not Rated” (if any) are not rated by the national ratings agencies stated above. | |
|
| Material Fund Change [Text Block] |
|
|
| Updated Prospectus Phone Number |
1-800-262-1122
|
|
| C000013106 |
|
|
| Shareholder Report [Line Items] |
|
|
| Fund Name |
Eaton Vance Maryland Municipal Income Fund
|
|
| Class Name |
Class C
|
|
| Trading Symbol |
ECMDX
|
|
| Annual or Semi-Annual Statement [Text Block] |
This semi-annual shareholder report contains important information about the Eaton Vance Maryland Municipal Income Fund for the period of September 1, 2025 to February 28, 2026.
|
|
| Additional Information [Text Block] |
You can find additional information about the Fund at www.eatonvance.com/open-end-mutual-fund-documents.php. You can also request this information by contacting us at 1-800-262-1122.
|
|
| Additional Information Phone Number |
1-800-262-1122
|
|
| Additional Information Website |
<span style="box-sizing: border-box; color: rgb(0, 0, 0); display: inline; flex-wrap: nowrap; font-size: 10.6667px; font-weight: 400; grid-area: auto; line-height: 16px; margin: 0px; overflow: visible; text-align: left; text-align-last: auto; white-space-collapse: preserve-breaks;">www.eatonvance.com/open-end-mutual-fund-documents.php</span>
|
|
| Expenses [Text Block] |
What were the Fund costs for the last six months?(based on a hypothetical $10,000 investment)
Table Summary
Class Name |
Costs of a $10,000 investment |
Costs paid as a percentage of a $10,000 investment |
Class C |
$77 |
1.50%Footnote Reference1 |
| Footnote |
Description |
Footnote1 |
Annualized | |
|
| Expenses Paid, Amount |
$ 77
|
|
| Expense Ratio, Percent |
1.50%
|
[5] |
| AssetsNet |
$ 90,620,049
|
|
| Holdings Count | Holding |
107
|
|
| InvestmentCompanyPortfolioTurnover |
32.00%
|
|
| Additional Fund Statistics [Text Block] |
Table Summary
Total Net Assets |
$90,620,049 |
# of Portfolio Holdings |
107 |
Portfolio Turnover Rate |
32% | |
|
| Holdings [Text Block] |
Sector Allocation (% of total investments)
Table Summary
Value |
Value |
OtherFootnote Reference* |
8.8% |
Senior Living/Life Care |
3.1% |
Lease Rev./Cert. of Participation |
5.0% |
Special Tax Revenue |
7.0% |
Education |
7.9% |
Transportation |
12.8% |
Housing |
14.8% |
Hospital |
19.1% |
General Obligations |
21.5% |
| Footnote |
Description |
Footnote* |
Sectors less than 3% each | Credit Quality (% of total investments)Footnote Referencea
Table Summary
Value |
Value |
Not Rated |
6.8% |
BB |
2.5% |
BBB |
6.2% |
A |
21.3% |
AA |
42.5% |
AAA |
20.7% |
| Footnote |
Description |
Footnotea |
Ratings are based on Moody’s Investors Service, Inc. (“Moody’s”), S&P Global Ratings (“S&P”) or Fitch Ratings (“Fitch”). If securities are rated differently by the ratings agencies, the highest rating is applied. Moody's ratings are converted to the S&P and Fitch scale with ratings ranging from AAA, being the highest, to D, being the lowest. Ratings of BBB or higher are considered to be investment-grade quality. Holdings designated as “Not Rated” (if any) are not rated by the national ratings agencies stated above. | |
|
| Material Fund Change [Text Block] |
|
|
| Updated Prospectus Phone Number |
1-800-262-1122
|
|
| C000063947 |
|
|
| Shareholder Report [Line Items] |
|
|
| Fund Name |
Eaton Vance Maryland Municipal Income Fund
|
|
| Class Name |
Class I
|
|
| Trading Symbol |
EIMDX
|
|
| Annual or Semi-Annual Statement [Text Block] |
This semi-annual shareholder report contains important information about the Eaton Vance Maryland Municipal Income Fund for the period of September 1, 2025 to February 28, 2026.
|
|
| Additional Information [Text Block] |
You can find additional information about the Fund at www.eatonvance.com/open-end-mutual-fund-documents.php. You can also request this information by contacting us at 1-800-262-1122.
|
|
| Additional Information Phone Number |
1-800-262-1122
|
|
| Additional Information Website |
<span style="box-sizing: border-box; color: rgb(0, 0, 0); display: inline; flex-wrap: nowrap; font-size: 10.6667px; font-weight: 400; grid-area: auto; line-height: 16px; margin: 0px; overflow: visible; text-align: left; text-align-last: auto; white-space-collapse: preserve-breaks;">www.eatonvance.com/open-end-mutual-fund-documents.php</span>
|
|
| Expenses [Text Block] |
What were the Fund costs for the last six months?(based on a hypothetical $10,000 investment)
Table Summary
Class Name |
Costs of a $10,000 investment |
Costs paid as a percentage of a $10,000 investment |
Class I |
$28 |
0.55%Footnote Reference1 |
| Footnote |
Description |
Footnote1 |
Annualized | |
|
| Expenses Paid, Amount |
$ 28
|
|
| Expense Ratio, Percent |
0.55%
|
[6] |
| AssetsNet |
$ 90,620,049
|
|
| Holdings Count | Holding |
107
|
|
| InvestmentCompanyPortfolioTurnover |
32.00%
|
|
| Additional Fund Statistics [Text Block] |
Table Summary
Total Net Assets |
$90,620,049 |
# of Portfolio Holdings |
107 |
Portfolio Turnover Rate |
32% | |
|
| Holdings [Text Block] |
Sector Allocation (% of total investments)
Table Summary
Value |
Value |
OtherFootnote Reference* |
8.8% |
Senior Living/Life Care |
3.1% |
Lease Rev./Cert. of Participation |
5.0% |
Special Tax Revenue |
7.0% |
Education |
7.9% |
Transportation |
12.8% |
Housing |
14.8% |
Hospital |
19.1% |
General Obligations |
21.5% |
| Footnote |
Description |
Footnote* |
Sectors less than 3% each | Credit Quality (% of total investments)Footnote Referencea
Table Summary
Value |
Value |
Not Rated |
6.8% |
BB |
2.5% |
BBB |
6.2% |
A |
21.3% |
AA |
42.5% |
AAA |
20.7% |
| Footnote |
Description |
Footnotea |
Ratings are based on Moody’s Investors Service, Inc. (“Moody’s”), S&P Global Ratings (“S&P”) or Fitch Ratings (“Fitch”). If securities are rated differently by the ratings agencies, the highest rating is applied. Moody's ratings are converted to the S&P and Fitch scale with ratings ranging from AAA, being the highest, to D, being the lowest. Ratings of BBB or higher are considered to be investment-grade quality. Holdings designated as “Not Rated” (if any) are not rated by the national ratings agencies stated above. | |
|
| Material Fund Change [Text Block] |
|
|
| Updated Prospectus Phone Number |
1-800-262-1122
|
|
| C000013120 |
|
|
| Shareholder Report [Line Items] |
|
|
| Fund Name |
Eaton Vance Missouri Municipal Income Fund
|
|
| Class Name |
Class A
|
|
| Trading Symbol |
ETMOX
|
|
| Annual or Semi-Annual Statement [Text Block] |
This semi-annual shareholder report contains important information about the Eaton Vance Missouri Municipal Income Fund for the period of September 1, 2025 to February 28, 2026.
|
|
| Additional Information [Text Block] |
You can find additional information about the Fund at www.eatonvance.com/open-end-mutual-fund-documents.php. You can also request this information by contacting us at 1-800-262-1122.
|
|
| Additional Information Phone Number |
1-800-262-1122
|
|
| Additional Information Website |
<span style="box-sizing: border-box; color: rgb(0, 0, 0); display: inline; flex-wrap: nowrap; font-size: 10.6667px; font-weight: 400; grid-area: auto; line-height: 16px; margin: 0px; overflow: visible; text-align: left; text-align-last: auto; white-space-collapse: preserve-breaks;">www.eatonvance.com/open-end-mutual-fund-documents.php</span>
|
|
| Expenses [Text Block] |
What were the Fund costs for the last six months?(based on a hypothetical $10,000 investment)
Table Summary
Class Name |
Costs of a $10,000 investment |
Costs paid as a percentage of a $10,000 investment |
Class A |
$37 |
0.73%Footnote Reference1 |
| Footnote |
Description |
Footnote1 |
Annualized | |
|
| Expenses Paid, Amount |
$ 37
|
|
| Expense Ratio, Percent |
0.73%
|
[7] |
| AssetsNet |
$ 96,548,207
|
|
| Holdings Count | Holding |
101
|
|
| InvestmentCompanyPortfolioTurnover |
23.00%
|
|
| Additional Fund Statistics [Text Block] |
Table Summary
Total Net Assets |
$96,548,207 |
# of Portfolio Holdings |
101 |
Portfolio Turnover Rate |
23% | |
|
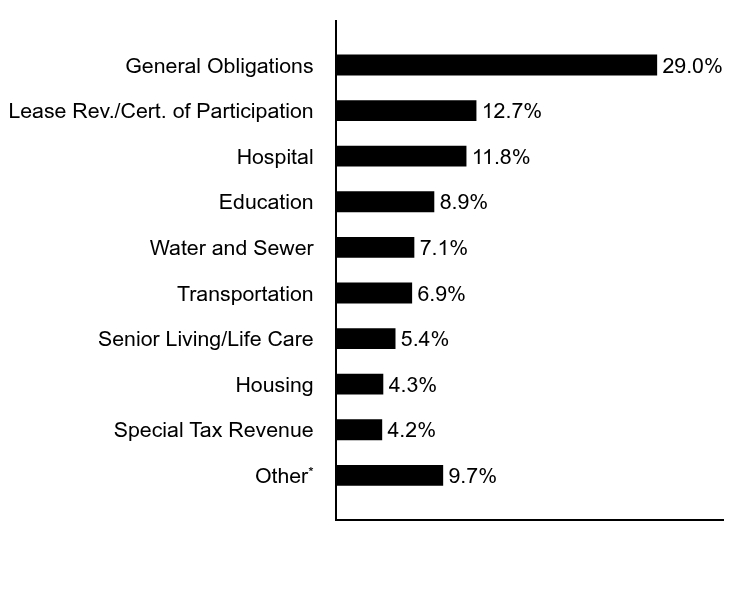
| Holdings [Text Block] |
Sector Allocation (% of total investments)
Table Summary
Value |
Value |
OtherFootnote Reference* |
9.7% |
Special Tax Revenue |
4.2% |
Housing |
4.3% |
Senior Living/Life Care |
5.4% |
Transportation |
6.9% |
Water and Sewer |
7.1% |
Education |
8.9% |
Hospital |
11.8% |
Lease Rev./Cert. of Participation |
12.7% |
General Obligations |
29.0% |
| Footnote |
Description |
Footnote* |
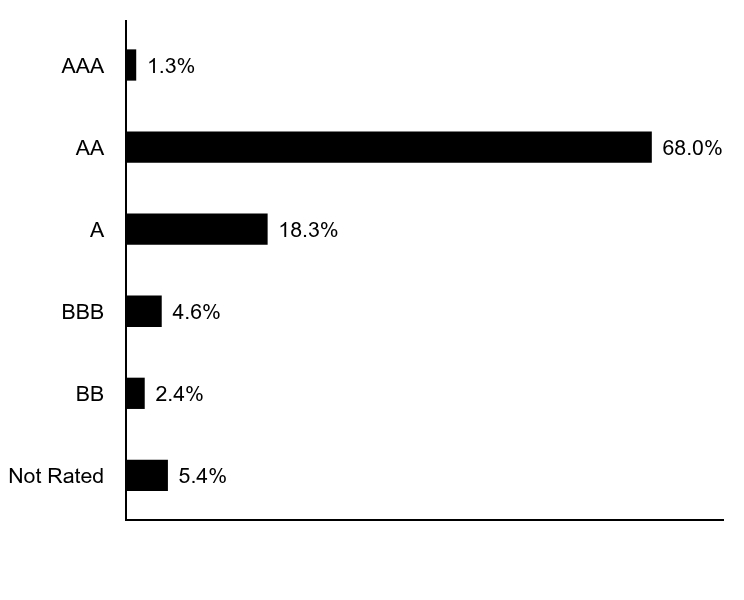
Sectors less than 3% each | Credit Quality (% of total investments)Footnote Referencea
Table Summary
Value |
Value |
Not Rated |
5.4% |
BB |
2.4% |
BBB |
4.6% |
A |
18.3% |
AA |
68.0% |
AAA |
1.3% |
| Footnote |
Description |
Footnotea |
Ratings are based on Moody’s Investors Service, Inc. (“Moody’s”), S&P Global Ratings (“S&P”) or Fitch Ratings (“Fitch”). If securities are rated differently by the ratings agencies, the highest rating is applied. Moody's ratings are converted to the S&P and Fitch scale with ratings ranging from AAA, being the highest, to D, being the lowest. Ratings of BBB or higher are considered to be investment-grade quality. Holdings designated as “Not Rated” (if any) are not rated by the national ratings agencies stated above. | |
|
| Material Fund Change [Text Block] |
|
|
| Updated Prospectus Phone Number |
1-800-262-1122
|
|
| C000013122 |
|
|
| Shareholder Report [Line Items] |
|
|
| Fund Name |
Eaton Vance Missouri Municipal Income Fund
|
|
| Class Name |
Class C
|
|
| Trading Symbol |
ECMOX
|
|
| Annual or Semi-Annual Statement [Text Block] |
This semi-annual shareholder report contains important information about the Eaton Vance Missouri Municipal Income Fund for the period of September 1, 2025 to February 28, 2026.
|
|
| Additional Information [Text Block] |
You can find additional information about the Fund at www.eatonvance.com/open-end-mutual-fund-documents.php. You can also request this information by contacting us at 1-800-262-1122.
|
|
| Additional Information Phone Number |
1-800-262-1122
|
|
| Additional Information Website |
<span style="box-sizing: border-box; color: rgb(0, 0, 0); display: inline; flex-wrap: nowrap; font-size: 10.6667px; font-weight: 400; grid-area: auto; line-height: 16px; margin: 0px; overflow: visible; text-align: left; text-align-last: auto; white-space-collapse: preserve-breaks;">www.eatonvance.com/open-end-mutual-fund-documents.php</span>
|
|
| Expenses [Text Block] |
What were the Fund costs for the last six months?(based on a hypothetical $10,000 investment)
Table Summary
Class Name |
Costs of a $10,000 investment |
Costs paid as a percentage of a $10,000 investment |
Class C |
$76 |
1.48%Footnote Reference1 |
| Footnote |
Description |
Footnote1 |
Annualized | |
|
| Expenses Paid, Amount |
$ 76
|
|
| Expense Ratio, Percent |
1.48%
|
[8] |
| AssetsNet |
$ 96,548,207
|
|
| Holdings Count | Holding |
101
|
|
| InvestmentCompanyPortfolioTurnover |
23.00%
|
|
| Additional Fund Statistics [Text Block] |
Table Summary
Total Net Assets |
$96,548,207 |
# of Portfolio Holdings |
101 |
Portfolio Turnover Rate |
23% | |
|
| Holdings [Text Block] |
Sector Allocation (% of total investments)
Table Summary
Value |
Value |
OtherFootnote Reference* |
9.7% |
Special Tax Revenue |
4.2% |
Housing |
4.3% |
Senior Living/Life Care |
5.4% |
Transportation |
6.9% |
Water and Sewer |
7.1% |
Education |
8.9% |
Hospital |
11.8% |
Lease Rev./Cert. of Participation |
12.7% |
General Obligations |
29.0% |
| Footnote |
Description |
Footnote* |
Sectors less than 3% each | Credit Quality (% of total investments)Footnote Referencea
Table Summary
Value |
Value |
Not Rated |
5.4% |
BB |
2.4% |
BBB |
4.6% |
A |
18.3% |
AA |
68.0% |
AAA |
1.3% |
| Footnote |
Description |
Footnotea |
Ratings are based on Moody’s Investors Service, Inc. (“Moody’s”), S&P Global Ratings (“S&P”) or Fitch Ratings (“Fitch”). If securities are rated differently by the ratings agencies, the highest rating is applied. Moody's ratings are converted to the S&P and Fitch scale with ratings ranging from AAA, being the highest, to D, being the lowest. Ratings of BBB or higher are considered to be investment-grade quality. Holdings designated as “Not Rated” (if any) are not rated by the national ratings agencies stated above. | |
|
| Material Fund Change [Text Block] |
|
|
| Updated Prospectus Phone Number |
1-800-262-1122
|
|
| C000092719 |
|
|
| Shareholder Report [Line Items] |
|
|
| Fund Name |
Eaton Vance Missouri Municipal Income Fund
|
|
| Class Name |
Class I
|
|
| Trading Symbol |
EIMOX
|
|
| Annual or Semi-Annual Statement [Text Block] |
This semi-annual shareholder report contains important information about the Eaton Vance Missouri Municipal Income Fund for the period of September 1, 2025 to February 28, 2026.
|
|
| Additional Information [Text Block] |
You can find additional information about the Fund at www.eatonvance.com/open-end-mutual-fund-documents.php. You can also request this information by contacting us at 1-800-262-1122.
|
|
| Additional Information Phone Number |
1-800-262-1122
|
|
| Additional Information Website |
<span style="box-sizing: border-box; color: rgb(0, 0, 0); display: inline; flex-wrap: nowrap; font-size: 10.6667px; font-weight: 400; grid-area: auto; line-height: 16px; margin: 0px; overflow: visible; text-align: left; text-align-last: auto; white-space-collapse: preserve-breaks;">www.eatonvance.com/open-end-mutual-fund-documents.php</span>
|
|
| Expenses [Text Block] |
What were the Fund costs for the last six months?(based on a hypothetical $10,000 investment)
Table Summary
Class Name |
Costs of a $10,000 investment |
Costs paid as a percentage of a $10,000 investment |
Class I |
$27 |
0.53%Footnote Reference1 |
| Footnote |
Description |
Footnote1 |
Annualized | |
|
| Expenses Paid, Amount |
$ 27
|
|
| Expense Ratio, Percent |
0.53%
|
[9] |
| AssetsNet |
$ 96,548,207
|
|
| Holdings Count | Holding |
101
|
|
| InvestmentCompanyPortfolioTurnover |
23.00%
|
|
| Additional Fund Statistics [Text Block] |
Table Summary
Total Net Assets |
$96,548,207 |
# of Portfolio Holdings |
101 |
Portfolio Turnover Rate |
23% | |
|
| Holdings [Text Block] |
Sector Allocation (% of total investments)
Table Summary
Value |
Value |
OtherFootnote Reference* |
9.7% |
Special Tax Revenue |
4.2% |
Housing |
4.3% |
Senior Living/Life Care |
5.4% |
Transportation |
6.9% |
Water and Sewer |
7.1% |
Education |
8.9% |
Hospital |
11.8% |
Lease Rev./Cert. of Participation |
12.7% |
General Obligations |
29.0% |
| Footnote |
Description |
Footnote* |
Sectors less than 3% each | Credit Quality (% of total investments)Footnote Referencea
Table Summary
Value |
Value |
Not Rated |
5.4% |
BB |
2.4% |
BBB |
4.6% |
A |
18.3% |
AA |
68.0% |
AAA |
1.3% |
| Footnote |
Description |
Footnotea |
Ratings are based on Moody’s Investors Service, Inc. (“Moody’s”), S&P Global Ratings (“S&P”) or Fitch Ratings (“Fitch”). If securities are rated differently by the ratings agencies, the highest rating is applied. Moody's ratings are converted to the S&P and Fitch scale with ratings ranging from AAA, being the highest, to D, being the lowest. Ratings of BBB or higher are considered to be investment-grade quality. Holdings designated as “Not Rated” (if any) are not rated by the national ratings agencies stated above. | |
|
| Material Fund Change [Text Block] |
|
|
| Updated Prospectus Phone Number |
1-800-262-1122
|
|
| C000013136 |
|
|
| Shareholder Report [Line Items] |
|
|
| Fund Name |
Eaton Vance North Carolina Municipal Income Fund
|
|
| Class Name |
Class A
|
|
| Trading Symbol |
ETNCX
|
|
| Annual or Semi-Annual Statement [Text Block] |
This semi-annual shareholder report contains important information about the Eaton Vance North Carolina Municipal Income Fund for the period of September 1, 2025 to February 28, 2026.
|
|
| Additional Information [Text Block] |
You can find additional information about the Fund at www.eatonvance.com/open-end-mutual-fund-documents.php. You can also request this information by contacting us at 1-800-262-1122.
|
|
| Additional Information Phone Number |
1-800-262-1122
|
|
| Additional Information Website |
<span style="box-sizing: border-box; color: rgb(0, 0, 0); display: inline; flex-wrap: nowrap; font-size: 10.6667px; font-weight: 400; grid-area: auto; line-height: 16px; margin: 0px; overflow: visible; text-align: left; text-align-last: auto; white-space-collapse: preserve-breaks;">www.eatonvance.com/open-end-mutual-fund-documents.php</span>
|
|
| Expenses [Text Block] |
What were the Fund costs for the last six months?(based on a hypothetical $10,000 investment)
Table Summary
Class Name |
Costs of a $10,000 investment |
Costs paid as a percentage of a $10,000 investment |
Class A |
$36 |
0.71%Footnote Reference1 |
| Footnote |
Description |
Footnote1 |
Annualized | |
|
| Expenses Paid, Amount |
$ 36
|
|
| Expense Ratio, Percent |
0.71%
|
[10] |
| AssetsNet |
$ 260,794,336
|
|
| Holdings Count | Holding |
223
|
|
| InvestmentCompanyPortfolioTurnover |
38.00%
|
|
| Additional Fund Statistics [Text Block] |
Table Summary
Total Net Assets |
$260,794,336 |
# of Portfolio Holdings |
223 |
Portfolio Turnover Rate |
38% | |
|
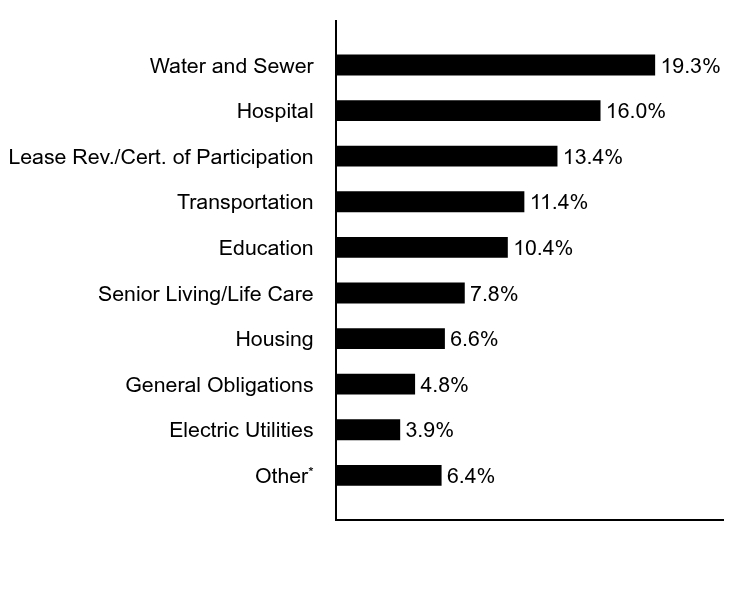
| Holdings [Text Block] |
Sector Allocation (% of total investments)
Table Summary
Value |
Value |
OtherFootnote Reference* |
6.4% |
Electric Utilities |
3.9% |
General Obligations |
4.8% |
Housing |
6.6% |
Senior Living/Life Care |
7.8% |
Education |
10.4% |
Transportation |
11.4% |
Lease Rev./Cert. of Participation |
13.4% |
Hospital |
16.0% |
Water and Sewer |
19.3% |
| Footnote |
Description |
Footnote* |
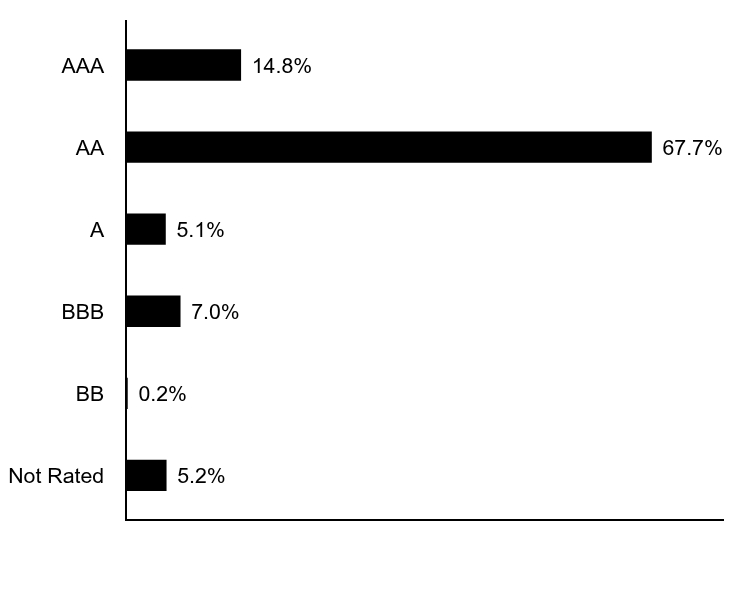
Sectors less than 3% each | Credit Quality (% of total investments)Footnote Referencea
Table Summary
Value |
Value |
Not Rated |
5.2% |
BB |
0.2% |
BBB |
7.0% |
A |
5.1% |
AA |
67.7% |
AAA |
14.8% |
| Footnote |
Description |
Footnotea |
Ratings are based on Moody’s Investors Service, Inc. (“Moody’s”), S&P Global Ratings (“S&P”) or Fitch Ratings (“Fitch”). If securities are rated differently by the ratings agencies, the highest rating is applied. Moody's ratings are converted to the S&P and Fitch scale with ratings ranging from AAA, being the highest, to D, being the lowest. Ratings of BBB or higher are considered to be investment-grade quality. Holdings designated as “Not Rated” (if any) are not rated by the national ratings agencies stated above. | |
|
| Material Fund Change [Text Block] |
|
|
| Updated Prospectus Phone Number |
1-800-262-1122
|
|
| C000013138 |
|
|
| Shareholder Report [Line Items] |
|
|
| Fund Name |
Eaton Vance North Carolina Municipal Income Fund
|
|
| Class Name |
Class C
|
|
| Trading Symbol |
ECNCX
|
|
| Annual or Semi-Annual Statement [Text Block] |
This semi-annual shareholder report contains important information about the Eaton Vance North Carolina Municipal Income Fund for the period of September 1, 2025 to February 28, 2026.
|
|
| Additional Information [Text Block] |
You can find additional information about the Fund at www.eatonvance.com/open-end-mutual-fund-documents.php. You can also request this information by contacting us at 1-800-262-1122.
|
|
| Additional Information Phone Number |
1-800-262-1122
|
|
| Additional Information Website |
<span style="box-sizing: border-box; color: rgb(0, 0, 0); display: inline; flex-wrap: nowrap; font-size: 10.6667px; font-weight: 400; grid-area: auto; line-height: 16px; margin: 0px; overflow: visible; text-align: left; text-align-last: auto; white-space-collapse: preserve-breaks;">www.eatonvance.com/open-end-mutual-fund-documents.php</span>
|
|
| Expenses [Text Block] |
What were the Fund costs for the last six months?(based on a hypothetical $10,000 investment)
Table Summary
Class Name |
Costs of a $10,000 investment |
Costs paid as a percentage of a $10,000 investment |
Class C |
$75 |
1.46%Footnote Reference1 |
| Footnote |
Description |
Footnote1 |
Annualized | |
|
| Expenses Paid, Amount |
$ 75
|
|
| Expense Ratio, Percent |
1.46%
|
[11] |
| AssetsNet |
$ 260,794,336
|
|
| Holdings Count | Holding |
223
|
|
| InvestmentCompanyPortfolioTurnover |
38.00%
|
|
| Additional Fund Statistics [Text Block] |
Table Summary
Total Net Assets |
$260,794,336 |
# of Portfolio Holdings |
223 |
Portfolio Turnover Rate |
38% | |
|
| Holdings [Text Block] |
Sector Allocation (% of total investments)
Table Summary
Value |
Value |
OtherFootnote Reference* |
6.4% |
Electric Utilities |
3.9% |
General Obligations |
4.8% |
Housing |
6.6% |
Senior Living/Life Care |
7.8% |
Education |
10.4% |
Transportation |
11.4% |
Lease Rev./Cert. of Participation |
13.4% |
Hospital |
16.0% |
Water and Sewer |
19.3% |
| Footnote |
Description |
Footnote* |
Sectors less than 3% each | Credit Quality (% of total investments)Footnote Referencea
Table Summary
Value |
Value |
Not Rated |
5.2% |
BB |
0.2% |
BBB |
7.0% |
A |
5.1% |
AA |
67.7% |
AAA |
14.8% |
| Footnote |
Description |
Footnotea |
Ratings are based on Moody’s Investors Service, Inc. (“Moody’s”), S&P Global Ratings (“S&P”) or Fitch Ratings (“Fitch”). If securities are rated differently by the ratings agencies, the highest rating is applied. Moody's ratings are converted to the S&P and Fitch scale with ratings ranging from AAA, being the highest, to D, being the lowest. Ratings of BBB or higher are considered to be investment-grade quality. Holdings designated as “Not Rated” (if any) are not rated by the national ratings agencies stated above. | |
|
| Material Fund Change [Text Block] |
|
|
| Updated Prospectus Phone Number |
1-800-262-1122
|
|
| C000063950 |
|
|
| Shareholder Report [Line Items] |
|
|
| Fund Name |
Eaton Vance North Carolina Municipal Income Fund
|
|
| Class Name |
Class I
|
|
| Trading Symbol |
EINCX
|
|
| Annual or Semi-Annual Statement [Text Block] |
This semi-annual shareholder report contains important information about the Eaton Vance North Carolina Municipal Income Fund for the period of September 1, 2025 to February 28, 2026.
|
|
| Additional Information [Text Block] |
You can find additional information about the Fund at www.eatonvance.com/open-end-mutual-fund-documents.php. You can also request this information by contacting us at 1-800-262-1122.
|
|
| Additional Information Phone Number |
1-800-262-1122
|
|
| Additional Information Website |
<span style="box-sizing: border-box; color: rgb(0, 0, 0); display: inline; flex-wrap: nowrap; font-size: 10.6667px; font-weight: 400; grid-area: auto; line-height: 16px; margin: 0px; overflow: visible; text-align: left; text-align-last: auto; white-space-collapse: preserve-breaks;">www.eatonvance.com/open-end-mutual-fund-documents.php</span>
|
|
| Expenses [Text Block] |
What were the Fund costs for the last six months?(based on a hypothetical $10,000 investment)
Table Summary
Class Name |
Costs of a $10,000 investment |
Costs paid as a percentage of a $10,000 investment |
Class I |
$26 |
0.51%Footnote Reference1 |
| Footnote |
Description |
Footnote1 |
Annualized | |
|
| Expenses Paid, Amount |
$ 26
|
|
| Expense Ratio, Percent |
0.51%
|
[12] |
| AssetsNet |
$ 260,794,336
|
|
| Holdings Count | Holding |
223
|
|
| InvestmentCompanyPortfolioTurnover |
38.00%
|
|
| Additional Fund Statistics [Text Block] |
Table Summary
Total Net Assets |
$260,794,336 |
# of Portfolio Holdings |
223 |
Portfolio Turnover Rate |
38% | |
|
| Holdings [Text Block] |
Sector Allocation (% of total investments)
Table Summary
Value |
Value |
OtherFootnote Reference* |
6.4% |
Electric Utilities |
3.9% |
General Obligations |
4.8% |
Housing |
6.6% |
Senior Living/Life Care |
7.8% |
Education |
10.4% |
Transportation |
11.4% |
Lease Rev./Cert. of Participation |
13.4% |
Hospital |
16.0% |
Water and Sewer |
19.3% |
| Footnote |
Description |
Footnote* |
Sectors less than 3% each | Credit Quality (% of total investments)Footnote Referencea
Table Summary
Value |
Value |
Not Rated |
5.2% |
BB |
0.2% |
BBB |
7.0% |
A |
5.1% |
AA |
67.7% |
AAA |
14.8% |
| Footnote |
Description |
Footnotea |
Ratings are based on Moody’s Investors Service, Inc. (“Moody’s”), S&P Global Ratings (“S&P”) or Fitch Ratings (“Fitch”). If securities are rated differently by the ratings agencies, the highest rating is applied. Moody's ratings are converted to the S&P and Fitch scale with ratings ranging from AAA, being the highest, to D, being the lowest. Ratings of BBB or higher are considered to be investment-grade quality. Holdings designated as “Not Rated” (if any) are not rated by the national ratings agencies stated above. | |
|
| Material Fund Change [Text Block] |
|
|
| Updated Prospectus Phone Number |
1-800-262-1122
|
|
| C000013142 |
|
|
| Shareholder Report [Line Items] |
|
|
| Fund Name |
Eaton Vance Oregon Municipal Income Fund
|
|
| Class Name |
Class A
|
|
| Trading Symbol |
ETORX
|
|
| Annual or Semi-Annual Statement [Text Block] |
This semi-annual shareholder report contains important information about the Eaton Vance Oregon Municipal Income Fund for the period of September 1, 2025 to February 28, 2026.
|
|
| Additional Information [Text Block] |
You can find additional information about the Fund at www.eatonvance.com/open-end-mutual-fund-documents.php. You can also request this information by contacting us at 1-800-262-1122.
|
|
| Additional Information Phone Number |
1-800-262-1122
|
|
| Additional Information Website |
<span style="box-sizing: border-box; color: rgb(0, 0, 0); display: inline; flex-wrap: nowrap; font-size: 10.6667px; font-weight: 400; grid-area: auto; line-height: 16px; margin: 0px; overflow: visible; text-align: left; text-align-last: auto; white-space-collapse: preserve-breaks;">www.eatonvance.com/open-end-mutual-fund-documents.php</span>
|
|
| Expenses [Text Block] |
What were the Fund costs for the last six months?(based on a hypothetical $10,000 investment)
Table Summary
Class Name |
Costs of a $10,000 investment |
Costs paid as a percentage of a $10,000 investment |
Class A |
$36 |
0.70%Footnote Reference1 |
| Footnote |
Description |
Footnote1 |
Annualized | |
|
| Expenses Paid, Amount |
$ 36
|
|
| Expense Ratio, Percent |
0.70%
|
[13] |
| AssetsNet |
$ 260,890,012
|
|
| Holdings Count | Holding |
175
|
|
| InvestmentCompanyPortfolioTurnover |
20.00%
|
|
| Additional Fund Statistics [Text Block] |
Table Summary
Total Net Assets |
$260,890,012 |
# of Portfolio Holdings |
175 |
Portfolio Turnover Rate |
20% | |
|
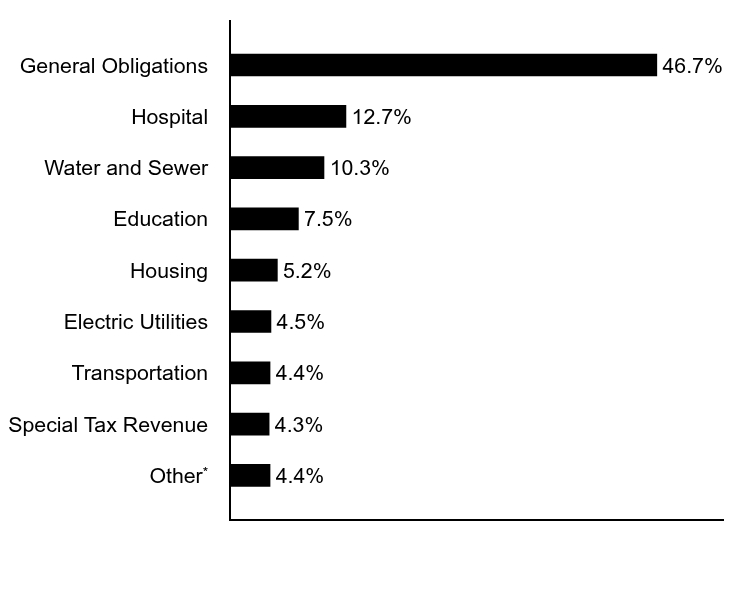
| Holdings [Text Block] |
Sector Allocation (% of total investments)
Table Summary
Value |
Value |
OtherFootnote Reference* |
4.4% |
Special Tax Revenue |
4.3% |
Transportation |
4.4% |
Electric Utilities |
4.5% |
Housing |
5.2% |
Education |
7.5% |
Water and Sewer |
10.3% |
Hospital |
12.7% |
General Obligations |
46.7% |
| Footnote |
Description |
Footnote* |
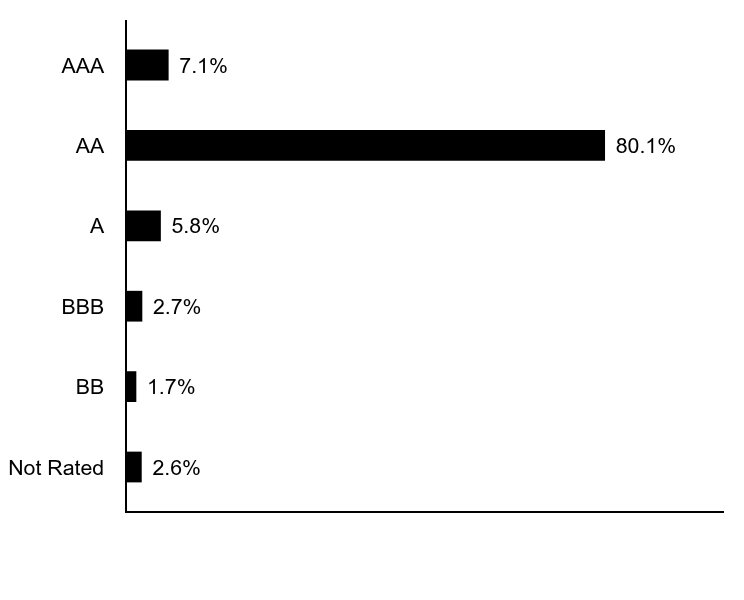
Sectors less than 3% each | Credit Quality (% of total investments)Footnote Referencea
Table Summary
Value |
Value |
Not Rated |
2.6% |
BB |
1.7% |
BBB |
2.7% |
A |
5.8% |
AA |
80.1% |
AAA |
7.1% |
| Footnote |
Description |
Footnotea |
Ratings are based on Moody’s Investors Service, Inc. (“Moody’s”), S&P Global Ratings (“S&P”) or Fitch Ratings (“Fitch”). If securities are rated differently by the ratings agencies, the highest rating is applied. Moody's ratings are converted to the S&P and Fitch scale with ratings ranging from AAA, being the highest, to D, being the lowest. Ratings of BBB or higher are considered to be investment-grade quality. Holdings designated as “Not Rated” (if any) are not rated by the national ratings agencies stated above. | |
|
| Material Fund Change [Text Block] |
|
|
| Updated Prospectus Phone Number |
1-800-262-1122
|
|
| C000013144 |
|
|
| Shareholder Report [Line Items] |
|
|
| Fund Name |
Eaton Vance Oregon Municipal Income Fund
|
|
| Class Name |
Class C
|
|
| Trading Symbol |
ECORX
|
|
| Annual or Semi-Annual Statement [Text Block] |
This semi-annual shareholder report contains important information about the Eaton Vance Oregon Municipal Income Fund for the period of September 1, 2025 to February 28, 2026.
|
|
| Additional Information [Text Block] |
You can find additional information about the Fund at www.eatonvance.com/open-end-mutual-fund-documents.php. You can also request this information by contacting us at 1-800-262-1122.
|
|
| Additional Information Phone Number |
1-800-262-1122
|
|
| Additional Information Website |
<span style="box-sizing: border-box; color: rgb(0, 0, 0); display: inline; flex-wrap: nowrap; font-size: 10.6667px; font-weight: 400; grid-area: auto; line-height: 16px; margin: 0px; overflow: visible; text-align: left; text-align-last: auto; white-space-collapse: preserve-breaks;">www.eatonvance.com/open-end-mutual-fund-documents.php</span>
|
|
| Expenses [Text Block] |
What were the Fund costs for the last six months?(based on a hypothetical $10,000 investment)
Table Summary
Class Name |
Costs of a $10,000 investment |
Costs paid as a percentage of a $10,000 investment |
Class C |
$74 |
1.45%Footnote Reference1 |
| Footnote |
Description |
Footnote1 |
Annualized | |
|
| Expenses Paid, Amount |
$ 74
|
|
| Expense Ratio, Percent |
1.45%
|
[14] |
| AssetsNet |
$ 260,890,012
|
|
| Holdings Count | Holding |
175
|
|
| InvestmentCompanyPortfolioTurnover |
20.00%
|
|
| Additional Fund Statistics [Text Block] |
Table Summary
Total Net Assets |
$260,890,012 |
# of Portfolio Holdings |
175 |
Portfolio Turnover Rate |
20% | |
|
| Holdings [Text Block] |
Sector Allocation (% of total investments)
Table Summary
Value |
Value |
OtherFootnote Reference* |
4.4% |
Special Tax Revenue |
4.3% |
Transportation |
4.4% |
Electric Utilities |
4.5% |
Housing |
5.2% |
Education |
7.5% |
Water and Sewer |
10.3% |
Hospital |
12.7% |
General Obligations |
46.7% |
| Footnote |
Description |
Footnote* |
Sectors less than 3% each | Credit Quality (% of total investments)Footnote Referencea
Table Summary
Value |
Value |
Not Rated |
2.6% |
BB |
1.7% |
BBB |
2.7% |
A |
5.8% |
AA |
80.1% |
AAA |
7.1% |
| Footnote |
Description |
Footnotea |
Ratings are based on Moody’s Investors Service, Inc. (“Moody’s”), S&P Global Ratings (“S&P”) or Fitch Ratings (“Fitch”). If securities are rated differently by the ratings agencies, the highest rating is applied. Moody's ratings are converted to the S&P and Fitch scale with ratings ranging from AAA, being the highest, to D, being the lowest. Ratings of BBB or higher are considered to be investment-grade quality. Holdings designated as “Not Rated” (if any) are not rated by the national ratings agencies stated above. | |
|
| Material Fund Change [Text Block] |
|
|
| Updated Prospectus Phone Number |
1-800-262-1122
|
|
| C000092722 |
|
|
| Shareholder Report [Line Items] |
|
|
| Fund Name |
Eaton Vance Oregon Municipal Income Fund
|
|
| Class Name |
Class I
|
|
| Trading Symbol |
EIORX
|
|
| Annual or Semi-Annual Statement [Text Block] |
This semi-annual shareholder report contains important information about the Eaton Vance Oregon Municipal Income Fund for the period of September 1, 2025 to February 28, 2026.
|
|
| Additional Information [Text Block] |
You can find additional information about the Fund at www.eatonvance.com/open-end-mutual-fund-documents.php. You can also request this information by contacting us at 1-800-262-1122.
|
|
| Additional Information Phone Number |
1-800-262-1122
|
|
| Additional Information Website |
<span style="box-sizing: border-box; color: rgb(0, 0, 0); display: inline; flex-wrap: nowrap; font-size: 10.6667px; font-weight: 400; grid-area: auto; line-height: 16px; margin: 0px; overflow: visible; text-align: left; text-align-last: auto; white-space-collapse: preserve-breaks;">www.eatonvance.com/open-end-mutual-fund-documents.php</span>
|
|
| Expenses [Text Block] |
What were the Fund costs for the last six months?(based on a hypothetical $10,000 investment)
Table Summary
Class Name |
Costs of a $10,000 investment |
Costs paid as a percentage of a $10,000 investment |
Class I |
$26 |
0.50%Footnote Reference1 |
| Footnote |
Description |
Footnote1 |
Annualized | |
|
| Expenses Paid, Amount |
$ 26
|
|
| Expense Ratio, Percent |
0.50%
|
[15] |
| AssetsNet |
$ 260,890,012
|
|
| Holdings Count | Holding |
175
|
|
| InvestmentCompanyPortfolioTurnover |
20.00%
|
|
| Additional Fund Statistics [Text Block] |
Table Summary
Total Net Assets |
$260,890,012 |
# of Portfolio Holdings |
175 |
Portfolio Turnover Rate |
20% | |
|
| Holdings [Text Block] |
Sector Allocation (% of total investments)
Table Summary
Value |
Value |
OtherFootnote Reference* |
4.4% |
Special Tax Revenue |
4.3% |
Transportation |
4.4% |
Electric Utilities |
4.5% |
Housing |
5.2% |
Education |
7.5% |
Water and Sewer |
10.3% |
Hospital |
12.7% |
General Obligations |
46.7% |
| Footnote |
Description |
Footnote* |
Sectors less than 3% each | Credit Quality (% of total investments)Footnote Referencea
Table Summary
Value |
Value |
Not Rated |
2.6% |
BB |
1.7% |
BBB |
2.7% |
A |
5.8% |
AA |
80.1% |
AAA |
7.1% |
| Footnote |
Description |
Footnotea |
Ratings are based on Moody’s Investors Service, Inc. (“Moody’s”), S&P Global Ratings (“S&P”) or Fitch Ratings (“Fitch”). If securities are rated differently by the ratings agencies, the highest rating is applied. Moody's ratings are converted to the S&P and Fitch scale with ratings ranging from AAA, being the highest, to D, being the lowest. Ratings of BBB or higher are considered to be investment-grade quality. Holdings designated as “Not Rated” (if any) are not rated by the national ratings agencies stated above. | |
|
| Material Fund Change [Text Block] |
|
|
| Updated Prospectus Phone Number |
1-800-262-1122
|
|
| C000013151 |
|
|
| Shareholder Report [Line Items] |
|
|
| Fund Name |
Eaton Vance South Carolina Municipal Income Fund
|
|
| Class Name |
Class A
|
|
| Trading Symbol |
EASCX
|
|
| Annual or Semi-Annual Statement [Text Block] |
This semi-annual shareholder report contains important information about the Eaton Vance South Carolina Municipal Income Fund for the period of September 1, 2025 to February 28, 2026.
|
|
| Additional Information [Text Block] |
You can find additional information about the Fund at www.eatonvance.com/open-end-mutual-fund-documents.php. You can also request this information by contacting us at 1-800-262-1122.
|
|
| Additional Information Phone Number |
1-800-262-1122
|
|
| Additional Information Website |
<span style="box-sizing: border-box; color: rgb(0, 0, 0); display: inline; flex-wrap: nowrap; font-size: 10.6667px; font-weight: 400; grid-area: auto; line-height: 16px; margin: 0px; overflow: visible; text-align: left; text-align-last: auto; white-space-collapse: preserve-breaks;">www.eatonvance.com/open-end-mutual-fund-documents.php</span>
|
|
| Expenses [Text Block] |
What were the Fund costs for the last six months?(based on a hypothetical $10,000 investment)
Table Summary
Class Name |
Costs of a $10,000 investment |
Costs paid as a percentage of a $10,000 investment |
Class A |
$37 |
0.72%Footnote Reference1 |
| Footnote |
Description |
Footnote1 |
Annualized | |
|
| Expenses Paid, Amount |
$ 37
|
|
| Expense Ratio, Percent |
0.72%
|
[16] |
| AssetsNet |
$ 240,080,538
|
|
| Holdings Count | Holding |
167
|
|
| InvestmentCompanyPortfolioTurnover |
33.00%
|
|
| Additional Fund Statistics [Text Block] |
Table Summary
Total Net Assets |
$240,080,538 |
# of Portfolio Holdings |
167 |
Portfolio Turnover Rate |
33% | |
|
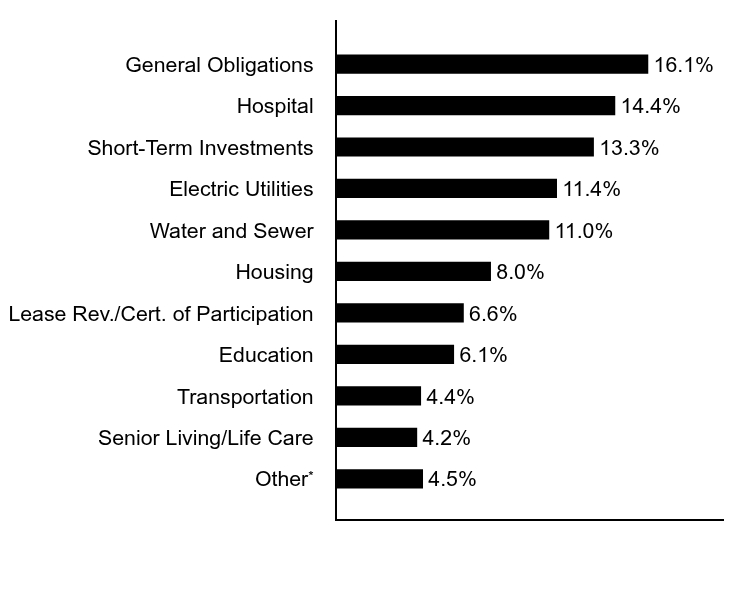
| Holdings [Text Block] |
Sector Allocation (% of total investments)
Table Summary
Value |
Value |
OtherFootnote Reference* |
4.5% |
Senior Living/Life Care |
4.2% |
Transportation |
4.4% |
Education |
6.1% |
Lease Rev./Cert. of Participation |
6.6% |
Housing |
8.0% |
Water and Sewer |
11.0% |
Electric Utilities |
11.4% |
Short-Term Investments |
13.3% |
Hospital |
14.4% |
General Obligations |
16.1% |
| Footnote |
Description |
Footnote* |
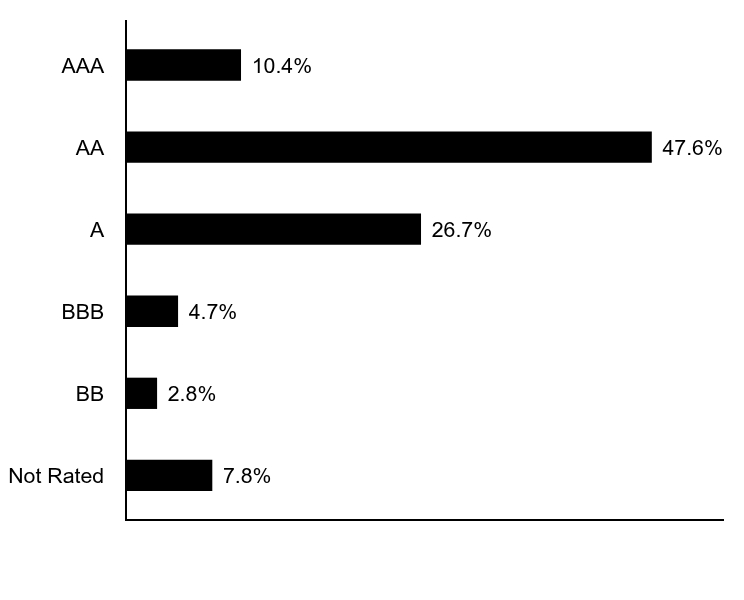
Sectors less than 3% each | Credit Quality (% of total investments)Footnote Referencea,Footnote Referenceb
Table Summary
Value |
Value |
Not Rated |
7.8% |
BB |
2.8% |
BBB |
4.7% |
A |
26.7% |
AA |
47.6% |
AAA |
10.4% |
| Footnote |
Description |
Footnotea |
Ratings are based on Moody’s Investors Service, Inc. (“Moody’s”), S&P Global Ratings (“S&P”) or Fitch Ratings (“Fitch”). If securities are rated differently by the ratings agencies, the highest rating is applied. Moody's ratings are converted to the S&P and Fitch scale with ratings ranging from AAA, being the highest, to D, being the lowest. Ratings of BBB or higher are considered to be investment-grade quality. Holdings designated as “Not Rated” (if any) are not rated by the national ratings agencies stated above. |
Footnoteb |
The chart includes the municipal bonds held by a trust that issues residual interest bonds. | |
|
| Material Fund Change [Text Block] |
|
|
| Updated Prospectus Phone Number |
1-800-262-1122
|
|
| C000013153 |
|
|
| Shareholder Report [Line Items] |
|
|
| Fund Name |
Eaton Vance South Carolina Municipal Income Fund
|
|
| Class Name |
Class C
|
|
| Trading Symbol |
ECSCX
|
|
| Annual or Semi-Annual Statement [Text Block] |
This semi-annual shareholder report contains important information about the Eaton Vance South Carolina Municipal Income Fund for the period of September 1, 2025 to February 28, 2026.
|
|
| Additional Information [Text Block] |
You can find additional information about the Fund at www.eatonvance.com/open-end-mutual-fund-documents.php. You can also request this information by contacting us at 1-800-262-1122.
|
|
| Additional Information Phone Number |
1-800-262-1122
|
|
| Additional Information Website |
<span style="box-sizing: border-box; color: rgb(0, 0, 0); display: inline; flex-wrap: nowrap; font-size: 10.6667px; font-weight: 400; grid-area: auto; line-height: 16px; margin: 0px; overflow: visible; text-align: left; text-align-last: auto; white-space-collapse: preserve-breaks;">www.eatonvance.com/open-end-mutual-fund-documents.php</span>
|
|
| Expenses [Text Block] |
What were the Fund costs for the last six months?(based on a hypothetical $10,000 investment)
Table Summary
Class Name |
Costs of a $10,000 investment |
Costs paid as a percentage of a $10,000 investment |
Class C |
$75 |
1.47%Footnote Reference1 |
| Footnote |
Description |
Footnote1 |
Annualized | |
|
| Expenses Paid, Amount |
$ 75
|
|
| Expense Ratio, Percent |
1.47%
|
[17] |
| AssetsNet |
$ 240,080,538
|
|
| Holdings Count | Holding |
167
|
|
| InvestmentCompanyPortfolioTurnover |
33.00%
|
|
| Additional Fund Statistics [Text Block] |
Table Summary
Total Net Assets |
$240,080,538 |
# of Portfolio Holdings |
167 |
Portfolio Turnover Rate |
33% | |
|
| Holdings [Text Block] |
Sector Allocation (% of total investments)
Table Summary
Value |
Value |
OtherFootnote Reference* |
4.5% |
Senior Living/Life Care |
4.2% |
Transportation |
4.4% |
Education |
6.1% |
Lease Rev./Cert. of Participation |
6.6% |
Housing |
8.0% |
Water and Sewer |
11.0% |
Electric Utilities |
11.4% |
Short-Term Investments |
13.3% |
Hospital |
14.4% |
General Obligations |
16.1% |
| Footnote |
Description |
Footnote* |
Sectors less than 3% each | Credit Quality (% of total investments)Footnote Referencea,Footnote Referenceb
Table Summary
Value |
Value |
Not Rated |
7.8% |
BB |
2.8% |
BBB |
4.7% |
A |
26.7% |
AA |
47.6% |
AAA |
10.4% |
| Footnote |
Description |
Footnotea |
Ratings are based on Moody’s Investors Service, Inc. (“Moody’s”), S&P Global Ratings (“S&P”) or Fitch Ratings (“Fitch”). If securities are rated differently by the ratings agencies, the highest rating is applied. Moody's ratings are converted to the S&P and Fitch scale with ratings ranging from AAA, being the highest, to D, being the lowest. Ratings of BBB or higher are considered to be investment-grade quality. Holdings designated as “Not Rated” (if any) are not rated by the national ratings agencies stated above. |
Footnoteb |
The chart includes the municipal bonds held by a trust that issues residual interest bonds. | |
|
| Material Fund Change [Text Block] |
|
|
| Updated Prospectus Phone Number |
1-800-262-1122
|
|
| C000063952 |
|
|
| Shareholder Report [Line Items] |
|
|
| Fund Name |
Eaton Vance South Carolina Municipal Income Fund
|
|
| Class Name |
Class I
|
|
| Trading Symbol |
EISCX
|
|
| Annual or Semi-Annual Statement [Text Block] |
This semi-annual shareholder report contains important information about the Eaton Vance South Carolina Municipal Income Fund for the period of September 1, 2025 to February 28, 2026.
|
|
| Additional Information [Text Block] |
You can find additional information about the Fund at www.eatonvance.com/open-end-mutual-fund-documents.php. You can also request this information by contacting us at 1-800-262-1122.
|
|
| Additional Information Phone Number |
1-800-262-1122
|
|
| Additional Information Website |
<span style="box-sizing: border-box; color: rgb(0, 0, 0); display: inline; flex-wrap: nowrap; font-size: 10.6667px; font-weight: 400; grid-area: auto; line-height: 16px; margin: 0px; overflow: visible; text-align: left; text-align-last: auto; white-space-collapse: preserve-breaks;">www.eatonvance.com/open-end-mutual-fund-documents.php</span>
|
|
| Expenses [Text Block] |
What were the Fund costs for the last six months?(based on a hypothetical $10,000 investment)
Table Summary
Class Name |
Costs of a $10,000 investment |
Costs paid as a percentage of a $10,000 investment |
Class I |
$27 |
0.52%Footnote Reference1 |
| Footnote |
Description |
Footnote1 |
Annualized | |
|
| Expenses Paid, Amount |
$ 27
|
|
| Expense Ratio, Percent |
0.52%
|
[18] |
| AssetsNet |
$ 240,080,538
|
|
| Holdings Count | Holding |
167
|
|
| InvestmentCompanyPortfolioTurnover |
33.00%
|
|
| Additional Fund Statistics [Text Block] |
Table Summary
Total Net Assets |
$240,080,538 |
# of Portfolio Holdings |
167 |
Portfolio Turnover Rate |
33% | |
|
| Holdings [Text Block] |
Sector Allocation (% of total investments)
Table Summary
Value |
Value |
OtherFootnote Reference* |
4.5% |
Senior Living/Life Care |
4.2% |
Transportation |
4.4% |
Education |
6.1% |
Lease Rev./Cert. of Participation |
6.6% |
Housing |
8.0% |
Water and Sewer |
11.0% |
Electric Utilities |
11.4% |
Short-Term Investments |
13.3% |
Hospital |
14.4% |
General Obligations |
16.1% |
| Footnote |
Description |
Footnote* |
Sectors less than 3% each | Credit Quality (% of total investments)Footnote Referencea,Footnote Referenceb
Table Summary
Value |
Value |
Not Rated |
7.8% |
BB |
2.8% |
BBB |
4.7% |
A |
26.7% |
AA |
47.6% |
AAA |
10.4% |
| Footnote |
Description |
Footnotea |
Ratings are based on Moody’s Investors Service, Inc. (“Moody’s”), S&P Global Ratings (“S&P”) or Fitch Ratings (“Fitch”). If securities are rated differently by the ratings agencies, the highest rating is applied. Moody's ratings are converted to the S&P and Fitch scale with ratings ranging from AAA, being the highest, to D, being the lowest. Ratings of BBB or higher are considered to be investment-grade quality. Holdings designated as “Not Rated” (if any) are not rated by the national ratings agencies stated above. |
Footnoteb |
The chart includes the municipal bonds held by a trust that issues residual interest bonds. | |
|
| Material Fund Change [Text Block] |
|
|
| Updated Prospectus Phone Number |
1-800-262-1122
|
|
| C000013157 |
|
|
| Shareholder Report [Line Items] |
|
|
| Fund Name |
Eaton Vance Virginia Municipal Income Fund
|
|
| Class Name |
Class A
|
|
| Trading Symbol |
ETVAX
|
|
| Annual or Semi-Annual Statement [Text Block] |
This semi-annual shareholder report contains important information about the Eaton Vance Virginia Municipal Income Fund for the period of September 1, 2025 to February 28, 2026.
|
|
| Additional Information [Text Block] |
You can find additional information about the Fund at www.eatonvance.com/open-end-mutual-fund-documents.php. You can also request this information by contacting us at 1-800-262-1122.
|
|
| Additional Information Phone Number |
1-800-262-1122
|
|
| Additional Information Website |
<span style="box-sizing: border-box; color: rgb(0, 0, 0); display: inline; flex-wrap: nowrap; font-size: 10.6667px; font-weight: 400; grid-area: auto; line-height: 16px; margin: 0px; overflow: visible; text-align: left; text-align-last: auto; white-space-collapse: preserve-breaks;">www.eatonvance.com/open-end-mutual-fund-documents.php</span>
|
|
| Expenses [Text Block] |
What were the Fund costs for the last six months?(based on a hypothetical $10,000 investment)
Table Summary
Class Name |
Costs of a $10,000 investment |
Costs paid as a percentage of a $10,000 investment |
Class A |
$39 |
0.75%Footnote Reference1 |
| Footnote |
Description |
Footnote1 |
Annualized | |
|
| Expenses Paid, Amount |
$ 39
|
|
| Expense Ratio, Percent |
0.75%
|
[19] |
| AssetsNet |
$ 73,965,164
|
|
| Holdings Count | Holding |
104
|
|
| InvestmentCompanyPortfolioTurnover |
42.00%
|
|
| Additional Fund Statistics [Text Block] |
Table Summary
Total Net Assets |
$73,965,164 |
# of Portfolio Holdings |
104 |
Portfolio Turnover Rate |
42% | |
|
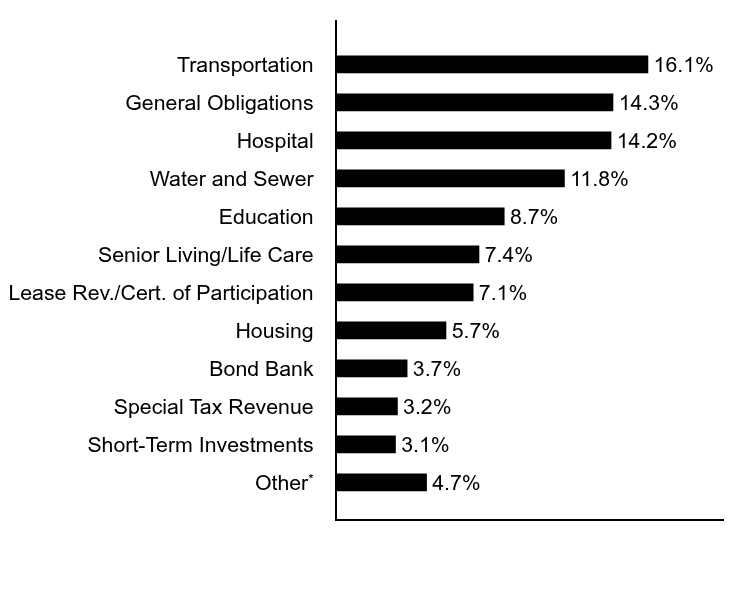
| Holdings [Text Block] |
Sector Allocation (% of total investments)
Table Summary
Value |
Value |
OtherFootnote Reference* |
4.7% |
Short-Term Investments |
3.1% |
Special Tax Revenue |
3.2% |
Bond Bank |
3.7% |
Housing |
5.7% |
Lease Rev./Cert. of Participation |
7.1% |
Senior Living/Life Care |
7.4% |
Education |
8.7% |
Water and Sewer |
11.8% |
Hospital |
14.2% |
General Obligations |
14.3% |
Transportation |
16.1% |
| Footnote |
Description |
Footnote* |
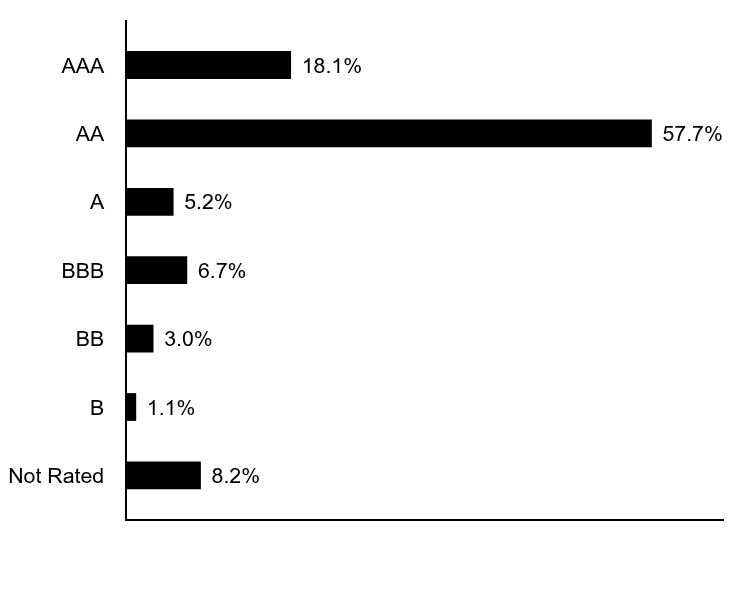
Sectors less than 3% each | Credit Quality (% of total investments)Footnote Referencea
Table Summary
Value |
Value |
Not Rated |
8.2% |
B |
1.1% |
BB |
3.0% |
BBB |
6.7% |
A |
5.2% |
AA |
57.7% |
AAA |
18.1% |
| Footnote |
Description |
Footnotea |
Ratings are based on Moody’s Investors Service, Inc. (“Moody’s”), S&P Global Ratings (“S&P”) or Fitch Ratings (“Fitch”). If securities are rated differently by the ratings agencies, the highest rating is applied. Moody's ratings are converted to the S&P and Fitch scale with ratings ranging from AAA, being the highest, to D, being the lowest. Ratings of BBB or higher are considered to be investment-grade quality. Holdings designated as “Not Rated” (if any) are not rated by the national ratings agencies stated above. | |
|
| Material Fund Change [Text Block] |
|
|
| Updated Prospectus Phone Number |
1-800-262-1122
|
|
| C000013159 |
|
|
| Shareholder Report [Line Items] |
|
|
| Fund Name |
Eaton Vance Virginia Municipal Income Fund
|
|
| Class Name |
Class C
|
|
| Trading Symbol |
ECVAX
|
|
| Annual or Semi-Annual Statement [Text Block] |
This semi-annual shareholder report contains important information about the Eaton Vance Virginia Municipal Income Fund for the period of September 1, 2025 to February 28, 2026.
|
|
| Additional Information [Text Block] |
You can find additional information about the Fund at www.eatonvance.com/open-end-mutual-fund-documents.php. You can also request this information by contacting us at 1-800-262-1122.
|
|
| Additional Information Phone Number |
1-800-262-1122
|
|
| Additional Information Website |
<span style="box-sizing: border-box; color: rgb(0, 0, 0); display: inline; flex-wrap: nowrap; font-size: 10.6667px; font-weight: 400; grid-area: auto; line-height: 16px; margin: 0px; overflow: visible; text-align: left; text-align-last: auto; white-space-collapse: preserve-breaks;">www.eatonvance.com/open-end-mutual-fund-documents.php</span>
|
|
| Expenses [Text Block] |
What were the Fund costs for the last six months?(based on a hypothetical $10,000 investment)
Table Summary
Class Name |
Costs of a $10,000 investment |
Costs paid as a percentage of a $10,000 investment |
Class C |
$77 |
1.50%Footnote Reference1 |
| Footnote |
Description |
Footnote1 |
Annualized | |
|
| Expenses Paid, Amount |
$ 77
|
|
| Expense Ratio, Percent |
1.50%
|
[20] |
| AssetsNet |
$ 73,965,164
|
|
| Holdings Count | Holding |
104
|
|
| InvestmentCompanyPortfolioTurnover |
42.00%
|
|
| Additional Fund Statistics [Text Block] |
Table Summary
Total Net Assets |
$73,965,164 |
# of Portfolio Holdings |
104 |
Portfolio Turnover Rate |
42% | |
|
| Holdings [Text Block] |
Sector Allocation (% of total investments)
Table Summary
Value |
Value |
OtherFootnote Reference* |
4.7% |
Short-Term Investments |
3.1% |
Special Tax Revenue |
3.2% |
Bond Bank |
3.7% |
Housing |
5.7% |
Lease Rev./Cert. of Participation |
7.1% |
Senior Living/Life Care |
7.4% |
Education |
8.7% |
Water and Sewer |
11.8% |
Hospital |
14.2% |
General Obligations |
14.3% |
Transportation |
16.1% |
| Footnote |
Description |
Footnote* |
Sectors less than 3% each | Credit Quality (% of total investments)Footnote Referencea
Table Summary
Value |
Value |
Not Rated |
8.2% |
B |
1.1% |
BB |
3.0% |
BBB |
6.7% |
A |
5.2% |
AA |
57.7% |
AAA |
18.1% |
| Footnote |
Description |
Footnotea |
Ratings are based on Moody’s Investors Service, Inc. (“Moody’s”), S&P Global Ratings (“S&P”) or Fitch Ratings (“Fitch”). If securities are rated differently by the ratings agencies, the highest rating is applied. Moody's ratings are converted to the S&P and Fitch scale with ratings ranging from AAA, being the highest, to D, being the lowest. Ratings of BBB or higher are considered to be investment-grade quality. Holdings designated as “Not Rated” (if any) are not rated by the national ratings agencies stated above. | |
|
| Material Fund Change [Text Block] |
|
|
| Updated Prospectus Phone Number |
1-800-262-1122
|
|
| C000063953 |
|
|
| Shareholder Report [Line Items] |
|
|
| Fund Name |
Eaton Vance Virginia Municipal Income Fund
|
|
| Class Name |
Class I
|
|
| Trading Symbol |
EVAIX
|
|
| Annual or Semi-Annual Statement [Text Block] |
This semi-annual shareholder report contains important information about the Eaton Vance Virginia Municipal Income Fund for the period of September 1, 2025 to February 28, 2026.
|
|
| Additional Information [Text Block] |
You can find additional information about the Fund at www.eatonvance.com/open-end-mutual-fund-documents.php. You can also request this information by contacting us at 1-800-262-1122.
|
|
| Additional Information Phone Number |
1-800-262-1122
|
|
| Additional Information Website |
<span style="box-sizing: border-box; color: rgb(0, 0, 0); display: inline; flex-wrap: nowrap; font-size: 10.6667px; font-weight: 400; grid-area: auto; line-height: 16px; margin: 0px; overflow: visible; text-align: left; text-align-last: auto; white-space-collapse: preserve-breaks;">www.eatonvance.com/open-end-mutual-fund-documents.php</span>
|
|
| Expenses [Text Block] |
What were the Fund costs for the last six months?(based on a hypothetical $10,000 investment)
Table Summary
Class Name |
Costs of a $10,000 investment |
Costs paid as a percentage of a $10,000 investment |
Class I |
$28 |
0.55%Footnote Reference1 |
| Footnote |
Description |
Footnote1 |
Annualized | |
|
| Expenses Paid, Amount |
$ 28
|
|
| Expense Ratio, Percent |
0.55%
|
[21] |
| AssetsNet |
$ 73,965,164
|
|
| Holdings Count | Holding |
104
|
|
| InvestmentCompanyPortfolioTurnover |
42.00%
|
|
| Additional Fund Statistics [Text Block] |
Table Summary
Total Net Assets |
$73,965,164 |
# of Portfolio Holdings |
104 |
Portfolio Turnover Rate |
42% | |
|
| Holdings [Text Block] |
Sector Allocation (% of total investments)
Table Summary
Value |
Value |
OtherFootnote Reference* |
4.7% |
Short-Term Investments |
3.1% |
Special Tax Revenue |
3.2% |
Bond Bank |
3.7% |
Housing |
5.7% |
Lease Rev./Cert. of Participation |
7.1% |
Senior Living/Life Care |
7.4% |
Education |
8.7% |
Water and Sewer |
11.8% |
Hospital |
14.2% |
General Obligations |
14.3% |
Transportation |
16.1% |
| Footnote |
Description |
Footnote* |
Sectors less than 3% each | Credit Quality (% of total investments)Footnote Referencea
Table Summary
Value |
Value |
Not Rated |
8.2% |
B |
1.1% |
BB |
3.0% |
BBB |
6.7% |
A |
5.2% |
AA |
57.7% |
AAA |
18.1% |
| Footnote |
Description |
Footnotea |
Ratings are based on Moody’s Investors Service, Inc. (“Moody’s”), S&P Global Ratings (“S&P”) or Fitch Ratings (“Fitch”). If securities are rated differently by the ratings agencies, the highest rating is applied. Moody's ratings are converted to the S&P and Fitch scale with ratings ranging from AAA, being the highest, to D, being the lowest. Ratings of BBB or higher are considered to be investment-grade quality. Holdings designated as “Not Rated” (if any) are not rated by the national ratings agencies stated above. | |
|
| Material Fund Change [Text Block] |
|
|
| Updated Prospectus Phone Number |
1-800-262-1122
|
|
|
|