UNITED STATES
SECURITIES AND EXCHANGE COMMISSION
Washington, D.C. 20549
Form N-CSR
CERTIFIED SHAREHOLDER REPORT OF REGISTERED
MANAGEMENT INVESTMENT COMPANIES
Investment Company Act File Number: 811-04409
Eaton Vance Municipals Trust
(Exact Name of Registrant as Specified in Charter)
One Post Office Square, Boston, Massachusetts 02109
(Address of Principal Executive Offices)
Deidre E. Walsh
One Post Office Square, Boston, Massachusetts 02109
(Name and Address of Agent for Services)
(617) 482-8260
(Registrant’s Telephone Number)
August 31
Date of Fiscal Year End
February 28, 2026
Date of Reporting Period
Item 1. Reports to Stockholders
(a)
Eaton Vance Georgia Municipal Income Fund
Class A ETGAX
What were the Fund costs for the last six months?
(based on a hypothetical $10,000 investment)
Class Name |
Costs of a $10,000 investment |
Costs paid as a percentage of a $10,000 investment |
|---|---|---|
Class A |
$ |
| Footnote | Description |
Footnote1 |
Key Fund Statistics
Total Net Assets |
$ |
|---|---|
# of Portfolio Holdings |
|
Portfolio Turnover Rate |
What did the Fund invest in?
The following tables reflect what the Fund invested in as of the report date.
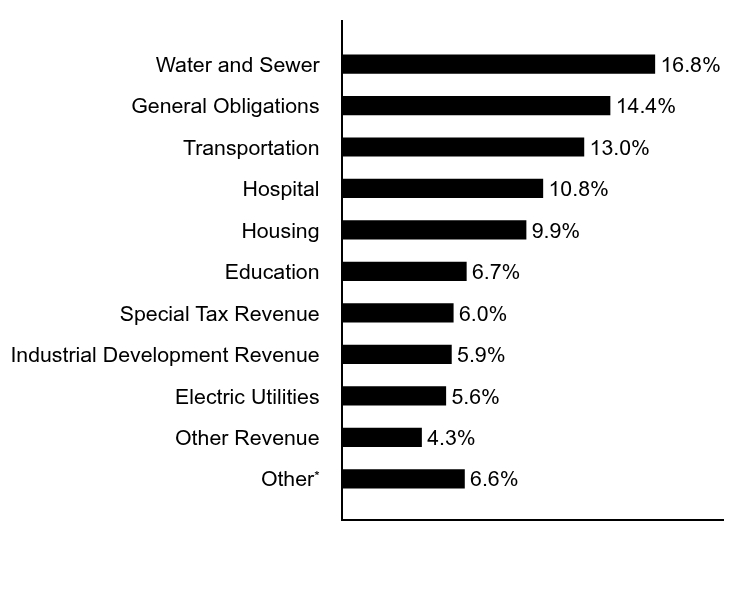
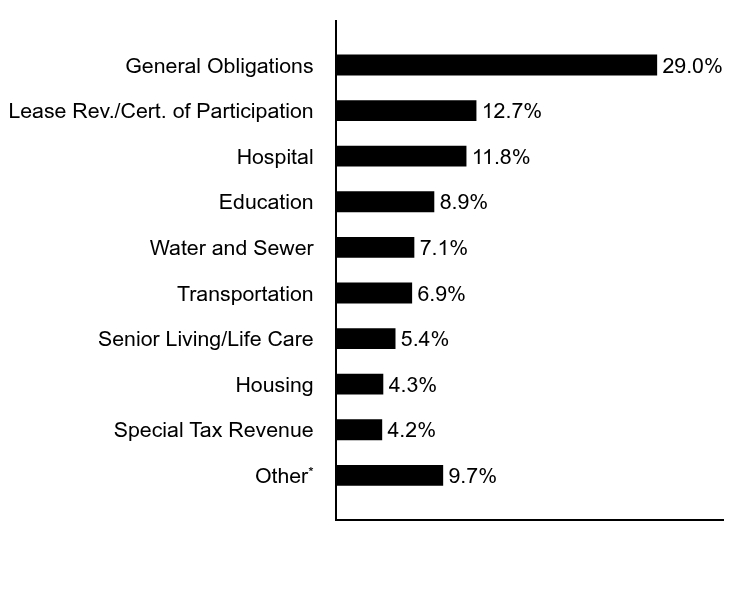
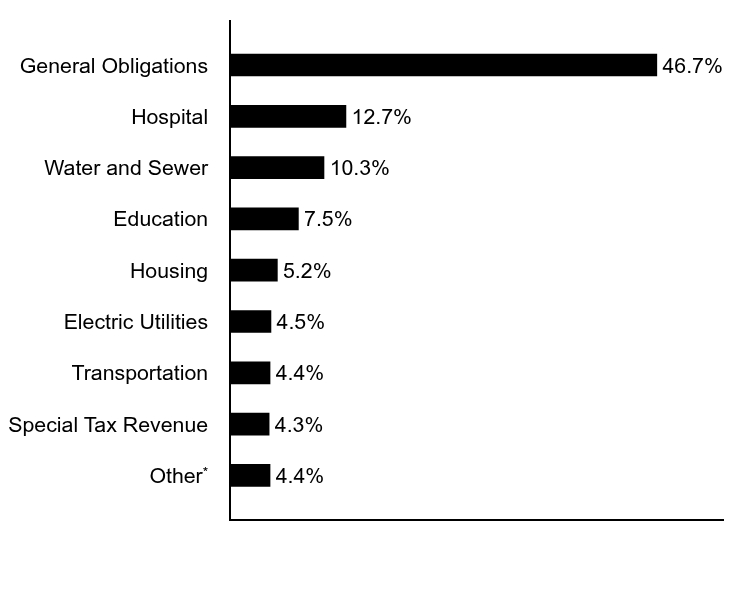
Sector Allocation (% of total investments)
Value |
Value |
|---|---|
OtherFootnote Reference* |
|
Other Revenue |
|
Electric Utilities |
|
Industrial Development Revenue |
|
Special Tax Revenue |
|
Education |
|
Housing |
|
Hospital |
|
Transportation |
|
General Obligations |
|
Water and Sewer |
| Footnote | Description |
Footnote* |
Sectors less than 3% each |
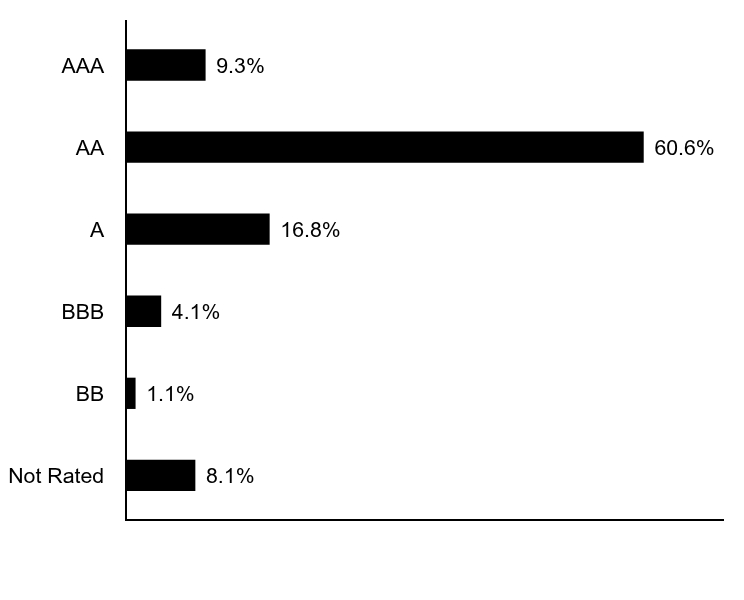
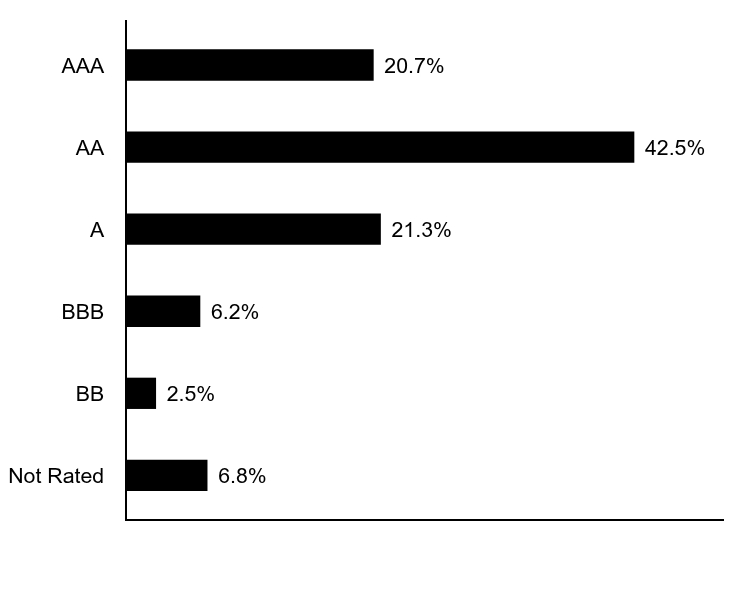
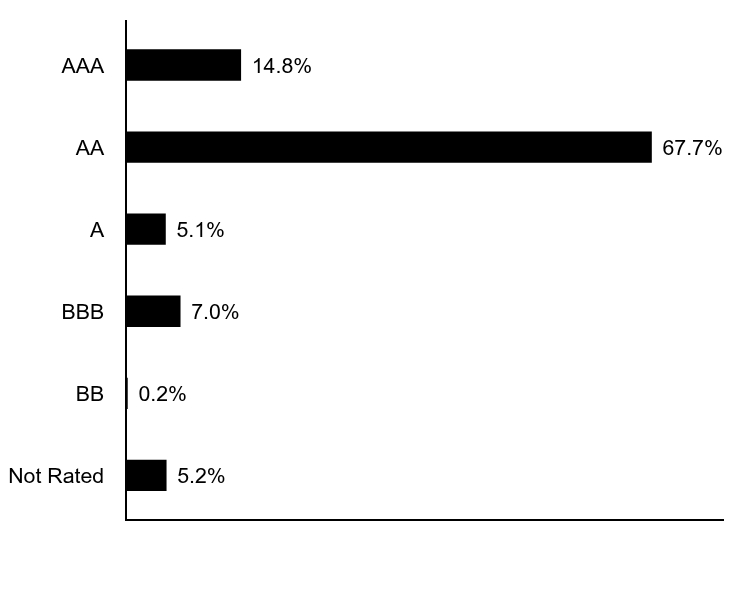
Credit Quality (% of total investments)Footnote Referencea
Value |
Value |
|---|---|
Not Rated |
|
BB |
|
BBB |
|
A |
|
AA |
|
AAA |
| Footnote | Description |
Footnotea |
Ratings are based on Moody’s Investors Service, Inc. (“Moody’s”), S&P Global Ratings (“S&P”) or Fitch Ratings (“Fitch”). If securities are rated differently by the ratings agencies, the highest rating is applied. Moody's ratings are converted to the S&P and Fitch scale with ratings ranging from AAA, being the highest, to D, being the lowest. Ratings of BBB or higher are considered to be investment-grade quality. Holdings designated as “Not Rated” (if any) are not rated by the national ratings agencies stated above. |
Additional Information

If you wish to view additional information about the Fund, including the prospectus, statement of additional information, financial statements and holdings, please scan the QR code or visit www.eatonvance.com/open-end-mutual-fund-documents.php. For proxy information, please visit www.eatonvance.com/proxyvoting.
Householding
The Funds may deliver a single copy of certain required shareholder documents (including prospectuses, shareholder reports, and proxy materials) to investors with the same last name and the same address. Your participation will continue indefinitely unless you instruct otherwise by calling
Not FDIC Insured | May Lose Value | No Bank Guarantee
Semi-Annual Shareholder Report February 28, 2026
ETGAX-TSR-SAR
Eaton Vance Georgia Municipal Income Fund
Class C ECGAX
What were the Fund costs for the last six months?
(based on a hypothetical $10,000 investment)
Class Name |
Costs of a $10,000 investment |
Costs paid as a percentage of a $10,000 investment |
|---|---|---|
Class C |
$ |
| Footnote | Description |
Footnote1 |
Key Fund Statistics
Total Net Assets |
$ |
|---|---|
# of Portfolio Holdings |
|
Portfolio Turnover Rate |
What did the Fund invest in?
The following tables reflect what the Fund invested in as of the report date.
Sector Allocation (% of total investments)
Value |
Value |
|---|---|
OtherFootnote Reference* |
|
Other Revenue |
|
Electric Utilities |
|
Industrial Development Revenue |
|
Special Tax Revenue |
|
Education |
|
Housing |
|
Hospital |
|
Transportation |
|
General Obligations |
|
Water and Sewer |
| Footnote | Description |
Footnote* |
Sectors less than 3% each |
Credit Quality (% of total investments)Footnote Referencea
Value |
Value |
|---|---|
Not Rated |
|
BB |
|
BBB |
|
A |
|
AA |
|
AAA |
| Footnote | Description |
Footnotea |
Ratings are based on Moody’s Investors Service, Inc. (“Moody’s”), S&P Global Ratings (“S&P”) or Fitch Ratings (“Fitch”). If securities are rated differently by the ratings agencies, the highest rating is applied. Moody's ratings are converted to the S&P and Fitch scale with ratings ranging from AAA, being the highest, to D, being the lowest. Ratings of BBB or higher are considered to be investment-grade quality. Holdings designated as “Not Rated” (if any) are not rated by the national ratings agencies stated above. |
Additional Information
If you wish to view additional information about the Fund, including the prospectus, statement of additional information, financial statements and holdings, please scan the QR code or visit www.eatonvance.com/open-end-mutual-fund-documents.php. For proxy information, please visit www.eatonvance.com/proxyvoting.
Householding
The Funds may deliver a single copy of certain required shareholder documents (including prospectuses, shareholder reports, and proxy materials) to investors with the same last name and the same address. Your participation will continue indefinitely unless you instruct otherwise by calling
Not FDIC Insured | May Lose Value | No Bank Guarantee
Semi-Annual Shareholder Report February 28, 2026
ECGAX-TSR-SAR
Eaton Vance Georgia Municipal Income Fund
Class I EIGAX
What were the Fund costs for the last six months?
(based on a hypothetical $10,000 investment)
Class Name |
Costs of a $10,000 investment |
Costs paid as a percentage of a $10,000 investment |
|---|---|---|
Class I |
$ |
| Footnote | Description |
Footnote1 |
Key Fund Statistics
Total Net Assets |
$ |
|---|---|
# of Portfolio Holdings |
|
Portfolio Turnover Rate |
What did the Fund invest in?
The following tables reflect what the Fund invested in as of the report date.
Sector Allocation (% of total investments)
Value |
Value |
|---|---|
OtherFootnote Reference* |
|
Other Revenue |
|
Electric Utilities |
|
Industrial Development Revenue |
|
Special Tax Revenue |
|
Education |
|
Housing |
|
Hospital |
|
Transportation |
|
General Obligations |
|
Water and Sewer |
| Footnote | Description |
Footnote* |
Sectors less than 3% each |
Credit Quality (% of total investments)Footnote Referencea
Value |
Value |
|---|---|
Not Rated |
|
BB |
|
BBB |
|
A |
|
AA |
|
AAA |
| Footnote | Description |
Footnotea |
Ratings are based on Moody’s Investors Service, Inc. (“Moody’s”), S&P Global Ratings (“S&P”) or Fitch Ratings (“Fitch”). If securities are rated differently by the ratings agencies, the highest rating is applied. Moody's ratings are converted to the S&P and Fitch scale with ratings ranging from AAA, being the highest, to D, being the lowest. Ratings of BBB or higher are considered to be investment-grade quality. Holdings designated as “Not Rated” (if any) are not rated by the national ratings agencies stated above. |
Additional Information
If you wish to view additional information about the Fund, including the prospectus, statement of additional information, financial statements and holdings, please scan the QR code or visit www.eatonvance.com/open-end-mutual-fund-documents.php. For proxy information, please visit www.eatonvance.com/proxyvoting.
Householding
The Funds may deliver a single copy of certain required shareholder documents (including prospectuses, shareholder reports, and proxy materials) to investors with the same last name and the same address. Your participation will continue indefinitely unless you instruct otherwise by calling
Not FDIC Insured | May Lose Value | No Bank Guarantee
Semi-Annual Shareholder Report February 28, 2026
EIGAX-TSR-SAR
Eaton Vance Maryland Municipal Income Fund
Class A ETMDX
What were the Fund costs for the last six months?
(based on a hypothetical $10,000 investment)
Class Name |
Costs of a $10,000 investment |
Costs paid as a percentage of a $10,000 investment |
|---|---|---|
Class A |
$ |
| Footnote | Description |
Footnote1 |
Key Fund Statistics
Total Net Assets |
$ |
|---|---|
# of Portfolio Holdings |
|
Portfolio Turnover Rate |
What did the Fund invest in?
The following tables reflect what the Fund invested in as of the report date.
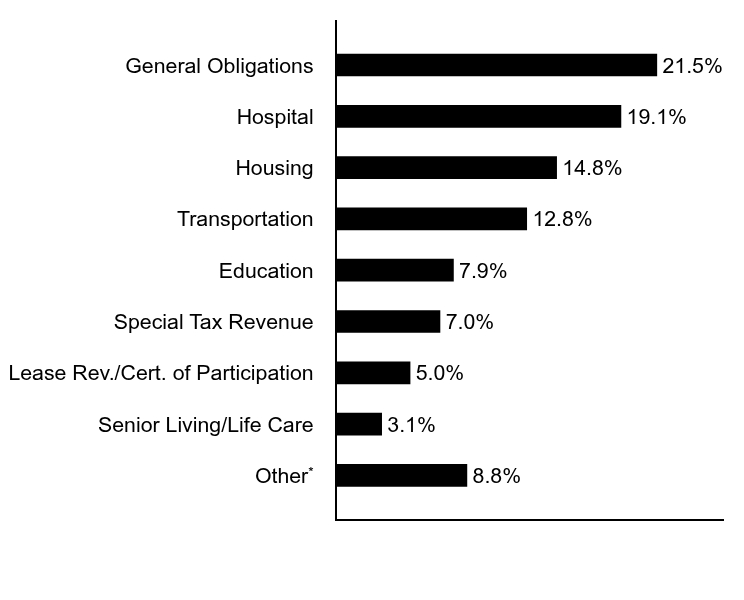
Sector Allocation (% of total investments)
Value |
Value |
|---|---|
OtherFootnote Reference* |
|
Senior Living/Life Care |
|
Lease Rev./Cert. of Participation |
|
Special Tax Revenue |
|
Education |
|
Transportation |
|
Housing |
|
Hospital |
|
General Obligations |
| Footnote | Description |
Footnote* |
Sectors less than 3% each |
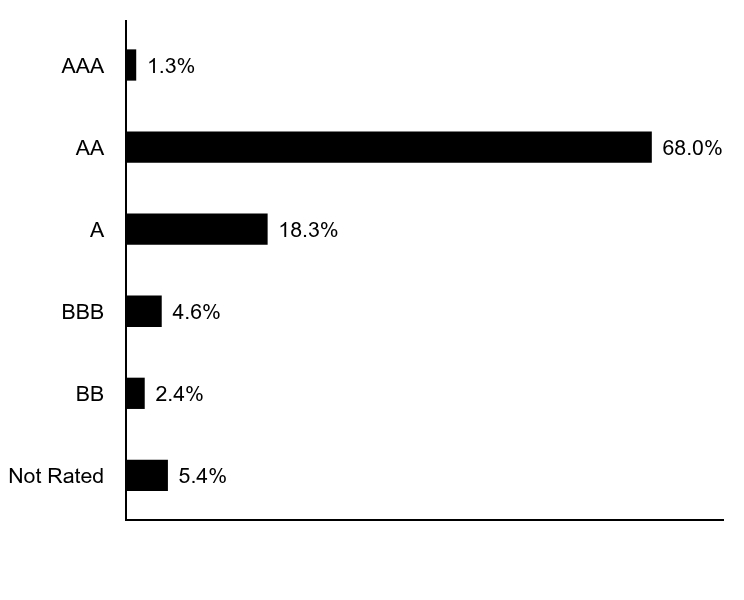
Credit Quality (% of total investments)Footnote Referencea
Value |
Value |
|---|---|
Not Rated |
|
BB |
|
BBB |
|
A |
|
AA |
|
AAA |
| Footnote | Description |
Footnotea |
Ratings are based on Moody’s Investors Service, Inc. (“Moody’s”), S&P Global Ratings (“S&P”) or Fitch Ratings (“Fitch”). If securities are rated differently by the ratings agencies, the highest rating is applied. Moody's ratings are converted to the S&P and Fitch scale with ratings ranging from AAA, being the highest, to D, being the lowest. Ratings of BBB or higher are considered to be investment-grade quality. Holdings designated as “Not Rated” (if any) are not rated by the national ratings agencies stated above. |
Additional Information
If you wish to view additional information about the Fund, including the prospectus, statement of additional information, financial statements and holdings, please scan the QR code or visit www.eatonvance.com/open-end-mutual-fund-documents.php. For proxy information, please visit www.eatonvance.com/proxyvoting.
Householding
The Funds may deliver a single copy of certain required shareholder documents (including prospectuses, shareholder reports, and proxy materials) to investors with the same last name and the same address. Your participation will continue indefinitely unless you instruct otherwise by calling
Not FDIC Insured | May Lose Value | No Bank Guarantee
Semi-Annual Shareholder Report February 28, 2026
ETMDX-TSR-SAR
Eaton Vance Maryland Municipal Income Fund
Class C ECMDX
What were the Fund costs for the last six months?
(based on a hypothetical $10,000 investment)
Class Name |
Costs of a $10,000 investment |
Costs paid as a percentage of a $10,000 investment |
|---|---|---|
Class C |
$ |
| Footnote | Description |
Footnote1 |
Key Fund Statistics
Total Net Assets |
$ |
|---|---|
# of Portfolio Holdings |
|
Portfolio Turnover Rate |
What did the Fund invest in?
The following tables reflect what the Fund invested in as of the report date.
Sector Allocation (% of total investments)
Value |
Value |
|---|---|
OtherFootnote Reference* |
|
Senior Living/Life Care |
|
Lease Rev./Cert. of Participation |
|
Special Tax Revenue |
|
Education |
|
Transportation |
|
Housing |
|
Hospital |
|
General Obligations |
| Footnote | Description |
Footnote* |
Sectors less than 3% each |
Credit Quality (% of total investments)Footnote Referencea
Value |
Value |
|---|---|
Not Rated |
|
BB |
|
BBB |
|
A |
|
AA |
|
AAA |
| Footnote | Description |
Footnotea |
Ratings are based on Moody’s Investors Service, Inc. (“Moody’s”), S&P Global Ratings (“S&P”) or Fitch Ratings (“Fitch”). If securities are rated differently by the ratings agencies, the highest rating is applied. Moody's ratings are converted to the S&P and Fitch scale with ratings ranging from AAA, being the highest, to D, being the lowest. Ratings of BBB or higher are considered to be investment-grade quality. Holdings designated as “Not Rated” (if any) are not rated by the national ratings agencies stated above. |
Additional Information
If you wish to view additional information about the Fund, including the prospectus, statement of additional information, financial statements and holdings, please scan the QR code or visit www.eatonvance.com/open-end-mutual-fund-documents.php. For proxy information, please visit www.eatonvance.com/proxyvoting.
Householding
The Funds may deliver a single copy of certain required shareholder documents (including prospectuses, shareholder reports, and proxy materials) to investors with the same last name and the same address. Your participation will continue indefinitely unless you instruct otherwise by calling
Not FDIC Insured | May Lose Value | No Bank Guarantee
Semi-Annual Shareholder Report February 28, 2026
ECMDX-TSR-SAR
Eaton Vance Maryland Municipal Income Fund
Class I EIMDX
What were the Fund costs for the last six months?
(based on a hypothetical $10,000 investment)
Class Name |
Costs of a $10,000 investment |
Costs paid as a percentage of a $10,000 investment |
|---|---|---|
Class I |
$ |
| Footnote | Description |
Footnote1 |
Key Fund Statistics
Total Net Assets |
$ |
|---|---|
# of Portfolio Holdings |
|
Portfolio Turnover Rate |
What did the Fund invest in?
The following tables reflect what the Fund invested in as of the report date.
Sector Allocation (% of total investments)
Value |
Value |
|---|---|
OtherFootnote Reference* |
|
Senior Living/Life Care |
|
Lease Rev./Cert. of Participation |
|
Special Tax Revenue |
|
Education |
|
Transportation |
|
Housing |
|
Hospital |
|
General Obligations |
| Footnote | Description |
Footnote* |
Sectors less than 3% each |
Credit Quality (% of total investments)Footnote Referencea
Value |
Value |
|---|---|
Not Rated |
|
BB |
|
BBB |
|
A |
|
AA |
|
AAA |
| Footnote | Description |
Footnotea |
Ratings are based on Moody’s Investors Service, Inc. (“Moody’s”), S&P Global Ratings (“S&P”) or Fitch Ratings (“Fitch”). If securities are rated differently by the ratings agencies, the highest rating is applied. Moody's ratings are converted to the S&P and Fitch scale with ratings ranging from AAA, being the highest, to D, being the lowest. Ratings of BBB or higher are considered to be investment-grade quality. Holdings designated as “Not Rated” (if any) are not rated by the national ratings agencies stated above. |
Additional Information
If you wish to view additional information about the Fund, including the prospectus, statement of additional information, financial statements and holdings, please scan the QR code or visit www.eatonvance.com/open-end-mutual-fund-documents.php. For proxy information, please visit www.eatonvance.com/proxyvoting.
Householding
The Funds may deliver a single copy of certain required shareholder documents (including prospectuses, shareholder reports, and proxy materials) to investors with the same last name and the same address. Your participation will continue indefinitely unless you instruct otherwise by calling
Not FDIC Insured | May Lose Value | No Bank Guarantee
Semi-Annual Shareholder Report February 28, 2026
EIMDX-TSR-SAR
Eaton Vance Missouri Municipal Income Fund
Class A ETMOX
What were the Fund costs for the last six months?
(based on a hypothetical $10,000 investment)
Class Name |
Costs of a $10,000 investment |
Costs paid as a percentage of a $10,000 investment |
|---|---|---|
Class A |
$ |
| Footnote | Description |
Footnote1 |
Key Fund Statistics
Total Net Assets |
$ |
|---|---|
# of Portfolio Holdings |
|
Portfolio Turnover Rate |
What did the Fund invest in?
The following tables reflect what the Fund invested in as of the report date.
Sector Allocation (% of total investments)
Value |
Value |
|---|---|
OtherFootnote Reference* |
|
Special Tax Revenue |
|
Housing |
|
Senior Living/Life Care |
|
Transportation |
|
Water and Sewer |
|
Education |
|
Hospital |
|
Lease Rev./Cert. of Participation |
|
General Obligations |
| Footnote | Description |
Footnote* |
Sectors less than 3% each |
Credit Quality (% of total investments)Footnote Referencea
Value |
Value |
|---|---|
Not Rated |
|
BB |
|
BBB |
|
A |
|
AA |
|
AAA |
| Footnote | Description |
Footnotea |
Ratings are based on Moody’s Investors Service, Inc. (“Moody’s”), S&P Global Ratings (“S&P”) or Fitch Ratings (“Fitch”). If securities are rated differently by the ratings agencies, the highest rating is applied. Moody's ratings are converted to the S&P and Fitch scale with ratings ranging from AAA, being the highest, to D, being the lowest. Ratings of BBB or higher are considered to be investment-grade quality. Holdings designated as “Not Rated” (if any) are not rated by the national ratings agencies stated above. |
Additional Information
If you wish to view additional information about the Fund, including the prospectus, statement of additional information, financial statements and holdings, please scan the QR code or visit www.eatonvance.com/open-end-mutual-fund-documents.php. For proxy information, please visit www.eatonvance.com/proxyvoting.
Householding
The Funds may deliver a single copy of certain required shareholder documents (including prospectuses, shareholder reports, and proxy materials) to investors with the same last name and the same address. Your participation will continue indefinitely unless you instruct otherwise by calling
Not FDIC Insured | May Lose Value | No Bank Guarantee
Semi-Annual Shareholder Report February 28, 2026
ETMOX-TSR-SAR
Eaton Vance Missouri Municipal Income Fund
Class C ECMOX
What were the Fund costs for the last six months?
(based on a hypothetical $10,000 investment)
Class Name |
Costs of a $10,000 investment |
Costs paid as a percentage of a $10,000 investment |
|---|---|---|
Class C |
$ |
| Footnote | Description |
Footnote1 |
Key Fund Statistics
Total Net Assets |
$ |
|---|---|
# of Portfolio Holdings |
|
Portfolio Turnover Rate |
What did the Fund invest in?
The following tables reflect what the Fund invested in as of the report date.
Sector Allocation (% of total investments)
Value |
Value |
|---|---|
OtherFootnote Reference* |
|
Special Tax Revenue |
|
Housing |
|
Senior Living/Life Care |
|
Transportation |
|
Water and Sewer |
|
Education |
|
Hospital |
|
Lease Rev./Cert. of Participation |
|
General Obligations |
| Footnote | Description |
Footnote* |
Sectors less than 3% each |
Credit Quality (% of total investments)Footnote Referencea
Value |
Value |
|---|---|
Not Rated |
|
BB |
|
BBB |
|
A |
|
AA |
|
AAA |
| Footnote | Description |
Footnotea |
Ratings are based on Moody’s Investors Service, Inc. (“Moody’s”), S&P Global Ratings (“S&P”) or Fitch Ratings (“Fitch”). If securities are rated differently by the ratings agencies, the highest rating is applied. Moody's ratings are converted to the S&P and Fitch scale with ratings ranging from AAA, being the highest, to D, being the lowest. Ratings of BBB or higher are considered to be investment-grade quality. Holdings designated as “Not Rated” (if any) are not rated by the national ratings agencies stated above. |
Additional Information
If you wish to view additional information about the Fund, including the prospectus, statement of additional information, financial statements and holdings, please scan the QR code or visit www.eatonvance.com/open-end-mutual-fund-documents.php. For proxy information, please visit www.eatonvance.com/proxyvoting.
Householding
The Funds may deliver a single copy of certain required shareholder documents (including prospectuses, shareholder reports, and proxy materials) to investors with the same last name and the same address. Your participation will continue indefinitely unless you instruct otherwise by calling
Not FDIC Insured | May Lose Value | No Bank Guarantee
Semi-Annual Shareholder Report February 28, 2026
ECMOX-TSR-SAR
Eaton Vance Missouri Municipal Income Fund
Class I EIMOX
What were the Fund costs for the last six months?
(based on a hypothetical $10,000 investment)
Class Name |
Costs of a $10,000 investment |
Costs paid as a percentage of a $10,000 investment |
|---|---|---|
Class I |
$ |
| Footnote | Description |
Footnote1 |
Key Fund Statistics
Total Net Assets |
$ |
|---|---|
# of Portfolio Holdings |
|
Portfolio Turnover Rate |
What did the Fund invest in?
The following tables reflect what the Fund invested in as of the report date.
Sector Allocation (% of total investments)
Value |
Value |
|---|---|
OtherFootnote Reference* |
|
Special Tax Revenue |
|
Housing |
|
Senior Living/Life Care |
|
Transportation |
|
Water and Sewer |
|
Education |
|
Hospital |
|
Lease Rev./Cert. of Participation |
|
General Obligations |
| Footnote | Description |
Footnote* |
Sectors less than 3% each |
Credit Quality (% of total investments)Footnote Referencea
Value |
Value |
|---|---|
Not Rated |
|
BB |
|
BBB |
|
A |
|
AA |
|
AAA |
| Footnote | Description |
Footnotea |
Ratings are based on Moody’s Investors Service, Inc. (“Moody’s”), S&P Global Ratings (“S&P”) or Fitch Ratings (“Fitch”). If securities are rated differently by the ratings agencies, the highest rating is applied. Moody's ratings are converted to the S&P and Fitch scale with ratings ranging from AAA, being the highest, to D, being the lowest. Ratings of BBB or higher are considered to be investment-grade quality. Holdings designated as “Not Rated” (if any) are not rated by the national ratings agencies stated above. |
Additional Information
If you wish to view additional information about the Fund, including the prospectus, statement of additional information, financial statements and holdings, please scan the QR code or visit www.eatonvance.com/open-end-mutual-fund-documents.php. For proxy information, please visit www.eatonvance.com/proxyvoting.
Householding
The Funds may deliver a single copy of certain required shareholder documents (including prospectuses, shareholder reports, and proxy materials) to investors with the same last name and the same address. Your participation will continue indefinitely unless you instruct otherwise by calling
Not FDIC Insured | May Lose Value | No Bank Guarantee
Semi-Annual Shareholder Report February 28, 2026
EIMOX-TSR-SAR
Eaton Vance North Carolina Municipal Income Fund
Class A ETNCX
What were the Fund costs for the last six months?
(based on a hypothetical $10,000 investment)
Class Name |
Costs of a $10,000 investment |
Costs paid as a percentage of a $10,000 investment |
|---|---|---|
Class A |
$ |
| Footnote | Description |
Footnote1 |
Key Fund Statistics
Total Net Assets |
$ |
|---|---|
# of Portfolio Holdings |
|
Portfolio Turnover Rate |
What did the Fund invest in?
The following tables reflect what the Fund invested in as of the report date.
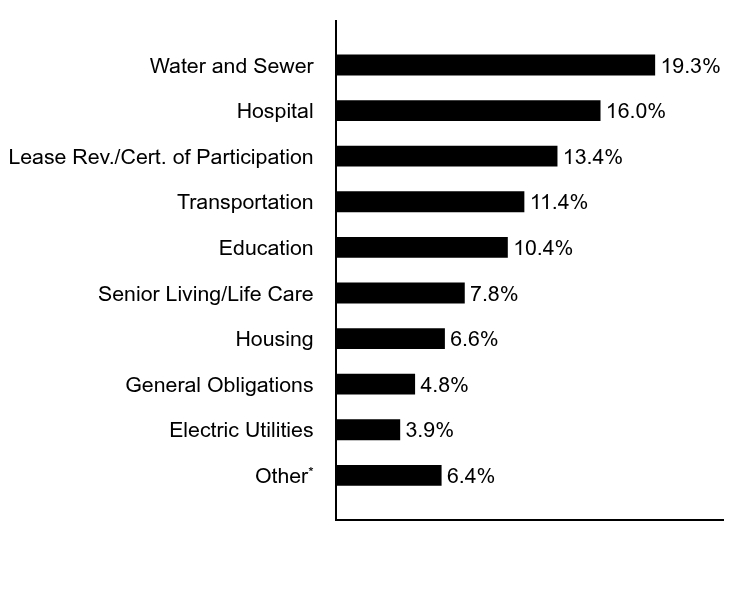
Sector Allocation (% of total investments)
Value |
Value |
|---|---|
OtherFootnote Reference* |
|
Electric Utilities |
|
General Obligations |
|
Housing |
|
Senior Living/Life Care |
|
Education |
|
Transportation |
|
Lease Rev./Cert. of Participation |
|
Hospital |
|
Water and Sewer |
| Footnote | Description |
Footnote* |
Sectors less than 3% each |
Credit Quality (% of total investments)Footnote Referencea
Value |
Value |
|---|---|
Not Rated |
|
BB |
|
BBB |
|
A |
|
AA |
|
AAA |
| Footnote | Description |
Footnotea |
Ratings are based on Moody’s Investors Service, Inc. (“Moody’s”), S&P Global Ratings (“S&P”) or Fitch Ratings (“Fitch”). If securities are rated differently by the ratings agencies, the highest rating is applied. Moody's ratings are converted to the S&P and Fitch scale with ratings ranging from AAA, being the highest, to D, being the lowest. Ratings of BBB or higher are considered to be investment-grade quality. Holdings designated as “Not Rated” (if any) are not rated by the national ratings agencies stated above. |
Additional Information
If you wish to view additional information about the Fund, including the prospectus, statement of additional information, financial statements and holdings, please scan the QR code or visit www.eatonvance.com/open-end-mutual-fund-documents.php. For proxy information, please visit www.eatonvance.com/proxyvoting.
Householding
The Funds may deliver a single copy of certain required shareholder documents (including prospectuses, shareholder reports, and proxy materials) to investors with the same last name and the same address. Your participation will continue indefinitely unless you instruct otherwise by calling
Not FDIC Insured | May Lose Value | No Bank Guarantee
Semi-Annual Shareholder Report February 28, 2026
ETNCX-TSR-SAR
Eaton Vance North Carolina Municipal Income Fund
Class C ECNCX
What were the Fund costs for the last six months?
(based on a hypothetical $10,000 investment)
Class Name |
Costs of a $10,000 investment |
Costs paid as a percentage of a $10,000 investment |
|---|---|---|
Class C |
$ |
| Footnote | Description |
Footnote1 |
Key Fund Statistics
Total Net Assets |
$ |
|---|---|
# of Portfolio Holdings |
|
Portfolio Turnover Rate |
What did the Fund invest in?
The following tables reflect what the Fund invested in as of the report date.
Sector Allocation (% of total investments)
Value |
Value |
|---|---|
OtherFootnote Reference* |
|
Electric Utilities |
|
General Obligations |
|
Housing |
|
Senior Living/Life Care |
|
Education |
|
Transportation |
|
Lease Rev./Cert. of Participation |
|
Hospital |
|
Water and Sewer |
| Footnote | Description |
Footnote* |
Sectors less than 3% each |
Credit Quality (% of total investments)Footnote Referencea
Value |
Value |
|---|---|
Not Rated |
|
BB |
|
BBB |
|
A |
|
AA |
|
AAA |
| Footnote | Description |
Footnotea |
Ratings are based on Moody’s Investors Service, Inc. (“Moody’s”), S&P Global Ratings (“S&P”) or Fitch Ratings (“Fitch”). If securities are rated differently by the ratings agencies, the highest rating is applied. Moody's ratings are converted to the S&P and Fitch scale with ratings ranging from AAA, being the highest, to D, being the lowest. Ratings of BBB or higher are considered to be investment-grade quality. Holdings designated as “Not Rated” (if any) are not rated by the national ratings agencies stated above. |
Additional Information
If you wish to view additional information about the Fund, including the prospectus, statement of additional information, financial statements and holdings, please scan the QR code or visit www.eatonvance.com/open-end-mutual-fund-documents.php. For proxy information, please visit www.eatonvance.com/proxyvoting.
Householding
The Funds may deliver a single copy of certain required shareholder documents (including prospectuses, shareholder reports, and proxy materials) to investors with the same last name and the same address. Your participation will continue indefinitely unless you instruct otherwise by calling
Not FDIC Insured | May Lose Value | No Bank Guarantee
Semi-Annual Shareholder Report February 28, 2026
ECNCX-TSR-SAR
Eaton Vance North Carolina Municipal Income Fund
Class I EINCX
What were the Fund costs for the last six months?
(based on a hypothetical $10,000 investment)
Class Name |
Costs of a $10,000 investment |
Costs paid as a percentage of a $10,000 investment |
|---|---|---|
Class I |
$ |
| Footnote | Description |
Footnote1 |
Key Fund Statistics
Total Net Assets |
$ |
|---|---|
# of Portfolio Holdings |
|
Portfolio Turnover Rate |
What did the Fund invest in?
The following tables reflect what the Fund invested in as of the report date.
Sector Allocation (% of total investments)
Value |
Value |
|---|---|
OtherFootnote Reference* |
|
Electric Utilities |
|
General Obligations |
|
Housing |
|
Senior Living/Life Care |
|
Education |
|
Transportation |
|
Lease Rev./Cert. of Participation |
|
Hospital |
|
Water and Sewer |
| Footnote | Description |
Footnote* |
Sectors less than 3% each |
Credit Quality (% of total investments)Footnote Referencea
Value |
Value |
|---|---|
Not Rated |
|
BB |
|
BBB |
|
A |
|
AA |
|
AAA |
| Footnote | Description |
Footnotea |
Ratings are based on Moody’s Investors Service, Inc. (“Moody’s”), S&P Global Ratings (“S&P”) or Fitch Ratings (“Fitch”). If securities are rated differently by the ratings agencies, the highest rating is applied. Moody's ratings are converted to the S&P and Fitch scale with ratings ranging from AAA, being the highest, to D, being the lowest. Ratings of BBB or higher are considered to be investment-grade quality. Holdings designated as “Not Rated” (if any) are not rated by the national ratings agencies stated above. |
Additional Information
If you wish to view additional information about the Fund, including the prospectus, statement of additional information, financial statements and holdings, please scan the QR code or visit www.eatonvance.com/open-end-mutual-fund-documents.php. For proxy information, please visit www.eatonvance.com/proxyvoting.
Householding
The Funds may deliver a single copy of certain required shareholder documents (including prospectuses, shareholder reports, and proxy materials) to investors with the same last name and the same address. Your participation will continue indefinitely unless you instruct otherwise by calling
Not FDIC Insured | May Lose Value | No Bank Guarantee
Semi-Annual Shareholder Report February 28, 2026
EINCX-TSR-SAR
Eaton Vance Oregon Municipal Income Fund
Class A ETORX
What were the Fund costs for the last six months?
(based on a hypothetical $10,000 investment)
Class Name |
Costs of a $10,000 investment |
Costs paid as a percentage of a $10,000 investment |
|---|---|---|
Class A |
$ |
| Footnote | Description |
Footnote1 |
Key Fund Statistics
Total Net Assets |
$ |
|---|---|
# of Portfolio Holdings |
|
Portfolio Turnover Rate |
What did the Fund invest in?
The following tables reflect what the Fund invested in as of the report date.
Sector Allocation (% of total investments)
Value |
Value |
|---|---|
OtherFootnote Reference* |
|
Special Tax Revenue |
|
Transportation |
|
Electric Utilities |
|
Housing |
|
Education |
|
Water and Sewer |
|
Hospital |
|
General Obligations |
| Footnote | Description |
Footnote* |
Sectors less than 3% each |
Credit Quality (% of total investments)Footnote Referencea
Value |
Value |
|---|---|
Not Rated |
|
BB |
|
BBB |
|
A |
|
AA |
|
AAA |
| Footnote | Description |
Footnotea |
Ratings are based on Moody’s Investors Service, Inc. (“Moody’s”), S&P Global Ratings (“S&P”) or Fitch Ratings (“Fitch”). If securities are rated differently by the ratings agencies, the highest rating is applied. Moody's ratings are converted to the S&P and Fitch scale with ratings ranging from AAA, being the highest, to D, being the lowest. Ratings of BBB or higher are considered to be investment-grade quality. Holdings designated as “Not Rated” (if any) are not rated by the national ratings agencies stated above. |
Additional Information
If you wish to view additional information about the Fund, including the prospectus, statement of additional information, financial statements and holdings, please scan the QR code or visit www.eatonvance.com/open-end-mutual-fund-documents.php. For proxy information, please visit www.eatonvance.com/proxyvoting.
Householding
The Funds may deliver a single copy of certain required shareholder documents (including prospectuses, shareholder reports, and proxy materials) to investors with the same last name and the same address. Your participation will continue indefinitely unless you instruct otherwise by calling
Not FDIC Insured | May Lose Value | No Bank Guarantee
Semi-Annual Shareholder Report February 28, 2026
ETORX-TSR-SAR
Eaton Vance Oregon Municipal Income Fund
Class C ECORX
What were the Fund costs for the last six months?
(based on a hypothetical $10,000 investment)
Class Name |
Costs of a $10,000 investment |
Costs paid as a percentage of a $10,000 investment |
|---|---|---|
Class C |
$ |
| Footnote | Description |
Footnote1 |
Key Fund Statistics
Total Net Assets |
$ |
|---|---|
# of Portfolio Holdings |
|
Portfolio Turnover Rate |
What did the Fund invest in?
The following tables reflect what the Fund invested in as of the report date.
Sector Allocation (% of total investments)
Value |
Value |
|---|---|
OtherFootnote Reference* |
|
Special Tax Revenue |
|
Transportation |
|
Electric Utilities |
|
Housing |
|
Education |
|
Water and Sewer |
|
Hospital |
|
General Obligations |
| Footnote | Description |
Footnote* |
Sectors less than 3% each |
Credit Quality (% of total investments)Footnote Referencea
Value |
Value |
|---|---|
Not Rated |
|
BB |
|
BBB |
|
A |
|
AA |
|
AAA |
| Footnote | Description |
Footnotea |
Ratings are based on Moody’s Investors Service, Inc. (“Moody’s”), S&P Global Ratings (“S&P”) or Fitch Ratings (“Fitch”). If securities are rated differently by the ratings agencies, the highest rating is applied. Moody's ratings are converted to the S&P and Fitch scale with ratings ranging from AAA, being the highest, to D, being the lowest. Ratings of BBB or higher are considered to be investment-grade quality. Holdings designated as “Not Rated” (if any) are not rated by the national ratings agencies stated above. |
Additional Information
If you wish to view additional information about the Fund, including the prospectus, statement of additional information, financial statements and holdings, please scan the QR code or visit www.eatonvance.com/open-end-mutual-fund-documents.php. For proxy information, please visit www.eatonvance.com/proxyvoting.
Householding
The Funds may deliver a single copy of certain required shareholder documents (including prospectuses, shareholder reports, and proxy materials) to investors with the same last name and the same address. Your participation will continue indefinitely unless you instruct otherwise by calling
Not FDIC Insured | May Lose Value | No Bank Guarantee
Semi-Annual Shareholder Report February 28, 2026
ECORX-TSR-SAR
Eaton Vance Oregon Municipal Income Fund
Class I EIORX
What were the Fund costs for the last six months?
(based on a hypothetical $10,000 investment)
Class Name |
Costs of a $10,000 investment |
Costs paid as a percentage of a $10,000 investment |
|---|---|---|
Class I |
$ |
| Footnote | Description |
Footnote1 |
Key Fund Statistics
Total Net Assets |
$ |
|---|---|
# of Portfolio Holdings |
|
Portfolio Turnover Rate |
What did the Fund invest in?
The following tables reflect what the Fund invested in as of the report date.
Sector Allocation (% of total investments)
Value |
Value |
|---|---|
OtherFootnote Reference* |
|
Special Tax Revenue |
|
Transportation |
|
Electric Utilities |
|
Housing |
|
Education |
|
Water and Sewer |
|
Hospital |
|
General Obligations |
| Footnote | Description |
Footnote* |
Sectors less than 3% each |
Credit Quality (% of total investments)Footnote Referencea
Value |
Value |
|---|---|
Not Rated |
|
BB |
|
BBB |
|
A |
|
AA |
|
AAA |
| Footnote | Description |
Footnotea |
Ratings are based on Moody’s Investors Service, Inc. (“Moody’s”), S&P Global Ratings (“S&P”) or Fitch Ratings (“Fitch”). If securities are rated differently by the ratings agencies, the highest rating is applied. Moody's ratings are converted to the S&P and Fitch scale with ratings ranging from AAA, being the highest, to D, being the lowest. Ratings of BBB or higher are considered to be investment-grade quality. Holdings designated as “Not Rated” (if any) are not rated by the national ratings agencies stated above. |
Additional Information
If you wish to view additional information about the Fund, including the prospectus, statement of additional information, financial statements and holdings, please scan the QR code or visit www.eatonvance.com/open-end-mutual-fund-documents.php. For proxy information, please visit www.eatonvance.com/proxyvoting.
Householding
The Funds may deliver a single copy of certain required shareholder documents (including prospectuses, shareholder reports, and proxy materials) to investors with the same last name and the same address. Your participation will continue indefinitely unless you instruct otherwise by calling
Not FDIC Insured | May Lose Value | No Bank Guarantee
Semi-Annual Shareholder Report February 28, 2026
EIORX-TSR-SAR
Eaton Vance South Carolina Municipal Income Fund
Class A EASCX
What were the Fund costs for the last six months?
(based on a hypothetical $10,000 investment)
Class Name |
Costs of a $10,000 investment |
Costs paid as a percentage of a $10,000 investment |
|---|---|---|
Class A |
$ |
| Footnote | Description |
Footnote1 |
Key Fund Statistics
Total Net Assets |
$ |
|---|---|
# of Portfolio Holdings |
|
Portfolio Turnover Rate |
What did the Fund invest in?
The following tables reflect what the Fund invested in as of the report date.
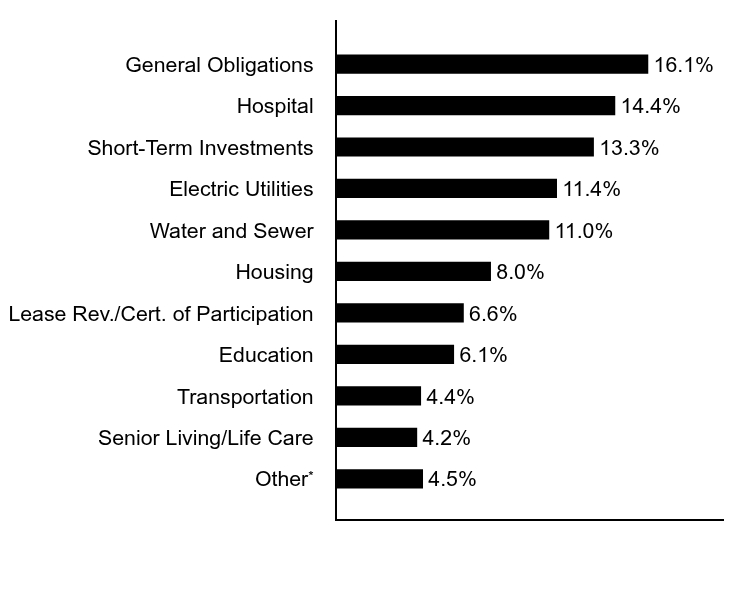
Sector Allocation (% of total investments)
Value |
Value |
|---|---|
OtherFootnote Reference* |
|
Senior Living/Life Care |
|
Transportation |
|
Education |
|
Lease Rev./Cert. of Participation |
|
Housing |
|
Water and Sewer |
|
Electric Utilities |
|
Short-Term Investments |
|
Hospital |
|
General Obligations |
| Footnote | Description |
Footnote* |
Sectors less than 3% each |
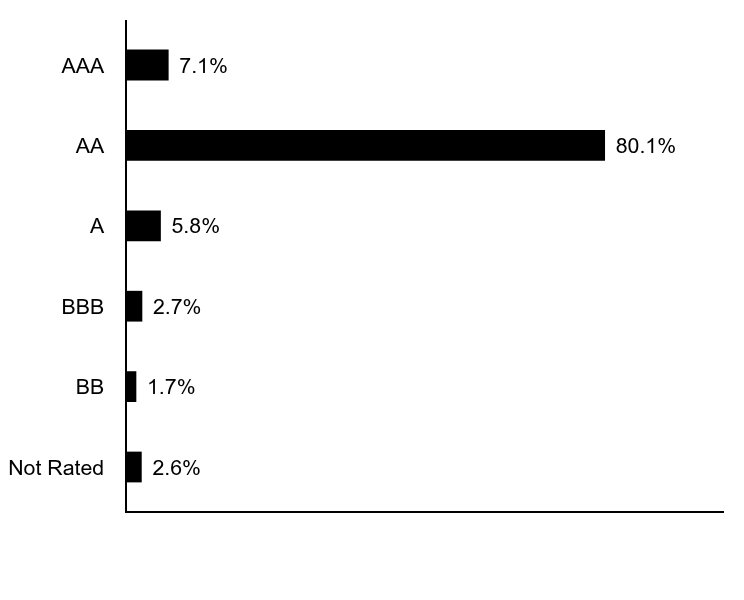
Credit Quality (% of total investments)Footnote Referencea,Footnote Referenceb
Value |
Value |
|---|---|
Not Rated |
|
BB |
|
BBB |
|
A |
|
AA |
|
AAA |
| Footnote | Description |
Footnotea |
Ratings are based on Moody’s Investors Service, Inc. (“Moody’s”), S&P Global Ratings (“S&P”) or Fitch Ratings (“Fitch”). If securities are rated differently by the ratings agencies, the highest rating is applied. Moody's ratings are converted to the S&P and Fitch scale with ratings ranging from AAA, being the highest, to D, being the lowest. Ratings of BBB or higher are considered to be investment-grade quality. Holdings designated as “Not Rated” (if any) are not rated by the national ratings agencies stated above. |
Footnoteb |
The chart includes the municipal bonds held by a trust that issues residual interest bonds. |
Additional Information
If you wish to view additional information about the Fund, including the prospectus, statement of additional information, financial statements and holdings, please scan the QR code or visit www.eatonvance.com/open-end-mutual-fund-documents.php. For proxy information, please visit www.eatonvance.com/proxyvoting.
Householding
The Funds may deliver a single copy of certain required shareholder documents (including prospectuses, shareholder reports, and proxy materials) to investors with the same last name and the same address. Your participation will continue indefinitely unless you instruct otherwise by calling
Not FDIC Insured | May Lose Value | No Bank Guarantee
Semi-Annual Shareholder Report February 28, 2026
EASCX-TSR-SAR
Eaton Vance South Carolina Municipal Income Fund
Class C ECSCX
What were the Fund costs for the last six months?
(based on a hypothetical $10,000 investment)
Class Name |
Costs of a $10,000 investment |
Costs paid as a percentage of a $10,000 investment |
|---|---|---|
Class C |
$ |
| Footnote | Description |
Footnote1 |
Key Fund Statistics
Total Net Assets |
$ |
|---|---|
# of Portfolio Holdings |
|
Portfolio Turnover Rate |
What did the Fund invest in?
The following tables reflect what the Fund invested in as of the report date.
Sector Allocation (% of total investments)
Value |
Value |
|---|---|
OtherFootnote Reference* |
|
Senior Living/Life Care |
|
Transportation |
|
Education |
|
Lease Rev./Cert. of Participation |
|
Housing |
|
Water and Sewer |
|
Electric Utilities |
|
Short-Term Investments |
|
Hospital |
|
General Obligations |
| Footnote | Description |
Footnote* |
Sectors less than 3% each |
Credit Quality (% of total investments)Footnote Referencea,Footnote Referenceb
Value |
Value |
|---|---|
Not Rated |
|
BB |
|
BBB |
|
A |
|
AA |
|
AAA |
| Footnote | Description |
Footnotea |
Ratings are based on Moody’s Investors Service, Inc. (“Moody’s”), S&P Global Ratings (“S&P”) or Fitch Ratings (“Fitch”). If securities are rated differently by the ratings agencies, the highest rating is applied. Moody's ratings are converted to the S&P and Fitch scale with ratings ranging from AAA, being the highest, to D, being the lowest. Ratings of BBB or higher are considered to be investment-grade quality. Holdings designated as “Not Rated” (if any) are not rated by the national ratings agencies stated above. |
Footnoteb |
The chart includes the municipal bonds held by a trust that issues residual interest bonds. |
Additional Information
If you wish to view additional information about the Fund, including the prospectus, statement of additional information, financial statements and holdings, please scan the QR code or visit www.eatonvance.com/open-end-mutual-fund-documents.php. For proxy information, please visit www.eatonvance.com/proxyvoting.
Householding
The Funds may deliver a single copy of certain required shareholder documents (including prospectuses, shareholder reports, and proxy materials) to investors with the same last name and the same address. Your participation will continue indefinitely unless you instruct otherwise by calling
Not FDIC Insured | May Lose Value | No Bank Guarantee
Semi-Annual Shareholder Report February 28, 2026
ECSCX-TSR-SAR
Eaton Vance South Carolina Municipal Income Fund
Class I EISCX
What were the Fund costs for the last six months?
(based on a hypothetical $10,000 investment)
Class Name |
Costs of a $10,000 investment |
Costs paid as a percentage of a $10,000 investment |
|---|---|---|
Class I |
$ |
| Footnote | Description |
Footnote1 |
Key Fund Statistics
Total Net Assets |
$ |
|---|---|
# of Portfolio Holdings |
|
Portfolio Turnover Rate |
What did the Fund invest in?
The following tables reflect what the Fund invested in as of the report date.
Sector Allocation (% of total investments)
Value |
Value |
|---|---|
OtherFootnote Reference* |
|
Senior Living/Life Care |
|
Transportation |
|
Education |
|
Lease Rev./Cert. of Participation |
|
Housing |
|
Water and Sewer |
|
Electric Utilities |
|
Short-Term Investments |
|
Hospital |
|
General Obligations |
| Footnote | Description |
Footnote* |
Sectors less than 3% each |
Credit Quality (% of total investments)Footnote Referencea,Footnote Referenceb
Value |
Value |
|---|---|
Not Rated |
|
BB |
|
BBB |
|
A |
|
AA |
|
AAA |
| Footnote | Description |
Footnotea |
Ratings are based on Moody’s Investors Service, Inc. (“Moody’s”), S&P Global Ratings (“S&P”) or Fitch Ratings (“Fitch”). If securities are rated differently by the ratings agencies, the highest rating is applied. Moody's ratings are converted to the S&P and Fitch scale with ratings ranging from AAA, being the highest, to D, being the lowest. Ratings of BBB or higher are considered to be investment-grade quality. Holdings designated as “Not Rated” (if any) are not rated by the national ratings agencies stated above. |
Footnoteb |
The chart includes the municipal bonds held by a trust that issues residual interest bonds. |
Additional Information
If you wish to view additional information about the Fund, including the prospectus, statement of additional information, financial statements and holdings, please scan the QR code or visit www.eatonvance.com/open-end-mutual-fund-documents.php. For proxy information, please visit www.eatonvance.com/proxyvoting.
Householding
The Funds may deliver a single copy of certain required shareholder documents (including prospectuses, shareholder reports, and proxy materials) to investors with the same last name and the same address. Your participation will continue indefinitely unless you instruct otherwise by calling
Not FDIC Insured | May Lose Value | No Bank Guarantee
Semi-Annual Shareholder Report February 28, 2026
EISCX-TSR-SAR
Eaton Vance Virginia Municipal Income Fund
Class A ETVAX
What were the Fund costs for the last six months?
(based on a hypothetical $10,000 investment)
Class Name |
Costs of a $10,000 investment |
Costs paid as a percentage of a $10,000 investment |
|---|---|---|
Class A |
$ |
| Footnote | Description |
Footnote1 |
Key Fund Statistics
Total Net Assets |
$ |
|---|---|
# of Portfolio Holdings |
|
Portfolio Turnover Rate |
What did the Fund invest in?
The following tables reflect what the Fund invested in as of the report date.
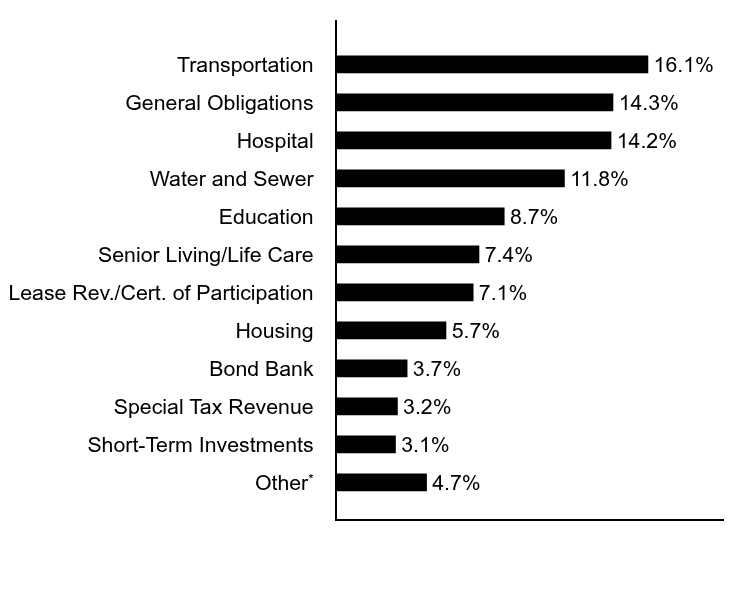
Sector Allocation (% of total investments)
Value |
Value |
|---|---|
OtherFootnote Reference* |
|
Short-Term Investments |
|
Special Tax Revenue |
|
Bond Bank |
|
Housing |
|
Lease Rev./Cert. of Participation |
|
Senior Living/Life Care |
|
Education |
|
Water and Sewer |
|
Hospital |
|
General Obligations |
|
Transportation |
| Footnote | Description |
Footnote* |
Sectors less than 3% each |
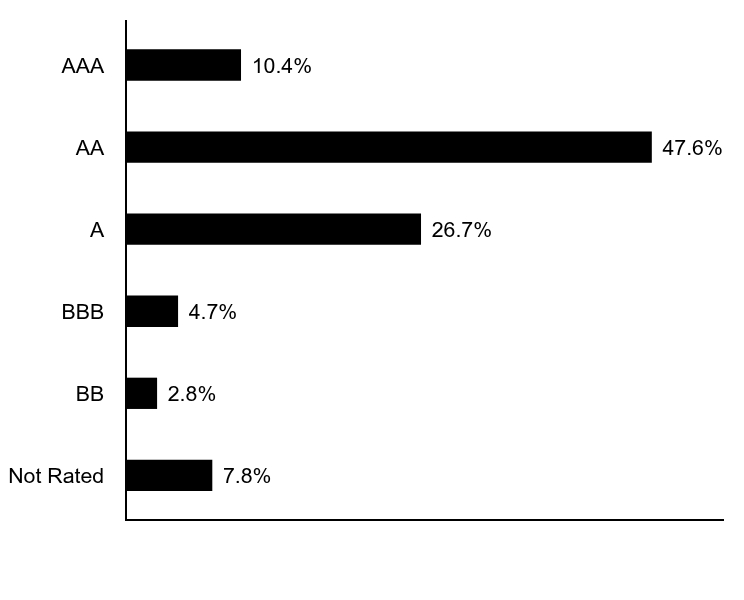
Credit Quality (% of total investments)Footnote Referencea
Value |
Value |
|---|---|
Not Rated |
|
B |
|
BB |
|
BBB |
|
A |
|
AA |
|
AAA |
| Footnote | Description |
Footnotea |
Ratings are based on Moody’s Investors Service, Inc. (“Moody’s”), S&P Global Ratings (“S&P”) or Fitch Ratings (“Fitch”). If securities are rated differently by the ratings agencies, the highest rating is applied. Moody's ratings are converted to the S&P and Fitch scale with ratings ranging from AAA, being the highest, to D, being the lowest. Ratings of BBB or higher are considered to be investment-grade quality. Holdings designated as “Not Rated” (if any) are not rated by the national ratings agencies stated above. |
Additional Information
If you wish to view additional information about the Fund, including the prospectus, statement of additional information, financial statements and holdings, please scan the QR code or visit www.eatonvance.com/open-end-mutual-fund-documents.php. For proxy information, please visit www.eatonvance.com/proxyvoting.
Householding
The Funds may deliver a single copy of certain required shareholder documents (including prospectuses, shareholder reports, and proxy materials) to investors with the same last name and the same address. Your participation will continue indefinitely unless you instruct otherwise by calling
Not FDIC Insured | May Lose Value | No Bank Guarantee
Semi-Annual Shareholder Report February 28, 2026
ETVAX-TSR-SAR
Eaton Vance Virginia Municipal Income Fund
Class C ECVAX
What were the Fund costs for the last six months?
(based on a hypothetical $10,000 investment)
Class Name |
Costs of a $10,000 investment |
Costs paid as a percentage of a $10,000 investment |
|---|---|---|
Class C |
$ |
| Footnote | Description |
Footnote1 |
Key Fund Statistics
Total Net Assets |
$ |
|---|---|
# of Portfolio Holdings |
|
Portfolio Turnover Rate |
What did the Fund invest in?
The following tables reflect what the Fund invested in as of the report date.
Sector Allocation (% of total investments)
Value |
Value |
|---|---|
OtherFootnote Reference* |
|
Short-Term Investments |
|
Special Tax Revenue |
|
Bond Bank |
|
Housing |
|
Lease Rev./Cert. of Participation |
|
Senior Living/Life Care |
|
Education |
|
Water and Sewer |
|
Hospital |
|
General Obligations |
|
Transportation |
| Footnote | Description |
Footnote* |
Sectors less than 3% each |
Credit Quality (% of total investments)Footnote Referencea
Value |
Value |
|---|---|
Not Rated |
|
B |
|
BB |
|
BBB |
|
A |
|
AA |
|
AAA |
| Footnote | Description |
Footnotea |
Ratings are based on Moody’s Investors Service, Inc. (“Moody’s”), S&P Global Ratings (“S&P”) or Fitch Ratings (“Fitch”). If securities are rated differently by the ratings agencies, the highest rating is applied. Moody's ratings are converted to the S&P and Fitch scale with ratings ranging from AAA, being the highest, to D, being the lowest. Ratings of BBB or higher are considered to be investment-grade quality. Holdings designated as “Not Rated” (if any) are not rated by the national ratings agencies stated above. |
Additional Information
If you wish to view additional information about the Fund, including the prospectus, statement of additional information, financial statements and holdings, please scan the QR code or visit www.eatonvance.com/open-end-mutual-fund-documents.php. For proxy information, please visit www.eatonvance.com/proxyvoting.
Householding
The Funds may deliver a single copy of certain required shareholder documents (including prospectuses, shareholder reports, and proxy materials) to investors with the same last name and the same address. Your participation will continue indefinitely unless you instruct otherwise by calling
Not FDIC Insured | May Lose Value | No Bank Guarantee
Semi-Annual Shareholder Report February 28, 2026
ECVAX-TSR-SAR
Eaton Vance Virginia Municipal Income Fund
Class I EVAIX
What were the Fund costs for the last six months?
(based on a hypothetical $10,000 investment)
Class Name |
Costs of a $10,000 investment |
Costs paid as a percentage of a $10,000 investment |
|---|---|---|
Class I |
$ |
| Footnote | Description |
Footnote1 |
Key Fund Statistics
Total Net Assets |
$ |
|---|---|
# of Portfolio Holdings |
|
Portfolio Turnover Rate |
What did the Fund invest in?
The following tables reflect what the Fund invested in as of the report date.
Sector Allocation (% of total investments)
Value |
Value |
|---|---|
OtherFootnote Reference* |
|
Short-Term Investments |
|
Special Tax Revenue |
|
Bond Bank |
|
Housing |
|
Lease Rev./Cert. of Participation |
|
Senior Living/Life Care |
|
Education |
|
Water and Sewer |
|
Hospital |
|
General Obligations |
|
Transportation |
| Footnote | Description |
Footnote* |
Sectors less than 3% each |
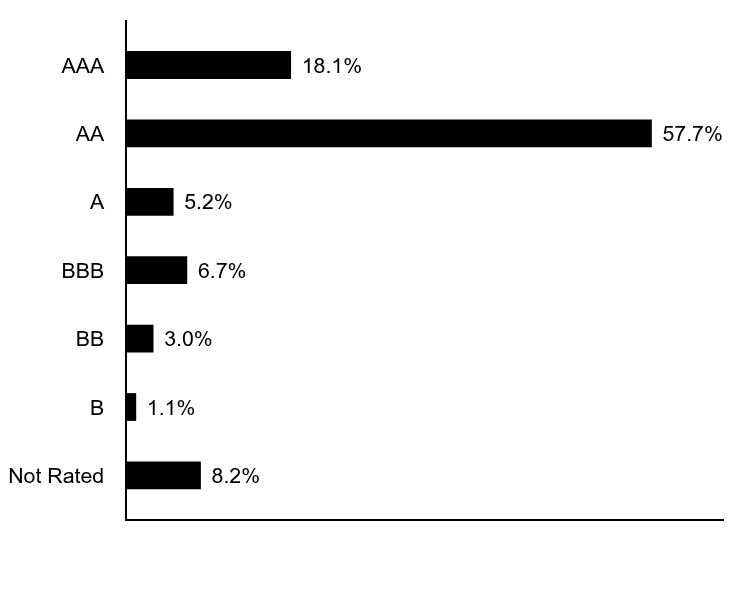
Credit Quality (% of total investments)Footnote Referencea
Value |
Value |
|---|---|
Not Rated |
|
B |
|
BB |
|
BBB |
|
A |
|
AA |
|
AAA |
| Footnote | Description |
Footnotea |
Ratings are based on Moody’s Investors Service, Inc. (“Moody’s”), S&P Global Ratings (“S&P”) or Fitch Ratings (“Fitch”). If securities are rated differently by the ratings agencies, the highest rating is applied. Moody's ratings are converted to the S&P and Fitch scale with ratings ranging from AAA, being the highest, to D, being the lowest. Ratings of BBB or higher are considered to be investment-grade quality. Holdings designated as “Not Rated” (if any) are not rated by the national ratings agencies stated above. |
Additional Information
If you wish to view additional information about the Fund, including the prospectus, statement of additional information, financial statements and holdings, please scan the QR code or visit www.eatonvance.com/open-end-mutual-fund-documents.php. For proxy information, please visit www.eatonvance.com/proxyvoting.
Householding
The Funds may deliver a single copy of certain required shareholder documents (including prospectuses, shareholder reports, and proxy materials) to investors with the same last name and the same address. Your participation will continue indefinitely unless you instruct otherwise by calling
Not FDIC Insured | May Lose Value | No Bank Guarantee
Semi-Annual Shareholder Report February 28, 2026