Prospectus
May 1, 2026
DEUTSCHE DWS VARIABLE SERIES II
Class A
|
|
|
DWS Alternative Asset Allocation VIP
DWS Global Income Builder VIP
DWS Small Mid Cap Value VIP
DWS International Opportunities VIP
DWS High Income VIP
DWS CROCI® U.S. VIP
DWS Government Money Market VIP
DWS Small Mid Cap Growth VIP
|
|
|
This prospectus should be read in conjunction with the variable life insurance or variable annuity contract prospectus and plan documents for tax-qualified plans. These shares are available and are being marketed exclusively as a pooled funding vehicle for life insurance companies writing all types of variable life insurance policies and variable annuity contracts.
The Securities and Exchange Commission (SEC) does not approve or disapprove these shares or determine whether the information in this prospectus is truthful or complete. It is a criminal offense for anyone to inform you otherwise.

Table of Contents
|
| |
|
1 | |
|
1 | |
|
1 | |
|
3 | |
|
9 | |
|
10 | |
|
10 | |
|
10 | |
|
10 | |
|
| |
|
11 | |
|
11 | |
|
11 | |
|
12 | |
|
18 | |
|
18 | |
|
18 | |
|
18 | |
|
18 | |
|
| |
|
19 | |
|
19 | |
|
19 | |
|
20 | |
|
23 | |
|
24 | |
|
24 | |
|
24 | |
|
24 |
|
| |
|
25 | |
|
25 | |
|
25 | |
|
26 | |
|
29 | |
|
29 | |
|
29 | |
|
29 | |
|
29 | |
|
| |
|
30 | |
|
30 | |
|
30 | |
|
31 | |
|
34 | |
|
35 | |
|
35 | |
|
35 | |
|
35 | |
|
| |
|
36 | |
|
36 | |
|
36 | |
|
37 | |
|
40 | |
|
40 | |
|
40 | |
|
40 | |
|
40 |
|
| |
|
42 | |
|
42 | |
|
42 | |
|
43 | |
|
45 | |
|
46 | |
|
46 | |
|
46 | |
|
46 | |
|
| |
|
47 | |
|
47 | |
|
47 | |
|
48 | |
|
51 | |
|
51 | |
|
51 | |
|
51 | |
|
52 | |
|
| |
|
53 | |
|
53 | |
|
65 | |
|
74 | |
|
79 | |
|
84 | |
|
90 | |
|
94 | |
|
98 | |
|
103 | |
|
105 | |
|
108 |
|
| |
|
110 | |
|
110 | |
|
111 | |
|
113 | |
|
115 | |
|
115 | |
|
116 | |
|
125 | |
|
125 | |
|
129 |
Your investment in a fund is not a bank deposit and is not insured or guaranteed by the Federal Deposit Insurance Corporation or any other government agency, entity or person.
SHAREHOLDER FEES
|
(paid directly from your investment) |
|
(expenses that you pay each year as a % of the value of your investment)
|
Management fee |
|
|
Distribution/service (12b-1) fees |
|
|
Other expenses1 |
|
|
Acquired funds fees and expenses |
|
|
Total annual fund operating expenses |
|
1
|
|
1 Year |
3 Years |
5 Years |
10 Years |
|
|
$ |
$ |
$ |
$ |
| Prospectus May 1, 2026 | 1 | DWS Alternative Asset Allocation VIP |
|
|
% |
|
|
% |
|
|
% |
|
|
% |
|
|
% |
|
|
% |
|
|
% |
|
|
% |
|
|
% |
|
|
% |
|
|
% |
|
|
% |
|
|
% |
|
|
% |
|
|
% |
|
|
% |
|
|
% |
|
|
% |
Prospectus May 1, 2026
2
DWS Alternative Asset Allocation VIP
Main Risks
Prospectus May 1, 2026
3
DWS Alternative Asset Allocation VIP
Prospectus May 1, 2026
4
DWS Alternative Asset Allocation VIP
Prospectus May 1, 2026
5
DWS Alternative Asset Allocation VIP
Prospectus May 1, 2026
6
DWS Alternative Asset Allocation VIP
Prospectus May 1, 2026
7
DWS Alternative Asset Allocation VIP
Prospectus May 1, 2026
8
DWS Alternative Asset Allocation VIP
|
|
|
|
|
|
|
|
|
|
|
|
|
|
|
|
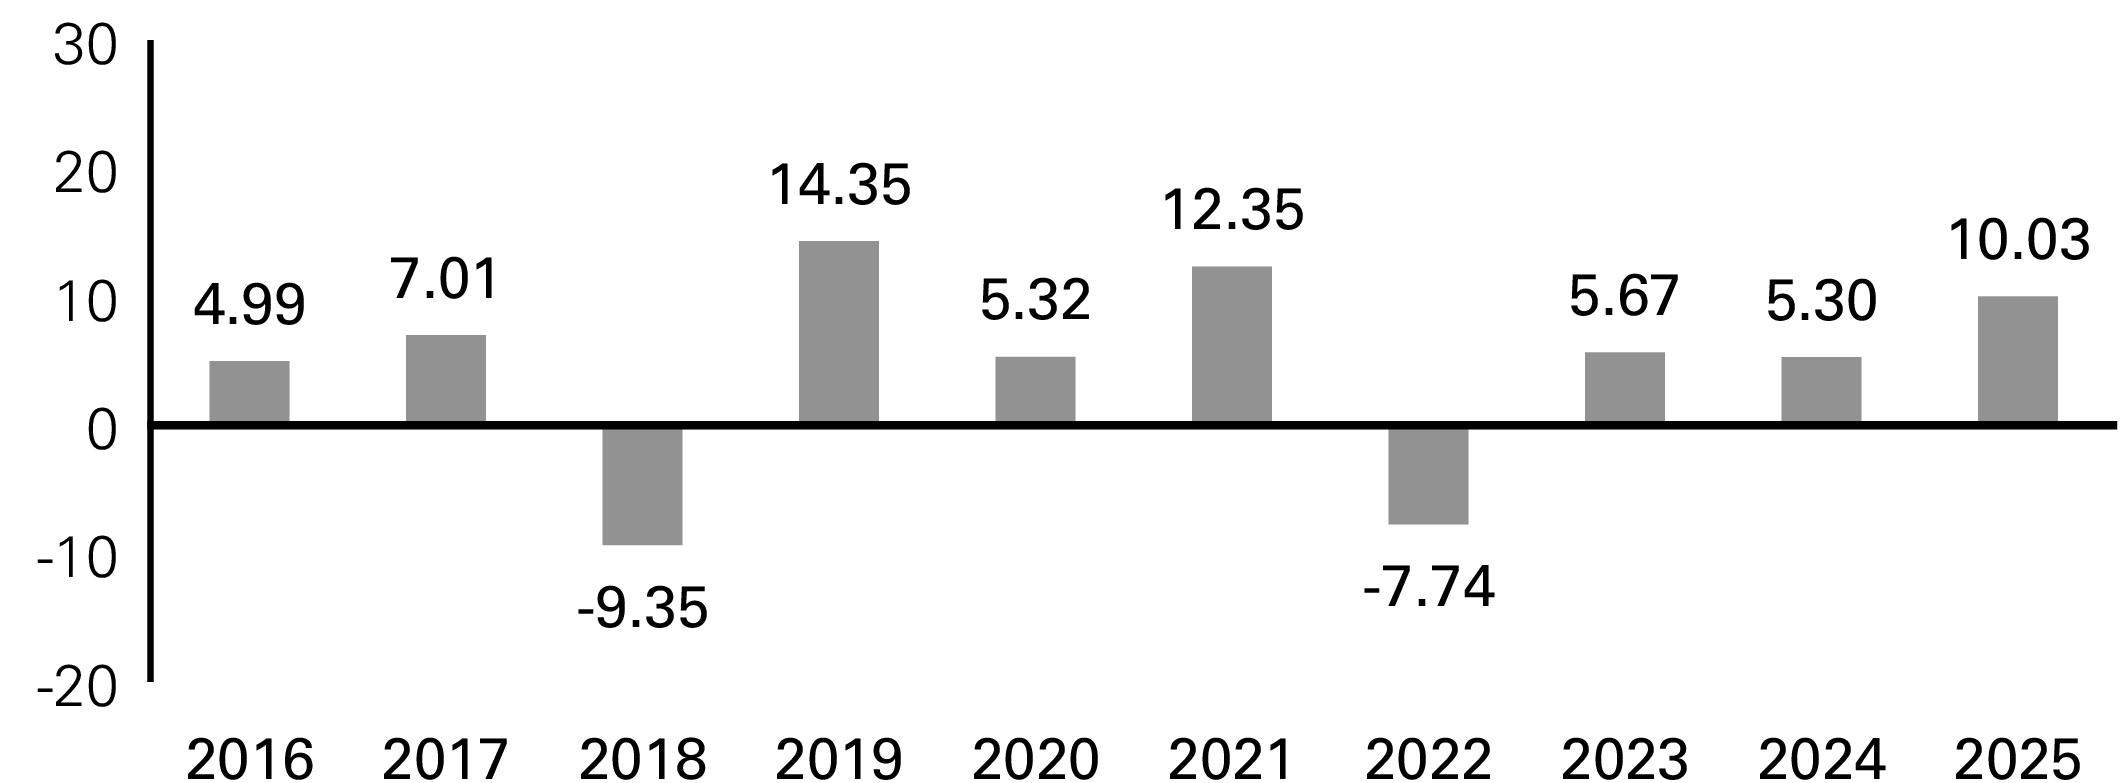
(For periods ended 12/31/2025 expressed as a %)
|
|
Class
Inception |
1
Year |
5
Years |
10
Years |
|
Class A before tax |
|
|
|
|
|
MSCI ACWI All Cap
Index (reflects no deduc-
tion for fees, expenses
or taxes) |
|
|
|
|
|
Bloomberg Global
Aggregate Index
(reflects no deduction for
fees, expenses or taxes) |
|
|
- |
|
|
Blended Index (reflects
no deduction for fees,
expenses or taxes) |
|
|
|
|
Prospectus May 1, 2026
9
DWS Alternative Asset Allocation VIP
Management
Investment Advisor
DWS Investment Management Americas, Inc.
Subadvisor
RREEF America L.L.C.
Portfolio Manager(s)
Darwei Kung, Managing Director and Head of Investment Strategy Liquid Real Assets. Portfolio Manager of the fund. Began managing the fund in 2013.
Purchase and Sale of Fund Shares
The fund is intended for use in a variable insurance product. You should contact the sponsoring insurance company for information on how to purchase and sell shares of the fund.
Tax Information
The fund normally distributes its net investment income and realized capital gains, if any, to its shareholders, the separate accounts of participating insurance companies. These distributions may not be taxable to the holders of variable annuity contracts and variable life insurance policies. For information concerning the federal income tax consequences for the holders of such contracts or policies, holders should consult the prospectus used in connection with the issuance of their particular contracts or policies.
Payments to Financial Intermediaries
If you purchase shares of the fund through selected affiliated and unaffiliated brokers, dealers, participating insurance companies or other financial intermediaries, the fund, the Advisor, and/or the Advisor’s affiliates, may pay the financial intermediary for the sale of fund shares and related services. These payments may create a conflict of interest by influencing the financial intermediary and your salesperson to recommend the fund over another investment. Ask your salesperson or visit your insurance company's Web site for more information.
Prospectus May 1, 2026
10
DWS Alternative Asset Allocation VIP
SHAREHOLDER FEES
|
(paid directly from your investment) |
|
(expenses that you pay each year as a % of the value of your investment)
|
Management fee |
|
|
Distribution/service (12b-1) fees |
|
|
Other expenses1 |
|
|
Total annual fund operating expenses |
|
1
|
|
1 Year |
3 Years |
5 Years |
10 Years |
|
|
$ |
$ |
$ |
$ |
| Prospectus May 1, 2026 | 11 | DWS Global Income Builder VIP |
Main Risks
Prospectus May 1, 2026
12
DWS Global Income Builder VIP
Prospectus May 1, 2026
13
DWS Global Income Builder VIP
Prospectus May 1, 2026
14
DWS Global Income Builder VIP
Prospectus May 1, 2026
15
DWS Global Income Builder VIP
Prospectus May 1, 2026
16
DWS Global Income Builder VIP
Prospectus May 1, 2026
17
DWS Global Income Builder VIP
|
|
|
|
|
|
|
|
|
|
|
|
|
|
|
|
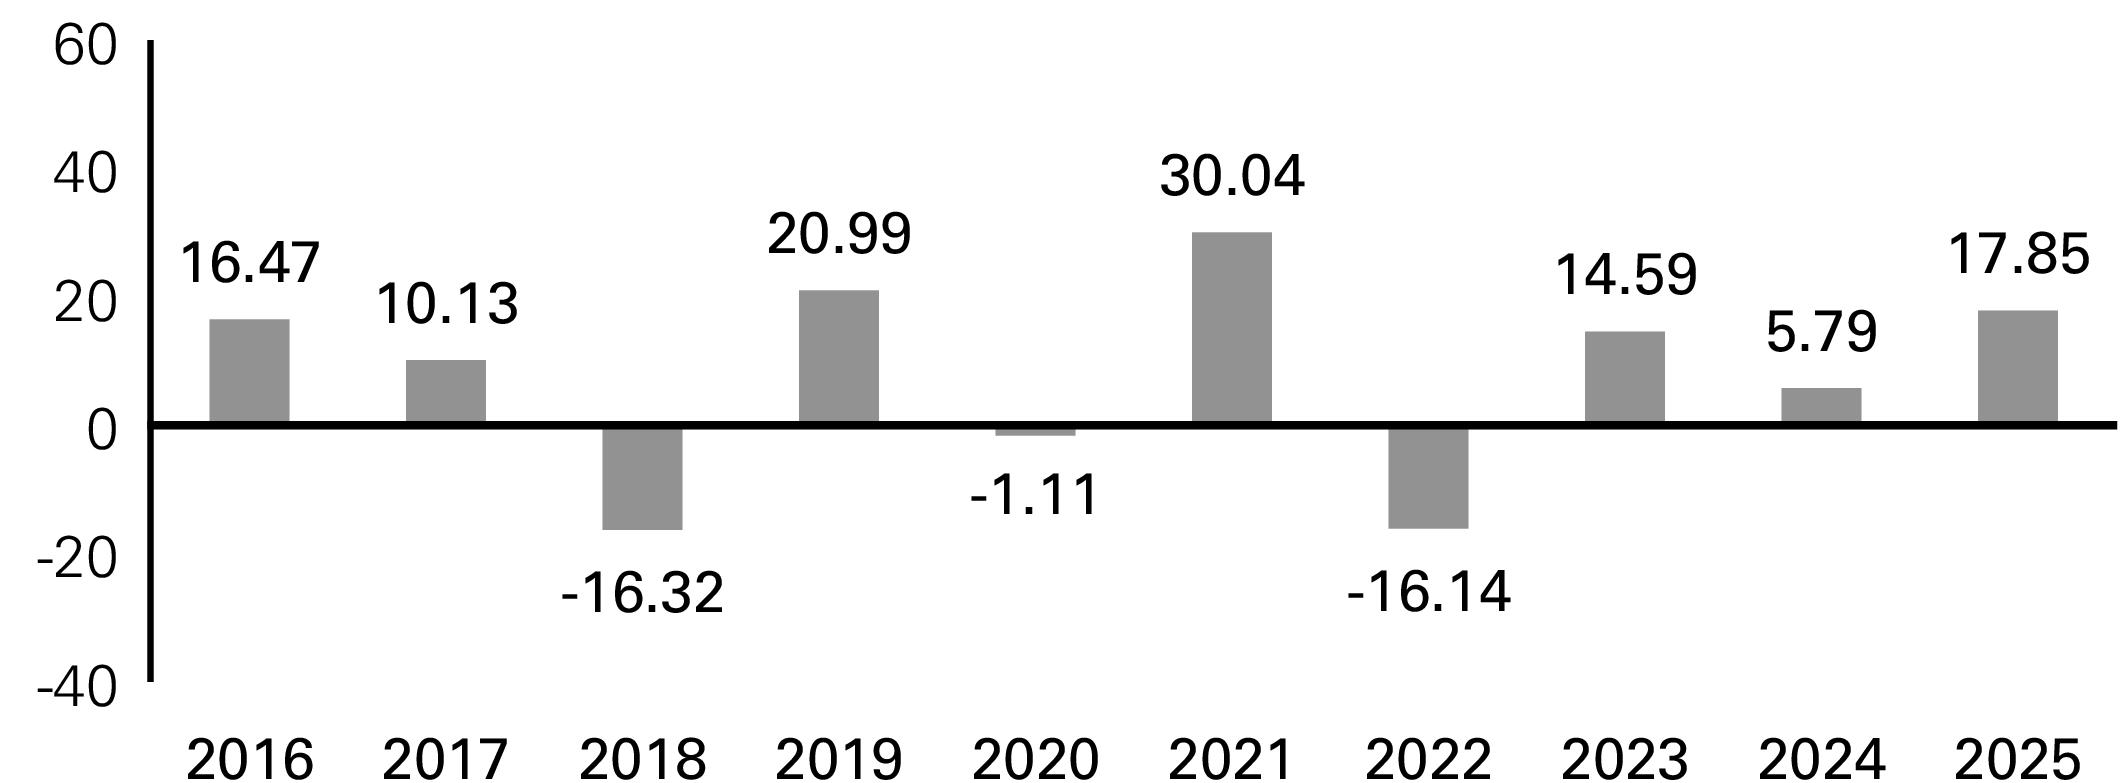
(For periods ended 12/31/2025 expressed as a %)
|
|
Class
Inception |
1
Year |
5
Years |
10
Years |
|
Class A before tax |
|
|
|
|
|
MSCI ACWI Index
(reflects no deduction for
fees, expenses or taxes) |
|
|
|
|
|
Bloomberg
U.S. Universal Index
(reflects no deduction for
fees, expenses or taxes) |
|
|
|
|
|
Blended Index (reflects
no deduction for fees,
expenses, or taxes) |
|
|
|
|
Management
Investment Advisor
DWS Investment Management Americas, Inc.
Portfolio Manager(s)
Darwei Kung, Managing Director and Head of Investment Strategy Liquid Real Assets. Portfolio Manager of the fund. Began managing the fund in 2013.
Di Kumble, CFA, Managing Director and Senior Portfolio Manager Equity. Portfolio Manager of the fund. Began managing the fund in 2014.
Purchase and Sale of Fund Shares
The fund is intended for use in a variable insurance product. You should contact the sponsoring insurance company for information on how to purchase and sell shares of the fund.
Tax Information
The fund normally distributes its net investment income and realized capital gains, if any, to its shareholders, the separate accounts of participating insurance companies. These distributions may not be taxable to the holders of variable annuity contracts and variable life insurance policies. For information concerning the federal income tax consequences for the holders of such contracts or policies, holders should consult the prospectus used in connection with the issuance of their particular contracts or policies.
Payments to Financial Intermediaries
If you purchase shares of the fund through selected affiliated and unaffiliated brokers, dealers, participating insurance companies or other financial intermediaries, the fund, the Advisor, and/or the Advisor’s affiliates, may pay the financial intermediary for the sale of fund shares and related services. These payments may create a conflict of interest by influencing the financial intermediary and your salesperson to recommend the fund over another investment. Ask your salesperson or visit your insurance company's Web site for more information.
Prospectus May 1, 2026
18
DWS Global Income Builder VIP
SHAREHOLDER FEES
|
(paid directly from your investment) |
|
(expenses that you pay each year as a % of the value of your investment)
|
Management fee |
|
|
Distribution/service (12b-1) fees |
|
|
Other expenses |
|
|
Total annual fund operating expenses |
|
|
Fee waiver/expense reimbursement |
|
|
Total annual fund operating expenses after fee waiver/
expense reimbursement |
|
|
|
1 Year |
3 Years |
5 Years |
10 Years |
|
|
$ |
$ |
$ |
$ |
| Prospectus May 1, 2026 | 19 | DWS Small Mid Cap Value VIP |
Main Risks
Prospectus May 1, 2026
20
DWS Small Mid Cap Value VIP
Prospectus May 1, 2026
21
DWS Small Mid Cap Value VIP
Prospectus May 1, 2026
22
DWS Small Mid Cap Value VIP
Prospectus May 1, 2026
23
DWS Small Mid Cap Value VIP
|
|
|
|
|
|
|
|
|
|
|
|
|
|
|
|
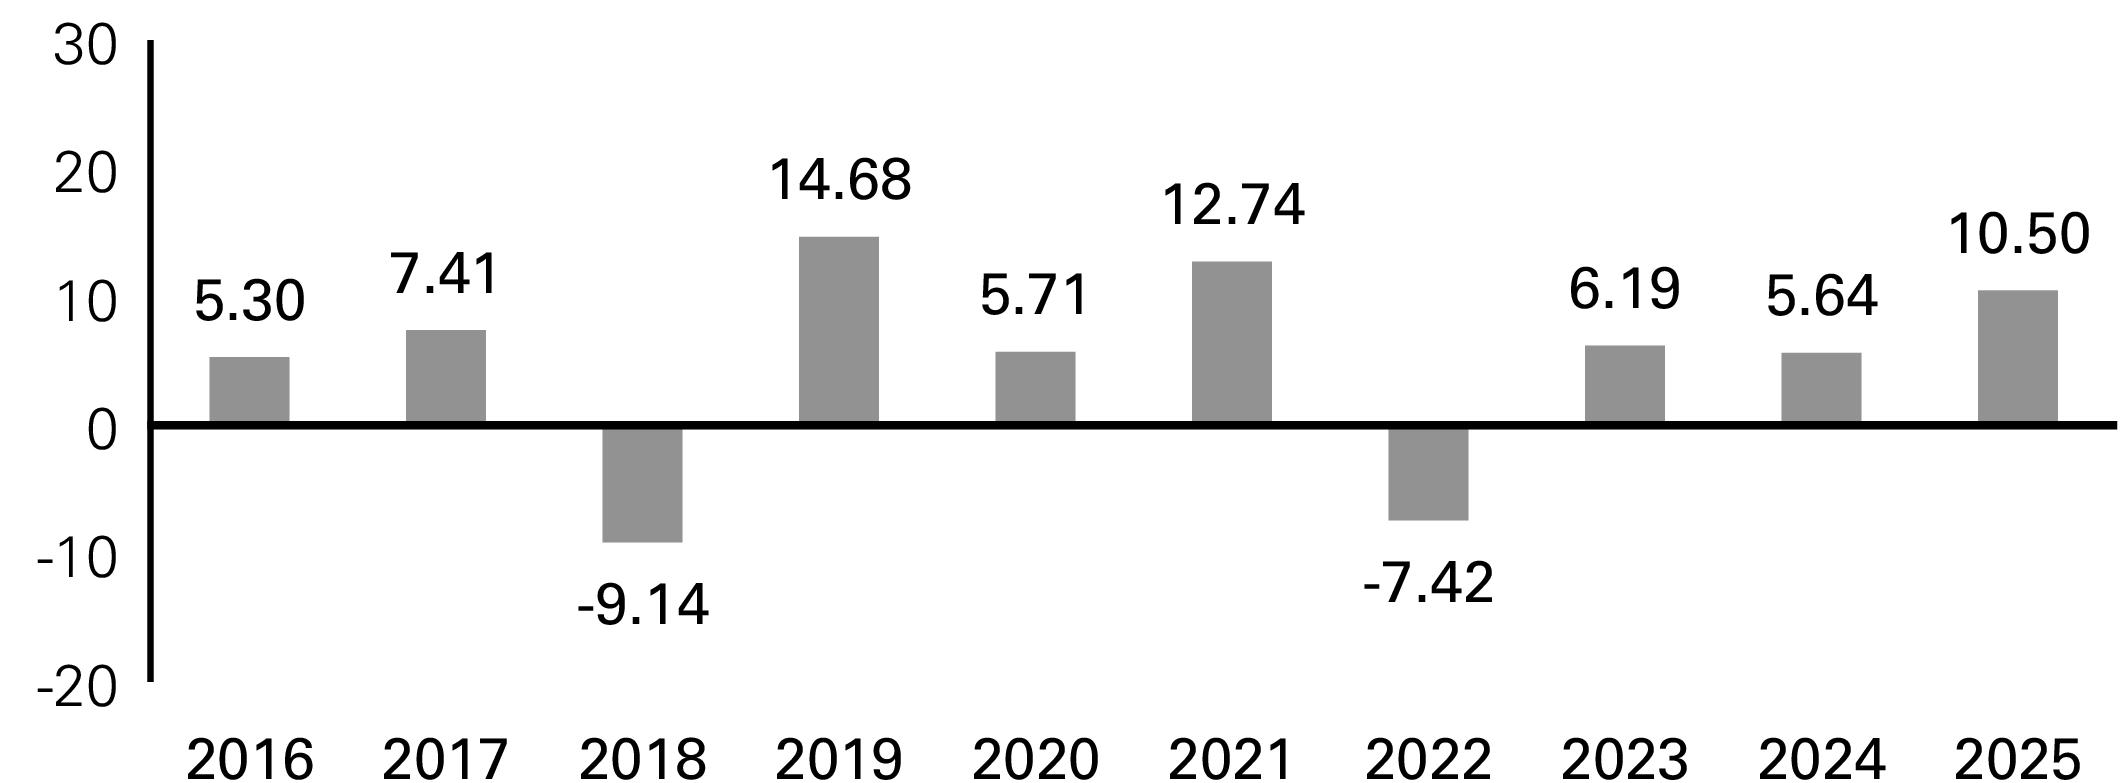
(For periods ended 12/31/2025 expressed as a %)
|
|
Class
Inception |
1
Year |
5
Years |
10
Years |
|
Class A before tax |
|
|
|
|
|
Russell 3000® Index
(reflects no deduction for
fees, expenses or taxes) |
|
|
|
|
|
Russell 2500™ Value
Index (reflects no deduc-
tion for fees, expenses
or taxes) |
|
|
|
|
Management
Investment Advisor
DWS Investment Management Americas, Inc.
Portfolio Manager(s)
Pankaj Bhatnagar, PhD, Managing Director and Head of Investment Strategy Equity. Portfolio Manager of the fund. Began managing the fund in 2019.
Hiten Shah, Director and Senior Portfolio Manager Equity. Portfolio Manager of the fund. Began managing the fund in 2024.
Purchase and Sale of Fund Shares
The fund is intended for use in a variable insurance product. You should contact the sponsoring insurance company for information on how to purchase and sell shares of the fund.
Tax Information
The fund normally distributes its net investment income and realized capital gains, if any, to its shareholders, the separate accounts of participating insurance companies. These distributions may not be taxable to the holders of
variable annuity contracts and variable life insurance policies. For information concerning the federal income tax consequences for the holders of such contracts or policies, holders should consult the prospectus used in connection with the issuance of their particular contracts or policies.
Payments to Financial Intermediaries
If you purchase shares of the fund through selected affiliated and unaffiliated brokers, dealers, participating insurance companies or other financial intermediaries, the fund, the Advisor, and/or the Advisor’s affiliates, may pay the financial intermediary for the sale of fund shares and related services. These payments may create a conflict of interest by influencing the financial intermediary and your salesperson to recommend the fund over another investment. Ask your salesperson or visit your insurance company's Web site for more information.
Prospectus May 1, 2026
24
DWS Small Mid Cap Value VIP
SHAREHOLDER FEES
|
(paid directly from your investment) |
|
(expenses that you pay each year as a % of the value of your investment)
|
Management fee |
|
|
Distribution/service (12b-1) fees |
|
|
Other expenses1 |
|
|
Total annual fund operating expenses |
|
|
Fee waiver/expense reimbursement |
|
|
Total annual fund operating expenses after fee waiver/
expense reimbursement |
|
1
|
|
1 Year |
3 Years |
5 Years |
10 Years |
|
|
$ |
$ |
$ |
$ |
| Prospectus May 1, 2026 | 25 | DWS International Opportunities VIP |
Main Risks
Prospectus May 1, 2026
26
DWS International Opportunities VIP
Prospectus May 1, 2026
27
DWS International Opportunities VIP
Prospectus May 1, 2026
28
DWS International Opportunities VIP
|
|
|
|
|
|
|
|
|
|
|
|
|
|
|
|
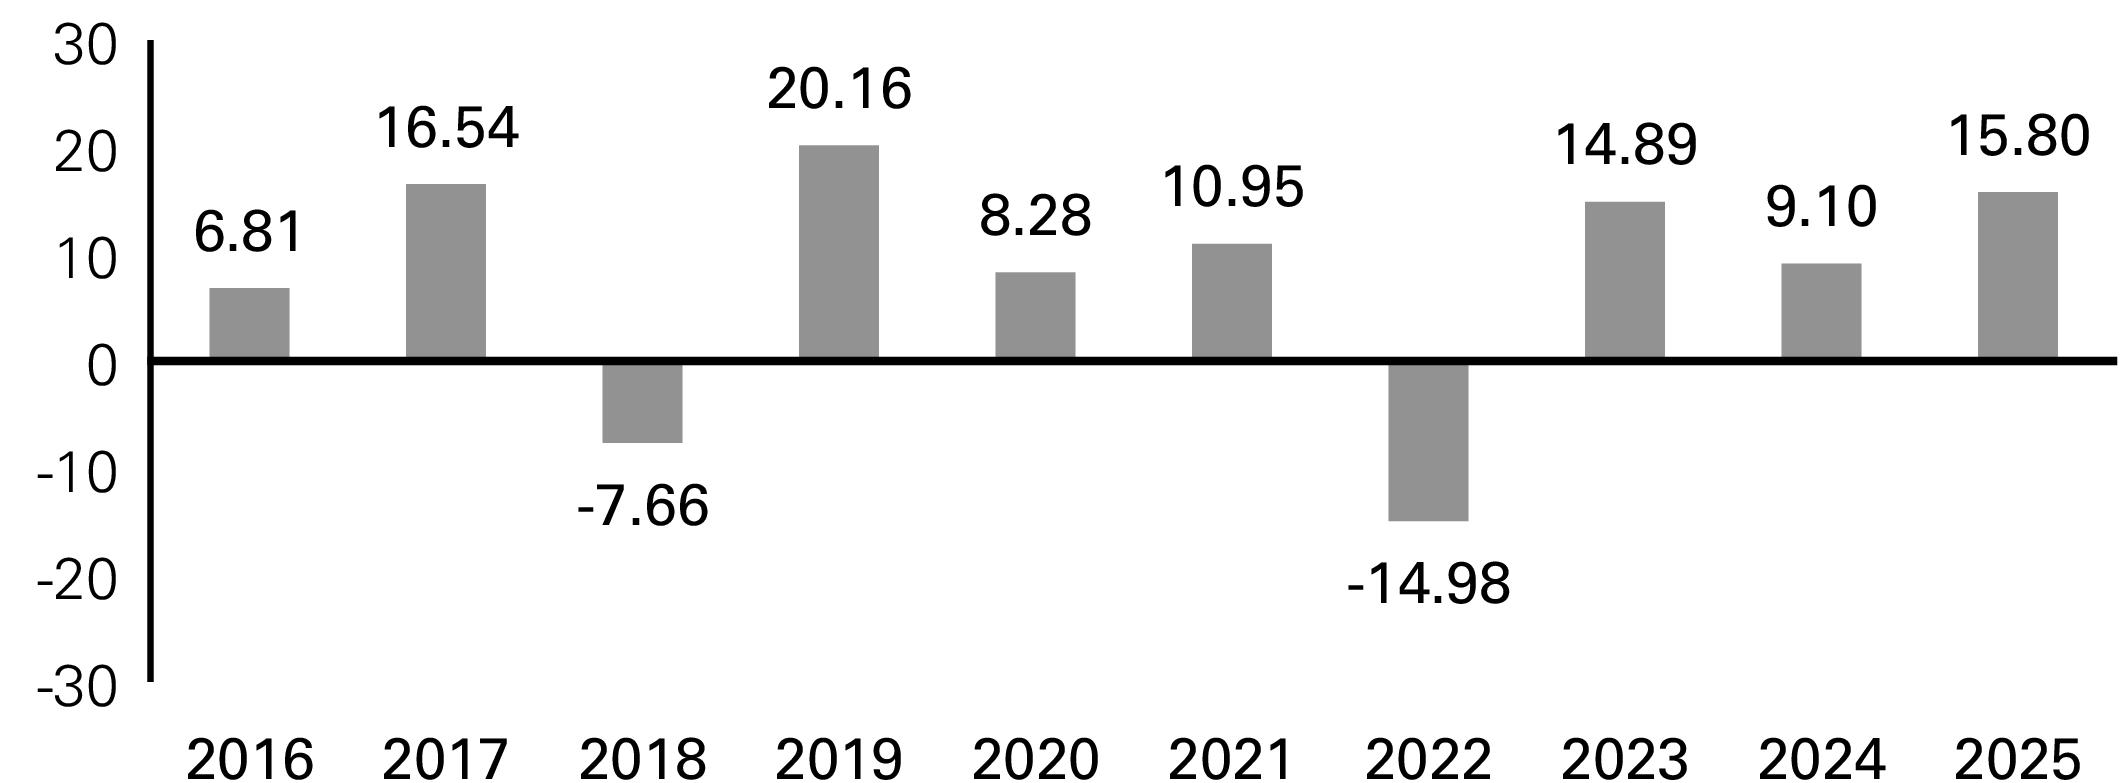
(For periods ended 12/31/2025 expressed as a %)
|
|
Class
Inception |
1
Year |
5
Years |
10
Years |
|
Class A before tax |
|
|
|
|
|
MSCI ACWI ex USA
Index (reflects no deduc-
tions for fees, expenses,
or taxes) |
|
|
|
|
Management
Investment Advisor
DWS Investment Management Americas, Inc.
Portfolio Manager(s)
Sebastian P. Werner, PhD, Managing Director and Head of Investment Strategy Equity. Lead Portfolio Manager of the fund. Began managing the fund in 2013.
Purchase and Sale of Fund Shares
The fund is intended for use in a variable insurance product. You should contact the sponsoring insurance company for information on how to purchase and sell shares of the fund.
Tax Information
The fund normally distributes its net investment income and realized capital gains, if any, to its shareholders, the separate accounts of participating insurance companies. These distributions may not be taxable to the holders of variable annuity contracts and variable life insurance policies. For information concerning the federal income tax consequences for the holders of such contracts or policies, holders should consult the prospectus used in connection with the issuance of their particular contracts or policies.
Payments to Financial Intermediaries
If you purchase shares of the fund through selected affiliated and unaffiliated brokers, dealers, participating insurance companies or other financial intermediaries, the fund, the Advisor, and/or the Advisor’s affiliates, may pay the financial intermediary for the sale of fund shares and related services. These payments may create a conflict of interest by influencing the financial intermediary and your salesperson to recommend the fund over another investment. Ask your salesperson or visit your insurance company's Web site for more information.
Prospectus May 1, 2026
29
DWS International Opportunities VIP
SHAREHOLDER FEES
|
(paid directly from your investment) |
|
(expenses that you pay each year as a % of the value of your investment)
|
Management fee |
|
|
Distribution/service (12b-1) fees |
|
|
Other expenses1 |
|
|
Total annual fund operating expenses |
|
|
Fee waiver/expense reimbursement |
|
|
Total annual fund operating expenses after fee waiver/
expense reimbursement |
|
1
|
|
1 Year |
3 Years |
5 Years |
10 Years |
|
|
$ |
$ |
$ |
$ |
| Prospectus May 1, 2026 | 30 | DWS High Income VIP |
Main Risks
Prospectus May 1, 2026
31
DWS High Income VIP
Prospectus May 1, 2026
32
DWS High Income VIP
Prospectus May 1, 2026
33
DWS High Income VIP
|
|
|
|
|
|
|
|
|
|
|
|
|
|
|
|
Prospectus May 1, 2026
34
DWS High Income VIP
(For periods ended 12/31/2025 expressed as a %)
|
|
Class
Inception |
1
Year |
5
Years |
10
Years |
|
Class A before tax |
|
|
|
|
|
Bloomberg U.S. Aggre-
gate Bond Index
(reflects no deductions
for fees, expenses, or
taxes) |
|
|
- |
|
|
ICE BofA US High Yield
Index (reflects no deduc-
tions for fees, expenses,
or taxes) |
|
|
|
|
Management
Investment Advisor
DWS Investment Management Americas, Inc.
Portfolio Manager(s)
Kirk Maurer, CFA, Director and Portfolio Manager Fixed Income. Portfolio Manager of the fund. Began managing the fund in 2023.
Sarah Rowin, CFA, Director and Senior Portfolio Manager & Team Lead Fixed Income. Portfolio Manager of the fund. Began managing the fund in 2023.
Nick Soroka, Director and Senior Portfolio Manager & Team Lead Fixed Income. Portfolio Manager of the fund. Began managing the fund in 2023.
Purchase and Sale of Fund Shares
The fund is intended for use in a variable insurance product. You should contact the sponsoring insurance company for information on how to purchase and sell shares of the fund.
Tax Information
The fund normally distributes its net investment income and realized capital gains, if any, to its shareholders, the separate accounts of participating insurance companies. These distributions may not be taxable to the holders of variable annuity contracts and variable life insurance policies. For information concerning the federal income tax consequences for the holders of such contracts or policies, holders should consult the prospectus used in connection with the issuance of their particular contracts or policies.
Payments to Financial Intermediaries
If you purchase shares of the fund through selected affiliated and unaffiliated brokers, dealers, participating insurance companies or other financial intermediaries, the fund, the Advisor, and/or the Advisor’s affiliates, may pay
the financial intermediary for the sale of fund shares and related services. These payments may create a conflict of interest by influencing the financial intermediary and your salesperson to recommend the fund over another investment. Ask your salesperson or visit your insurance company's Web site for more information.
Prospectus May 1, 2026
35
DWS High Income VIP
SHAREHOLDER FEES
|
(paid directly from your investment) |
|
(expenses that you pay each year as a % of the value of your investment)
|
Management fee |
|
|
Distribution/service (12b-1) fees |
|
|
Other expenses1 |
|
|
Total annual fund operating expenses |
|
|
Fee waiver/expense reimbursement |
|
|
Total annual fund operating expenses after fee waiver/
expense reimbursement |
|
1
|
|
1 Year |
3 Years |
5 Years |
10 Years |
|
|
$ |
$ |
$ |
$ |
| Prospectus May 1, 2026 | 36 |
Main Risks
Prospectus May 1, 2026
37
DWS CROCI® U.S. VIP
Prospectus May 1, 2026
38
DWS CROCI® U.S. VIP
Prospectus May 1, 2026
39
DWS CROCI® U.S. VIP
|
|
|
|
|
|
|
|
|
|
|
|
|
|
|
|
(For periods ended 12/31/2025 expressed as a %)
|
|
Class
Inception |
1
Year |
5
Years |
10
Years |
|
Class A before tax |
|
|
|
|
|
Russell 1000® Index
(reflects no deduction for
fees, expenses or taxes) |
|
|
|
|
|
Russell 1000® Value
Index (reflects no deduc-
tion for fees, expenses
or taxes) |
|
|
|
|
Management
Investment Advisor
DWS Investment Management Americas, Inc.
Portfolio Manager(s)
Di Kumble, CFA, Managing Director and Senior Portfolio Manager Equity. Portfolio Manager of the fund. Began managing the fund in 2016.
John Moody, Vice President and Portfolio Manager Equity. Portfolio Manager of the fund. Began managing the fund in 2016.
Purchase and Sale of Fund Shares
The fund is intended for use in a variable insurance product. You should contact the sponsoring insurance company for information on how to purchase and sell shares of the fund.
Tax Information
The fund normally distributes its net investment income and realized capital gains, if any, to its shareholders, the separate accounts of participating insurance companies. These distributions may not be taxable to the holders of variable annuity contracts and variable life insurance policies. For information concerning the federal income tax consequences for the holders of such contracts or policies, holders should consult the prospectus used in connection with the issuance of their particular contracts or policies.
Payments to Financial Intermediaries
If you purchase shares of the fund through selected affiliated and unaffiliated brokers, dealers, participating insurance companies or other financial intermediaries, the
Prospectus May 1, 2026
40
DWS CROCI® U.S. VIP
fund, the Advisor, and/or the Advisor’s affiliates, may pay the financial intermediary for the sale of fund shares and related services. These payments may create a conflict of interest by influencing the financial intermediary and your salesperson to recommend the fund over another investment. Ask your salesperson or visit your insurance company's Web site for more information.
Prospectus May 1, 2026
41
DWS CROCI® U.S. VIP
SHAREHOLDER FEES
|
(paid directly from your investment) |
|
(expenses that you pay each year as a % of the value of your investment)
|
Management fee |
|
|
Distribution/service (12b-1) fees |
|
|
Other expenses1 |
|
|
Total annual fund operating expenses |
|
1
|
|
1 Year |
3 Years |
5 Years |
10 Years |
|
|
$ |
$ |
$ |
$ |
| Prospectus May 1, 2026 | 42 | DWS Government Money Market VIP |
Main Risks
Prospectus May 1, 2026
43
DWS Government Money Market VIP
Prospectus May 1, 2026
44
DWS Government Money Market VIP
|
|
|
|
|
|
|
|
|
|
|
|
|
|
|
|
Prospectus May 1, 2026
45
DWS Government Money Market VIP
(For periods ended 12/31/2025 expressed as a %)
|
|
Class
Inception |
1
Year |
5
Years |
10
Years |
|
Class A before tax |
|
|
|
|
Management
Investment Advisor
DWS Investment Management Americas, Inc.
Purchase and Sale of Fund Shares
The fund is intended for use in a variable insurance product. You should contact the sponsoring insurance company for information on how to purchase and sell shares of the fund.
Tax Information
The fund normally distributes its net investment income and realized capital gains, if any, to its shareholders, the separate accounts of participating insurance companies. These distributions may not be taxable to the holders of variable annuity contracts and variable life insurance policies. For information concerning the federal income tax consequences for the holders of such contracts or policies, holders should consult the prospectus used in connection with the issuance of their particular contracts or policies.
Payments to Financial Intermediaries
If you purchase shares of the fund through selected affiliated and unaffiliated brokers, dealers, participating insurance companies or other financial intermediaries, the fund, the Advisor, and/or the Advisor’s affiliates, may pay the financial intermediary for the sale of fund shares and related services. These payments may create a conflict of interest by influencing the financial intermediary and your salesperson to recommend the fund over another investment. Ask your salesperson or visit your insurance company's Web site for more information.
Prospectus May 1, 2026
46
DWS Government Money Market VIP
SHAREHOLDER FEES
|
(paid directly from your investment) |
|
(expenses that you pay each year as a % of the value of your investment)
|
Management fee |
|
|
Distribution/service (12b-1) fees |
|
|
Other expenses |
|
|
Total annual fund operating expenses |
|
|
|
1 Year |
3 Years |
5 Years |
10 Years |
|
|
$ |
$ |
$ |
$ |
| Prospectus May 1, 2026 | 47 | DWS Small Mid Cap Growth VIP |
Main Risks
Prospectus May 1, 2026
48
DWS Small Mid Cap Growth VIP
Prospectus May 1, 2026
49
DWS Small Mid Cap Growth VIP
Prospectus May 1, 2026
50
DWS Small Mid Cap Growth VIP
|
|
|
|
|
|
|
|
|
|
|
|
|
|
|
|
(For periods ended 12/31/2025 expressed as a %)
|
|
Class
Inception |
1
Year |
5
Years |
10
Years |
|
Class A before tax |
|
|
|
|
|
Russell 3000® Index
(reflects no deduction for
fees, expenses or taxes) |
|
|
|
|
|
Russell 2500™ Growth
Index (reflects no deduc-
tion for fees, expenses
or taxes) |
|
|
|
|
Management
Investment Advisor
DWS Investment Management Americas, Inc.
Portfolio Manager(s)
Peter Barsa, Director and Senior Portfolio Manager Equity. Portfolio Manager of the fund. Began managing the fund in 2017.
Purchase and Sale of Fund Shares
The fund is intended for use in a variable insurance product. You should contact the sponsoring insurance company for information on how to purchase and sell shares of the fund.
Tax Information
The fund normally distributes its net investment income and realized capital gains, if any, to its shareholders, the separate accounts of participating insurance companies. These distributions may not be taxable to the holders of variable annuity contracts and variable life insurance policies. For information concerning the federal income tax
Prospectus May 1, 2026
51
DWS Small Mid Cap Growth VIP
consequences for the holders of such contracts or policies, holders should consult the prospectus used in connection with the issuance of their particular contracts or policies.
Payments to Financial Intermediaries
If you purchase shares of the fund through selected affiliated and unaffiliated brokers, dealers, participating insurance companies or other financial intermediaries, the fund, the Advisor, and/or the Advisor’s affiliates, may pay the financial intermediary for the sale of fund shares and related services. These payments may create a conflict of interest by influencing the financial intermediary and your salesperson to recommend the fund over another investment. Ask your salesperson or visit your insurance company's Web site for more information.
Prospectus May 1, 2026
52
DWS Small Mid Cap Growth VIP
Fund Details
Additional Information About Fund Strategies and Risks
DWS Alternative Asset Allocation VIP
Investment Objective
The fund seeks capital appreciation.
Principal Investment Strategies
Main Investments. The fund seeks to achieve its objective by investing in alternative (or non-traditional) investment strategies. Investments may be made in other DWS funds (i.e., mutual funds, exchange-traded funds (ETFs) and other pooled investment vehicles managed by DWS Investment Management Americas, Inc., the fund's investment advisor, or one of its affiliates), or directly in the securities and derivative instruments in which such DWS fund could invest. Currently, the fund generally focuses on investing in other DWS funds. The fund may also invest in securities of unaffiliated mutual funds, ETFs or exchange-traded notes (ETNs) when the economic exposure to a particular market or sector is not available through a DWS fund, the unaffiliated fund provides a complimentary exposure to a DWS fund in a particular market or sector, or to implement a tactical allocation. (DWS funds and unaffiliated mutual funds, ETFs and ETNs are collectively referred to as “underlying funds”.) The fund may invest in passive ETFs which seek to replicate the performance of an index, and in active ETFs, which do not replicate an index and are actively managed. The fund’s allocations among direct investments and underlying funds may vary over time.
Due to regulatory changes, effective June 11, 2026, under normal circumstances, the fund invests at least 80% of net assets, plus the amount of any borrowings for investment purposes, in investments with alternative (or non-traditional) investment strategies in the following categories: Real Assets, Alternative Fixed Income, Alternative Equity, Absolute Return and Opportunistic. Derivative instruments that provide exposure to the investments above or exposure to one or more market risk factors associated with such investments are included in the fund’s 80% investment policy, consistent with the fund’s investment policies and limitations with respect to investments in derivatives.
Management process. Portfolio management utilizes a strategic asset allocation process to determine the non-traditional or alternative investment strategies that should be represented in the fund’s portfolio. Investment strategies generally will fall into the following categories: Real Assets, Alternative Fixed Income, Alternative Equity, Absolute Return and Opportunistic. Real Asset investments have a tangible or physical aspect such as real estate or commodities. Alternative Fixed Income investments seek to offer exposure to categories generally not included in investors’ allocations, such as bank loans and high-yield debt securities (i.e. “junk bonds”), and to foreign investments, many of which are not denominated in US dollars. Alternative Equity investments are investments primarily in convertible and preferred instruments that offer equity exposure. Absolute Return investments include: (1) strategies that seek positive returns in all market environments and (2) cash or cash-like investments. Opportunistic investments are investments outside the other categories that may be identified by portfolio management as representing an opportunity to utilize a new alternative investment strategy. Portfolio management also utilizes a tactical asset allocation process to adjust allocations in response to short-term market changes. Tactical allocations reflect views from DWS’s Chief Investment Officer and global research platform. Tactical allocations, which may include derivative instruments, have shorter investment horizons as positions reflect short-term views and are implemented by appropriately changing the existing allocations.
Portfolio management may make allocations ranging from 0% to 30% of the fund's assets (exclusive of assets allocated to the currency and interest rate strategies described below) in a particular strategy or asset category, including the following DWS mutual funds and Xtrackers ETFs or directly in such securities and derivative instruments in which the DWS fund can invest:
| Prospectus May 1, 2026 | 53 | Fund Details |
■
DWS Emerging Markets Equity Fund. The fund seeks long-term growth of capital. Under normal circumstances, the fund invests at least 80% of net assets, plus the amount of any borrowings for investment purposes, in emerging market equities (equities traded mainly in emerging markets or issued by companies that are organized in emerging markets or have more than half of their business there). The fund invests primarily in common stocks, but may also invest in preferred stocks or convertible securities.
■
DWS Emerging Markets Fixed Income Fund. The fund seeks to provide high current income and, secondarily, long-term capital appreciation. Under normal circumstances, the fund invests at least 80% of net assets, plus the amount of any borrowings for investment purposes, in high yield bonds (also known as “junk bonds”) and other debt securities issued by governments and corporations in emerging market countries (i.e., the issuer is traded mainly in an emerging market, the issuer is organized under the laws of an emerging market country or is a company with more than half of its business in emerging markets) or the return on which is derived primarily from emerging markets. The fund may invest without limit in investment-grade debt securities and in junk bonds, which are those below the fourth credit grade (grade BB/Ba and below) and may include debt securities not currently paying interest and debt securities in default. The fund may also invest in derivatives instruments including Treasury futures, forward currency contracts and credit default swaps. The fund invests at least 50% of total assets in US dollar denominated securities.
■
DWS Enhanced Commodity Strategy Fund. The fund’s investment objective is total return. Currently, under normal circumstances, the fund invests in commodity-linked derivative instruments (a contract whose value is based on a particular commodity) backed by a portfolio of fixed income instruments. Effective October 1, 2026, under normal circumstances, the fund invests at least 80% of net assets, plus the amount of any borrowings for investment purposes, in commodity-linked derivative instruments backed by a portfolio of fixed income instruments. For purposes of the 80% investment policy, a commodity-linked derivative instrument is a contract whose value is based on a particular commodity, such as commodity-linked total return swap contracts, options and futures contracts, to gain exposure to the investment return of assets that trade in the commodity markets, without investing directly in physical commodities. Physical commodities are assets that have tangible properties such as gas, heating oil, industrial and other precious metals, livestock or agricultural products. Derivatives instruments that provide exposure to one or more market risk factors associated with such investments are included in the fund’s 80% investment policy, consistent with the fund’s investment policies and limitations with respect to investments in derivatives. The
fund may gain exposure to the commodity markets by investing in a wholly-owned subsidiary formed under the laws of the Cayman Islands, which shares the same portfolio management team as the fund and is expected to invest mainly in commodity-linked derivative instruments and fixed-income instruments, some of which may serve as margin or collateral for the subsidiary's derivatives positions. The fund concentrates its investments in commodities-related industries. The fund and its wholly-owned subsidiary are each a “commodity pool” and are subject to the requirements of the Commodity Exchange Act, as amended (CEA) and the rules of the Commodity Futures Trading Commission (CFTC) promulgated thereunder.
■
DWS Global High Income Fund. The fund seeks high current income and, as a secondary objective, capital appreciation. Currently, under normal conditions, the fund invests at least 65% of total assets in domestic and foreign below investment grade debt securities (rated below the fourth highest credit rating category, junk bonds), including those whose issuers are located in countries with new or emerging securities markets. Effective June 11, 2026, under normal circumstances, the fund invests at least 80% of net assets, plus the amount of any borrowings for investment purposes, in domestic and foreign below investment grade debt securities (i.e. junk bonds) (those rated below the fourth highest credit rating category or, if unrated, determined by the Advisor to be of similar quality), including those whose issuers are located in countries with new or emerging securities markets. Derivative instruments that provide exposure to the investments above or exposure to one or more market risk factors associated with such investments are included in the fund’s 80% investment policy, consistent with the fund’s investment policies and limitations with respect to investments in derivatives. The fund will generally invest in at least three different countries and will normally invest at least 40% of net assets in securities of foreign issuers. The fund invests in securities of varying maturities and intends to maintain a dollar-weighted effective average portfolio maturity that will not exceed ten years. Subject to its portfolio maturity policy, the fund may purchase individual securities with any stated maturity. The fund may invest in securities of any credit quality, and may include debt securities not paying interest currently and securities in default. The fund may invest up to 15% of total assets in credit default swaps to buy or sell protection on credit exposure, and up to 5% of net assets in common stocks, preferred shares and other equity securities. The fund may invest up to 35% of total assets in cash or money market instruments to maintain liquidity or in the event portfolio management determines that securities meeting the fund’s investment objectives are not readily available for purchase. The fund may also purchase convertible securities, securities on a when-issued basis and engage in short sales.
Prospectus May 1, 2026
54
Fund Details
■
DWS RREEF Global Infrastructure Fund. The fund seeks total return from both capital appreciation and current income. Currently, under normal circumstances, the fund invests at least 80% of its net assets in the securities of US and non-US infrastructure-related companies. Effective June 11, 2026, under normal circumstances, the fund invests at least 80% of net assets, plus the amount of any borrowings for investment purposes, in the securities of US and non-US infrastructure-related companies. Under normal circumstances, the fund invests mainly in equity securities, though the fund may also invest in fixed-income securities without limitation. The fund will invest 25% or more of its total assets in securities of companies engaged principally in infrastructure-related companies. The fund may invest in companies of any market capitalization.
■
DWS RREEF Global Real Estate Securities Fund. The fund’s investment objective is to seek total return through a combination of current income and long-term capital appreciation. Under normal circumstances, the fund will invest at least 80% of its net assets, plus the amount of any borrowings for investment purposes, in equity and debt securities issued by real estate companies, such as real estate investment trusts (REITs), REIT-like structures or real estate operating companies. The fund may invest without limitation in companies engaged principally in the real estate industry.
■
DWS High Income Fund. The fund seeks the highest level of current income obtainable from a diversified portfolio of fixed-income securities which portfolio management considers consistent with reasonable risk. As a secondary objective, the fund will seek capital gain where consistent with its primary objective. Currently, under normal circumstances, the fund generally invests at least 65% of net assets, plus the amount of any borrowings for investment purposes, in junk bonds, which are those rated below the fourth highest credit rating category (that is, grade BB/Ba and below). Effective June 11, 2026, under normal circumstances, the fund invests at least 80% of net assets, plus the amount of any borrowings for investment purposes, in below investment grade debt securities (i.e. junk bonds) (which are those rated below the fourth highest credit rating category or, if unrated, determined by the Advisor to be of similar quality). Derivative instruments that provide exposure to the investments above or exposure to one or more market risk factors associated with such investments are included in the fund’s 80% investment policy, consistent with the fund’s investment policies and limitations with respect to investments in derivatives. The
fund may invest up to 50% of total assets in bonds denominated in US dollars or foreign currencies from foreign issuers, including issuers in emerging markets. The fund invests in securities of varying maturities and intends to maintain a dollar-weighted effective average portfolio maturity that will not exceed ten years. Subject to its portfolio maturity policy, the fund may purchase individual securities with any stated maturity.
■
DWS RREEF Real Estate Securities Fund. The fund’s investment objective is long-term capital appreciation and current income. Currently, under normal circumstances, the fund will invest at least 80% of its net assets, plus the amount of any borrowing for investment purposes (calculated at the time of any investment), in equity securities of real estate investment trusts (REITs) and real estate companies. Effective June 11, 2026, under normal circumstances, the fund invests at least 80% of net assets, plus the amount of any borrowing for investment purposes, in equity securities of real estate investment trusts (REITs) and real estate companies. The fund may invest without limitation in securities of companies engaged principally in the real estate industry. The fund may also invest a portion of its assets in other types of securities. These securities may include short term securities, bonds, notes, securities of companies not principally engaged in the real estate industry and other similar securities.
■
DWS Government Money Market Series. The fund seeks maximum current income to the extent consistent with stability of principal. The fund is a money market fund that is managed in accordance with federal regulations which govern the quality, maturity, diversity and liquidity of instruments in which a money market fund may invest. The fund operates as a “government money market fund,” as such term is defined under federal regulations. As a government money market fund, the fund is required to invest at least 99.5% of its total assets at the time of investment in cash, US government securities, and/or repurchase agreements that are collateralized by these instruments.
■
DWS Global Macro Fund. The fund seeks to achieve total return. The fund invests in equities (common and preferred), bonds, structured notes, money market instruments, exchange traded funds (ETFs), and cash. The fund may invest up to 15% of net assets in equity-linked notes (ELNs), which are structured notes that offer returns linked to the performance or value of a single equity security, a basket of equity securities, or an equity index. There are generally no limits on asset class exposures, provided that risk parameters set by portfolio management are met. The fund may also invest in alternative asset classes (including real estate, REITs, infrastructure, convertibles, commodities and currencies). The fund may achieve exposure to commodities by investing in commodities-linked derivatives. In addition, the fund may invest in ETFs, other registered investment companies or exchange-traded notes (ETNs) to gain
Prospectus May 1, 2026
55
Fund Details
exposure to certain asset classes, including commodities. The fund may also invest in asset backed securities, short-term securities and cash equivalents. The fund can invest in securities of any size, investment style category, maturity, duration or credit quality (including junk bonds, which are those rated below the fourth highest credit rating category (that is, grade BB/Ba and below)), and from any country (including emerging markets). Under normal conditions, the fund will have investment exposure to at least three countries and combined direct and indirect exposure to foreign securities, foreign currencies and other foreign investments (measured on a gross basis) equal to at least 40% of the fund’s net assets. The fund may have exposure to gold in an amount up to 10% of the fund’s total assets. The fund may gain exposure to gold by investing in a wholly-owned subsidiary formed under the laws of the Cayman Islands, which shares the same portfolio management team as the fund and invests mainly in gold ETFs that do not operate as commodity pools, and fixed income instruments.
■
DWS Central Cash Management Government Fund. The fund seeks maximum current income to the extent consistent with stability of principal. The fund operates as a “government money market fund,” as such term is defined under federal regulations. The fund is a money market fund that is managed in accordance with federal regulations which govern the quality, maturity, diversity and liquidity of instruments in which a money market fund may invest. As a government money market fund, the fund is required to invest at least 99.5% of its total assets at the time of investment in cash, US government securities, and/or repurchase agreements that are collateralized by these instruments.
■
Xtrackers RREEF Global Natural Resources ETF. The fund seeks total return from both capital appreciation and current income. The fund is an actively-managed exchange-traded fund (“ETF”) that does not seek to replicate the performance of a specific index. Under normal circumstances, the fund invests primarily in equity and equity-related securities, such as common stock, preferred stock, securities convertible into common stock, rights or warrants to purchase common stock and equity securities of real estate investment trusts (REITs). The fund may also invest in American Depositary Receipts (ADRs), European Depositary Receipts (EDRs) and Global Depositary Receipts (GDRs).
Portfolio management monitors the list of DWS funds in which the fund may invest, and may periodically add or remove DWS funds from the list to obtain exposure to new investment strategies, to replace underperforming DWS funds or to enhance returns. Based on portfolio management's assessment of market conditions, the fund is rebalanced periodically to maintain the desired asset allocation. In addition, the fund may seek exposure to hedge funds through warrants, swaps and similar derivative instruments.
Other DWS funds in which the fund may invest from time to time may include series of DBX ETF Trust, which are managed by DBX Advisors LLC. DWS Investment Management Americas, Inc. and DBX Advisors LLC are subsidiaries of DWS Group.
As of December 31, 2025, the fund’s allocation among investment strategies and underlying funds was:
|
Real Asset |
48
% |
|
DWS Enhanced Commodity Strategy Fund |
17
% |
|
DWS RREEF Global Infrastructure Fund |
17
% |
|
DWS RREEF Real Estate Securities Fund |
9
% |
|
Xtrackers RREEF Global Natural Resources ETF |
5
% |
|
Alternative Equity |
22
% |
|
State Street SPDR Bloomberg Convertible Securities ETF |
17
% |
|
iShares Preferred & Income Securities ETF |
5
% |
|
Alternative Fixed Income |
21
% |
|
DWS Floating Rate Fund |
9
% |
|
iShares JP Morgan USD Emerging Markets Bond ETF |
9
% |
|
DWS Emerging Markets Fixed Income Fund |
3
% |
|
Absolute Return |
8
% |
|
DWS Global Macro Fund |
8
% |
|
Cash Equivalents |
1
% |
|
DWS Central Cash Management Government Fund |
1
% |
|
Other Assets and Liabilities, Net |
0
% |
|
Total |
100
% |
It is possible that the fund’s allocations may be focused in particular industries, asset classes, or sectors of the economy. The fund’s allocations among investment strategies and underlying funds will change over time and there should be no expectation that current or past positions will be maintained in the future.
Currency and interest rate strategies. In addition to the fund’s or an underlying fund’s main investment strategy, portfolio management of the fund or certain underlying funds may, from time to time, seek to enhance returns by employing proprietary quantitative currency strategies across developed and emerging market currencies using derivatives, which are financial instruments whose performance is derived, at least in part, from the performance of an underlying asset, security or index. In particular, portfolio management may use forward currency contracts. Three main strategies may be employed: a carry strategy, a momentum strategy and a valuation strategy. In implementing the carry strategy, portfolio management of the fund or certain underlying funds will use a “relative value” analysis, seeking to systematically sell low interest rate currencies and buy high interest rate currencies. In implementing the momentum strategy, portfolio management of the fund or certain underlying funds will use multi-year exchange rate trends, seeking to systematically sell lower returning currencies and buy higher returning currencies.
Prospectus May 1, 2026
56
Fund Details
In implementing the valuation strategy, portfolio management of the fund or certain underlying funds will use a “fair value” analysis, seeking to systematically buy “undervalued” currencies and sell “overvalued” currencies.
Portfolio management of the fund or certain underlying funds also may, from time to time, seek to enhance returns by employing various strategies to identify interest rate trends across developed markets using derivatives, in particular buying and selling interest rate futures contracts. In implementing these strategies, portfolio management of the fund or certain underlying funds may utilize proprietary rules-based interest rate indices.
The notional amount of the fund’s or an underlying fund's aggregate currency and interest rate exposure resulting from these strategies may significantly exceed the net assets of the fund or an underlying fund (and at times may exceed two times the fund’s or an underlying fund's net assets).
Securities lending. The fund may lend securities (up to one-third of total assets) to approved institutions, such as registered broker-dealers, pooled investment vehicles, banks and other financial institutions. In connection with such loans, the fund receives liquid collateral in an amount that is based on the type and value of the securities being lent, with riskier securities generally requiring higher levels of collateral.
Other Investment Strategies
Derivatives. Outside of the currency and interest rate strategies, the fund and the underlying funds in which the fund invests, may also use other types of derivatives (e.g., options, futures, forward currency contracts, commodity-linked derivatives, interest rate swaps and total return swaps) (i) for hedging purposes; (ii) for risk management; (iii) for non-hedging purposes to seek to enhance potential gains; or (iv) as a substitute for direct investment in a particular asset class or to keep cash on hand to meet shareholder redemptions.
Main Risks
There are several risk factors that could hurt the fund’s performance, cause you to lose money or cause the fund’s performance to trail that of other investments. The fund may not achieve its investment objective, and is not intended to be a complete investment program. An investment in the fund is not a deposit of a bank and is not insured or guaranteed by the Federal Deposit Insurance Corporation or any other governmental agency.
Because the fund invests in one or more underlying funds, the risks listed here include those of the underlying funds as well as those of the fund itself. Therefore, in these risk descriptions the term “the fund” may refer to the fund itself, one or more underlying funds, or both.
Asset allocation risk. Portfolio management may favor one or more types of investments or assets that underperform other investments, assets, or securities markets as a whole. Anytime portfolio management buys or sells securities in order to adjust the fund’s asset allocation this will increase portfolio turnover and generate transaction costs.
Security selection risk. The securities in the fund’s portfolio may decline in value. Portfolio management could be wrong in its analysis of industries, companies, economic trends, the relative attractiveness of different securities or other matters.
Stock market risk. When stock prices fall, you should expect the value of your investment to fall as well. Stock prices can be hurt by poor management on the part of the stock’s issuer, shrinking product demand and other business risks, such as rapid technological developments or widespread adoption of emerging technologies (such as artificial intelligence) impacting the issuer’s competitive position, cybersecurity incidents, financial leverage and labor and supply shortages. These may affect single companies as well as groups of companies. The market as a whole may not favor the types of investments the fund makes, which could adversely affect a stock’s price, regardless of how well the company performs, or the fund’s ability to sell a stock at an attractive price. There is a chance that stock prices overall will decline because stock markets tend to move in cycles, with periods of rising and falling prices. Events in the US and global financial markets, including actions taken by the US Federal Reserve or foreign central banks to stimulate or stabilize economic growth, may at times result in unusually high market volatility which could negatively affect performance. High market volatility may also result from significant shifts in momentum of one or more specific stocks due to unusual increases or decreases in trading activity. Momentum can change quickly, and securities subject to shifts in momentum may be more volatile than the market as a whole and returns on such securities may drop precipitously. To the extent that the fund invests in a particular geographic region, capitalization or sector, the fund’s performance may be affected by the general performance of that region, capitalization or sector.
Market disruption risk. Economies and financial markets throughout the world have become increasingly interconnected, which has increased the likelihood that events or conditions in one country or region will adversely impact markets or issuers in other countries or regions. This includes reliance on global supply chains that are susceptible to disruptions resulting from, among other things, war and other armed conflicts, tariffs, extreme weather events, and natural disasters. Such supply chain disruptions can lead to, and have led to, economic and market disruptions that have far-reaching effects on financial markets worldwide. The value of the fund’s investments may be negatively affected by adverse changes in overall economic or market conditions, such as the level of
Prospectus May 1, 2026
57
Fund Details
economic activity and productivity, unemployment and labor force participation rates, inflation or deflation (and expectations for inflation or deflation), interest rates, demand and supply for particular products or resources including labor, debt levels and credit ratings, and trade policies, among other factors. Such adverse conditions may contribute to an overall economic contraction across entire economies or markets, which may negatively impact the profitability of issuers operating in those economies or markets. In addition, geopolitical and other globally interconnected occurrences, including war and other armed conflicts, terrorism, economic uncertainty or financial crises, contagion, tariffs and trade disputes, government debt crises (including defaults or downgrades) or uncertainty about government debt payments, government shutdowns, public health crises, natural disasters, supply chain disruptions, climate change and related events or conditions, have led, and in the future may lead, to disruptions in the US and world economies and markets, which may increase financial market volatility and have significant adverse direct or indirect effects on the fund and its investments. Ongoing trade disputes between the United States and other countries may lead to tariffs and investment restrictions, negatively impacting affected companies and their securities. These disputes can also harm the economies of the United States and its trading partners, as well as financial markets overall. Adverse market conditions or disruptions could cause the fund to lose money, experience significant redemptions, and encounter operational difficulties. Although multiple asset classes may be affected by adverse market conditions or a particular market disruption, the duration and effects may not be the same for all types of assets.
Current military and other armed conflicts in various geographic regions, including those in Europe and the Middle East, among others, can lead to, and have led to, economic and market disruptions, which may not be limited to the geographic region in which the conflict is occurring. Such conflicts can also result, and have resulted in some cases, in sanctions being levied by the United States, the European Union and/or other countries against countries or other actors involved in the conflict. In addition, such conflicts and related sanctions can adversely affect regional and global energy, commodities, financial and other markets and thus could affect the value of the fund's investments. The extent and duration of any military or other armed conflict, related sanctions and resulting economic and market disruptions are impossible to predict, but could be substantial.
Other market disruption events include pandemic spread of viruses, such as the novel coronavirus known as COVID-19, which have caused significant uncertainty, market volatility, decreased economic and other activity, increased government activity, including economic stimulus measures, and supply chain disruptions, and may adversely affect the fund and its investments.
In addition, markets are becoming increasingly susceptible to disruption events resulting from the use of new and emerging technologies, such as artificial intelligence, to engage in cyber-attacks or to take over the Web sites and/or social media accounts of companies, governmental entities or public officials, or to otherwise pose as or impersonate such, which then may be used to disseminate false or misleading information that can cause volatility in financial markets or for the securities of a particular company, group of companies, industry or other class of assets.
Adverse market conditions or particular market disruptions, such as those discussed above, may magnify the impact of each of the other risks described in this “MAIN RISKS” section and may increase volatility in one or more markets in which the fund invests leading to the potential for greater losses for the fund.
Inflation risk. Inflation risk is the risk that the real value of certain assets or real income from investments (the value of such assets or income after accounting for inflation) will be less in the future as inflation decreases the value of money. Inflation, and investors’ expectation of future inflation, can impact the current value of the fund's portfolio, resulting in lower asset values and losses to shareholders. This risk may be elevated compared to historical market conditions and could be impacted by monetary policy measures and the current interest rate environment.
Underlying funds risk. Because the fund may invest in underlying funds, the fund’s performance will be directly related to the performance of the underlying funds. To the extent that a given underlying fund underperforms its benchmark or its fund peer group, it may contribute to underperformance by the fund.
In addition, the fund indirectly pays a portion of the expenses incurred by the underlying funds, which lowers the fund’s returns. To the extent that the fund’s allocations favor underlying funds with higher expenses, the overall cost of investing paid by the fund will be higher.
The fund is also subject to the risk that an underlying fund may pay a redemption request made by the fund, wholly or partly, by an in-kind distribution of portfolio securities rather than in cash. The fund may hold such portfolio securities until the Advisor determines to dispose of them, and the fund will bear the market risk of the securities received in the redemption until their disposition. Upon disposing of such portfolio securities, the fund may experience increased brokerage commissions.
Conflict of interest risk. The Advisor or its affiliates earn fees at varying rates for providing services to the underlying DWS funds. The Advisor may therefore have a conflict of interest in selecting the underlying DWS funds and in determining whether to invest in an unaffiliated fund, from which the Advisor and its affiliates will not receive any fees. However, the Advisor is a fiduciary to the fund and will select investments that it believes are appropriate to meet the fund's investment objective. The DWS funds in
Prospectus May 1, 2026
58
Fund Details
which the fund invests may not have the lowest fees and may underperform other funds over certain time periods. In managing the fund, the Advisor does not canvass the entire universe of unaffiliated funds before selecting investments for the fund.
Concentration risk – underlying funds. Any underlying fund that concentrates in a particular segment of the market (such as commodities, infrastructure-related companies, natural resources companies and real estate securities) will generally be more volatile than a fund that invests more broadly. Any market price movements, regulatory or technological changes, or economic conditions affecting the particular market segment in which the underlying fund concentrates will have a significant impact on the underlying fund’s performance.
While the fund does not concentrate in a particular industry, it may concentrate in an underlying DWS fund, and there is risk for the fund with respect to the aggregation of holdings of underlying funds. The aggregation of holdings of underlying funds may result in the fund having increased exposure to a particular industry or group of industries, or to a single issuer. Such increased exposure to industries or issuers may have the effect of increasing the volatility of the fund’s returns. The fund does not control the investments of the underlying funds, and any increased exposure to industries or issuers occurs as a result of the underlying funds following their own investment objectives and strategies. However, to the extent practicable, the fund will consider whether an underlying fund’s investments may create significant exposure to a particular industry or group of industries.
Non-diversification risk – underlying funds. While the fund is diversified, certain underlying funds may be classified as non-diversified under the Investment Company Act of 1940, as amended. This means that the underlying fund may invest in securities of relatively few issuers. Thus, the performance of one or a small number of portfolio holdings can affect overall performance of the underlying fund.
ETF risk. Because ETFs trade on a securities exchange, their shares may trade at a premium or discount to their net asset value. An ETF is subject to the risks of the assets in which it invests as well as those of the investment strategy it follows. The fund may incur brokerage costs when it buys and sells shares of an ETF and also bears its proportionate share of the ETF’s fees and expenses, which are passed through to ETF shareholders.
Fees and expenses incurred by an ETF may include trading costs, operating expenses, licensing fees, trustee fees and marketing expenses. With an index ETF, these costs may contribute to the ETF not fully matching the performance of the index it is designed to track. An actively-managed ETF may have a higher degree of portfolio turnover than a passively-managed index ETF and incur higher brokerage costs.
ETN risk. Because ETNs are senior, unsecured, unsubordinated debt securities of an issuer (typically a bank or bank holding company), ETNs are subject to the credit risk of the issuer and may lose value due to a downgrade in the issuer’s credit rating. The returns of an ETN are linked to the performance of an underlying instrument (typically an index), minus applicable fees. ETNs typically do not make periodic interest payments and principal typically is not protected. The value of an ETN may fluctuate based on factors such as time to maturity, level of supply and demand for the ETN, volatility and lack of liquidity in the underlying assets, changes in the applicable interest rates, and economic, legal, political or geographic events that affect the underlying assets. The fund bears its proportionate share of any fees and expenses borne by the ETN. Because ETNs trade on a securities exchange, their shares may trade at a premium or discount to their net asset value.
ELN risk. ELNs are investments that have their principal and/or interest based on the performance or value of a single equity security, a basket of equity securities, or an equity index. An investment in an ELN has the risks inherent in the underlying equity security or securities, including market risk, while also exposing the fund to risks applicable to debt instruments, such as credit risk, interest rate risk and counterparty risk. Because of the structure and terms of ELNs, the fund may not benefit fully from an increase in value of the underlying equity securities or index and the price of an ELN and the underlying instruments may be imperfectly correlated. The fund could lose its entire principal investment in the ELN. ELNs are also subject to liquidity risk and pricing risk because the secondary market for ELNs may be limited, which may cause the value of the ELN to decline and can make the ELN difficult to price, buy or sell.
Foreign investment risk. The fund faces the risks inherent in foreign investing. Adverse political, economic or social developments, as well as US and foreign government actions such as the imposition of tariffs, economic and trade sanctions or embargoes, could undermine the value of the fund’s foreign investments, prevent the fund from realizing the full value of its foreign investments or prevent the fund from selling foreign securities it holds.
Financial reporting standards for companies based in foreign markets differ from those in the US. Additionally, foreign securities markets generally are smaller and less liquid than US markets. To the extent that the fund invests in non-US dollar denominated foreign securities, changes in currency exchange rates may affect the US dollar value of foreign securities or the income or gain received on these securities. In addition, because non-US markets may be open on days when the fund does not price its shares, the value of the foreign securities in the fund’s portfolio may change on days when shareholders will not be able to purchase or sell the fund’s shares.
Prospectus May 1, 2026
59
Fund Details
Foreign governments may restrict investment by foreigners, limit withdrawal of trading profit or currency from the country, restrict currency exchange or seize foreign investments. The foreign investments of the fund may also be subject to foreign withholding or other taxes. Foreign brokerage commissions and other fees are generally higher than those for US investments, and the transactions and custody of foreign assets may involve delays in payment, delivery or recovery of money or investments.
Foreign markets can have liquidity risks beyond those typical of US markets. Because foreign exchanges generally are smaller and less liquid than US exchanges, buying and selling foreign investments can be more difficult and costly. Relatively small transactions can sometimes materially affect the price and availability of foreign securities. In certain situations, it may become virtually impossible to sell a foreign investment in an orderly fashion at a price that approaches portfolio management's estimate of its value. For the same reason, it may at times be difficult to value the fund’s foreign investments.
Emerging markets risk. Foreign investment risks are greater in emerging markets than in developed markets. Investments in emerging markets are often considered speculative.
Emerging markets countries typically have economic and political systems that are less developed, and can be expected to be less stable than developed markets. For example, the economies of such countries can be subject to rapid and unpredictable rates of inflation or deflation.
Applicable regulatory, accounting, auditing and financial reporting and recordkeeping standards may be less rigorous in emerging markets countries and there may be significant differences between financial statements prepared in accordance with emerging markets countries’ accounting standards and practices and those prepared in accordance with international accounting standards. In particular, the assets and profits appearing on the financial statements of an emerging market country’s issuer may not reflect its financial position or results of operations in the way they would be reflected had such financial statements been prepared in accordance with US Generally Accepted Accounting Principles. The quality of audits in emerging markets countries may be unreliable. Consequently, the fund may not be provided the same degree of protection or information as would generally apply in developed countries and the fund may be exposed to significant losses.
There is also substantially less publicly available information about emerging market issuers than there is about issuers in developed countries. Therefore, disclosure of certain material information may not be made, and less information may be available to the fund and other investors than would be the case if the fund’s investments were restricted to securities of issuers in developed countries.
Currency risk. Changes in currency exchange rates may affect the value of the fund’s investments and the fund’s share price. The value of currencies are influenced by a variety of factors, that include: interest rates, national debt levels and trade deficits, changes in balances of payments and trade, domestic and foreign interest and inflation rates, global or regional political, economic or financial events, actual or potential government intervention, global energy prices, political instability and government monetary policies and the buying or selling of currency by a country’s government. Investments in foreign currencies are subject to the risk that those currencies will decline in value relative to the US dollar or, in the case of hedged positions, that the US dollar will decline relative to the currency being hedged. Currency exchange rates can be volatile and can change quickly and unpredictably, thereby impacting the value of the fund’s investments.
Interest rate strategies risk. The success of the interest rate futures strategies depends, in part, on the effectiveness and implementation of portfolio management's proprietary strategies. If portfolio management's analysis proves to be incorrect, losses to the fund may be significant. The risk of loss is heightened during periods of rapid rises in interest rates.
Currency strategies risk. The success of the currency strategies depends, in part, on the effectiveness and implementation of portfolio management's proprietary strategies. If portfolio management's analysis proves to be incorrect, losses to the fund may be significant and may substantially exceed the intended level of market exposure for the currency strategies.
As part of the currency strategies, the fund could have substantial exposure to the risks of non-US currency markets. Foreign currency rates may fluctuate significantly over short periods of time for a number of reasons, including changes in interest rates and economic or political developments in the US or abroad. As a result, the fund's exposure to foreign currencies could cause lower returns or even losses to the fund. Although portfolio management seeks to limit these risks through the aggregation of various long and short positions, there can be no assurance that it will be able to do so.
Interest rate risk. When interest rates rise, prices of debt securities generally decline. The longer the duration of the fund’s debt securities, the more sensitive the fund will be to interest rate changes. (As a general rule, a 1% rise in interest rates means a 1% fall in value for every year of duration.) Interest rates can change in response to the supply and demand for credit, government and/or central bank monetary policy and action, inflation rates, and other factors. Changes in monetary policy made by central banks or governments are likely to affect the level of interest rates. Changing interest rates may have unpredictable effects on markets, may result in heightened market volatility and potential illiquidity and may detract from fund performance to the extent the fund is exposed to such
Prospectus May 1, 2026
60
Fund Details
interest rates and/or volatility. Rising interest rates could cause the value of the fund’s investments — and therefore its share price as well — to decline. A rising interest rate environment may cause investors to move out of fixed-income securities and related markets on a large scale, which could adversely affect the price and liquidity of such securities and could also result in increased redemptions from the fund. Increased redemptions from the fund may force the fund to sell investments at a time when it is not advantageous to do so, which could result in losses.
Inflation-indexed bond risk. Any actual or anticipated rise in interest rates may cause inflation-indexed bonds to decline in price, hurting fund performance. If interest rates rise due to reasons other than inflation, the fund’s investment in inflation-indexed bonds may not be fully protected from the effects of rising interest rates. The performance of any bonds that are indexed to non-US rates of inflation may be higher or lower than those indexed to US inflation rates. Inflation rates may change frequently and significantly as a result of various factors, including unexpected shifts in the domestic or global economy or changes in fiscal or monetary policies. The fund’s actual returns could fail to match the real rate of inflation.
Credit risk. The fund's performance could be hurt if an issuer of a debt security suffers an adverse change in financial condition that results in the issuer not making timely payments of interest or principal, a security downgrade or an inability to meet a financial obligation. Credit risk is greater for lower-rated securities.
Because the issuers of high-yield debt securities, or junk bonds (debt securities rated below the fourth highest credit rating category), may be in uncertain financial health, the prices of their debt securities can be more vulnerable to bad economic news, or even the expectation of bad news, than investment-grade debt securities. Credit risk for high-yield securities is greater than for higher-rated securities.
For securities that rely on third-party guarantors to support their credit quality, the same risks may apply if the financial condition of the guarantor deteriorates or the guarantor ceases to insure securities. Because guarantors may insure many types of securities, including subprime mortgage bonds and other high-risk bonds, their financial condition could deteriorate as a result of events that have little or no connection to securities owned by the fund.
Some securities issued by US government agencies or instrumentalities are backed by the full faith and credit of the US government. Other securities that are supported only by the credit of the issuing agency or instrumentality are subject to greater credit risk than securities backed by the full faith and credit of the US government. This is because the US government might provide financial support, but has no obligation to do so, if there is a potential or actual loss of principal or failure to make interest payments.
High yield debt securities risk. High yield debt securities, or junk bonds, are generally regarded as speculative with respect to the issuer’s continuing ability to meet principal and interest payments. High yield debt securities’ total return and yield may generally be expected to fluctuate more than the total return and yield of investment-grade debt securities. A real or perceived economic downturn or an increase in market interest rates could cause a decline in the value of high yield debt securities, result in increased redemptions and/or result in increased portfolio turnover, which could result in a decline in net asset value of the fund, reduce liquidity for certain investments and/or increase costs. High yield debt securities are often thinly traded and can be more difficult to sell and value accurately than investment-grade debt securities as there may be no established secondary market. Investments in high yield debt securities could increase liquidity risk for the fund. In addition, the market for high yield debt securities can experience sudden and sharp volatility which is generally associated more with investments in stocks.
Senior loans risk. The fund invests in senior loans that may not be rated by a rating agency, registered with the SEC or any state securities commission or listed on any national securities exchange. Therefore, there may be less publicly available information about them than for registered or exchange-listed securities. The Advisor relies on its own evaluation of the creditworthiness of borrowers, but will consider, and may rely in part on, analyses performed by others. As a result, the fund is particularly dependent on the analytical abilities of the Advisor.
Senior loans may not be considered “securities,” and purchasers, such as the fund, therefore may not be entitled to rely on the anti-fraud and misrepresentation protections of the federal securities laws. Senior loans involve other risks, including credit risk, interest rate risk, liquidity risk, and prepayment and extension risk.
Because affiliates of the Advisor may participate in the primary and secondary market for senior loans, limitations under applicable law may restrict the fund’s ability to participate in a restructuring of a senior loan or to acquire some senior loans, or affect the timing or price of such acquisition. The fund also may be in possession of material non-public information about a borrower as a result of its ownership of a senior loan. Because of prohibitions on trading in securities of issuers while in possession of such information, the fund might be unable to enter into a transaction in a publicly-traded security of that borrower when it would otherwise be advantageous to do so. If the Advisor wishes to invest in the publicly traded securities of a borrower, it may not have access to material non-public information regarding the borrower to which other lenders have access.
Senior loans may have longer trade settlement periods than other types of investments which could result in the fund not receiving the proceeds from a sale of a senior loan for an extended period after such sale. To the extent
Prospectus May 1, 2026
61
Fund Details
that other sources of liquidity are unavailable, the uncertainty of trade settlement periods could lead to shortfalls in cash needed to handle fund redemptions, especially during periods of heavy redemption activity.
Prepayment and extension risk. When interest rates fall, issuers of high interest debt obligations may pay off the debts earlier than expected (prepayment risk), and the fund may have to reinvest the proceeds at lower yields. When interest rates rise, issuers of lower interest debt obligations may pay off the debts later than expected (extension risk), thus keeping the fund’s assets tied up in lower interest debt obligations. Ultimately, any changes or unexpected behavior in interest rates could increase the volatility of the fund’s share price and yield and could hurt fund performance.
Commodities investments risk. The fund’s exposure to commodities or commodity markets may subject the fund to greater volatility than investments in other securities. Commodity-related investments (including commodity-linked derivatives, commodity-based exchange-traded products, and instruments that provide exposure to commodity indices or commodity prices) may be affected by a variety of factors, including changes in overall market movements, commodity price and index volatility, changes in interest rates, embargoes, tariffs and trade policies, policies of commodity cartels and international economic, political and regulatory developments. In addition, certain commodity-related investments may be particularly sensitive to events such as climate changes, drought, floods, weather, livestock disease and changes in storage costs.
The value of a commodity-related investment generally is based upon the price movements of a physical commodity (such as metals, energy, minerals, or agricultural products), a futures contract, swap or commodity index, a commodity-based company, or other economic variables linked to changes in the value of commodities or the commodities markets, which can fluctuate substantially over short periods of time. A liquid secondary market may not exist for certain types of commodity-related investments the fund may buy, which may make it difficult for the fund to sell them at an acceptable price. The fund’s ability to gain exposure to commodity-related investments and achieve its investment objective may be limited by its intention to qualify as a regulated investment company under the Internal Revenue Code of 1986, as amended.
Real estate securities risk. Real estate companies, including REITs, can be negatively affected by the risks associated with direct ownership of real estate, such as general or local economic conditions, decreases in real estate value, increases in property taxes, operating expenses or insurance costs, lack of availability of insurance coverage, liabilities or losses due to environmental problems, extreme weather or natural disasters, delays in completion of construction, falling rents (whether due to poor demand, increased competition, overbuilding, or limitations on rents), zoning changes, rising interest rates,
lack of credit, failure of borrowers to repay loans and losses from casualty or condemnation. In addition, real estate values have been subject to substantial fluctuations and declines on a local, regional and national basis in the past and may continue to be in the future. During periods of rising interest rates, real estate securities may lose appeal for investors who may be able to obtain higher yields from other income-producing investments. Rising interest rates may also mean that financing for property purchases and improvements is more costly and difficult to obtain. In addition, many real estate companies, including REITs, utilize leverage which increases investment risk. Highly leveraged real estate companies are particularly vulnerable to the effects of an economic downturn. Further, REITs are dependent upon management skills, may not be diversified and may have relatively small market capitalizations, which can increase volatility. REITs must satisfy certain requirements in order to qualify for favorable tax treatment under applicable tax laws, and a failure to qualify could adversely affect the value of the REIT. By investing in REITs through a fund, a shareholder will bear expenses of the REITs in addition to expenses of the fund and will not be entitled to the federal income tax deduction for qualified REIT dividends available to noncorporate investors that own REITs directly unless certain holding period and other requirements are satisfied.
Infrastructure-related companies risk. Infrastructure-related companies can be negatively affected by various factors, including general or local economic conditions and political developments, general changes in market sentiment towards infrastructure assets, high interest costs in connection with capital construction and improvement programs, difficulty in raising capital, costs associated with compliance with changes in regulations, regulation or intervention by various government authorities, including government regulation of rates, inexperience with and potential losses resulting from the deregulation of a particular industry or sector, changes in tax laws, tariffs and trade policies, environmental problems, costs or disruptions caused by extreme weather or other natural disasters, the effects of energy conservation policies, commodities markets disruptions (e.g., significant changes over short time periods in the price of oil), technological changes, surplus capacity, casualty losses, threat of terrorist attacks and changes in interest rates. Rising interest rates could lead to higher financing costs and reduced earnings for infrastructure-related companies. A company is considered to be an infrastructure-related company if at least 50% of its non-cash assets are infrastructure assets or 50% of its gross income or net profits are derived, directly or indirectly, from the ownership, management, construction, operation, utilization or financing of infrastructure assets. Infrastructure-related companies may be focused in the energy, industrials and utilities sectors. At times, the performance of securities in
Prospectus May 1, 2026
62
Fund Details
these sectors may lag the performance of other sectors or the broader market as a whole. A downturn in these sectors could have an adverse impact on the fund.
Focus risk. To the extent that the fund focuses its investments in particular industries, asset classes or sectors of the economy, any market price movements, regulatory or technological changes, or economic conditions affecting companies in those industries, asset classes or sectors may have a significant impact on the fund’s performance. The fund may become more focused in particular industries, asset classes or sectors of the economy as a result of changes in the valuation of the fund’s investments or fluctuations in the fund’s assets, and the fund is not required to reduce such exposures under these circumstances.
Regional focus risk. Focusing investments in a single country or few countries, or regions, involves increased currency, political, regulatory and other risks. Market swings in such a targeted country, countries or regions are likely to have a greater effect on fund performance than they would in a more geographically diversified fund.
Dividend-paying stock risk. As a category, dividend-paying stocks may underperform non-dividend paying stocks (and the stock market as a whole) over any period of time. In addition, issuers of dividend-paying stocks may have discretion to defer or stop paying dividends for a stated period of time, or an anticipated acceleration of dividends may not occur as a result of, among other things, a sharp rise in interest rates or an economic downturn. If the dividend-paying stocks held by the fund reduce or stop paying dividends, the fund’s ability to generate income may be adversely affected.
Large-sized companies risk. Returns on investments in securities of large companies could trail the returns on investments in securities of smaller and medium-sized companies. Larger companies may be unable to respond as quickly as smaller and medium-sized companies to competitive challenges or to changes in business, product, financial or other market conditions. Larger companies may not be able to maintain growth at the high rates that may be achieved by well-managed smaller and medium-sized companies. During different market cycles, the performance of large-capitalization companies has trailed the overall performance of the broader securities markets.
Medium-sized company risk. Medium-sized company stocks tend to be more volatile than large company stocks. Because stock analysts are less likely to follow medium-sized companies, less information about them is available to investors. Industry-wide reversals may have a greater impact on medium-sized companies, since they may lack the financial resources of larger companies. Medium-sized company stocks are typically less liquid than large company stocks.
Small company risk. Small company stocks tend to be more volatile than medium-sized or large company stocks. Because stock analysts are less likely to follow small companies, less information about them is available to investors. Industry-wide reversals may have a greater impact on small companies, since they may lack the financial resources of larger companies. Small company stocks are typically less liquid than large company stocks.
Convertible securities risk. The market value of a convertible security performs like that of a regular debt security; that is, when interest rates rise, the price of a convertible security generally declines. In addition, convertible securities are subject to the risk that the issuer will not be able to pay interest or dividends when due, and their price may change based on changes in the issuer’s financial condition. Because a convertible security derives a portion of its value from the common stock into which it may be converted, market and issuer risks that apply to the underlying common stock could impact the price of the convertible security. Certain types of convertible securities may decline in value or lose their value entirely in the event the issuer's financial condition becomes significantly impaired.
Preferred stock risk. Preferred stock generally has a preference as to dividends and liquidation over an issuer’s common stock but ranks junior to debt securities in an issuer’s capital structure. Preferred stock is subject to many of the risks associated with debt securities, including interest rate risk. In addition, preferred stock may not pay a dividend, an issuer may suspend payment of dividends on preferred stock at any time, and in certain situations an issuer may call or redeem its preferred stock or convert it to common stock.
Investment style risk. To the extent that the fund maintains a style-neutral portfolio, either growth funds or value funds may outperform the fund during any time period when one or the other is in favor. To the extent that the fund’s portfolio favors either growth or value stocks, it may perform less well than if it had remained style-neutral if the style it favors underperforms the overall market.
IPO risk. Prices of securities bought in an initial public offering (IPO) may rise and fall rapidly, often because of investor perceptions rather than economic reasons. To the extent a mutual fund is small in size, its IPO investments may have a significant impact on its performance since they may represent a larger proportion of the fund’s overall portfolio as compared to the portfolio of a larger fund.
Liquidity risk. In certain situations, it may be difficult or impossible to sell an investment and/or the fund may sell certain investments at a price or time that is not advantageous in order to meet redemption requests or other cash needs. Unusual market conditions, such as an unusually high volume of redemptions or other similar conditions could increase liquidity risk for the fund.
Prospectus May 1, 2026
63
Fund Details
This risk can be ongoing for any security that does not trade actively or in large volumes, for any security that trades primarily on smaller markets, and for investments that typically trade only among a limited number of large investors (such as certain types of derivatives or restricted securities). In unusual market conditions, even normally liquid securities may be affected by a degree of liquidity risk (i.e., if the number and capacity of traditional market participants is reduced). This may affect only certain securities or an overall securities market.
Pricing risk. If market conditions make it difficult to value some investments, the fund may value these investments using more subjective methods and the value determined for an investment may be materially different from the value realized upon such investment’s sale. As a result, you could pay more than the market value when buying fund shares or receive less than the market value when selling fund shares.
Secondary markets may be subject to irregular trading activity, wide bid/ask spreads and extended trade settlement periods, which may prevent the fund from being able to realize full value and thus sell a security for its full valuation. This could cause a material decline in the fund’s net asset value.
Tax risk. Income and gains from commodities and certain commodity-linked derivatives generally do not constitute “qualifying income” to the fund for purposes of qualification as a “regulated investment company” for federal income tax purposes. If the fund's nonqualifying income exceeds 10% of the fund's gross income, the fund may fail to qualify as a regulated investment company and be subject to a tax at the fund level.
In addition, if DWS Alternative Asset Allocation VIP fails to qualify as a RIC, a separate account underlying a variable life insurance or variable annuity contract that invests in shares of the fund will be required to treat the fund (or if an underlying fund fails to qualify as a RIC, the fund’s investment in the underlying fund) as a single investment for purposes of the diversification requirements of section 817(h) of the Code. If a separate account fails to satisfy the diversification requirements of Code section 817(h), income allocable to the contracts associated with the separate account will be taxed currently for federal income tax purposes to the holders of such contracts and income from prior periods with respect to such contracts also could be taxable, most likely in the year of the failure.
Securities lending risk. Securities lending involves the risk that the fund may lose money because the borrower of the loaned securities fails to return the securities in a timely manner or at all. A delay in the recovery of loaned securities could interfere with the fund’s ability to vote proxies or settle transactions. Delayed settlement may limit the ability of the fund to reinvest the proceeds of a sale of securities or prevent the fund from selling securities at times and prices it considers desirable. The fund
could also lose money in the event of a decline in the value of the collateral provided for the loaned securities, or a decline in the value of any investments made with cash collateral or even a loss of rights in the collateral should the borrower of the securities fail financially while holding the securities.
Derivatives risk. Derivatives involve risks different from, and possibly greater than, the risks associated with investing directly in securities and other more traditional investments. Risks associated with derivatives may include the risk that the derivative is not well correlated with the underlying asset, security or index to which it relates; the risk that derivatives may result in losses or missed opportunities; the risk that the fund will be unable to sell the derivative because of an illiquid secondary market; the risk that a counterparty is unwilling or unable to meet its obligation, which risk may be heightened in derivative transactions entered into “over-the-counter” (i.e., not on an exchange or contract market); and the risk that the derivative transaction could expose the fund to the effects of leverage, which could increase the fund's exposure to the market and magnify potential losses.
There is no guarantee that derivatives, to the extent employed, will have the intended effect, and their use could cause lower returns or even losses to the fund. The use of derivatives by the fund to hedge risk may reduce the opportunity for gain by offsetting the positive effect of favorable price movements.
Counterparty risk. A financial institution or other counterparty with whom the fund does business, or that underwrites, distributes or guarantees any investments or contracts that the fund owns or is otherwise exposed to, may decline in financial health and become unable to honor its commitments. This could cause losses for the fund or could delay the return or delivery of collateral or other assets to the fund.
Subsidiary risk. Certain underlying funds may invest in a wholly-owned subsidiary of the underlying fund formed under the laws of the Cayman Islands (the Subsidiary) that is not registered as an investment company under the Investment Company Act of 1940, as amended, and therefore it is not subject to all of the investor protections of the Investment Company Act of 1940. A regulatory change in the US or the Cayman Islands that impacts the Subsidiary or how the underlying fund invests in the Subsidiary, such as a change in tax law, could adversely affect the underlying fund and the fund. By investing in the Subsidiary, the underlying funds and the fund are exposed to the risks associated with the Subsidiary’s investments, which generally include the risks of investing in derivatives and commodities-related investments.
Operational and technology risk. The fund and the entities with which it interacts directly or indirectly, including the fund’s service providers and counterparties, issuers of securities held by the fund and other market participants, are susceptible to operational and technology risks,
Prospectus May 1, 2026
64
Fund Details
including those related to human errors, processing errors, communication errors, system failures, cybersecurity incidents, and the use of artificial intelligence, among others, which may impair the fund’s operations and/or result in losses for the fund. For example, the fund’s or its service providers’ assets or sensitive or confidential information may be misappropriated, data may be corrupted and operations may be disrupted (e.g., cyber-attacks, operational failures or broader disruptions may cause the release of private shareholder information or confidential fund information, interfere with the processing of shareholder transactions, impact the ability to calculate the fund’s net asset value and impede trading). Market events and disruptions also may trigger a volume of transactions that overloads current information technology and communication systems and processes, impacting the ability to conduct the fund’s operations.
While the fund and its service providers may establish business continuity and other plans and processes that seek to address the possibility of and fallout from cyber-attacks, disruptions or failures, there are inherent limitations in such plans and systems, including that they do not apply to third parties, such as fund counterparties, issuers of securities held by the fund or other market participants, as well as the possibility that certain risks have not been identified or that unknown threats may emerge in the future and there is no assurance that such plans and processes will be effective. Among other situations, disruptions (for example, pandemics or health crises) that cause prolonged periods of remote work or significant employee absences at the fund’s service providers could impact the ability to conduct the fund’s operations. In addition, the fund cannot directly control any cybersecurity plans and systems, including artificial intelligence, put in place by its service providers, fund counterparties, issuers of securities held by the fund or other market participants.
Cyber-attacks may include unauthorized attempts by third parties to improperly access, modify, disrupt the operations of, or prevent access to the systems of the fund’s service providers or counterparties, issuers of securities held by the fund or other market participants or data within them. In addition, power or communications outages, acts of god, information technology equipment malfunctions, operational errors, and inaccuracies within software or data processing systems may also disrupt business operations or impact critical data.
Cyber-attacks, disruptions, or failures may adversely affect the fund and its shareholders or cause reputational damage and subject the fund to regulatory fines, litigation costs, penalties or financial losses, reimbursement or other compensation costs, and/or additional compliance costs. In addition, cyber-attacks, disruptions, or failures involving a fund counterparty could affect such counterparty’s ability to meet its obligations to the fund,
which may result in losses to the fund and its shareholders. Similar types of operational and technology risks are also present for issuers of securities held by the fund, which could have material adverse consequences for such issuers, and may cause the fund’s investments to lose value. Furthermore, as a result of cyber-attacks, disruptions, or failures, an exchange or market may close or issue trading halts on specific securities or the entire market, which may result in the fund being, among other things, unable to buy or sell certain securities or financial instruments or unable to accurately price its investments.
For example, the fund relies on various sources to calculate its NAV. Therefore, the fund is subject to certain operational risks associated with reliance on third party service providers and data sources. NAV calculation may be impacted by operational risks arising from factors such as failures in systems and technology. Such failures may result in delays in the calculation of the fund’s NAV and/or the inability to calculate NAV over extended time periods. The fund may be unable to recover any losses associated with such failures.
In addition, the development and use of artificial intelligence technologies are expanding rapidly and may be employed by service providers that support the operations of the fund as well as by issuers of securities held by the fund. Artificial intelligence technologies rely on complex algorithms and large data sets, which may produce incomplete, inaccurate, or biased outcomes and lead to errors in decision making, reputational damage, legal or operational challenges, and investment losses negatively affecting the fund. Artificial intelligence technologies and their current and potential future applications, and the regulatory frameworks within which they operate, continue to evolve rapidly, and it is impossible to anticipate the full scope of future impacts such developments may have and the associated risks to the fund.
DWS Global Income Builder VIP
Investment Objective
The fund seeks to maximize income while maintaining prospects for capital appreciation.
Principal Investment Strategies
Main investments. The fund invests in a broad range of both traditional asset classes (such as equity and fixed income investments) and alternative asset classes (such as real estate, infrastructure, convertibles, commodities, currencies and absolute return strategies). The fund can buy many types of securities, among them common stocks, including dividend-paying stocks, convertible securities, corporate bonds, government bonds, municipal securities, inflation-indexed bonds, mortgage- and asset-backed securities, exchange-traded funds (ETFs) and exchange-traded notes (ETNs) and may invest in derivative
Prospectus May 1, 2026
65
Fund Details
instruments, such as, futures contracts, that provide exposure to such securities (see “Derivatives” subsection). The fund may invest in passive ETFs which seek to replicate the performance of an index, and in active ETFs, which do not replicate an index and are actively managed. The fund may invest up to 15% of net assets in equity-linked notes (ELNs), which are structured notes that offer returns linked to the performance or value of a single equity security, a basket of equity securities, or an equity index. Generally, ELNs may be used when portfolio management believes that they will provide a more attractive yield than the indices or equity securities to which they are linked. ELNs can be customized to provide for higher and/or more frequent distributions relative to the indices or equity securities to which they are linked. The fund invests at least 25% of net assets in fixed income securities. The fund can invest in securities of any size, investment style category, maturity, duration or credit quality including high-yield debt securities (i.e., “junk bonds”), and from any country (including emerging markets).
The fund will generally invest in at least three different countries and will normally have investment exposure to foreign securities, foreign currencies and other foreign investments equal to at least 40% of the fund’s net assets. For purposes of the foregoing policy, an investment is considered to be an investment in a foreign security or a foreign investment if the issuer is organized or located outside the US or is doing a substantial amount of business outside of the US. An issuer that derives at least 50% of its revenue from business outside the US or has at least 50% of its assets outside the US will be considered to be doing a substantial amount of business outside the US.
The fund defines “emerging markets” to include countries or markets: (i) currently classified as low-to-middle income economies by the World Bank; or (ii) currently considered to be developing by the International Finance Corporation or the United Nations or its authorities. The fund defines “fixed income” securities through the following sector classifications of domestic and foreign securities that include: (i) government notes and bonds, (ii) corporate bonds, (iii) commercial and residential mortgage-backed securities, (iv) asset-backed securities, (v) emerging markets debt, (vi) loans and (vii) interest rate futures/options.
The fund may also invest in affiliated mutual funds. The fund may invest up to 5% of net assets in shares of the following funds: DWS Emerging Markets Fixed Income Fund, which invests primarily in high yield emerging market bonds; and, DWS High Income Fund, which invests primarily in high yield bonds.
Management process. Portfolio management seeks to maximize risk adjusted returns by allocating the fund’s assets among various asset categories. Portfolio management draws upon a broad investible universe to establish a strategic allocation based upon collective, long-term
views on asset class selection, implementation, expected returns and other relevant factors. Portfolio management periodically reviews the fund’s allocations and may adjust them based on current or anticipated market conditions or to manage risk consistent with the fund’s overall investment strategy.
Within each asset category, portfolio management uses one or more investment strategies for selecting equity and debt securities. Each investment strategy is managed by a team that specializes in a particular asset category, and that may use a variety of quantitative and qualitative techniques. As a general matter, in buying and selling securities for the portfolio, the portfolio management teams utilize in-house research and resources to determine suitability of specific securities and use sector specialists to determine relative value within each relevant sector. The portfolio management teams generally consider ratings in seeking to identify environmental, social and governance (ESG) risks and opportunities that it believes to be financially material.
Examples of the fund’s asset categories are US and foreign equity of any size and style (including emerging market equity), US and foreign fixed income of any credit quality (including emerging market bonds and inflation-indexed bonds), and alternative assets. Some asset categories may be represented by derivatives or ETFs.
The fund may invest from time to time in ETFs that are managed by affiliates of the Advisor, including, but not limited to, series of DBX ETF Trust, which are managed by DBX Advisors LLC. DWS Investment Management Americas, Inc. and DBX Advisors LLC are subsidiaries of DWS Group. The fund may also invest in securities of unaffiliated ETFs.
Derivatives. The fund may invest in derivatives, which are financial instruments whose performance is derived, at least in part, from the performance of an underlying asset, security or index. In particular, portfolio management may use equity futures contracts as a substitute for direct investing to seek to enhance potential gains. In addition, portfolio management may use futures contracts, options on interest rate swaps, options on interest rate futures contracts or interest rate swaps for duration management (i.e., reducing or increasing the sensitivity of the fund’s portfolio to interest rate changes) or for non-hedging purposes to seek to enhance potential gains. Portfolio management may also use (i) option contracts in order to gain exposure to a particular market or security, to seek to increase the fund’s income, or to hedge against changes in a particular market or security, (ii) total return swaps to seek to enhance potential gains by increasing or reducing the fund’s exposure to a particular sector or market or as a substitute for direct investment, or (iii) credit default swaps to seek to increase the fund’s income, to gain exposure to a bond issuer’s credit quality characteristics without directly investing in the bond or to hedge the
Prospectus May 1, 2026
66
Fund Details
risk of default on bonds held in the fund’s portfolio. In addition, portfolio management may use forward currency contracts (i) to hedge exposure to changes in foreign currency exchange rates on foreign currency denominated portfolio holdings; (ii) to facilitate transactions in foreign currency denominated securities; or (iii) for non-hedging purposes to seek to enhance potential gains.
The fund may also use other types of derivatives (i) for hedging purposes; (ii) for risk management; (iii) for non-hedging purposes to seek to enhance potential gains; or (iv) as a substitute for direct investment in a particular asset class or to keep cash on hand to meet shareholder redemptions.
Securities lending. The fund may lend securities (up to one-third of total assets) to approved institutions, such as registered broker-dealers, pooled investment vehicles, banks and other financial institutions. In connection with such loans, the fund receives liquid collateral in an amount that is based on the type and value of the securities being lent, with riskier securities generally requiring higher levels of collateral.
Active trading. The fund is expected to trade securities actively and this may lead to high portfolio turnover.
Main Risks
There are several risk factors that could hurt the fund’s performance, cause you to lose money or cause the fund’s performance to trail that of other investments. The fund may not achieve its investment objective, and is not intended to be a complete investment program. An investment in the fund is not a deposit of a bank and is not insured or guaranteed by the Federal Deposit Insurance Corporation or any other governmental agency.
Asset allocation risk. Portfolio management may favor one or more types of investments or assets that underperform other investments, assets, or securities markets as a whole. Anytime portfolio management buys or sells securities in order to adjust the fund’s asset allocation this will increase portfolio turnover and generate transaction costs.
Security selection risk. The securities in the fund’s portfolio may decline in value. Portfolio management could be wrong in its analysis of industries, companies, economic trends, ESG factors, the relative attractiveness of different securities or other matters.
Stock market risk. When stock prices fall, you should expect the value of your investment to fall as well. Stock prices can be hurt by poor management on the part of the stock’s issuer, shrinking product demand and other business risks, such as rapid technological developments or widespread adoption of emerging technologies (such as artificial intelligence) impacting the issuer’s competitive position, cybersecurity incidents, financial leverage and labor and supply shortages. These may affect single companies as well as groups of companies. The market as a whole may not favor the types of investments the fund
makes, which could adversely affect a stock’s price, regardless of how well the company performs, or the fund’s ability to sell a stock at an attractive price. There is a chance that stock prices overall will decline because stock markets tend to move in cycles, with periods of rising and falling prices. Events in the US and global financial markets, including actions taken by the US Federal Reserve or foreign central banks to stimulate or stabilize economic growth, may at times result in unusually high market volatility which could negatively affect performance. High market volatility may also result from significant shifts in momentum of one or more specific stocks due to unusual increases or decreases in trading activity. Momentum can change quickly, and securities subject to shifts in momentum may be more volatile than the market as a whole and returns on such securities may drop precipitously. To the extent that the fund invests in a particular geographic region, capitalization or sector, the fund’s performance may be affected by the general performance of that region, capitalization or sector.
Interest rate risk. When interest rates rise, prices of debt securities generally decline. The longer the duration of the fund’s debt securities, the more sensitive the fund will be to interest rate changes. (As a general rule, a 1% rise in interest rates means a 1% fall in value for every year of duration.) Interest rates can change in response to the supply and demand for credit, government and/or central bank monetary policy and action, inflation rates, and other factors. Changes in monetary policy made by central banks or governments are likely to affect the level of interest rates. Changing interest rates may have unpredictable effects on markets, may result in heightened market volatility and potential illiquidity and may detract from fund performance to the extent the fund is exposed to such interest rates and/or volatility. Rising interest rates could cause the value of the fund’s investments — and therefore its share price as well — to decline. A rising interest rate environment may cause investors to move out of fixed-income securities and related markets on a large scale, which could adversely affect the price and liquidity of such securities and could also result in increased redemptions from the fund. Increased redemptions from the fund may force the fund to sell investments at a time when it is not advantageous to do so, which could result in losses.
Market disruption risk. Economies and financial markets throughout the world have become increasingly interconnected, which has increased the likelihood that events or conditions in one country or region will adversely impact markets or issuers in other countries or regions. This includes reliance on global supply chains that are susceptible to disruptions resulting from, among other things, war and other armed conflicts, tariffs, extreme weather events, and natural disasters. Such supply chain disruptions can lead to, and have led to, economic and market disruptions that have far-reaching effects on financial markets worldwide. The value of the fund’s investments may be negatively affected by adverse changes in overall
Prospectus May 1, 2026
67
Fund Details
economic or market conditions, such as the level of economic activity and productivity, unemployment and labor force participation rates, inflation or deflation (and expectations for inflation or deflation), interest rates, demand and supply for particular products or resources including labor, debt levels and credit ratings, and trade policies, among other factors. Such adverse conditions may contribute to an overall economic contraction across entire economies or markets, which may negatively impact the profitability of issuers operating in those economies or markets. In addition, geopolitical and other globally interconnected occurrences, including war and other armed conflicts, terrorism, economic uncertainty or financial crises, contagion, tariffs and trade disputes, government debt crises (including defaults or downgrades) or uncertainty about government debt payments, government shutdowns, public health crises, natural disasters, supply chain disruptions, climate change and related events or conditions, have led, and in the future may lead, to disruptions in the US and world economies and markets, which may increase financial market volatility and have significant adverse direct or indirect effects on the fund and its investments. Ongoing trade disputes between the United States and other countries may lead to tariffs and investment restrictions, negatively impacting affected companies and their securities. These disputes can also harm the economies of the United States and its trading partners, as well as financial markets overall. Adverse market conditions or disruptions could cause the fund to lose money, experience significant redemptions, and encounter operational difficulties. Although multiple asset classes may be affected by adverse market conditions or a particular market disruption, the duration and effects may not be the same for all types of assets.
Current military and other armed conflicts in various geographic regions, including those in Europe and the Middle East, among others, can lead to, and have led to, economic and market disruptions, which may not be limited to the geographic region in which the conflict is occurring. Such conflicts can also result, and have resulted in some cases, in sanctions being levied by the United States, the European Union and/or other countries against countries or other actors involved in the conflict. In addition, such conflicts and related sanctions can adversely affect regional and global energy, commodities, financial and other markets and thus could affect the value of the fund's investments. The extent and duration of any military or other armed conflict, related sanctions and resulting economic and market disruptions are impossible to predict, but could be substantial.
Other market disruption events include pandemic spread of viruses, such as the novel coronavirus known as COVID-19, which have caused significant uncertainty, market volatility, decreased economic and other activity, increased government activity, including economic stimulus measures, and supply chain disruptions, and may adversely affect the fund and its investments.
In addition, markets are becoming increasingly susceptible to disruption events resulting from the use of new and emerging technologies, such as artificial intelligence, to engage in cyber-attacks or to take over the Web sites and/or social media accounts of companies, governmental entities or public officials, or to otherwise pose as or impersonate such, which then may be used to disseminate false or misleading information that can cause volatility in financial markets or for the securities of a particular company, group of companies, industry or other class of assets.
Adverse market conditions or particular market disruptions, such as those discussed above, may magnify the impact of each of the other risks described in this “MAIN RISKS” section and may increase volatility in one or more markets in which the fund invests leading to the potential for greater losses for the fund.
Inflation risk. Inflation risk is the risk that the real value of certain assets or real income from investments (the value of such assets or income after accounting for inflation) will be less in the future as inflation decreases the value of money. Inflation, and investors’ expectation of future inflation, can impact the current value of the fund's portfolio, resulting in lower asset values and losses to shareholders. This risk may be elevated compared to historical market conditions and could be impacted by monetary policy measures and the current interest rate environment.
Dividend-paying stock risk. As a category, dividend-paying stocks may underperform non-dividend paying stocks (and the stock market as a whole) over any period of time. In addition, issuers of dividend-paying stocks may have discretion to defer or stop paying dividends for a stated period of time, or an anticipated acceleration of dividends may not occur as a result of, among other things, a sharp rise in interest rates or an economic downturn. If the dividend-paying stocks held by the fund reduce or stop paying dividends, the fund’s ability to generate income may be adversely affected.
Large-sized companies risk. Returns on investments in securities of large companies could trail the returns on investments in securities of smaller and medium-sized companies. Larger companies may be unable to respond as quickly as smaller and medium-sized companies to competitive challenges or to changes in business, product, financial or other market conditions. Larger companies may not be able to maintain growth at the high rates that may be achieved by well-managed smaller and medium-sized companies. During different market cycles, the performance of large-capitalization companies has trailed the overall performance of the broader securities markets.
Medium-sized company risk. Medium-sized company stocks tend to be more volatile than large company stocks. Because stock analysts are less likely to follow medium-sized companies, less information about them is available to investors. Industry-wide reversals may have a greater impact on medium-sized companies, since they may lack
Prospectus May 1, 2026
68
Fund Details
the financial resources of larger companies. Medium-sized company stocks are typically less liquid than large company stocks.
Small company risk. Small company stocks tend to be more volatile than medium-sized or large company stocks. Because stock analysts are less likely to follow small companies, less information about them is available to investors. Industry-wide reversals may have a greater impact on small companies, since they may lack the financial resources of larger companies. Small company stocks are typically less liquid than large company stocks.
Credit risk. The fund's performance could be hurt if an issuer of a debt security suffers an adverse change in financial condition that results in the issuer not making timely payments of interest or principal, a security downgrade or an inability to meet a financial obligation. Credit risk is greater for lower-rated securities.
Because the issuers of high-yield debt securities, or junk bonds (debt securities rated below the fourth highest credit rating category), may be in uncertain financial health, the prices of their debt securities can be more vulnerable to bad economic news, or even the expectation of bad news, than investment-grade debt securities. Credit risk for high-yield securities is greater than for higher-rated securities.
Some securities issued by US government agencies or instrumentalities are backed by the full faith and credit of the US government. Other securities that are supported only by the credit of the issuing agency or instrumentality are subject to greater credit risk than securities backed by the full faith and credit of the US government. This is because the US government might provide financial support, but has no obligation to do so, if there is a potential or actual loss of principal or failure to make interest payments.
Regional focus risk. Focusing investments in a single country or few countries, or regions, involves increased currency, political, regulatory and other risks. Market swings in such a targeted country, countries or regions are likely to have a greater effect on fund performance than they would in a more geographically diversified fund.
Foreign investment risk. The fund faces the risks inherent in foreign investing. Adverse political, economic or social developments, as well as US and foreign government actions such as the imposition of tariffs, economic and trade sanctions or embargoes, could undermine the value of the fund’s foreign investments, prevent the fund from realizing the full value of its foreign investments or prevent the fund from selling foreign securities it holds.
Financial reporting standards for companies based in foreign markets differ from those in the US. Additionally, foreign securities markets generally are smaller and less liquid than US markets. To the extent that the fund invests in non-US dollar denominated foreign securities, changes in currency exchange rates may affect the US dollar value
of foreign securities or the income or gain received on these securities. In addition, because non-US markets may be open on days when the fund does not price its shares, the value of the foreign securities in the fund’s portfolio may change on days when shareholders will not be able to purchase or sell the fund’s shares.
Foreign governments may restrict investment by foreigners, limit withdrawal of trading profit or currency from the country, restrict currency exchange or seize foreign investments. The foreign investments of the fund may also be subject to foreign withholding or other taxes. Foreign brokerage commissions and other fees are generally higher than those for US investments, and the transactions and custody of foreign assets may involve delays in payment, delivery or recovery of money or investments.
Foreign markets can have liquidity risks beyond those typical of US markets. Because foreign exchanges generally are smaller and less liquid than US exchanges, buying and selling foreign investments can be more difficult and costly. Relatively small transactions can sometimes materially affect the price and availability of foreign securities. In certain situations, it may become virtually impossible to sell a foreign investment in an orderly fashion at a price that approaches portfolio management's estimate of its value. For the same reason, it may at times be difficult to value the fund’s foreign investments.
Currency risk. Changes in currency exchange rates may affect the value of the fund’s investments and the fund’s share price. The value of currencies are influenced by a variety of factors, that include: interest rates, national debt levels and trade deficits, changes in balances of payments and trade, domestic and foreign interest and inflation rates, global or regional political, economic or financial events, actual or potential government intervention, global energy prices, political instability and government monetary policies and the buying or selling of currency by a country’s government. Investments in foreign currencies are subject to the risk that those currencies will decline in value relative to the US dollar or, in the case of hedged positions, that the US dollar will decline relative to the currency being hedged. Currency exchange rates can be volatile and can change quickly and unpredictably, thereby impacting the value of the fund’s investments.
Liquidity risk. In certain situations, it may be difficult or impossible to sell an investment and/or the fund may sell certain investments at a price or time that is not advantageous in order to meet redemption requests or other cash needs. Unusual market conditions, such as an unusually high volume of redemptions or other similar conditions could increase liquidity risk for the fund, and in extreme conditions, the fund could have difficulty meeting redemption requests.
This risk can be ongoing for any security that does not trade actively or in large volumes, for any security that trades primarily on smaller markets, and for investments
Prospectus May 1, 2026
69
Fund Details
that typically trade only among a limited number of large investors (such as certain types of derivatives or restricted securities). In unusual market conditions, even normally liquid securities may be affected by a degree of liquidity risk (i.e., if the number and capacity of traditional market participants is reduced). This may affect only certain securities or an overall securities market.
Emerging markets risk. Foreign investment risks are greater in emerging markets than in developed markets. Investments in emerging markets are often considered speculative.
Emerging markets countries typically have economic and political systems that are less developed, and can be expected to be less stable than developed markets. For example, the economies of such countries can be subject to rapid and unpredictable rates of inflation or deflation.
Applicable regulatory, accounting, auditing and financial reporting and recordkeeping standards may be less rigorous in emerging markets countries and there may be significant differences between financial statements prepared in accordance with emerging markets countries’ accounting standards and practices and those prepared in accordance with international accounting standards. In particular, the assets and profits appearing on the financial statements of an emerging market country’s issuer may not reflect its financial position or results of operations in the way they would be reflected had such financial statements been prepared in accordance with US Generally Accepted Accounting Principles. The quality of audits in emerging markets countries may be unreliable. Consequently, the fund may not be provided the same degree of protection or information as would generally apply in developed countries and the fund may be exposed to significant losses.
There is also substantially less publicly available information about emerging market issuers than there is about issuers in developed countries. Therefore, disclosure of certain material information may not be made, and less information may be available to the fund and other investors than would be the case if the fund’s investments were restricted to securities of issuers in developed countries.
High yield debt securities risk. High yield debt securities, or junk bonds, are generally regarded as speculative with respect to the issuer’s continuing ability to meet principal and interest payments. High yield debt securities’ total return and yield may generally be expected to fluctuate more than the total return and yield of investment-grade debt securities. A real or perceived economic downturn or an increase in market interest rates could cause a decline in the value of high yield debt securities, result in increased redemptions and/or result in increased portfolio turnover, which could result in a decline in net asset value of the fund, reduce liquidity for certain investments and/or increase costs. High yield debt securities are often thinly traded and can be more difficult to sell and value accurately than investment-grade debt securities as there may be
no established secondary market. Investments in high yield debt securities could increase liquidity risk for the fund. In addition, the market for high yield debt securities can experience sudden and sharp volatility which is generally associated more with investments in stocks.
Inflation-indexed bond risk. Any actual or anticipated rise in interest rates may cause inflation-indexed bonds to decline in price, hurting fund performance. If interest rates rise due to reasons other than inflation, the fund’s investment in inflation-indexed bonds may not be fully protected from the effects of rising interest rates. The performance of any bonds that are indexed to non-US rates of inflation may be higher or lower than those indexed to US inflation rates. Inflation rates may change frequently and significantly as a result of various factors, including unexpected shifts in the domestic or global economy or changes in fiscal or monetary policies. The fund’s actual returns could fail to match the real rate of inflation.
Prepayment and extension risk. When interest rates fall, issuers of high interest debt obligations may pay off the debts earlier than expected (prepayment risk), and the fund may have to reinvest the proceeds at lower yields. When interest rates rise, issuers of lower interest debt obligations may pay off the debts later than expected (extension risk), thus keeping the fund’s assets tied up in lower interest debt obligations. Ultimately, any changes or unexpected behavior in interest rates could increase the volatility of the fund’s share price and yield and could hurt fund performance.
Mortgage-backed and other asset-backed securities risk. These securities represent interests in “pools” of mortgages or other assets such as consumer loans or receivables held in trust and often involve risks that are different from or possibly more acute than risks associated with other types of debt instruments. When market interest rates increase, the market values of mortgage-backed securities generally decline. At the same time, however, increased rates typically cause mortgage refinancings and prepayments to slow, which lengthens the effective duration of these securities. As a result, the negative effect of an interest rate increase on the market value of mortgage-backed securities is usually more pronounced than it is for other types of fixed income securities, potentially increasing the volatility of the fund. Conversely, when market interest rates decline, the market values of mortgage-backed securities generally increase. However, as mortgage-holders seek to refinance at the lower rates, the rate of prepayment of the underlying mortgages also tends to increase, which shortens the effective duration of these securities and may expose the fund to a lower rate of return on reinvestment. Mortgage-backed securities not backed by a government guarantee may be subject to the risk that underlying borrowers will be unable to meet their obligations and the value of property that secures the mortgage may decline in value and be insufficient, upon foreclosure, to repay the associated loan.
Prospectus May 1, 2026
70
Fund Details
Investments in other asset-backed securities are subject to risks similar to those associated with mortgage-backed securities, as well as additional risks associated with the nature of the assets and the servicing of those assets. Payment of principal and interest on asset-backed securities may be largely dependent upon the cash flows generated by the assets backing the securities, and asset-backed securities may not have the benefit of any security interest in the related assets.
Convertible securities risk. The market value of a convertible security performs like that of a regular debt security; that is, when interest rates rise, the price of a convertible security generally declines. In addition, convertible securities are subject to the risk that the issuer will not be able to pay interest or dividends when due, and their price may change based on changes in the issuer’s financial condition. Because a convertible security derives a portion of its value from the common stock into which it may be converted, market and issuer risks that apply to the underlying common stock could impact the price of the convertible security. Certain types of convertible securities may decline in value or lose their value entirely in the event the issuer's financial condition becomes significantly impaired.
Derivatives risk. Derivatives involve risks different from, and possibly greater than, the risks associated with investing directly in securities and other more traditional investments. Risks associated with derivatives may include the risk that the derivative is not well correlated with the underlying asset, security or index to which it relates; the risk that derivatives may result in losses or missed opportunities; the risk that the fund will be unable to sell the derivative because of an illiquid secondary market; the risk that a counterparty is unwilling or unable to meet its obligation, which risk may be heightened in derivative transactions entered into “over-the-counter” (i.e., not on an exchange or contract market); and the risk that the derivative transaction could expose the fund to the effects of leverage, which could increase the fund's exposure to the market and magnify potential losses.
There is no guarantee that derivatives, to the extent employed, will have the intended effect, and their use could cause lower returns or even losses to the fund. The use of derivatives by the fund to hedge risk may reduce the opportunity for gain by offsetting the positive effect of favorable price movements.
Counterparty risk. A financial institution or other counterparty with whom the fund does business, or that underwrites, distributes or guarantees any investments or contracts that the fund owns or is otherwise exposed to, may decline in financial health and become unable to honor its commitments. This could cause losses for the fund or could delay the return or delivery of collateral or other assets to the fund.
ETF risk. Because ETFs trade on a securities exchange, their shares may trade at a premium or discount to their net asset value. An ETF is subject to the risks of the assets in which it invests as well as those of the investment strategy it follows. The fund may incur brokerage costs when it buys and sells shares of an ETF and also bears its proportionate share of the ETF’s fees and expenses, which are passed through to ETF shareholders.
Fees and expenses incurred by an ETF may include trading costs, operating expenses, licensing fees, trustee fees and marketing expenses. With an index ETF, these costs may contribute to the ETF not fully matching the performance of the index it is designed to track. An actively-managed ETF may have a higher degree of portfolio turnover than a passively-managed index ETF and incur higher brokerage costs.
ETN risk. Because ETNs are senior, unsecured, unsubordinated debt securities of an issuer (typically a bank or bank holding company), ETNs are subject to the credit risk of the issuer and may lose value due to a downgrade in the issuer’s credit rating. The returns of an ETN are linked to the performance of an underlying instrument (typically an index), minus applicable fees. ETNs typically do not make periodic interest payments and principal typically is not protected. The value of an ETN may fluctuate based on factors such as time to maturity, level of supply and demand for the ETN, volatility and lack of liquidity in the underlying assets, changes in the applicable interest rates, and economic, legal, political or geographic events that affect the underlying assets. The fund bears its proportionate share of any fees and expenses borne by the ETN. Because ETNs trade on a securities exchange, their shares may trade at a premium or discount to their net asset value.
Focus risk. To the extent that the fund focuses its investments in particular industries, asset classes or sectors of the economy, any market price movements, regulatory or technological changes, or economic conditions affecting companies in those industries, asset classes or sectors may have a significant impact on the fund’s performance. The fund may become more focused in particular industries, asset classes or sectors of the economy as a result of changes in the valuation of the fund’s investments or fluctuations in the fund’s assets, and the fund is not required to reduce such exposures under these circumstances.
Pricing risk. If market conditions make it difficult to value some investments, the fund may value these investments using more subjective methods and the value determined for an investment may be materially different from the value realized upon such investment’s sale. As a result, you could pay more than the market value when buying fund shares or receive less than the market value when selling fund shares.
Prospectus May 1, 2026
71
Fund Details
Secondary markets may be subject to irregular trading activity, wide bid/ask spreads and extended trade settlement periods, which may prevent the fund from being able to realize full value and thus sell a security for its full valuation. This could cause a material decline in the fund’s net asset value.
Commodities investments risk. The fund’s exposure to commodities or commodity markets may subject the fund to greater volatility than investments in other securities. Commodity-related investments (including commodity-linked derivatives, commodity-based exchange-traded products, and instruments that provide exposure to commodity indices or commodity prices) may be affected by a variety of factors, including changes in overall market movements, commodity price and index volatility, changes in interest rates, embargoes, tariffs and trade policies, policies of commodity cartels and international economic, political and regulatory developments. In addition, certain commodity-related investments may be particularly sensitive to events such as climate changes, drought, floods, weather, livestock disease and changes in storage costs.
The value of a commodity-related investment generally is based upon the price movements of a physical commodity (such as metals, energy, minerals, or agricultural products), a futures contract, swap or commodity index, a commodity-based company, or other economic variables linked to changes in the value of commodities or the commodities markets, which can fluctuate substantially over short periods of time. A liquid secondary market may not exist for certain types of commodity-related investments the fund may buy, which may make it difficult for the fund to sell them at an acceptable price. The fund’s ability to gain exposure to commodity-related investments and achieve its investment objective may be limited by its intention to qualify as a regulated investment company under the Internal Revenue Code of 1986, as amended.
Infrastructure-related companies risk. Infrastructure-related companies can be negatively affected by various factors, including general or local economic conditions and political developments, general changes in market sentiment towards infrastructure assets, high interest costs in connection with capital construction and improvement programs, difficulty in raising capital, costs associated with compliance with changes in regulations, regulation or intervention by various government authorities, including government regulation of rates, inexperience with and potential losses resulting from the deregulation of a particular industry or sector, changes in tax laws, tariffs and trade policies, environmental problems, costs or disruptions caused by extreme weather or other natural disasters, the effects of energy conservation policies, commodities markets disruptions (e.g., significant changes over short time periods in the price of oil), technological changes, surplus capacity, casualty losses, threat of terrorist attacks and changes in interest rates. Rising interest rates could lead to higher financing costs and
reduced earnings for infrastructure-related companies. A company is considered to be an infrastructure-related company if at least 50% of its non-cash assets are infrastructure assets or 50% of its gross income or net profits are derived, directly or indirectly, from the ownership, management, construction, operation, utilization or financing of infrastructure assets. Infrastructure-related companies may be focused in the energy, industrials and utilities sectors. At times, the performance of securities in these sectors may lag the performance of other sectors or the broader market as a whole. A downturn in these sectors could have an adverse impact on the fund.
Real estate securities risk. The value of real estate securities in general, and REITs in particular, are subject to the same risks as direct investments in real estate and will depend on the value of the underlying properties or the underlying loans or interest. The value of these securities will rise and fall in response to many factors, including economic conditions, the demand for rental property and changes in interest rates. In particular, the value of these securities may decline when interest rates rise and will also be affected by the real estate market and by the management of the underlying properties. During periods of rising interest rates, real estate securities may lose appeal for investors who may be able to obtain higher yields from other income-producing investments. Rising interest rates may also mean that financing for property purchases and improvements is more costly and difficult to obtain. Further, real estate companies may be negatively impacted by liabilities or losses due to environmental problems, extreme weather or natural disasters. In addition, real estate values have been subject to substantial fluctuations and declines on a local, regional and national basis in the past and may continue to be in the future. Highly leveraged real estate companies are particularly vulnerable to the effects of rising interest rates and/or an economic downturn. REITs may be more volatile and/or more illiquid than other types of equity securities.
Securities lending risk. Securities lending involves the risk that the fund may lose money because the borrower of the loaned securities fails to return the securities in a timely manner or at all. A delay in the recovery of loaned securities could interfere with the fund’s ability to vote proxies or settle transactions. Delayed settlement may limit the ability of the fund to reinvest the proceeds of a sale of securities or prevent the fund from selling securities at times and prices it considers desirable. The fund could also lose money in the event of a decline in the value of the collateral provided for the loaned securities, or a decline in the value of any investments made with cash collateral or even a loss of rights in the collateral should the borrower of the securities fail financially while holding the securities.
Operational and technology risk. The fund and the entities with which it interacts directly or indirectly, including the fund’s service providers and counterparties, issuers of
Prospectus May 1, 2026
72
Fund Details
securities held by the fund and other market participants, are susceptible to operational and technology risks, including those related to human errors, processing errors, communication errors, system failures, cybersecurity incidents, and the use of artificial intelligence, among others, which may impair the fund’s operations and/or result in losses for the fund. For example, the fund’s or its service providers’ assets or sensitive or confidential information may be misappropriated, data may be corrupted and operations may be disrupted (e.g., cyber-attacks, operational failures or broader disruptions may cause the release of private shareholder information or confidential fund information, interfere with the processing of shareholder transactions, impact the ability to calculate the fund’s net asset value and impede trading). Market events and disruptions also may trigger a volume of transactions that overloads current information technology and communication systems and processes, impacting the ability to conduct the fund’s operations.
While the fund and its service providers may establish business continuity and other plans and processes that seek to address the possibility of and fallout from cyber-attacks, disruptions or failures, there are inherent limitations in such plans and systems, including that they do not apply to third parties, such as fund counterparties, issuers of securities held by the fund or other market participants, as well as the possibility that certain risks have not been identified or that unknown threats may emerge in the future and there is no assurance that such plans and processes will be effective. Among other situations, disruptions (for example, pandemics or health crises) that cause prolonged periods of remote work or significant employee absences at the fund’s service providers could impact the ability to conduct the fund’s operations. In addition, the fund cannot directly control any cybersecurity plans and systems, including artificial intelligence, put in place by its service providers, fund counterparties, issuers of securities held by the fund or other market participants.
Cyber-attacks may include unauthorized attempts by third parties to improperly access, modify, disrupt the operations of, or prevent access to the systems of the fund’s service providers or counterparties, issuers of securities held by the fund or other market participants or data within them. In addition, power or communications outages, acts of god, information technology equipment malfunctions, operational errors, and inaccuracies within software or data processing systems may also disrupt business operations or impact critical data.
Cyber-attacks, disruptions, or failures may adversely affect the fund and its shareholders or cause reputational damage and subject the fund to regulatory fines, litigation costs, penalties or financial losses, reimbursement or other compensation costs, and/or additional compliance costs. In addition, cyber-attacks, disruptions, or failures involving a fund counterparty could affect such
counterparty’s ability to meet its obligations to the fund, which may result in losses to the fund and its shareholders. Similar types of operational and technology risks are also present for issuers of securities held by the fund, which could have material adverse consequences for such issuers, and may cause the fund’s investments to lose value. Furthermore, as a result of cyber-attacks, disruptions, or failures, an exchange or market may close or issue trading halts on specific securities or the entire market, which may result in the fund being, among other things, unable to buy or sell certain securities or financial instruments or unable to accurately price its investments.
For example, the fund relies on various sources to calculate its NAV. Therefore, the fund is subject to certain operational risks associated with reliance on third party service providers and data sources. NAV calculation may be impacted by operational risks arising from factors such as failures in systems and technology. Such failures may result in delays in the calculation of the fund’s NAV and/or the inability to calculate NAV over extended time periods. The fund may be unable to recover any losses associated with such failures.
In addition, the development and use of artificial intelligence technologies are expanding rapidly and may be employed by service providers that support the operations of the fund as well as by issuers of securities held by the fund. Artificial intelligence technologies rely on complex algorithms and large data sets, which may produce incomplete, inaccurate, or biased outcomes and lead to errors in decision making, reputational damage, legal or operational challenges, and investment losses negatively affecting the fund. Artificial intelligence technologies and their current and potential future applications, and the regulatory frameworks within which they operate, continue to evolve rapidly, and it is impossible to anticipate the full scope of future impacts such developments may have and the associated risks to the fund.
Municipal securities risk. Municipal instruments may be susceptible to periods of economic stress, which could affect the market values and marketability of many or all municipal obligations of issuers in a state, US territory, or possession. The fund could also be impacted by events in the municipal securities market, including the supply and demand for municipal securities. Negative events, such as severe fiscal difficulties, bankruptcy of one or more issuers, an economic downturn, unfavorable legislation, court rulings or political developments, or reduced monetary support from the federal government could hurt fund performance. The municipal securities market can be susceptible to increases in volatility and decreases in liquidity. Liquidity can decline unpredictably in response to overall economic conditions or credit tightening. Increases in volatility and decreases in liquidity may be caused by a rise in interest rates (or the expectation of a rise in interest rates). Municipal securities may include revenue bonds, which are generally backed by revenue from a specific
Prospectus May 1, 2026
73
Fund Details
project or tax. The issuer of a revenue bond makes interest and principal payments from revenues generated from a particular source or facility, such as a tax on particular property or revenues generated from a municipal water or sewer utility or an airport. Revenue bonds generally are not backed by the full faith and credit and general taxing power of the issuer. The value of municipal securities is strongly influenced by the value of tax-exempt income to investors. Changes in tax and other laws, including changes to individual or corporate tax rates, could alter the attractiveness and overall demand for municipal securities. Municipal securities may also have exposure to potential physical risks resulting from climate change, including extreme weather, flooding and fires. Climate risks, if they materialize, can adversely impact a municipal issuer’s financial plans in current or future years or may impair a facility or other source generating revenues backing a municipal issuer’s revenue bonds. As a result, the impact of climate risks may adversely impact the value of the fund’s shares.
ELN risk. ELNs are investments that have their principal and/or interest based on the performance or value of a single equity security, a basket of equity securities, or an equity index. An investment in an ELN has the risks inherent in the underlying equity security or securities, including market risk, while also exposing the fund to risks applicable to debt instruments, such as credit risk, interest rate risk and counterparty risk. Because of the structure and terms of ELNs, the fund may not benefit fully from an increase in value of the underlying equity securities or index and the price of an ELN and the underlying instruments may be imperfectly correlated. The fund could lose its entire principal investment in the ELN. ELNs are also subject to liquidity risk and pricing risk because the secondary market for ELNs may be limited, which may cause the value of the ELN to decline and can make the ELN difficult to price, buy or sell.
Active trading risk. Active securities trading could raise transaction costs.
DWS Small Mid Cap Value VIP
Investment Objective
The fund seeks long-term capital appreciation.
Principal Investment Strategies
Main investments. Under normal circumstances, the fund invests at least 80% of net assets, plus the amount of any borrowings for investment purposes, in undervalued common stocks of small and mid-size US companies. The fund defines small companies as those that are similar in market capitalization to those in the Russell 2000® Value Index. While the market capitalization of the Russell 2000® Value Index changes throughout the year, as of February 28, 2026, the market capitalization range of the Russell 2000® Value Index was between $8.28 million and
$33.26 billion. Under normal circumstances, the Russell 2000® Value Index is reconstituted annually every June. The fund defines mid-size companies as those that are similar in market capitalization to those in the Russell Midcap® Value Index. While the market capitalization range of the Russell Midcap® Value Index changes throughout the year, as of February 28, 2026, the market capitalization range of the Russell Midcap® Value Index was between $1.13 billion and $129.02 billion. Under normal circumstances, the Russell Midcap® Value Index is reconstituted annually every June. The fund intends to invest primarily in companies whose market capitalizations fall within the normal range of each index at the time of investment.
Due to regulatory changes, effective June 11, 2026, the fund will replace the 80% investment policy and related disclosures set forth in this prospectus. Specifically, effective June 11, 2026, under normal circumstances, the fund invests at least 80% of net assets, plus the amount of any borrowings for investment purposes, in common stocks of small and mid-size US value companies. For purposes of the 80% investment policy, “value companies” and “small and mid-sized companies” are those companies included in the Russell 2500™ Value Index. While the market capitalization range of the Russell 2500™ Value Index changes throughout the year, as of February 28, 2026, the market capitalization range of the Russell 2500™ Value Index was between $8.28 million and $93.78 billion. Derivative instruments that provide exposure to the investments above or exposure to one or more market risk factors associated with such investments are included in the fund’s 80% investment policy, consistent with the fund’s investment policies and limitations with respect to investments in derivatives.
While the fund invests mainly in US stocks, it could invest up to 20% of net assets in foreign securities.
The fund’s equity investments are mainly common stocks but may also include other types of equities such as preferred or convertible stocks. The fund may also invest in initial public offerings and real estate investment trusts (REITs).
Management process. In choosing stocks, portfolio management uses proprietary quantitative models to identify and acquire holdings for the fund. The quantitative models are research based and seek to identify primarily fundamental factors, including valuation, momentum, profitability, earnings and sales growth, which have been effective sources of return historically. These are dynamic models with different factor weights for different industry groupings. The fund’s portfolio is constructed based on this quantitative process that strives to maximize returns while maintaining a risk profile similar to the fund’s benchmark index.
Prospectus May 1, 2026
74
Fund Details
Portfolio management may sell a security when its quantitative model indicates that other investments are more attractive, when the company no longer meets performance or risk expectations, or to maintain portfolio characteristics similar to the fund’s benchmark.
All investment decisions are made within risk parameters set by portfolio management. The factors considered and models used by portfolio management may be adjusted from time to time and may favor different types of securities from different industries and companies at different times.
Portfolio management generally considers environmental, social and governance (ESG) factors that it believes to be financially material. Because small cap companies tend to be relatively early on in their operating histories, external rating companies may be unable to find ESG data for such companies.
Derivatives. The fund may invest in derivatives, which are financial instruments whose performance is derived, at least in part, from the performance of an underlying asset, security or index. In particular, portfolio management may use put options for hedging and volatility management purposes.
The fund may also use other types of derivatives (i) for hedging purposes; (ii) for risk management; (iii) for non-hedging purposes to seek to enhance potential gains; or (iv) as a substitute for direct investment in a particular asset class or to keep cash on hand to meet shareholder redemptions.
Securities lending. The fund may lend securities (up to one-third of total assets) to approved institutions, such as registered broker-dealers, pooled investment vehicles, banks and other financial institutions. In connection with such loans, the fund receives liquid collateral in an amount that is based on the type and value of the securities being lent, with riskier securities generally requiring higher levels of collateral.
Main Risks
There are several risk factors that could hurt the fund’s performance, cause you to lose money or cause the fund’s performance to trail that of other investments. The fund may not achieve its investment objective, and is not intended to be a complete investment program. An investment in the fund is not a deposit of a bank and is not insured or guaranteed by the Federal Deposit Insurance Corporation or any other governmental agency.
Stock market risk. When stock prices fall, you should expect the value of your investment to fall as well. Stock prices can be hurt by poor management on the part of the stock’s issuer, shrinking product demand and other business risks, such as rapid technological developments or widespread adoption of emerging technologies (such as artificial intelligence) impacting the issuer’s competitive position, cybersecurity incidents, financial leverage and
labor and supply shortages. These may affect single companies as well as groups of companies. The market as a whole may not favor the types of investments the fund makes, which could adversely affect a stock’s price, regardless of how well the company performs, or the fund’s ability to sell a stock at an attractive price. There is a chance that stock prices overall will decline because stock markets tend to move in cycles, with periods of rising and falling prices. Events in the US and global financial markets, including actions taken by the US Federal Reserve or foreign central banks to stimulate or stabilize economic growth, may at times result in unusually high market volatility which could negatively affect performance. High market volatility may also result from significant shifts in momentum of one or more specific stocks due to unusual increases or decreases in trading activity. Momentum can change quickly, and securities subject to shifts in momentum may be more volatile than the market as a whole and returns on such securities may drop precipitously. To the extent that the fund invests in a particular geographic region, capitalization or sector, the fund’s performance may be affected by the general performance of that region, capitalization or sector.
Market disruption risk. Economies and financial markets throughout the world have become increasingly interconnected, which has increased the likelihood that events or conditions in one country or region will adversely impact markets or issuers in other countries or regions. This includes reliance on global supply chains that are susceptible to disruptions resulting from, among other things, war and other armed conflicts, tariffs, extreme weather events, and natural disasters. Such supply chain disruptions can lead to, and have led to, economic and market disruptions that have far-reaching effects on financial markets worldwide. The value of the fund’s investments may be negatively affected by adverse changes in overall economic or market conditions, such as the level of economic activity and productivity, unemployment and labor force participation rates, inflation or deflation (and expectations for inflation or deflation), interest rates, demand and supply for particular products or resources including labor, debt levels and credit ratings, and trade policies, among other factors. Such adverse conditions may contribute to an overall economic contraction across entire economies or markets, which may negatively impact the profitability of issuers operating in those economies or markets. In addition, geopolitical and other globally interconnected occurrences, including war and other armed conflicts, terrorism, economic uncertainty or financial crises, contagion, tariffs and trade disputes, government debt crises (including defaults or downgrades) or uncertainty about government debt payments, government shutdowns, public health crises, natural disasters, supply chain disruptions, climate change and related events or conditions, have led, and in the future may lead, to disruptions in the US and world economies and markets, which may increase financial market volatility and have significant
Prospectus May 1, 2026
75
Fund Details
adverse direct or indirect effects on the fund and its investments. Ongoing trade disputes between the United States and other countries may lead to tariffs and investment restrictions, negatively impacting affected companies and their securities. These disputes can also harm the economies of the United States and its trading partners, as well as financial markets overall. Adverse market conditions or disruptions could cause the fund to lose money, experience significant redemptions, and encounter operational difficulties. Although multiple asset classes may be affected by adverse market conditions or a particular market disruption, the duration and effects may not be the same for all types of assets.
Current military and other armed conflicts in various geographic regions, including those in Europe and the Middle East, among others, can lead to, and have led to, economic and market disruptions, which may not be limited to the geographic region in which the conflict is occurring. Such conflicts can also result, and have resulted in some cases, in sanctions being levied by the United States, the European Union and/or other countries against countries or other actors involved in the conflict. In addition, such conflicts and related sanctions can adversely affect regional and global energy, commodities, financial and other markets and thus could affect the value of the fund's investments. The extent and duration of any military or other armed conflict, related sanctions and resulting economic and market disruptions are impossible to predict, but could be substantial.
Other market disruption events include pandemic spread of viruses, such as the novel coronavirus known as COVID-19, which have caused significant uncertainty, market volatility, decreased economic and other activity, increased government activity, including economic stimulus measures, and supply chain disruptions, and may adversely affect the fund and its investments.
In addition, markets are becoming increasingly susceptible to disruption events resulting from the use of new and emerging technologies, such as artificial intelligence, to engage in cyber-attacks or to take over the Web sites and/or social media accounts of companies, governmental entities or public officials, or to otherwise pose as or impersonate such, which then may be used to disseminate false or misleading information that can cause volatility in financial markets or for the securities of a particular company, group of companies, industry or other class of assets.
Adverse market conditions or particular market disruptions, such as those discussed above, may magnify the impact of each of the other risks described in this “MAIN RISKS” section and may increase volatility in one or more markets in which the fund invests leading to the potential for greater losses for the fund.
Small company risk. Small company stocks tend to be more volatile than medium-sized or large company stocks. Because stock analysts are less likely to follow small companies, less information about them is available to
investors. Industry-wide reversals may have a greater impact on small companies, since they may lack the financial resources of larger companies. Small company stocks are typically less liquid than large company stocks.
Medium-sized company risk. Medium-sized company stocks tend to be more volatile than large company stocks. Because stock analysts are less likely to follow medium-sized companies, less information about them is available to investors. Industry-wide reversals may have a greater impact on medium-sized companies, since they may lack the financial resources of larger companies. Medium-sized company stocks are typically less liquid than large company stocks.
Value investing risk. As a category, value stocks may underperform growth stocks (and the stock market as a whole) over any period of time and may shift in and out of favor with investors generally, sometimes rapidly, depending on changes in market, economic and other factors. In addition, value stocks selected for investment by portfolio management may not perform as anticipated.
Quantitative model risk. The fund’s strategy relies heavily on quantitative models and the analysis of specific metrics to construct the fund’s portfolio. The impact of these metrics on a stock’s performance can be difficult to predict, and stocks that previously possessed certain desirable quantitative characteristics may not continue to demonstrate those same characteristics in the future. In addition, relying on quantitative models entails the risk that the models themselves may be limited or incorrect, that the data on which the models rely may be incorrect or incomplete, and that the Advisor may not be successful in selecting companies for investment or determining the weighting of particular stocks in the fund’s portfolio. Any of these factors could cause the fund to underperform funds with similar strategies that do not select stocks based on quantitative analysis.
Security selection risk. The securities in the fund’s portfolio may decline in value. Portfolio management could be wrong in its analysis of industries, companies, economic trends, ESG factors, the relative attractiveness of different securities or other matters.
Focus risk. To the extent that the fund focuses its investments in particular industries, asset classes or sectors of the economy, any market price movements, regulatory or technological changes, or economic conditions affecting companies in those industries, asset classes or sectors may have a significant impact on the fund’s performance. The fund may become more focused in particular industries, asset classes or sectors of the economy as a result of changes in the valuation of the fund’s investments or fluctuations in the fund’s assets, and the fund is not required to reduce such exposures under these circumstances.
Prospectus May 1, 2026
76
Fund Details
Foreign investment risk. The fund faces the risks inherent in foreign investing. Adverse political, economic or social developments, as well as US and foreign government actions such as the imposition of tariffs, economic and trade sanctions or embargoes, could undermine the value of the fund’s foreign investments, prevent the fund from realizing the full value of its foreign investments or prevent the fund from selling foreign securities it holds.
Financial reporting standards for companies based in foreign markets differ from those in the US. Additionally, foreign securities markets generally are smaller and less liquid than US markets. To the extent that the fund invests in non-US dollar denominated foreign securities, changes in currency exchange rates may affect the US dollar value of foreign securities or the income or gain received on these securities. In addition, because non-US markets may be open on days when the fund does not price its shares, the value of the foreign securities in the fund’s portfolio may change on days when shareholders will not be able to purchase or sell the fund’s shares.
Foreign governments may restrict investment by foreigners, limit withdrawal of trading profit or currency from the country, restrict currency exchange or seize foreign investments. The foreign investments of the fund may also be subject to foreign withholding or other taxes. Foreign brokerage commissions and other fees are generally higher than those for US investments, and the transactions and custody of foreign assets may involve delays in payment, delivery or recovery of money or investments.
Foreign markets can have liquidity risks beyond those typical of US markets. Because foreign exchanges generally are smaller and less liquid than US exchanges, buying and selling foreign investments can be more difficult and costly. Relatively small transactions can sometimes materially affect the price and availability of foreign securities. In certain situations, it may become virtually impossible to sell a foreign investment in an orderly fashion at a price that approaches portfolio management's estimate of its value. For the same reason, it may at times be difficult to value the fund’s foreign investments.
Real estate securities risk. The value of real estate securities in general, and REITs in particular, are subject to the same risks as direct investments in real estate and will depend on the value of the underlying properties or the underlying loans or interest. The value of these securities will rise and fall in response to many factors, including economic conditions, the demand for rental property and changes in interest rates. In particular, the value of these securities may decline when interest rates rise and will also be affected by the real estate market and by the management of the underlying properties. During periods of rising interest rates, real estate securities may lose appeal for investors who may be able to obtain higher yields from other income-producing investments. Rising interest rates may also mean that financing for property
purchases and improvements is more costly and difficult to obtain. Further, real estate companies may be negatively impacted by liabilities or losses due to environmental problems, extreme weather or natural disasters. In addition, real estate values have been subject to substantial fluctuations and declines on a local, regional and national basis in the past and may continue to be in the future. Highly leveraged real estate companies are particularly vulnerable to the effects of rising interest rates and/or an economic downturn. REITs may be more volatile and/or more illiquid than other types of equity securities.
Pricing risk. If market conditions make it difficult to value some investments, the fund may value these investments using more subjective methods and the value determined for an investment may be materially different from the value realized upon such investment’s sale. As a result, you could pay more than the market value when buying fund shares or receive less than the market value when selling fund shares.
Secondary markets may be subject to irregular trading activity, wide bid/ask spreads and extended trade settlement periods, which may prevent the fund from being able to realize full value and thus sell a security for its full valuation. This could cause a material decline in the fund’s net asset value.
Convertible securities risk. The market value of a convertible security performs like that of a regular debt security; that is, when interest rates rise, the price of a convertible security generally declines. In addition, convertible securities are subject to the risk that the issuer will not be able to pay interest or dividends when due, and their price may change based on changes in the issuer’s financial condition. Because a convertible security derives a portion of its value from the common stock into which it may be converted, market and issuer risks that apply to the underlying common stock could impact the price of the convertible security. Certain types of convertible securities may decline in value or lose their value entirely in the event the issuer's financial condition becomes significantly impaired.
Preferred stock risk. Preferred stock generally has a preference as to dividends and liquidation over an issuer’s common stock but ranks junior to debt securities in an issuer’s capital structure. Preferred stock is subject to many of the risks associated with debt securities, including interest rate risk. In addition, preferred stock may not pay a dividend, an issuer may suspend payment of dividends on preferred stock at any time, and in certain situations an issuer may call or redeem its preferred stock or convert it to common stock.
Securities lending risk. Securities lending involves the risk that the fund may lose money because the borrower of the loaned securities fails to return the securities in a timely manner or at all. A delay in the recovery of loaned securities could interfere with the fund’s ability to vote proxies or settle transactions. Delayed settlement may
Prospectus May 1, 2026
77
Fund Details
limit the ability of the fund to reinvest the proceeds of a sale of securities or prevent the fund from selling securities at times and prices it considers desirable. The fund could also lose money in the event of a decline in the value of the collateral provided for the loaned securities, or a decline in the value of any investments made with cash collateral or even a loss of rights in the collateral should the borrower of the securities fail financially while holding the securities.
Derivatives risk. Derivatives involve risks different from, and possibly greater than, the risks associated with investing directly in securities and other more traditional investments. Risks associated with derivatives may include the risk that the derivative is not well correlated with the underlying asset, security or index to which it relates; the risk that derivatives may result in losses or missed opportunities; the risk that the fund will be unable to sell the derivative because of an illiquid secondary market; the risk that a counterparty is unwilling or unable to meet its obligation, which risk may be heightened in derivative transactions entered into “over-the-counter” (i.e., not on an exchange or contract market); and the risk that the derivative transaction could expose the fund to the effects of leverage, which could increase the fund's exposure to the market and magnify potential losses.
There is no guarantee that derivatives, to the extent employed, will have the intended effect, and their use could cause lower returns or even losses to the fund. The use of derivatives by the fund to hedge risk may reduce the opportunity for gain by offsetting the positive effect of favorable price movements.
Counterparty risk. A financial institution or other counterparty with whom the fund does business, or that underwrites, distributes or guarantees any investments or contracts that the fund owns or is otherwise exposed to, may decline in financial health and become unable to honor its commitments. This could cause losses for the fund or could delay the return or delivery of collateral or other assets to the fund.
Liquidity risk. In certain situations, it may be difficult or impossible to sell an investment and/or the fund may sell certain investments at a price or time that is not advantageous in order to meet redemption requests or other cash needs. Unusual market conditions, such as an unusually high volume of redemptions or other similar conditions could increase liquidity risk for the fund.
This risk can be ongoing for any security that does not trade actively or in large volumes, for any security that trades primarily on smaller markets, and for investments that typically trade only among a limited number of large investors (such as certain types of derivatives or restricted securities). In unusual market conditions, even normally liquid securities may be affected by a degree of liquidity risk (i.e., if the number and capacity of traditional market participants is reduced). This may affect only certain securities or an overall securities market.
IPO risk. Prices of securities bought in an initial public offering (IPO) may rise and fall rapidly, often because of investor perceptions rather than economic reasons. To the extent a mutual fund is small in size, its IPO investments may have a significant impact on its performance since they may represent a larger proportion of the fund’s overall portfolio as compared to the portfolio of a larger fund.
Operational and technology risk. The fund and the entities with which it interacts directly or indirectly, including the fund’s service providers and counterparties, issuers of securities held by the fund and other market participants, are susceptible to operational and technology risks, including those related to human errors, processing errors, communication errors, system failures, cybersecurity incidents, and the use of artificial intelligence, among others, which may impair the fund’s operations and/or result in losses for the fund. For example, the fund’s or its service providers’ assets or sensitive or confidential information may be misappropriated, data may be corrupted and operations may be disrupted (e.g., cyber-attacks, operational failures or broader disruptions may cause the release of private shareholder information or confidential fund information, interfere with the processing of shareholder transactions, impact the ability to calculate the fund’s net asset value and impede trading). Market events and disruptions also may trigger a volume of transactions that overloads current information technology and communication systems and processes, impacting the ability to conduct the fund’s operations.
While the fund and its service providers may establish business continuity and other plans and processes that seek to address the possibility of and fallout from cyber-attacks, disruptions or failures, there are inherent limitations in such plans and systems, including that they do not apply to third parties, such as fund counterparties, issuers of securities held by the fund or other market participants, as well as the possibility that certain risks have not been identified or that unknown threats may emerge in the future and there is no assurance that such plans and processes will be effective. Among other situations, disruptions (for example, pandemics or health crises) that cause prolonged periods of remote work or significant employee absences at the fund’s service providers could impact the ability to conduct the fund’s operations. In addition, the fund cannot directly control any cybersecurity plans and systems, including artificial intelligence, put in place by its service providers, fund counterparties, issuers of securities held by the fund or other market participants.
Cyber-attacks may include unauthorized attempts by third parties to improperly access, modify, disrupt the operations of, or prevent access to the systems of the fund’s service providers or counterparties, issuers of securities held by the fund or other market participants or data within them. In addition, power or communications outages, acts of god, information technology equipment malfunctions,
Prospectus May 1, 2026
78
Fund Details
operational errors, and inaccuracies within software or data processing systems may also disrupt business operations or impact critical data.
Cyber-attacks, disruptions, or failures may adversely affect the fund and its shareholders or cause reputational damage and subject the fund to regulatory fines, litigation costs, penalties or financial losses, reimbursement or other compensation costs, and/or additional compliance costs. In addition, cyber-attacks, disruptions, or failures involving a fund counterparty could affect such counterparty’s ability to meet its obligations to the fund, which may result in losses to the fund and its shareholders. Similar types of operational and technology risks are also present for issuers of securities held by the fund, which could have material adverse consequences for such issuers, and may cause the fund’s investments to lose value. Furthermore, as a result of cyber-attacks, disruptions, or failures, an exchange or market may close or issue trading halts on specific securities or the entire market, which may result in the fund being, among other things, unable to buy or sell certain securities or financial instruments or unable to accurately price its investments.
For example, the fund relies on various sources to calculate its NAV. Therefore, the fund is subject to certain operational risks associated with reliance on third party service providers and data sources. NAV calculation may be impacted by operational risks arising from factors such as failures in systems and technology. Such failures may result in delays in the calculation of the fund’s NAV and/or the inability to calculate NAV over extended time periods. The fund may be unable to recover any losses associated with such failures.
In addition, the development and use of artificial intelligence technologies are expanding rapidly and may be employed by service providers that support the operations of the fund as well as by issuers of securities held by the fund. Artificial intelligence technologies rely on complex algorithms and large data sets, which may produce incomplete, inaccurate, or biased outcomes and lead to errors in decision making, reputational damage, legal or operational challenges, and investment losses negatively affecting the fund. Artificial intelligence technologies and their current and potential future applications, and the regulatory frameworks within which they operate, continue to evolve rapidly, and it is impossible to anticipate the full scope of future impacts such developments may have and the associated risks to the fund.
DWS International Opportunities VIP
Investment Objective
The fund seeks long-term capital growth.
Principal Investment Strategies
Main Investments. The fund invests primarily in foreign equities (equities issued by foreign based companies and listed on foreign exchanges) and may invest in companies of any size and from any country, including countries with emerging economies. The fund’s equity investments may also include preferred stocks and other securities with equity characteristics, such as convertible securities and warrants.
The fund will generally invest less than 20% of its assets in US equities.
Management process. Portfolio management aims to add value through stock selection. In choosing securities, portfolio management employs a risk-balanced bottom-up selection process to identify companies it believes are well-positioned. Portfolio management utilizes a bottom-up investment process designed to identify attractive investments utilizing fundamental analysis, including regional and sector research, conducted by in-house analysts. The investment process aims to identify stocks that portfolio management believes present a compelling combination of superior growth and quality characteristics at attractive valuations. Portfolio management generally considers environmental, social and governance (ESG) factors that it believes to be financially material. The resulting portfolio is risk balanced through diversification across companies at different growth lifecycle stages, and managed by seeking to appropriately size positions and adapt portfolio construction as market conditions change.
Portfolio management will normally sell a stock when its price fully reflects portfolio management's estimate of its fundamental value, its fundamentals have deteriorated, other investments offer better opportunities or in the course of adjusting the fund’s exposure to a given country or sector.
Securities lending. The fund may lend securities (up to one-third of total assets) to approved institutions, such as registered broker-dealers, pooled investment vehicles, banks and other financial institutions. In connection with such loans, the fund receives liquid collateral in an amount that is based on the type and value of the securities being lent, with riskier securities generally requiring higher levels of collateral.
Other Investment Strategies
Derivatives. The fund may invest in derivatives, which are financial instruments whose performance is derived, at least in part, from the performance of an underlying asset, security or index. The fund may use various types of derivatives (i) for hedging purposes; (ii) for risk management; (iii) for non-hedging purposes to seek to enhance potential gains; or (iv) as a substitute for direct investment in a particular asset class or to keep cash on hand to meet shareholder redemptions.
Prospectus May 1, 2026
79
Fund Details
Main Risks
There are several risk factors that could hurt the fund’s performance, cause you to lose money or cause the fund’s performance to trail that of other investments. The fund may not achieve its investment objective, and is not intended to be a complete investment program. An investment in the fund is not a deposit of a bank and is not insured or guaranteed by the Federal Deposit Insurance Corporation or any other governmental agency.
Foreign investment risk. The fund faces the risks inherent in foreign investing. Adverse political, economic or social developments, as well as US and foreign government actions such as the imposition of tariffs, economic and trade sanctions or embargoes, could undermine the value of the fund’s foreign investments, prevent the fund from realizing the full value of its foreign investments or prevent the fund from selling foreign securities it holds.
Financial reporting standards for companies based in foreign markets differ from those in the US. Additionally, foreign securities markets generally are smaller and less liquid than US markets. To the extent that the fund invests in non-US dollar denominated foreign securities, changes in currency exchange rates may affect the US dollar value of foreign securities or the income or gain received on these securities. In addition, because non-US markets may be open on days when the fund does not price its shares, the value of the foreign securities in the fund’s portfolio may change on days when shareholders will not be able to purchase or sell the fund’s shares.
Foreign governments may restrict investment by foreigners, limit withdrawal of trading profit or currency from the country, restrict currency exchange or seize foreign investments. The foreign investments of the fund may also be subject to foreign withholding or other taxes. Foreign brokerage commissions and other fees are generally higher than those for US investments, and the transactions and custody of foreign assets may involve delays in payment, delivery or recovery of money or investments.
Foreign markets can have liquidity risks beyond those typical of US markets. Because foreign exchanges generally are smaller and less liquid than US exchanges, buying and selling foreign investments can be more difficult and costly. Relatively small transactions can sometimes materially affect the price and availability of foreign securities. In certain situations, it may become virtually impossible to sell a foreign investment in an orderly fashion at a price that approaches portfolio management's estimate of its value. For the same reason, it may at times be difficult to value the fund’s foreign investments.
Emerging markets risk. Foreign investment risks are greater in emerging markets than in developed markets. Investments in emerging markets are often considered speculative.
Emerging markets countries typically have economic and political systems that are less developed, and can be expected to be less stable than developed markets. For example, the economies of such countries can be subject to rapid and unpredictable rates of inflation or deflation.
Applicable regulatory, accounting, auditing and financial reporting and recordkeeping standards may be less rigorous in emerging markets countries and there may be significant differences between financial statements prepared in accordance with emerging markets countries’ accounting standards and practices and those prepared in accordance with international accounting standards. In particular, the assets and profits appearing on the financial statements of an emerging market country’s issuer may not reflect its financial position or results of operations in the way they would be reflected had such financial statements been prepared in accordance with US Generally Accepted Accounting Principles. The quality of audits in emerging markets countries may be unreliable. Consequently, the fund may not be provided the same degree of protection or information as would generally apply in developed countries and the fund may be exposed to significant losses.
There is also substantially less publicly available information about emerging market issuers than there is about issuers in developed countries. Therefore, disclosure of certain material information may not be made, and less information may be available to the fund and other investors than would be the case if the fund’s investments were restricted to securities of issuers in developed countries.
Currency risk. Changes in currency exchange rates may affect the value of the fund’s investments and the fund’s share price. The value of currencies are influenced by a variety of factors, that include: interest rates, national debt levels and trade deficits, changes in balances of payments and trade, domestic and foreign interest and inflation rates, global or regional political, economic or financial events, actual or potential government intervention, global energy prices, political instability and government monetary policies and the buying or selling of currency by a country’s government. Investments in foreign currencies are subject to the risk that those currencies will decline in value relative to the US dollar or, in the case of hedged positions, that the US dollar will decline relative to the currency being hedged. Currency exchange rates can be volatile and can change quickly and unpredictably, thereby impacting the value of the fund’s investments.
Focus risk. To the extent that the fund focuses its investments in particular industries, asset classes or sectors of the economy, any market price movements, regulatory or technological changes, or economic conditions affecting companies in those industries, asset classes or sectors may have a significant impact on the fund’s performance. The fund may become more focused in particular industries, asset classes or sectors of the economy as a result of changes in the valuation of the fund’s investments or
Prospectus May 1, 2026
80
Fund Details
fluctuations in the fund’s assets, and the fund is not required to reduce such exposures under these circumstances.
Regional focus risk. Focusing investments in a single country or few countries, or regions, involves increased currency, political, regulatory and other risks. Market swings in such a targeted country, countries or regions are likely to have a greater effect on fund performance than they would in a more geographically diversified fund.
Security selection risk. The securities in the fund’s portfolio may decline in value. Portfolio management could be wrong in its analysis of industries, companies, economic trends, ESG factors, the relative attractiveness of different securities or other matters.
Stock market risk. When stock prices fall, you should expect the value of your investment to fall as well. Stock prices can be hurt by poor management on the part of the stock’s issuer, shrinking product demand and other business risks, such as rapid technological developments or widespread adoption of emerging technologies (such as artificial intelligence) impacting the issuer’s competitive position, cybersecurity incidents, financial leverage and labor and supply shortages. These may affect single companies as well as groups of companies. The market as a whole may not favor the types of investments the fund makes, which could adversely affect a stock’s price, regardless of how well the company performs, or the fund’s ability to sell a stock at an attractive price. There is a chance that stock prices overall will decline because stock markets tend to move in cycles, with periods of rising and falling prices. Events in the US and global financial markets, including actions taken by the US Federal Reserve or foreign central banks to stimulate or stabilize economic growth, may at times result in unusually high market volatility which could negatively affect performance. High market volatility may also result from significant shifts in momentum of one or more specific stocks due to unusual increases or decreases in trading activity. Momentum can change quickly, and securities subject to shifts in momentum may be more volatile than the market as a whole and returns on such securities may drop precipitously. To the extent that the fund invests in a particular geographic region, capitalization or sector, the fund’s performance may be affected by the general performance of that region, capitalization or sector.
Market disruption risk. Economies and financial markets throughout the world have become increasingly interconnected, which has increased the likelihood that events or conditions in one country or region will adversely impact markets or issuers in other countries or regions. This includes reliance on global supply chains that are susceptible to disruptions resulting from, among other things, war and other armed conflicts, tariffs, extreme weather events, and natural disasters. Such supply chain disruptions can lead to, and have led to, economic and market disruptions that have far-reaching effects on financial
markets worldwide. The value of the fund’s investments may be negatively affected by adverse changes in overall economic or market conditions, such as the level of economic activity and productivity, unemployment and labor force participation rates, inflation or deflation (and expectations for inflation or deflation), interest rates, demand and supply for particular products or resources including labor, debt levels and credit ratings, and trade policies, among other factors. Such adverse conditions may contribute to an overall economic contraction across entire economies or markets, which may negatively impact the profitability of issuers operating in those economies or markets. In addition, geopolitical and other globally interconnected occurrences, including war and other armed conflicts, terrorism, economic uncertainty or financial crises, contagion, tariffs and trade disputes, government debt crises (including defaults or downgrades) or uncertainty about government debt payments, government shutdowns, public health crises, natural disasters, supply chain disruptions, climate change and related events or conditions, have led, and in the future may lead, to disruptions in the US and world economies and markets, which may increase financial market volatility and have significant adverse direct or indirect effects on the fund and its investments. Ongoing trade disputes between the United States and other countries may lead to tariffs and investment restrictions, negatively impacting affected companies and their securities. These disputes can also harm the economies of the United States and its trading partners, as well as financial markets overall. Adverse market conditions or disruptions could cause the fund to lose money, experience significant redemptions, and encounter operational difficulties. Although multiple asset classes may be affected by adverse market conditions or a particular market disruption, the duration and effects may not be the same for all types of assets.
Current military and other armed conflicts in various geographic regions, including those in Europe and the Middle East, among others, can lead to, and have led to, economic and market disruptions, which may not be limited to the geographic region in which the conflict is occurring. Such conflicts can also result, and have resulted in some cases, in sanctions being levied by the United States, the European Union and/or other countries against countries or other actors involved in the conflict. In addition, such conflicts and related sanctions can adversely affect regional and global energy, commodities, financial and other markets and thus could affect the value of the fund's investments. The extent and duration of any military or other armed conflict, related sanctions and resulting economic and market disruptions are impossible to predict, but could be substantial.
Other market disruption events include pandemic spread of viruses, such as the novel coronavirus known as COVID-19, which have caused significant uncertainty, market volatility, decreased economic and other activity,
Prospectus May 1, 2026
81
Fund Details
increased government activity, including economic stimulus measures, and supply chain disruptions, and may adversely affect the fund and its investments.
In addition, markets are becoming increasingly susceptible to disruption events resulting from the use of new and emerging technologies, such as artificial intelligence, to engage in cyber-attacks or to take over the Web sites and/or social media accounts of companies, governmental entities or public officials, or to otherwise pose as or impersonate such, which then may be used to disseminate false or misleading information that can cause volatility in financial markets or for the securities of a particular company, group of companies, industry or other class of assets.
Adverse market conditions or particular market disruptions, such as those discussed above, may magnify the impact of each of the other risks described in this “MAIN RISKS” section and may increase volatility in one or more markets in which the fund invests leading to the potential for greater losses for the fund.
Growth investing risk. As a category, growth stocks may underperform value stocks (and the stock market as a whole) over any period of time and may shift in and out of favor with investors generally, sometimes rapidly, depending on changes in market, economic and other factors that could impact expectations of future earnings. Because the prices of growth stocks are based largely on the expectation of future earnings, growth stock prices can decline rapidly and significantly in reaction to negative news about such factors as earnings, the economy, political developments, or other news.
A growth company may fail to fulfill apparent promise or may be eclipsed by competitors or its products or its services may be rendered obsolete by new technologies. Growth stocks also typically lack the dividends associated with value stocks that might otherwise cushion investors from the effects of declining stock prices. In addition, growth stocks selected for investment by portfolio management may not perform as anticipated.
Small company risk. Small company stocks tend to be more volatile than medium-sized or large company stocks. Because stock analysts are less likely to follow small companies, less information about them is available to investors. Industry-wide reversals may have a greater impact on small companies, since they may lack the financial resources of larger companies. Small company stocks are typically less liquid than large company stocks.
Medium-sized company risk. Medium-sized company stocks tend to be more volatile than large company stocks. Because stock analysts are less likely to follow medium-sized companies, less information about them is available to investors. Industry-wide reversals may have a greater impact on medium-sized companies, since they may lack the financial resources of larger companies. Medium-sized company stocks are typically less liquid than large company stocks.
Large-sized companies risk. Returns on investments in securities of large companies could trail the returns on investments in securities of smaller and medium-sized companies. Larger companies may be unable to respond as quickly as smaller and medium-sized companies to competitive challenges or to changes in business, product, financial or other market conditions. Larger companies may not be able to maintain growth at the high rates that may be achieved by well-managed smaller and medium-sized companies. During different market cycles, the performance of large-capitalization companies has trailed the overall performance of the broader securities markets.
Liquidity risk. In certain situations, it may be difficult or impossible to sell an investment and/or the fund may sell certain investments at a price or time that is not advantageous in order to meet redemption requests or other cash needs. Unusual market conditions, such as an unusually high volume of redemptions or other similar conditions could increase liquidity risk for the fund.
This risk can be ongoing for any security that does not trade actively or in large volumes, for any security that trades primarily on smaller markets, and for investments that typically trade only among a limited number of large investors (such as certain types of derivatives or restricted securities). In unusual market conditions, even normally liquid securities may be affected by a degree of liquidity risk (i.e., if the number and capacity of traditional market participants is reduced). This may affect only certain securities or an overall securities market.
Pricing risk. If market conditions make it difficult to value some investments, the fund may value these investments using more subjective methods and the value determined for an investment may be materially different from the value realized upon such investment’s sale. As a result, you could pay more than the market value when buying fund shares or receive less than the market value when selling fund shares.
Secondary markets may be subject to irregular trading activity, wide bid/ask spreads and extended trade settlement periods, which may prevent the fund from being able to realize full value and thus sell a security for its full valuation. This could cause a material decline in the fund’s net asset value.
Convertible securities risk. The market value of a convertible security performs like that of a regular debt security; that is, when interest rates rise, the price of a convertible security generally declines. In addition, convertible securities are subject to the risk that the issuer will not be able to pay interest or dividends when due, and their price may change based on changes in the issuer’s financial condition. Because a convertible security derives a portion of its value from the common stock into which it may be converted, market and issuer risks that apply to the underlying common stock could impact the price of the
Prospectus May 1, 2026
82
Fund Details
convertible security. Certain types of convertible securities may decline in value or lose their value entirely in the event the issuer's financial condition becomes significantly impaired.
Preferred stock risk. Preferred stock generally has a preference as to dividends and liquidation over an issuer’s common stock but ranks junior to debt securities in an issuer’s capital structure. Preferred stock is subject to many of the risks associated with debt securities, including interest rate risk. In addition, preferred stock may not pay a dividend, an issuer may suspend payment of dividends on preferred stock at any time, and in certain situations an issuer may call or redeem its preferred stock or convert it to common stock.
Credit risk. The fund's performance could be hurt if an issuer of a debt security suffers an adverse change in financial condition that results in the issuer not making timely payments of interest or principal, a security downgrade or an inability to meet a financial obligation. Credit risk is greater for lower-rated securities.
Because the issuers of high-yield debt securities, or junk bonds (debt securities rated below the fourth highest credit rating category), may be in uncertain financial health, the prices of their debt securities can be more vulnerable to bad economic news, or even the expectation of bad news, than investment-grade debt securities. Credit risk for high-yield securities is greater than for higher-rated securities.
For securities that rely on third-party guarantors to support their credit quality, the same risks may apply if the financial condition of the guarantor deteriorates or the guarantor ceases to insure securities. Because guarantors may insure many types of securities, including subprime mortgage bonds and other high-risk bonds, their financial condition could deteriorate as a result of events that have little or no connection to securities owned by the fund.
Interest rate risk. When interest rates rise, prices of debt securities generally decline. The longer the duration of the fund’s debt securities, the more sensitive the securities will be to interest rate changes. (As a general rule, a 1% rise in interest rates means a 1% fall in value for every year of duration.) Interest rates can change in response to the supply and demand for credit, government and/or central bank monetary policy and action, inflation rates, and other factors. Changing interest rates may have unpredictable effects on markets, may result in heightened market volatility and potential illiquidity and may detract from fund performance to the extent the fund is exposed to such interest rates and/or volatility.
Securities lending risk. Securities lending involves the risk that the fund may lose money because the borrower of the loaned securities fails to return the securities in a timely manner or at all. A delay in the recovery of loaned securities could interfere with the fund’s ability to vote proxies or settle transactions. Delayed settlement may
limit the ability of the fund to reinvest the proceeds of a sale of securities or prevent the fund from selling securities at times and prices it considers desirable. The fund could also lose money in the event of a decline in the value of the collateral provided for the loaned securities, or a decline in the value of any investments made with cash collateral or even a loss of rights in the collateral should the borrower of the securities fail financially while holding the securities.
Derivatives risk. Derivatives involve risks different from, and possibly greater than, the risks associated with investing directly in securities and other more traditional investments. Risks associated with derivatives may include the risk that the derivative is not well correlated with the underlying asset, security or index to which it relates; the risk that derivatives may result in losses or missed opportunities; the risk that the fund will be unable to sell the derivative because of an illiquid secondary market; the risk that a counterparty is unwilling or unable to meet its obligation, which risk may be heightened in derivative transactions entered into “over-the-counter” (i.e., not on an exchange or contract market); and the risk that the derivative transaction could expose the fund to the effects of leverage, which could increase the fund's exposure to the market and magnify potential losses.
There is no guarantee that derivatives, to the extent employed, will have the intended effect, and their use could cause lower returns or even losses to the fund. The use of derivatives by the fund to hedge risk may reduce the opportunity for gain by offsetting the positive effect of favorable price movements.
Counterparty risk. A financial institution or other counterparty with whom the fund does business, or that underwrites, distributes or guarantees any investments or contracts that the fund owns or is otherwise exposed to, may decline in financial health and become unable to honor its commitments. This could cause losses for the fund or could delay the return or delivery of collateral or other assets to the fund.
Operational and technology risk. The fund and the entities with which it interacts directly or indirectly, including the fund’s service providers and counterparties, issuers of securities held by the fund and other market participants, are susceptible to operational and technology risks, including those related to human errors, processing errors, communication errors, system failures, cybersecurity incidents, and the use of artificial intelligence, among others, which may impair the fund’s operations and/or result in losses for the fund. For example, the fund’s or its service providers’ assets or sensitive or confidential information may be misappropriated, data may be corrupted and operations may be disrupted (e.g., cyber-attacks, operational failures or broader disruptions may cause the release of private shareholder information or confidential fund information, interfere with the processing of shareholder transactions, impact the ability to calculate the fund’s net
Prospectus May 1, 2026
83
Fund Details
asset value and impede trading). Market events and disruptions also may trigger a volume of transactions that overloads current information technology and communication systems and processes, impacting the ability to conduct the fund’s operations.
While the fund and its service providers may establish business continuity and other plans and processes that seek to address the possibility of and fallout from cyber-attacks, disruptions or failures, there are inherent limitations in such plans and systems, including that they do not apply to third parties, such as fund counterparties, issuers of securities held by the fund or other market participants, as well as the possibility that certain risks have not been identified or that unknown threats may emerge in the future and there is no assurance that such plans and processes will be effective. Among other situations, disruptions (for example, pandemics or health crises) that cause prolonged periods of remote work or significant employee absences at the fund’s service providers could impact the ability to conduct the fund’s operations. In addition, the fund cannot directly control any cybersecurity plans and systems, including artificial intelligence, put in place by its service providers, fund counterparties, issuers of securities held by the fund or other market participants.
Cyber-attacks may include unauthorized attempts by third parties to improperly access, modify, disrupt the operations of, or prevent access to the systems of the fund’s service providers or counterparties, issuers of securities held by the fund or other market participants or data within them. In addition, power or communications outages, acts of god, information technology equipment malfunctions, operational errors, and inaccuracies within software or data processing systems may also disrupt business operations or impact critical data.
Cyber-attacks, disruptions, or failures may adversely affect the fund and its shareholders or cause reputational damage and subject the fund to regulatory fines, litigation costs, penalties or financial losses, reimbursement or other compensation costs, and/or additional compliance costs. In addition, cyber-attacks, disruptions, or failures involving a fund counterparty could affect such counterparty’s ability to meet its obligations to the fund, which may result in losses to the fund and its shareholders. Similar types of operational and technology risks are also present for issuers of securities held by the fund, which could have material adverse consequences for such issuers, and may cause the fund’s investments to lose value. Furthermore, as a result of cyber-attacks, disruptions, or failures, an exchange or market may close or issue trading halts on specific securities or the entire market, which may result in the fund being, among other things, unable to buy or sell certain securities or financial instruments or unable to accurately price its investments.
For example, the fund relies on various sources to calculate its NAV. Therefore, the fund is subject to certain operational risks associated with reliance on third party service providers and data sources. NAV calculation may be impacted by operational risks arising from factors such as failures in systems and technology. Such failures may result in delays in the calculation of the fund’s NAV and/or the inability to calculate NAV over extended time periods. The fund may be unable to recover any losses associated with such failures.
In addition, the development and use of artificial intelligence technologies are expanding rapidly and may be employed by service providers that support the operations of the fund as well as by issuers of securities held by the fund. Artificial intelligence technologies rely on complex algorithms and large data sets, which may produce incomplete, inaccurate, or biased outcomes and lead to errors in decision making, reputational damage, legal or operational challenges, and investment losses negatively affecting the fund. Artificial intelligence technologies and their current and potential future applications, and the regulatory frameworks within which they operate, continue to evolve rapidly, and it is impossible to anticipate the full scope of future impacts such developments may have and the associated risks to the fund.
DWS High Income VIP
Investment Objective
The fund seeks to provide a high level of current income.
Principal Investment Strategies
Main investments. Under normal circumstances, the fund generally invests at least 65% of net assets, plus the amount of any borrowings for investment purposes, in junk bonds, which are those rated below the fourth highest credit rating category (that is, grade BB/Ba and below) or, if unrated, determined by the Advisor to be of similar quality. Compared to investment-grade debt securities, junk bonds generally pay higher yields, have higher volatility and higher risk of default on payments of interest and principal. The fund may invest up to 50% of total assets in bonds denominated in US dollars or foreign currencies from foreign issuers, including issuers in emerging markets. The fund invests in securities of varying maturities and intends to maintain a dollar-weighted effective average portfolio maturity that will not exceed ten years. Subject to its portfolio maturity policy, the fund may purchase individual securities with any stated maturity. Because the fund may invest in fixed income securities of varying maturities, the fund's dollar-weighted average effective portfolio maturity will vary. As of February 28, 2026, the fund had a dollar-weighted average effective portfolio maturity of 3.53 years. The fund may invest on a limited basis, up to 5% of net assets, in common stocks, preferred shares and other equity securities.
Prospectus May 1, 2026
84
Fund Details
Due to regulatory changes, effective June 11, 2026, the fund will replace the 65% investment policy and related disclosures set forth in this prospectus. Specifically, effective June 11, 2026, under normal circumstances, the fund invests at least 80% of net assets, plus the amount of any borrowings for investment purposes, in below investment grade debt securities (i.e. junk bonds) (which are those rated below the fourth highest credit rating category or, if unrated, determined by the Advisor to be of similar quality). Derivative instruments that provide exposure to the investments above or exposure to one or more market risk factors associated with such investments are included in the fund’s 80% investment policy, consistent with the fund’s investment policies and limitations with respect to investments in derivatives.
In determining the dollar-weighted average effective portfolio maturity, portfolio management uses a security’s stated maturity or, if applicable, an earlier date on which portfolio management believes it is probable that the security will be repaid pursuant to a maturity-shortening feature of the security. Portfolio management might use a security’s effective maturity where, for example, market conditions favor a buyer exercising a put option (i.e., an option to sell a bond back to the issuer prior to its maturity) or an issuer exercising a call option (i.e., an option to redeem a bond prior to its maturity) or a principal prepayment provision (i.e., a provision allowing an issuer to repay principal before the stated maturity date). A security’s effective maturity can be substantially shorter than its stated maturity.
If a fixed income security is rated differently among the three major ratings agencies (i.e., Moody’s Investor Services, Inc., Fitch Investors Services, Inc., and Standard & Poor’s Ratings Group), portfolio management would rely on the highest credit rating for purposes of the fund’s investment policies.
Management process. Portfolio management focuses on cash flow and total return analysis, and broad diversification among countries, sectors, industries and individual issuers and maturities. Portfolio management uses an active process that emphasizes relative value, managing on a total return basis, and intensive research to identify stable to improving credit situations that may provide yield compensation for the risk of investing in junk bonds.
Portfolio management utilizes primarily a bottom-up approach, where relative value and fundamental analysis are used to select securities within each industry, and a top-down approach to assess the overall risk and return in the market, including macroeconomic trends. Portfolio management also incorporates other considerations that it believes to be financially material, including environmental, social and governance (ESG) factors, independent credit research, management visits and conference calls, as part of its analysis and research process.
Derivatives. The fund may invest in derivatives, which are financial instruments whose performance is derived, at least in part, from the performance of an underlying asset, security or index. In particular, portfolio management may use credit default swaps to seek to increase the fund’s income, to gain exposure to a bond issuer’s credit quality characteristics without directly investing in the bond, or to hedge the risk of default on bonds held in the fund’s portfolio. In addition, portfolio management may use forward currency contracts to hedge exposure to changes in foreign currency exchange rates on foreign currency denominated portfolio holdings or to facilitate transactions in foreign currency denominated securities.
The fund may also use other types of derivatives (i) for hedging purposes; (ii) for risk management; (iii) for non-hedging purposes to seek to enhance potential gains; or (iv) as a substitute for direct investment in a particular asset class or to keep cash on hand to meet shareholder redemptions.
Securities lending. The fund may lend securities (up to one-third of total assets) to approved institutions, such as registered broker-dealers, pooled investment vehicles, banks and other financial institutions. In connection with such loans, the fund receives liquid collateral in an amount that is based on the type and value of the securities being lent, with riskier securities generally requiring higher levels of collateral.
Active trading. The fund may trade securities actively and this may lead to high portfolio turnover.
Main Risks
There are several risk factors that could hurt the fund’s performance, cause you to lose money or cause the fund’s performance to trail that of other investments. The fund may not achieve its investment objective, and is not intended to be a complete investment program. An investment in the fund is not a deposit of a bank and is not insured or guaranteed by the Federal Deposit Insurance Corporation or any other governmental agency.
Credit risk. The fund's performance could be hurt if an issuer of a debt security suffers an adverse change in financial condition that results in the issuer not making timely payments of interest or principal, a security downgrade or an inability to meet a financial obligation. Credit risk is greater for lower-rated securities.
Because the issuers of high yield debt securities, or junk bonds (debt securities rated below the fourth highest credit rating category), may be in uncertain financial health, the prices of their debt securities can be more vulnerable to bad economic news, or even the expectation of bad news, than investment-grade debt securities. Credit risk for high yield securities is greater than for higher-rated securities.
Prospectus May 1, 2026
85
Fund Details
Because securities in default generally have missed one or more payments of interest and/or principal, an investment in such securities has an increased risk of loss. Issuers of securities in default have an increased likelihood of entering bankruptcy or beginning liquidation procedures which could impact the fund's ability to recoup its investment. Securities in default may be illiquid or trade in low volumes and thus may be difficult to value.
High yield debt securities risk. High yield debt securities, or junk bonds, are generally regarded as speculative with respect to the issuer’s continuing ability to meet principal and interest payments. High yield debt securities’ total return and yield may generally be expected to fluctuate more than the total return and yield of investment-grade debt securities. A real or perceived economic downturn or an increase in market interest rates could cause a decline in the value of high yield debt securities, result in increased redemptions and/or result in increased portfolio turnover, which could result in a decline in net asset value of the fund, reduce liquidity for certain investments and/or increase costs. High yield debt securities are often thinly traded and can be more difficult to sell and value accurately than investment-grade debt securities as there may be no established secondary market. Investments in high yield debt securities could increase liquidity risk for the fund. In addition, the market for high yield debt securities can experience sudden and sharp volatility which is generally associated more with investments in stocks.
Interest rate risk. When interest rates rise, prices of debt securities generally decline. The longer the duration of the fund’s debt securities, the more sensitive the fund will be to interest rate changes. (As a general rule, a 1% rise in interest rates means a 1% fall in value for every year of duration.) Interest rates can change in response to the supply and demand for credit, government and/or central bank monetary policy and action, inflation rates, and other factors. Changes in monetary policy made by central banks or governments are likely to affect the level of interest rates. Changing interest rates may have unpredictable effects on markets, may result in heightened market volatility and potential illiquidity and may detract from fund performance to the extent the fund is exposed to such interest rates and/or volatility. Rising interest rates could cause the value of the fund’s investments — and therefore its share price as well — to decline. A rising interest rate environment may cause investors to move out of fixed-income securities and related markets on a large scale, which could adversely affect the price and liquidity of such securities and could also result in increased redemptions from the fund. Increased redemptions from the fund may force the fund to sell investments at a time when it is not advantageous to do so, which could result in losses.
Prepayment and extension risk. When interest rates fall, issuers of high interest debt obligations may pay off the debts earlier than expected (prepayment risk), and the fund may have to reinvest the proceeds at lower yields.
When interest rates rise, issuers of lower interest debt obligations may pay off the debts later than expected (extension risk), thus keeping the fund’s assets tied up in lower interest debt obligations. Ultimately, any changes or unexpected behavior in interest rates could increase the volatility of the fund’s share price and yield and could hurt fund performance.
Foreign investment risk. The fund faces the risks inherent in foreign investing. Adverse political, economic or social developments, as well as US and foreign government actions such as the imposition of tariffs, economic and trade sanctions or embargoes, could undermine the value of the fund’s foreign investments, prevent the fund from realizing the full value of its foreign investments or prevent the fund from selling foreign securities it holds.
Financial reporting standards for companies based in foreign markets differ from those in the US. Additionally, foreign securities markets generally are smaller and less liquid than US markets. To the extent that the fund invests in non-US dollar denominated foreign securities, changes in currency exchange rates may affect the US dollar value of foreign securities or the income or gain received on these securities. In addition, because non-US markets may be open on days when the fund does not price its shares, the value of the foreign securities in the fund’s portfolio may change on days when shareholders will not be able to purchase or sell the fund’s shares.
Foreign governments may restrict investment by foreigners, limit withdrawal of trading profit or currency from the country, restrict currency exchange or seize foreign investments. The foreign investments of the fund may also be subject to foreign withholding or other taxes. Foreign brokerage commissions and other fees are generally higher than those for US investments, and the transactions and custody of foreign assets may involve delays in payment, delivery or recovery of money or investments.
Foreign markets can have liquidity risks beyond those typical of US markets. Because foreign exchanges generally are smaller and less liquid than US exchanges, buying and selling foreign investments can be more difficult and costly. Relatively small transactions can sometimes materially affect the price and availability of foreign securities. In certain situations, it may become virtually impossible to sell a foreign investment in an orderly fashion at a price that approaches portfolio management's estimate of its value. For the same reason, it may at times be difficult to value the fund’s foreign investments.
Emerging markets risk. Foreign investment risks are greater in emerging markets than in developed markets. Investments in emerging markets are often considered speculative.
Prospectus May 1, 2026
86
Fund Details
Emerging markets countries typically have economic and political systems that are less developed, and can be expected to be less stable than developed markets. For example, the economies of such countries can be subject to rapid and unpredictable rates of inflation or deflation.
Applicable regulatory, accounting, auditing and financial reporting and recordkeeping standards may be less rigorous in emerging markets countries and there may be significant differences between financial statements prepared in accordance with emerging markets countries’ accounting standards and practices and those prepared in accordance with international accounting standards. In particular, the assets and profits appearing on the financial statements of an emerging market country’s issuer may not reflect its financial position or results of operations in the way they would be reflected had such financial statements been prepared in accordance with US Generally Accepted Accounting Principles. The quality of audits in emerging markets countries may be unreliable. Consequently, the fund may not be provided the same degree of protection or information as would generally apply in developed countries and the fund may be exposed to significant losses.
There is also substantially less publicly available information about emerging market issuers than there is about issuers in developed countries. Therefore, disclosure of certain material information may not be made, and less information may be available to the fund and other investors than would be the case if the fund’s investments were restricted to securities of issuers in developed countries.
Security selection risk. The securities in the fund’s portfolio may decline in value. Portfolio management could be wrong in its analysis of industries, companies, economic trends, ESG factors, the relative attractiveness of different securities or other matters.
Focus risk. To the extent that the fund focuses its investments in particular industries, asset classes or sectors of the economy, any market price movements, regulatory or technological changes, or economic conditions affecting companies in those industries, asset classes or sectors may have a significant impact on the fund’s performance. The fund may become more focused in particular industries, asset classes or sectors of the economy as a result of changes in the valuation of the fund’s investments or fluctuations in the fund’s assets, and the fund is not required to reduce such exposures under these circumstances.
Market risk. The market value of the securities in which the fund invests may be impacted by the prospects of individual issuers, particular sectors or governments and/or general economic conditions throughout the world due to increasingly interconnected global economies and financial markets.
Market disruption risk. Economies and financial markets throughout the world have become increasingly interconnected, which has increased the likelihood that events or conditions in one country or region will adversely impact markets or issuers in other countries or regions. This includes reliance on global supply chains that are susceptible to disruptions resulting from, among other things, war and other armed conflicts, tariffs, extreme weather events, and natural disasters. Such supply chain disruptions can lead to, and have led to, economic and market disruptions that have far-reaching effects on financial markets worldwide. The value of the fund’s investments may be negatively affected by adverse changes in overall economic or market conditions, such as the level of economic activity and productivity, unemployment and labor force participation rates, inflation or deflation (and expectations for inflation or deflation), interest rates, demand and supply for particular products or resources including labor, debt levels and credit ratings, and trade policies, among other factors. Such adverse conditions may contribute to an overall economic contraction across entire economies or markets, which may negatively impact the profitability of issuers operating in those economies or markets. In addition, geopolitical and other globally interconnected occurrences, including war and other armed conflicts, terrorism, economic uncertainty or financial crises, contagion, tariffs and trade disputes, government debt crises (including defaults or downgrades) or uncertainty about government debt payments, government shutdowns, public health crises, natural disasters, supply chain disruptions, climate change and related events or conditions, have led, and in the future may lead, to disruptions in the US and world economies and markets, which may increase financial market volatility and have significant adverse direct or indirect effects on the fund and its investments. Ongoing trade disputes between the United States and other countries may lead to tariffs and investment restrictions, negatively impacting affected companies and their securities. These disputes can also harm the economies of the United States and its trading partners, as well as financial markets overall. Adverse market conditions or disruptions could cause the fund to lose money, experience significant redemptions, and encounter operational difficulties. Although multiple asset classes may be affected by adverse market conditions or a particular market disruption, the duration and effects may not be the same for all types of assets.
Current military and other armed conflicts in various geographic regions, including those in Europe and the Middle East, among others, can lead to, and have led to, economic and market disruptions, which may not be limited to the geographic region in which the conflict is occurring. Such conflicts can also result, and have resulted in some cases, in sanctions being levied by the United States, the European Union and/or other countries against countries or other actors involved in the conflict. In addition, such conflicts and related sanctions can
Prospectus May 1, 2026
87
Fund Details
adversely affect regional and global energy, commodities, financial and other markets and thus could affect the value of the fund's investments. The extent and duration of any military or other armed conflict, related sanctions and resulting economic and market disruptions are impossible to predict, but could be substantial.
Other market disruption events include pandemic spread of viruses, such as the novel coronavirus known as COVID-19, which have caused significant uncertainty, market volatility, decreased economic and other activity, increased government activity, including economic stimulus measures, and supply chain disruptions, and may adversely affect the fund and its investments.
In addition, markets are becoming increasingly susceptible to disruption events resulting from the use of new and emerging technologies, such as artificial intelligence, to engage in cyber-attacks or to take over the Web sites and/or social media accounts of companies, governmental entities or public officials, or to otherwise pose as or impersonate such, which then may be used to disseminate false or misleading information that can cause volatility in financial markets or for the securities of a particular company, group of companies, industry or other class of assets.
Adverse market conditions or particular market disruptions, such as those discussed above, may magnify the impact of each of the other risks described in this “MAIN RISKS” section and may increase volatility in one or more markets in which the fund invests leading to the potential for greater losses for the fund.
Inflation risk. Inflation risk is the risk that the real value of certain assets or real income from investments (the value of such assets or income after accounting for inflation) will be less in the future as inflation decreases the value of money. Inflation, and investors’ expectation of future inflation, can impact the current value of the fund's portfolio, resulting in lower asset values and losses to shareholders. This risk may be elevated compared to historical market conditions and could be impacted by monetary policy measures and the current interest rate environment.
Convertible securities risk. The market value of a convertible security performs like that of a regular debt security; that is, when interest rates rise, the price of a convertible security generally declines. In addition, convertible securities are subject to the risk that the issuer will not be able to pay interest or dividends when due, and their price may change based on changes in the issuer’s financial condition. Because a convertible security derives a portion of its value from the common stock into which it may be converted, market and issuer risks that apply to the underlying common stock could impact the price of the convertible security. Certain types of convertible securities may decline in value or lose their value entirely in the event the issuer's financial condition becomes significantly impaired.
Liquidity risk. In certain situations, it may be difficult or impossible to sell an investment and/or the fund may sell certain investments at a price or time that is not advantageous in order to meet redemption requests or other cash needs. Unusual market conditions, such as an unusually high volume of redemptions or other similar conditions could increase liquidity risk for the fund, and in extreme conditions, the fund could have difficulty meeting redemption requests.
This risk can be ongoing for any security that does not trade actively or in large volumes, for any security that trades primarily on smaller markets, and for investments that typically trade only among a limited number of large investors (such as certain types of derivatives or restricted securities). In unusual market conditions, even normally liquid securities may be affected by a degree of liquidity risk (i.e., if the number and capacity of traditional market participants is reduced). This may affect only certain securities or an overall securities market.
The potential for liquidity risk may be magnified by a rising interest rate environment or other circumstances where investor redemptions from fixed-income mutual funds may be higher than normal, potentially causing increased supply in the market due to selling activity. If dealer capacity in fixed-income markets is insufficient for market conditions, it may further inhibit liquidity and increase volatility in the fixed-income markets. Additionally, market participants, other than the fund, may attempt to sell fixed income holdings at the same time as the fund, which could cause downward pricing pressure and contribute to illiquidity.
Pricing risk. If market conditions make it difficult to value some investments, the fund may value these investments using more subjective methods and the value determined for an investment may be materially different from the value realized upon such investment’s sale. As a result, you could pay more than the market value when buying fund shares or receive less than the market value when selling fund shares.
Secondary markets may be subject to irregular trading activity, wide bid/ask spreads and extended trade settlement periods, which may prevent the fund from being able to realize full value and thus sell a security for its full valuation. This could cause a material decline in the fund’s net asset value.
Derivatives risk. Derivatives involve risks different from, and possibly greater than, the risks associated with investing directly in securities and other more traditional investments. Risks associated with derivatives may include the risk that the derivative is not well correlated with the underlying asset, security or index to which it relates; the risk that derivatives may result in losses or missed opportunities; the risk that the fund will be unable to sell the derivative because of an illiquid secondary market; the risk that a counterparty is unwilling or unable to meet its obligation, which risk may be heightened in
Prospectus May 1, 2026
88
Fund Details
derivative transactions entered into “over-the-counter” (i.e., not on an exchange or contract market); and the risk that the derivative transaction could expose the fund to the effects of leverage, which could increase the fund's exposure to the market and magnify potential losses.
There is no guarantee that derivatives, to the extent employed, will have the intended effect, and their use could cause lower returns or even losses to the fund. The use of derivatives by the fund to hedge risk may reduce the opportunity for gain by offsetting the positive effect of favorable price movements.
Securities lending risk. Securities lending involves the risk that the fund may lose money because the borrower of the loaned securities fails to return the securities in a timely manner or at all. A delay in the recovery of loaned securities could interfere with the fund’s ability to vote proxies or settle transactions. Delayed settlement may limit the ability of the fund to reinvest the proceeds of a sale of securities or prevent the fund from selling securities at times and prices it considers desirable. The fund could also lose money in the event of a decline in the value of the collateral provided for the loaned securities, or a decline in the value of any investments made with cash collateral or even a loss of rights in the collateral should the borrower of the securities fail financially while holding the securities.
Counterparty risk. A financial institution or other counterparty with whom the fund does business, or that underwrites, distributes or guarantees any investments or contracts that the fund owns or is otherwise exposed to, may decline in financial health and become unable to honor its commitments. This could cause losses for the fund or could delay the return or delivery of collateral or other assets to the fund.
Stock market risk. When stock prices fall, you should expect the value of your investment to fall as well. Stock prices can be hurt by poor management on the part of the stock’s issuer, shrinking product demand and other business risks, such as rapid technological developments or widespread adoption of emerging technologies (such as artificial intelligence) impacting the issuer’s competitive position, cybersecurity incidents, financial leverage and labor and supply shortages. These may affect single companies as well as groups of companies. The market as a whole may not favor the types of investments the fund makes, which could adversely affect a stock’s price, regardless of how well the company performs, or the fund’s ability to sell a stock at an attractive price. There is a chance that stock prices overall will decline because stock markets tend to move in cycles, with periods of rising and falling prices. Events in the US and global financial markets, including actions taken by the US Federal Reserve or foreign central banks to stimulate or stabilize economic growth, may at times result in unusually high market volatility which could negatively affect performance. High market volatility may also result from
significant shifts in momentum of one or more specific stocks due to unusual increases or decreases in trading activity. Momentum can change quickly, and securities subject to shifts in momentum may be more volatile than the market as a whole and returns on such securities may drop precipitously. To the extent that the fund invests in a particular geographic region, capitalization or sector, the fund’s performance may be affected by the general performance of that region, capitalization or sector.
Operational and technology risk. The fund and the entities with which it interacts directly or indirectly, including the fund’s service providers and counterparties, issuers of securities held by the fund and other market participants, are susceptible to operational and technology risks, including those related to human errors, processing errors, communication errors, system failures, cybersecurity incidents, and the use of artificial intelligence, among others, which may impair the fund’s operations and/or result in losses for the fund. For example, the fund’s or its service providers’ assets or sensitive or confidential information may be misappropriated, data may be corrupted and operations may be disrupted (e.g., cyber-attacks, operational failures or broader disruptions may cause the release of private shareholder information or confidential fund information, interfere with the processing of shareholder transactions, impact the ability to calculate the fund’s net asset value and impede trading). Market events and disruptions also may trigger a volume of transactions that overloads current information technology and communication systems and processes, impacting the ability to conduct the fund’s operations.
While the fund and its service providers may establish business continuity and other plans and processes that seek to address the possibility of and fallout from cyber-attacks, disruptions or failures, there are inherent limitations in such plans and systems, including that they do not apply to third parties, such as fund counterparties, issuers of securities held by the fund or other market participants, as well as the possibility that certain risks have not been identified or that unknown threats may emerge in the future and there is no assurance that such plans and processes will be effective. Among other situations, disruptions (for example, pandemics or health crises) that cause prolonged periods of remote work or significant employee absences at the fund’s service providers could impact the ability to conduct the fund’s operations. In addition, the fund cannot directly control any cybersecurity plans and systems, including artificial intelligence, put in place by its service providers, fund counterparties, issuers of securities held by the fund or other market participants.
Cyber-attacks may include unauthorized attempts by third parties to improperly access, modify, disrupt the operations of, or prevent access to the systems of the fund’s service providers or counterparties, issuers of securities held by the fund or other market participants or data within
Prospectus May 1, 2026
89
Fund Details
them. In addition, power or communications outages, acts of god, information technology equipment malfunctions, operational errors, and inaccuracies within software or data processing systems may also disrupt business operations or impact critical data.
Cyber-attacks, disruptions, or failures may adversely affect the fund and its shareholders or cause reputational damage and subject the fund to regulatory fines, litigation costs, penalties or financial losses, reimbursement or other compensation costs, and/or additional compliance costs. In addition, cyber-attacks, disruptions, or failures involving a fund counterparty could affect such counterparty’s ability to meet its obligations to the fund, which may result in losses to the fund and its shareholders. Similar types of operational and technology risks are also present for issuers of securities held by the fund, which could have material adverse consequences for such issuers, and may cause the fund’s investments to lose value. Furthermore, as a result of cyber-attacks, disruptions, or failures, an exchange or market may close or issue trading halts on specific securities or the entire market, which may result in the fund being, among other things, unable to buy or sell certain securities or financial instruments or unable to accurately price its investments.
For example, the fund relies on various sources to calculate its NAV. Therefore, the fund is subject to certain operational risks associated with reliance on third party service providers and data sources. NAV calculation may be impacted by operational risks arising from factors such as failures in systems and technology. Such failures may result in delays in the calculation of the fund’s NAV and/or the inability to calculate NAV over extended time periods. The fund may be unable to recover any losses associated with such failures.
In addition, the development and use of artificial intelligence technologies are expanding rapidly and may be employed by service providers that support the operations of the fund as well as by issuers of securities held by the fund. Artificial intelligence technologies rely on complex algorithms and large data sets, which may produce incomplete, inaccurate, or biased outcomes and lead to errors in decision making, reputational damage, legal or operational challenges, and investment losses negatively affecting the fund. Artificial intelligence technologies and their current and potential future applications, and the regulatory frameworks within which they operate, continue to evolve rapidly, and it is impossible to anticipate the full scope of future impacts such developments may have and the associated risks to the fund.
Active trading risk. Active securities trading could raise transaction costs.
DWS CROCI® U.S. VIP
Investment Objective
The fund seeks to achieve a high rate of total return.
Principal Investment Strategies
Main investments. Under normal circumstances, the fund invests at least 80% of net assets, plus the amount of any borrowings for investment purposes, in common stocks issued by US companies. Companies are selected for the fund’s portfolio using the Cash Return on Capital Invested (CROCI®) strategy as the primary factor, among other factors. Portfolio management will select stocks from among the largest US companies which are under CROCI® coverage at any given time (the number of companies under CROCI® coverage will vary; as of December 31, 2025, approximately 850 companies were under CROCI® coverage, including approximately 370 US companies). Companies are identified from the selection universe for investment and are selected from the following economic sectors classified in accordance with the Global Industry Classification Standard (GICS): Consumer Discretionary, Consumer Staples, Energy, Financials, Health Care, Information Technology, Industrials, Materials, Communication Services and Utilities.
Management process. Portfolio management selects stocks of companies that it believes offer economic value, utilizing the CROCI® strategy as the primary factor, among other factors. The CROCI® strategy is an investment process based on a proprietary valuation technique that attempts to understand the value of a company by converting financial statement data into a set of economic inputs that are used to calculate a valuation metric called the CROCI® Economic Price Earnings Ratio which is comparable across markets, sectors and stocks. The CROCI® Economic Price Earnings Ratio seeks to measure the “real” economic value rather than the “accounting” value of a company’s invested capital, and the economic returns thereof. Portfolio management believes that, over time, companies with more favorable financial metrics, including CROCI® Economic Price Earnings Ratios, will outperform other companies.
In selecting stocks, portfolio management measures economic value using the CROCI® Economic Price Earnings Ratio and may adjust this by factors such as stock price volatility, as determined by the CROCI® Investment Strategy and Valuation Group. The CROCI® Investment Strategy and Valuation Group may provide other CROCI® valuation metrics which portfolio management may use in addition to the CROCI® Economic Price Earnings Ratio. All CROCI® financial metrics may be adjusted from time to time. Portfolio management may also use factors other than the CROCI® strategy in selecting investments. The fund’s portfolio is reviewed periodically and adjusted in accordance with the CROCI® strategy’s rules.
Prospectus May 1, 2026
90
Fund Details
The CROCI® strategy is supplied by the CROCI® Investment Strategy and Valuation Group, a unit within DWS Group, through a licensing arrangement with the fund’s Advisor.
Portfolio management will periodically review and adjust the fund’s portfolio in order to maintain the desired balance between return potential and various risk factors, such as, without limitation: style, size, and idiosyncratic risks. Portfolio management may refer to the output of various optimization tools and other portfolio construction techniques in order to help control for unwanted portfolio exposure to the risk factors specified above versus relevant indices, as well as undesired levels of portfolio turnover, tax efficiency, and other factors.
CROCI® Investment Process. The CROCI® Investment Process is based on the belief that the data used in traditional valuations (i.e., accounting data) does not accurately appraise assets, reflect all liabilities or represent the real value of a company. This is because the accounting rules are not always designed specifically for investors and often utilize widely differing standards which can make measuring the real asset value of companies difficult. The CROCI® Investment Process seeks to generate data that will enable valuation comparisons on a consistent basis, resulting in what portfolio management believes is an effective and efficient sector and stock selection process targeting investment in real value. This CROCI® Investment Process takes into account financially material events which the CROCI® Investment Strategy and Valuation Group believes may impact a company’s valuation (and these may include macro and micro economic events, political and regulatory events or developments, and environmental, social or governance (ESG) considerations, among other factors).
Securities lending. The fund may lend securities (up to one-third of total assets) to approved institutions, such as registered broker-dealers, pooled investment vehicles, banks and other financial institutions. In connection with such loans, the fund receives liquid collateral in an amount that is based on the type and value of the securities being lent, with riskier securities generally requiring higher levels of collateral.
Other Investment Strategies
Derivatives. The fund may invest in derivatives, which are financial instruments whose performance is derived, at least in part, from the performance of an underlying asset, security or index. The fund may use various types of derivatives (i) for hedging purposes; (ii) for risk management; (iii) for non-hedging purposes to seek to enhance potential gains; or (iv) as a substitute for direct investment in a particular asset class or to keep cash on hand to meet shareholder redemptions.
Main Risks
There are several risk factors that could hurt the fund’s performance, cause you to lose money or cause the fund’s performance to trail that of other investments. The fund may not achieve its investment objective, and is not intended to be a complete investment program. An investment in the fund is not a deposit of a bank and is not insured or guaranteed by the Federal Deposit Insurance Corporation or any other governmental agency.
Stock market risk. When stock prices fall, you should expect the value of your investment to fall as well. Stock prices can be hurt by poor management on the part of the stock’s issuer, shrinking product demand and other business risks, such as rapid technological developments or widespread adoption of emerging technologies (such as artificial intelligence) impacting the issuer’s competitive position, cybersecurity incidents, financial leverage and labor and supply shortages. These may affect single companies as well as groups of companies. The market as a whole may not favor the types of investments the fund makes, which could adversely affect a stock’s price, regardless of how well the company performs, or the fund’s ability to sell a stock at an attractive price. There is a chance that stock prices overall will decline because stock markets tend to move in cycles, with periods of rising and falling prices. Events in the US and global financial markets, including actions taken by the US Federal Reserve or foreign central banks to stimulate or stabilize economic growth, may at times result in unusually high market volatility which could negatively affect performance. High market volatility may also result from significant shifts in momentum of one or more specific stocks due to unusual increases or decreases in trading activity. Momentum can change quickly, and securities subject to shifts in momentum may be more volatile than the market as a whole and returns on such securities may drop precipitously. To the extent that the fund invests in a particular geographic region, capitalization or sector, the fund’s performance may be affected by the general performance of that region, capitalization or sector.
Market disruption risk. Economies and financial markets throughout the world have become increasingly interconnected, which has increased the likelihood that events or conditions in one country or region will adversely impact markets or issuers in other countries or regions. This includes reliance on global supply chains that are susceptible to disruptions resulting from, among other things, war and other armed conflicts, tariffs, extreme weather events, and natural disasters. Such supply chain disruptions can lead to, and have led to, economic and market disruptions that have far-reaching effects on financial markets worldwide. The value of the fund’s investments may be negatively affected by adverse changes in overall economic or market conditions, such as the level of economic activity and productivity, unemployment and labor force participation rates, inflation or deflation (and
Prospectus May 1, 2026
91
Fund Details
expectations for inflation or deflation), interest rates, demand and supply for particular products or resources including labor, debt levels and credit ratings, and trade policies, among other factors. Such adverse conditions may contribute to an overall economic contraction across entire economies or markets, which may negatively impact the profitability of issuers operating in those economies or markets. In addition, geopolitical and other globally interconnected occurrences, including war and other armed conflicts, terrorism, economic uncertainty or financial crises, contagion, tariffs and trade disputes, government debt crises (including defaults or downgrades) or uncertainty about government debt payments, government shutdowns, public health crises, natural disasters, supply chain disruptions, climate change and related events or conditions, have led, and in the future may lead, to disruptions in the US and world economies and markets, which may increase financial market volatility and have significant adverse direct or indirect effects on the fund and its investments. Ongoing trade disputes between the United States and other countries may lead to tariffs and investment restrictions, negatively impacting affected companies and their securities. These disputes can also harm the economies of the United States and its trading partners, as well as financial markets overall. Adverse market conditions or disruptions could cause the fund to lose money, experience significant redemptions, and encounter operational difficulties. Although multiple asset classes may be affected by adverse market conditions or a particular market disruption, the duration and effects may not be the same for all types of assets.
Current military and other armed conflicts in various geographic regions, including those in Europe and the Middle East, among others, can lead to, and have led to, economic and market disruptions, which may not be limited to the geographic region in which the conflict is occurring. Such conflicts can also result, and have resulted in some cases, in sanctions being levied by the United States, the European Union and/or other countries against countries or other actors involved in the conflict. In addition, such conflicts and related sanctions can adversely affect regional and global energy, commodities, financial and other markets and thus could affect the value of the fund's investments. The extent and duration of any military or other armed conflict, related sanctions and resulting economic and market disruptions are impossible to predict, but could be substantial.
Other market disruption events include pandemic spread of viruses, such as the novel coronavirus known as COVID-19, which have caused significant uncertainty, market volatility, decreased economic and other activity, increased government activity, including economic stimulus measures, and supply chain disruptions, and may adversely affect the fund and its investments.
In addition, markets are becoming increasingly susceptible to disruption events resulting from the use of new and emerging technologies, such as artificial intelligence, to engage in cyber-attacks or to take over the Web sites and/or social media accounts of companies, governmental entities or public officials, or to otherwise pose as or impersonate such, which then may be used to disseminate false or misleading information that can cause volatility in financial markets or for the securities of a particular company, group of companies, industry or other class of assets.
Adverse market conditions or particular market disruptions, such as those discussed above, may magnify the impact of each of the other risks described in this “MAIN RISKS” section and may increase volatility in one or more markets in which the fund invests leading to the potential for greater losses for the fund.
CROCI® risk. The fund is managed using the CROCI® Investment Process which is based on portfolio management’s belief that, over time, stocks which display more favorable financial metrics (for example, the CROCI® Economic P/E Ratio) as generated by this process may outperform stocks which display less favorable metrics. This premise may not prove to be correct and prospective investors should evaluate this assumption prior to investing in the fund.
The calculation of financial metrics used by the fund (such as, among others, the CROCI® Economic P/E Ratio) are determined by the CROCI® Investment Strategy and Valuation Group using publicly available information. This publicly available information is adjusted based on assumptions made by the CROCI® Investment Strategy and Valuation Group that, subsequently, may not prove to have been correct. As financial metrics are calculated using historical information, there can be no guarantee of the future performance of the CROCI® strategy. The measures utilized by portfolio management to attempt to reduce portfolio turnover, market impact and transaction costs could affect performance. In addition, certain regulatory restrictions (e.g., limits on percentage of assets invested in a single industry) could constrain the fund’s ability to invest in some stocks that may have the most attractive financial metrics as determined by the CROCI® Investment Process.
Value investing risk. As a category, value stocks may underperform growth stocks (and the stock market as a whole) over any period of time and may shift in and out of favor with investors generally, sometimes rapidly, depending on changes in market, economic and other factors. In addition, value stocks selected for investment by portfolio management may not perform as anticipated.
Large-sized companies risk. Returns on investments in securities of large companies could trail the returns on investments in securities of smaller and medium-sized companies. Larger companies may be unable to respond as quickly as smaller and medium-sized companies to competitive challenges or to changes in business, product,
Prospectus May 1, 2026
92
Fund Details
financial or other market conditions. Larger companies may not be able to maintain growth at the high rates that may be achieved by well-managed smaller and medium-sized companies. During different market cycles, the performance of large-capitalization companies has trailed the overall performance of the broader securities markets.
Security selection risk. The securities in the fund’s portfolio may decline in value. Portfolio management could be wrong in its analysis of industries, companies, economic trends, the relative attractiveness of different securities or other matters.
Focus risk. To the extent that the fund focuses its investments in particular industries, asset classes or sectors of the economy, any market price movements, regulatory or technological changes, or economic conditions affecting companies in those industries, asset classes or sectors may have a significant impact on the fund’s performance. The fund may become more focused in particular industries, asset classes or sectors of the economy as a result of changes in the valuation of the fund’s investments or fluctuations in the fund’s assets, and the fund is not required to reduce such exposures under these circumstances.
Liquidity risk. In certain situations, it may be difficult or impossible to sell an investment and/or the fund may sell certain investments at a price or time that is not advantageous in order to meet redemption requests or other cash needs. Unusual market conditions, such as an unusually high volume of redemptions or other similar conditions could increase liquidity risk for the fund.
This risk can be ongoing for any security that does not trade actively or in large volumes, for any security that trades primarily on smaller markets, and for investments that typically trade only among a limited number of large investors (such as certain types of derivatives or restricted securities). In unusual market conditions, even normally liquid securities may be affected by a degree of liquidity risk (i.e., if the number and capacity of traditional market participants is reduced). This may affect only certain securities or an overall securities market.
Pricing risk. If market conditions make it difficult to value some investments, the fund may value these investments using more subjective methods and the value determined for an investment may be materially different from the value realized upon such investment’s sale. As a result, you could pay more than the market value when buying fund shares or receive less than the market value when selling fund shares.
Secondary markets may be subject to irregular trading activity, wide bid/ask spreads and extended trade settlement periods, which may prevent the fund from being able to realize full value and thus sell a security for its full valuation. This could cause a material decline in the fund’s net asset value.
Securities lending risk. Securities lending involves the risk that the fund may lose money because the borrower of the loaned securities fails to return the securities in a timely manner or at all. A delay in the recovery of loaned securities could interfere with the fund’s ability to vote proxies or settle transactions. Delayed settlement may limit the ability of the fund to reinvest the proceeds of a sale of securities or prevent the fund from selling securities at times and prices it considers desirable. The fund could also lose money in the event of a decline in the value of the collateral provided for the loaned securities, or a decline in the value of any investments made with cash collateral or even a loss of rights in the collateral should the borrower of the securities fail financially while holding the securities.
Derivatives risk. Derivatives involve risks different from, and possibly greater than, the risks associated with investing directly in securities and other more traditional investments. Risks associated with derivatives may include the risk that the derivative is not well correlated with the underlying asset, security or index to which it relates; the risk that derivatives may result in losses or missed opportunities; the risk that the fund will be unable to sell the derivative because of an illiquid secondary market; the risk that a counterparty is unwilling or unable to meet its obligation, which risk may be heightened in derivative transactions entered into “over-the-counter” (i.e., not on an exchange or contract market); and the risk that the derivative transaction could expose the fund to the effects of leverage, which could increase the fund's exposure to the market and magnify potential losses.
There is no guarantee that derivatives, to the extent employed, will have the intended effect, and their use could cause lower returns or even losses to the fund. The use of derivatives by the fund to hedge risk may reduce the opportunity for gain by offsetting the positive effect of favorable price movements.
Counterparty risk. A financial institution or other counterparty with whom the fund does business, or that underwrites, distributes or guarantees any investments or contracts that the fund owns or is otherwise exposed to, may decline in financial health and become unable to honor its commitments. This could cause losses for the fund or could delay the return or delivery of collateral or other assets to the fund.
Operational and technology risk. The fund and the entities with which it interacts directly or indirectly, including the fund’s service providers and counterparties, issuers of securities held by the fund and other market participants, are susceptible to operational and technology risks, including those related to human errors, processing errors, communication errors, system failures, cybersecurity incidents, and the use of artificial intelligence, among others, which may impair the fund’s operations and/or result in losses for the fund. For example, the fund’s or its service providers’ assets or sensitive or confidential information
Prospectus May 1, 2026
93
Fund Details
may be misappropriated, data may be corrupted and operations may be disrupted (e.g., cyber-attacks, operational failures or broader disruptions may cause the release of private shareholder information or confidential fund information, interfere with the processing of shareholder transactions, impact the ability to calculate the fund’s net asset value and impede trading). Market events and disruptions also may trigger a volume of transactions that overloads current information technology and communication systems and processes, impacting the ability to conduct the fund’s operations.
While the fund and its service providers may establish business continuity and other plans and processes that seek to address the possibility of and fallout from cyber-attacks, disruptions or failures, there are inherent limitations in such plans and systems, including that they do not apply to third parties, such as fund counterparties, issuers of securities held by the fund or other market participants, as well as the possibility that certain risks have not been identified or that unknown threats may emerge in the future and there is no assurance that such plans and processes will be effective. Among other situations, disruptions (for example, pandemics or health crises) that cause prolonged periods of remote work or significant employee absences at the fund’s service providers could impact the ability to conduct the fund’s operations. In addition, the fund cannot directly control any cybersecurity plans and systems, including artificial intelligence, put in place by its service providers, fund counterparties, issuers of securities held by the fund or other market participants.
Cyber-attacks may include unauthorized attempts by third parties to improperly access, modify, disrupt the operations of, or prevent access to the systems of the fund’s service providers or counterparties, issuers of securities held by the fund or other market participants or data within them. In addition, power or communications outages, acts of god, information technology equipment malfunctions, operational errors, and inaccuracies within software or data processing systems may also disrupt business operations or impact critical data.
Cyber-attacks, disruptions, or failures may adversely affect the fund and its shareholders or cause reputational damage and subject the fund to regulatory fines, litigation costs, penalties or financial losses, reimbursement or other compensation costs, and/or additional compliance costs. In addition, cyber-attacks, disruptions, or failures involving a fund counterparty could affect such counterparty’s ability to meet its obligations to the fund, which may result in losses to the fund and its shareholders. Similar types of operational and technology risks are also present for issuers of securities held by the fund, which could have material adverse consequences for such issuers, and may cause the fund’s investments to lose value. Furthermore, as a result of cyber-attacks, disruptions, or failures, an exchange or market may close or issue
trading halts on specific securities or the entire market, which may result in the fund being, among other things, unable to buy or sell certain securities or financial instruments or unable to accurately price its investments.
For example, the fund relies on various sources to calculate its NAV. Therefore, the fund is subject to certain operational risks associated with reliance on third party service providers and data sources. NAV calculation may be impacted by operational risks arising from factors such as failures in systems and technology. Such failures may result in delays in the calculation of the fund’s NAV and/or the inability to calculate NAV over extended time periods. The fund may be unable to recover any losses associated with such failures.
In addition, the development and use of artificial intelligence technologies are expanding rapidly and may be employed by service providers that support the operations of the fund as well as by issuers of securities held by the fund. Artificial intelligence technologies rely on complex algorithms and large data sets, which may produce incomplete, inaccurate, or biased outcomes and lead to errors in decision making, reputational damage, legal or operational challenges, and investment losses negatively affecting the fund. Artificial intelligence technologies and their current and potential future applications, and the regulatory frameworks within which they operate, continue to evolve rapidly, and it is impossible to anticipate the full scope of future impacts such developments may have and the associated risks to the fund.
DWS Government Money Market VIP
Investment Objective
The fund seeks maximum current income to the extent consistent with stability of principal.
Principal Investment Strategies
Main investments. The fund is a money market fund that is managed in accordance with federal regulations which govern the quality, maturity, diversity and liquidity of instruments in which a money market fund may invest.
The fund operates as a “government money market fund,” as such term is defined under federal regulations. As a government money market fund, the fund is required to invest at least 99.5% of its total assets at the time of investment in cash, US government securities, and/or repurchase agreements that are collateralized by these instruments.
The fund follows policies designed to seek to maintain a stable $1.00 share price:
Prospectus May 1, 2026
94
Fund Details
■
Fund securities are denominated in US dollars and, at the time of purchase, have remaining maturities of 397 days (about 13 months) or less, or have certain maturity shortening features (such as interest rate resets and demand features) that have the effect of reducing their maturities to 397 days or less.
■
The fund maintains a dollar-weighted average maturity of (i) 60 days or less and (ii) 120 days or less determined without regard to interest rate resets.
■
The fund maintains certain minimum liquidity standards such that:
-
the fund may not purchase a security other than a security offering daily liquidity if, immediately after purchase, the fund would have invested less than 25% of its total assets in securities offering daily liquidity (includes securities that mature or are subject to demand within one business day, cash or direct US government obligations);
-
the fund may not purchase a security other than a security offering weekly liquidity if, immediately after purchase, the fund would have invested less than 50% of its total assets in securities offering weekly liquidity (includes securities that mature or are subject to demand within five business days, cash, direct US government obligations and government agency discount notes with remaining maturities of 60 days or less); and
-
the fund may not purchase an illiquid security if, immediately after purchase, the fund would have invested more than 5% of its total assets in illiquid securities (securities that cannot be sold or disposed of in the ordinary course of business within seven days at approximately the market value ascribed to them by the fund).
The fund primarily invests in the following types of investments:
■
US Treasury bills, notes, bonds and other obligations issued or guaranteed by the US government, its agencies or instrumentalities.
■
Repurchase agreements backed by these instruments. In a repurchase agreement, the fund buys securities at one price with a simultaneous agreement to sell back the securities at a future date at an agreed-upon price.
The fund may invest in floating and variable rate instruments (obligations that do not bear interest at fixed rates).
Under normal circumstances, the fund invests at least 80% of net assets, plus the amount of any borrowings for investment purposes, in US government securities and/or repurchase agreements that are collateralized by US government securities.
Management process. Working in consultation with portfolio management, a credit team screens potential securities and develops a list of those that the fund may buy. Portfolio management, looking for attractive yield and
weighing considerations such as credit quality, economic outlooks and possible interest rate movements, then decides which securities on this list to buy.
Portfolio management may adjust the fund’s exposure to interest rate risk, typically seeking to take advantage of possible rises in interest rates and to preserve yield when interest rates appear likely to fall.
Main Risks
There are several risk factors that could reduce the yield you get from the fund, cause the fund’s performance to trail that of other investments, or cause you to lose money.
Money market fund risk. You could lose money by investing in the fund. Although the fund seeks to preserve the value of your investment at $1.00 per share, it cannot guarantee it will do so. An investment in the fund is not insured or guaranteed by the Federal Deposit Insurance Corporation or any other government agency.The Advisor has no legal obligation to provide financial support to the fund, and you should not expect that the Advisor will provide financial support to the fund at any time.
Market risk. The market value of the securities in which the fund invests may be impacted by the prospects of individual issuers, particular sectors or governments and/or general economic conditions throughout the world due to increasingly interconnected global economies and financial markets.
Market disruption risk. Economies and financial markets throughout the world have become increasingly interconnected, which has increased the likelihood that events or conditions in one country or region will adversely impact markets or issuers in other countries or regions. This includes reliance on global supply chains that are susceptible to disruptions resulting from, among other things, war and other armed conflicts, tariffs, extreme weather events, and natural disasters. Such supply chain disruptions can lead to, and have led to, economic and market disruptions that have far-reaching effects on financial markets worldwide. The value of the fund’s investments may be negatively affected by adverse changes in overall economic or market conditions, such as the level of economic activity and productivity, unemployment and labor force participation rates, inflation or deflation (and expectations for inflation or deflation), interest rates, demand and supply for particular products or resources including labor, debt levels and credit ratings, and trade policies, among other factors. Such adverse conditions may contribute to an overall economic contraction across entire economies or markets, which may negatively impact the profitability of issuers operating in those economies or markets. In addition, geopolitical and other globally interconnected occurrences, including war and other armed conflicts, terrorism, economic uncertainty or financial crises, contagion, tariffs and trade disputes, government
Prospectus May 1, 2026
95
Fund Details
debt crises (including defaults or downgrades) or uncertainty about government debt payments, government shutdowns, public health crises, natural disasters, supply chain disruptions, climate change and related events or conditions, have led, and in the future may lead, to disruptions in the US and world economies and markets, which may increase financial market volatility and have significant adverse direct or indirect effects on the fund and its investments. Ongoing trade disputes between the United States and other countries may lead to tariffs and investment restrictions, negatively impacting affected companies and their securities. These disputes can also harm the economies of the United States and its trading partners, as well as financial markets overall. Adverse market conditions or disruptions could cause the fund to lose money, experience significant redemptions, and encounter operational difficulties. Although multiple asset classes may be affected by adverse market conditions or a particular market disruption, the duration and effects may not be the same for all types of assets.
Current military and other armed conflicts in various geographic regions, including those in Europe and the Middle East, among others, can lead to, and have led to, economic and market disruptions, which may not be limited to the geographic region in which the conflict is occurring. Such conflicts can also result, and have resulted in some cases, in sanctions being levied by the United States, the European Union and/or other countries against countries or other actors involved in the conflict. In addition, such conflicts and related sanctions can adversely affect regional and global energy, commodities, financial and other markets and thus could affect the value of the fund's investments. The extent and duration of any military or other armed conflict, related sanctions and resulting economic and market disruptions are impossible to predict, but could be substantial.
Other market disruption events include pandemic spread of viruses, such as the novel coronavirus known as COVID-19, which have caused significant uncertainty, market volatility, decreased economic and other activity, increased government activity, including economic stimulus measures, and supply chain disruptions, and may adversely affect the fund and its investments.
In addition, markets are becoming increasingly susceptible to disruption events resulting from the use of new and emerging technologies, such as artificial intelligence, to engage in cyber-attacks or to take over the Web sites and/or social media accounts of companies, governmental entities or public officials, or to otherwise pose as or impersonate such, which then may be used to disseminate false or misleading information that can cause volatility in financial markets or for the securities of a particular company, group of companies, industry or other class of assets.
Adverse market conditions or particular market disruptions, such as those discussed above, may magnify the impact of each of the other risks described in this “MAIN RISKS”
section and may increase volatility in one or more markets in which the fund invests leading to the potential for greater losses for the fund.
Interest rate risk. Rising interest rates could cause the value of the fund’s investments — and therefore its share price as well — to decline. A rising interest rate environment may cause investors to move out of fixed-income securities and related markets on a large scale, which could adversely affect the price and liquidity of such securities and could also result in increased redemptions from the fund. Increased redemptions from the fund may force the fund to sell investments at a time when it is not advantageous to do so, which could result in losses. A sharp rise in interest rates could cause the value of the fund’s investments to decline and impair the fund’s ability to maintain a stable $1.00 share price. Conversely, any decline in interest rates is likely to cause the fund’s yield to decline, and during periods of unusually low or negative interest rates, the fund’s yield may approach or fall below zero. A low or negative interest rate environment may prevent the fund from providing a positive yield or paying fund expenses out of current income and, at times, could impair the fund’s ability to maintain a stable $1.00 share price. Over time, the total return of a money market fund may not keep pace with inflation, which could result in a net loss of purchasing power for long-term investors. Interest rates can change in response to the supply and demand for credit, government and/or central bank monetary policy and action, inflation rates, and other factors. Changes in monetary policy made by central banks or governments are likely to affect the level of interest rates. Changing interest rates may have unpredictable effects on markets, may result in heightened market volatility and potential illiquidity and may detract from fund performance to the extent the fund is exposed to such interest rates and/or volatility. Money market funds try to minimize interest rate risk by purchasing short-term securities. If there is an insufficient supply of US government securities to meet investor demand, it could result in lower yields on such securities and increase interest rate risk for the fund.
Security selection risk. Although short-term securities are relatively stable investments, it is possible that the securities in which the fund invests will not perform as expected. This could cause the fund's returns to lag behind those of similar money market funds and could result in a decline in share price.
Repurchase agreement risk. If the party that sells the securities to the fund defaults on its obligation to repurchase them at the agreed-upon time and price, the fund could lose money.
Counterparty risk. A financial institution or other counterparty with whom the fund does business, or that underwrites, distributes or guarantees any investments or contracts that the fund owns or is otherwise exposed to, may decline in financial health and become unable to
Prospectus May 1, 2026
96
Fund Details
honor its commitments. This could cause losses for the fund or could delay the return or delivery of collateral or other assets to the fund.
Credit risk. The fund's performance could be hurt and the fund's share price could fall below $1.00 if an issuer of a debt security suffers an adverse change in financial condition that results in the issuer not making timely payments of interest or principal, a security downgrade or an inability to meet a financial obligation.
Some securities issued by US government agencies or instrumentalities are backed by the full faith and credit of the US government. Other securities that are supported only by the credit of the issuing agency or instrumentality are subject to greater credit risk than securities backed by the full faith and credit of the US government. This is because the US government might provide financial support, but has no obligation to do so, if there is a potential or actual loss of principal or failure to make interest payments.
US government default risk. Due to the rising US government debt burden and potential limitations caused by the statutory debt ceiling, it is possible that the US government may not be able to meet its financial obligations or that securities issued by the US government may experience credit downgrades. In the past, US sovereign credit has experienced downgrades and there can be no guarantee that it will not experience further downgrades in the future by rating agencies. Such a credit event may adversely impact the financial markets and the fund. From time to time, uncertainty regarding the status of negotiations in the US government to increase the statutory debt ceiling and/or failure to increase the statutory debt ceiling could increase the risk that the US government may default on payments on certain US government securities, cause the credit rating of the US government to be downgraded or increase volatility in financial markets, result in higher interest rates, reduce prices of US Treasury securities and/or increase the costs of certain kinds of debt.
Liquidity and transaction risk. The liquidity of portfolio securities can deteriorate rapidly due to credit events affecting issuers or guarantors or due to general market conditions and a lack of willing buyers. When there are no willing buyers and an instrument cannot be readily sold at a desired time or price, the fund may have to accept a lower price or may not be able to sell the instrument at all. The potential for liquidity risk may be magnified by a rising interest rate environment or other circumstances where investor redemptions from money market funds may be higher than normal, potentially causing increased supply in the market due to selling activity. If dealer capacity in debt instruments is insufficient for market conditions, it may further inhibit liquidity and increase volatility in the debt markets. Additionally, market participants other than the fund may attempt to sell debt holdings at the same time as the fund, which could cause downward pricing pressure and contribute to illiquidity. An inability to sell one or more
portfolio securities can adversely affect the fund’s ability to maintain a $1.00 share price or prevent the fund from being able to take advantage of other investment opportunities.
Unusual market conditions, an unusually high volume of redemption requests or other similar conditions could cause the fund to be unable to pay redemption proceeds within a short period of time. If the fund is forced to sell securities at an unfavorable time and/or under unfavorable conditions, such sales may adversely affect the fund’s ability to maintain a $1.00 share price.
Certain shareholders, including clients or affiliates of the Advisor, may from time to time own or control a significant percentage of the fund’s shares. These shareholders may include, for example, institutional investors and other shareholders whose buy-sell decisions are controlled by a single decision maker. Redemptions by these shareholders, or a high volume of redemption requests generally, may further increase the fund’s liquidity risk and may impact the fund’s ability to maintain a $1.00 share price.
Prepayment and extension risk. When interest rates fall, issuers of high interest debt obligations may pay off the debts earlier than expected (prepayment risk), and the fund may have to reinvest the proceeds at lower yields. When interest rates rise, issuers of lower interest debt obligations may pay off the debts later than expected (extension risk), thus keeping the fund’s assets tied up in lower interest debt obligations. Ultimately, any changes or unexpected behavior in interest rates could increase the volatility of the fund’s yield and could hurt fund performance. Prepayments could also create capital gains tax liability in some instances.
Risks of holding cash. The fund will at times hold cash positions, which may hurt the fund’s performance. Cash positions may also subject the fund to additional risks and costs, including any fees imposed by the fund’s custodian for large cash balances.
Operational and technology risk. The fund and the entities with which it interacts directly or indirectly, including the fund’s service providers and counterparties, issuers of securities held by the fund and other market participants, are susceptible to operational and technology risks, including those related to human errors, processing errors, communication errors, system failures, cybersecurity incidents, and the use of artificial intelligence, among others, which may impair the fund’s operations and/or result in losses for the fund. For example, the fund’s or its service providers’ assets or sensitive or confidential information may be misappropriated, data may be corrupted and operations may be disrupted (e.g., cyber-attacks, operational failures or broader disruptions may cause the release of private shareholder information or confidential fund information, interfere with the processing of shareholder transactions, impact the ability to calculate the fund’s net asset value and impede trading). Market events and disruptions also may trigger a volume of transactions that
Prospectus May 1, 2026
97
Fund Details
overloads current information technology and communication systems and processes, impacting the ability to conduct the fund’s operations.
While the fund and its service providers may establish business continuity and other plans and processes that seek to address the possibility of and fallout from cyber-attacks, disruptions or failures, there are inherent limitations in such plans and systems, including that they do not apply to third parties, such as fund counterparties, issuers of securities held by the fund or other market participants, as well as the possibility that certain risks have not been identified or that unknown threats may emerge in the future and there is no assurance that such plans and processes will be effective. Among other situations, disruptions (for example, pandemics or health crises) that cause prolonged periods of remote work or significant employee absences at the fund’s service providers could impact the ability to conduct the fund’s operations. In addition, the fund cannot directly control any cybersecurity plans and systems, including artificial intelligence, put in place by its service providers, fund counterparties, issuers of securities held by the fund or other market participants.
Cyber-attacks may include unauthorized attempts by third parties to improperly access, modify, disrupt the operations of, or prevent access to the systems of the fund’s service providers or counterparties, issuers of securities held by the fund or other market participants or data within them. In addition, power or communications outages, acts of god, information technology equipment malfunctions, operational errors, and inaccuracies within software or data processing systems may also disrupt business operations or impact critical data.
Cyber-attacks, disruptions, or failures may adversely affect the fund and its shareholders or cause reputational damage and subject the fund to regulatory fines, litigation costs, penalties or financial losses, reimbursement or other compensation costs, and/or additional compliance costs. In addition, cyber-attacks, disruptions, or failures involving a fund counterparty could affect such counterparty’s ability to meet its obligations to the fund, which may result in losses to the fund and its shareholders. Similar types of operational and technology risks are also present for issuers of securities held by the fund, which could have material adverse consequences for such issuers, and may cause the fund’s investments to lose value. Furthermore, as a result of cyber-attacks, disruptions, or failures, an exchange or market may close or issue trading halts on specific securities or the entire market, which may result in the fund being, among other things, unable to buy or sell certain securities or financial instruments or unable to accurately price its investments.
For example, the fund relies on various sources to calculate its NAV. Therefore, the fund is subject to certain operational risks associated with reliance on third party service providers and data sources. NAV calculation may
be impacted by operational risks arising from factors such as failures in systems and technology. Such failures may result in delays in the calculation of the fund’s NAV and/or the inability to calculate NAV over extended time periods. The fund may be unable to recover any losses associated with such failures.
In addition, the development and use of artificial intelligence technologies are expanding rapidly and may be employed by service providers that support the operations of the fund as well as by issuers of securities held by the fund. Artificial intelligence technologies rely on complex algorithms and large data sets, which may produce incomplete, inaccurate, or biased outcomes and lead to errors in decision making, reputational damage, legal or operational challenges, and investment losses negatively affecting the fund. Artificial intelligence technologies and their current and potential future applications, and the regulatory frameworks within which they operate, continue to evolve rapidly, and it is impossible to anticipate the full scope of future impacts such developments may have and the associated risks to the fund.
DWS Small Mid Cap Growth VIP
Investment Objective
The fund seeks long-term capital appreciation.
Principal Investment Strategies
Main investments. Under normal circumstances, the fund invests at least 80% of net assets, plus the amount of any borrowings for investment purposes, in common stocks and other equity securities of small and mid-sized US companies. The fund defines small companies as those that are similar in market capitalization to those in the Russell 2000® Growth Index. While the market capitalization of the Russell 2000® Growth Index changes throughout the year, as of February 28, 2026, the market capitalization range of the Russell 2000® Growth Index was between $8.79 million and $43.67 billion. Under normal circumstances, the Russell 2000® Growth Index is reconstituted annually every June. The fund defines mid-sized companies as those that are similar in market capitalization to those in the Russell Midcap® Growth Index. While the market capitalization range of the Russell Midcap® Growth Index changes throughout the year, as of February 28, 2026, the market capitalization range of the Russell Midcap® Growth Index was between $1.46 billion and $105.26 billion. Under normal circumstances, the Russell Midcap® Growth Index is reconstituted annually every June. The fund intends to invest primarily in companies whose market capitalizations fall within the normal range of each index at the time of investment. The fund invests primarily in common stocks but may invest in other types of equity securities such as preferred stocks or convertible securities. While the fund invests mainly in US
Prospectus May 1, 2026
98
Fund Details
stocks, it could invest up to 20% of net assets in foreign securities, including emerging markets securities. The fund may invest in initial public offerings.
Due to regulatory changes, effective June 11, 2026, the fund will replace the 80% investment policy and related disclosures set forth in this prospectus. Specifically, effective June 11, 2026, under normal circumstances, the fund invests at least 80% of net assets, plus the amount of any borrowings for investment purposes, in common stocks and other equity securities of small and mid-sized US growth companies. For purposes of the 80% investment policy, “growth companies” and “small and mid-sized companies” are those companies included in the Russell 2500™ Growth Index. While the market capitalization range of the Russell 2500™ Growth Index changes throughout the year, as of February 28, 2026, the market capitalization range of the Russell 2500™ Growth Index was between $8.79 million and $50.28 billion. Derivative instruments that provide exposure to the investments above or exposure to one or more market risk factors associated with such investments are included in the fund’s 80% investment policy, consistent with the fund’s investment policies and limitations with respect to investments in derivatives.
Management process. In choosing stocks, portfolio management focuses on individual security selection rather than industry selection. Portfolio management uses an active process that combines financial analysis with company visits to evaluate management and strategies.
Company research is significant to the investment process. Portfolio management uses a “bottom-up” approach to picking securities, focusing on stocks that it believes have superior growth prospects and above average intermediate to long-term performance potential.
Portfolio management emphasizes individual selection of small and mid-sized company stocks across all economic sectors, early in their growth cycles and which portfolio management believes to have the potential to be the blue chips of the future. Portfolio management generally seeks companies it believes have a leading or dominant position in their niche markets, a high rate of return on invested capital and the ability to finance a major part of future growth from internal sources. Portfolio management also looks for estimated above-average growth in revenues and earnings and a balance sheet that portfolio management believes can support this growth potential with sufficient working capital and manageable levels of debt.
Portfolio management follows a disciplined selling process that seeks to lessen risk. Portfolio management will normally sell a stock when its price reaches portfolio management's expectations, portfolio management believes there is a material change in the company's fundamentals, other investments offer better opportunities or in an effort to readjust the weighted average market capitalization of the fund.
Portfolio management generally considers environmental, social and governance (ESG) factors that it believes to be financially material. Given the nature of small cap companies’ more limited resources, portfolio management typically considers an issuer’s corporate governance, including governance structure and practices, management incentives, and alignment with shareholders’ interests in corporate decision making, to be of particular importance in evaluating the long-term prospects of such issuer, but may consider any other ESG factors that could also present risks or opportunities. Because small cap companies tend to be relatively early on in their operating histories, external rating companies may be unable to find ESG data for such companies.
Securities lending. The fund may lend securities (up to one-third of total assets) to approved institutions, such as registered broker-dealers, pooled investment vehicles, banks and other financial institutions. In connection with such loans, the fund receives liquid collateral in an amount that is based on the type and value of the securities being lent, with riskier securities generally requiring higher levels of collateral.
Other Investment Strategies
Derivatives. The fund may invest in derivatives, which are financial instruments whose performance is derived, at least in part, from the performance of an underlying asset, security or index. The fund may use various types of derivatives (i) for hedging purposes; (ii) for risk management; (iii) for non-hedging purposes to seek to enhance potential gains; or (iv) as a substitute for direct investment in a particular asset class or to keep cash on hand to meet shareholder redemptions.
Main Risks
There are several risk factors that could hurt the fund’s performance, cause you to lose money or cause the fund’s performance to trail that of other investments. The fund may not achieve its investment objective, and is not intended to be a complete investment program. An investment in the fund is not a deposit of a bank and is not insured or guaranteed by the Federal Deposit Insurance Corporation or any other governmental agency.
Security selection risk. The securities in the fund’s portfolio may decline in value. Portfolio management could be wrong in its analysis of industries, companies, economic trends, ESG factors, the relative attractiveness of different securities or other matters.
Stock market risk. When stock prices fall, you should expect the value of your investment to fall as well. Stock prices can be hurt by poor management on the part of the stock’s issuer, shrinking product demand and other business risks, such as rapid technological developments or widespread adoption of emerging technologies (such as artificial intelligence) impacting the issuer’s competitive
Prospectus May 1, 2026
99
Fund Details
position, cybersecurity incidents, financial leverage and labor and supply shortages. These may affect single companies as well as groups of companies. The market as a whole may not favor the types of investments the fund makes, which could adversely affect a stock’s price, regardless of how well the company performs, or the fund’s ability to sell a stock at an attractive price. There is a chance that stock prices overall will decline because stock markets tend to move in cycles, with periods of rising and falling prices. Events in the US and global financial markets, including actions taken by the US Federal Reserve or foreign central banks to stimulate or stabilize economic growth, may at times result in unusually high market volatility which could negatively affect performance. High market volatility may also result from significant shifts in momentum of one or more specific stocks due to unusual increases or decreases in trading activity. Momentum can change quickly, and securities subject to shifts in momentum may be more volatile than the market as a whole and returns on such securities may drop precipitously. To the extent that the fund invests in a particular geographic region, capitalization or sector, the fund’s performance may be affected by the general performance of that region, capitalization or sector.
Market disruption risk. Economies and financial markets throughout the world have become increasingly interconnected, which has increased the likelihood that events or conditions in one country or region will adversely impact markets or issuers in other countries or regions. This includes reliance on global supply chains that are susceptible to disruptions resulting from, among other things, war and other armed conflicts, tariffs, extreme weather events, and natural disasters. Such supply chain disruptions can lead to, and have led to, economic and market disruptions that have far-reaching effects on financial markets worldwide. The value of the fund’s investments may be negatively affected by adverse changes in overall economic or market conditions, such as the level of economic activity and productivity, unemployment and labor force participation rates, inflation or deflation (and expectations for inflation or deflation), interest rates, demand and supply for particular products or resources including labor, debt levels and credit ratings, and trade policies, among other factors. Such adverse conditions may contribute to an overall economic contraction across entire economies or markets, which may negatively impact the profitability of issuers operating in those economies or markets. In addition, geopolitical and other globally interconnected occurrences, including war and other armed conflicts, terrorism, economic uncertainty or financial crises, contagion, tariffs and trade disputes, government debt crises (including defaults or downgrades) or uncertainty about government debt payments, government shutdowns, public health crises, natural disasters, supply chain disruptions, climate change and related events or conditions, have led, and in the future may lead, to disruptions in the US and world economies and markets, which
may increase financial market volatility and have significant adverse direct or indirect effects on the fund and its investments. Ongoing trade disputes between the United States and other countries may lead to tariffs and investment restrictions, negatively impacting affected companies and their securities. These disputes can also harm the economies of the United States and its trading partners, as well as financial markets overall. Adverse market conditions or disruptions could cause the fund to lose money, experience significant redemptions, and encounter operational difficulties. Although multiple asset classes may be affected by adverse market conditions or a particular market disruption, the duration and effects may not be the same for all types of assets.
Current military and other armed conflicts in various geographic regions, including those in Europe and the Middle East, among others, can lead to, and have led to, economic and market disruptions, which may not be limited to the geographic region in which the conflict is occurring. Such conflicts can also result, and have resulted in some cases, in sanctions being levied by the United States, the European Union and/or other countries against countries or other actors involved in the conflict. In addition, such conflicts and related sanctions can adversely affect regional and global energy, commodities, financial and other markets and thus could affect the value of the fund's investments. The extent and duration of any military or other armed conflict, related sanctions and resulting economic and market disruptions are impossible to predict, but could be substantial.
Other market disruption events include pandemic spread of viruses, such as the novel coronavirus known as COVID-19, which have caused significant uncertainty, market volatility, decreased economic and other activity, increased government activity, including economic stimulus measures, and supply chain disruptions, and may adversely affect the fund and its investments.
In addition, markets are becoming increasingly susceptible to disruption events resulting from the use of new and emerging technologies, such as artificial intelligence, to engage in cyber-attacks or to take over the Web sites and/or social media accounts of companies, governmental entities or public officials, or to otherwise pose as or impersonate such, which then may be used to disseminate false or misleading information that can cause volatility in financial markets or for the securities of a particular company, group of companies, industry or other class of assets.
Adverse market conditions or particular market disruptions, such as those discussed above, may magnify the impact of each of the other risks described in this “MAIN RISKS” section and may increase volatility in one or more markets in which the fund invests leading to the potential for greater losses for the fund.
Small company risk. Small company stocks tend to be more volatile than medium-sized or large company stocks. Because stock analysts are less likely to follow small
Prospectus May 1, 2026
100
Fund Details
companies, less information about them is available to investors. Industry-wide reversals may have a greater impact on small companies, since they may lack the financial resources of larger companies. Small company stocks are typically less liquid than large company stocks.
Medium-sized company risk. Medium-sized company stocks tend to be more volatile than large company stocks. Because stock analysts are less likely to follow medium-sized companies, less information about them is available to investors. Industry-wide reversals may have a greater impact on medium-sized companies, since they may lack the financial resources of larger companies. Medium-sized company stocks are typically less liquid than large company stocks.
Growth investing risk. As a category, growth stocks may underperform value stocks (and the stock market as a whole) over any period of time and may shift in and out of favor with investors generally, sometimes rapidly, depending on changes in market, economic and other factors that could impact expectations of future earnings. Because the prices of growth stocks are based largely on the expectation of future earnings, growth stock prices can decline rapidly and significantly in reaction to negative news about such factors as earnings, the economy, political developments, or other news.
A growth company may fail to fulfill apparent promise or may be eclipsed by competitors or its products or its services may be rendered obsolete by new technologies. Growth stocks also typically lack the dividends associated with value stocks that might otherwise cushion investors from the effects of declining stock prices. In addition, growth stocks selected for investment by portfolio management may not perform as anticipated.
Focus risk. To the extent that the fund focuses its investments in particular industries, asset classes or sectors of the economy, any market price movements, regulatory or technological changes, or economic conditions affecting companies in those industries, asset classes or sectors may have a significant impact on the fund’s performance. The fund may become more focused in particular industries, asset classes or sectors of the economy as a result of changes in the valuation of the fund’s investments or fluctuations in the fund’s assets, and the fund is not required to reduce such exposures under these circumstances.
Foreign investment risk. The fund faces the risks inherent in foreign investing. Adverse political, economic or social developments, as well as US and foreign government actions such as the imposition of tariffs, economic and trade sanctions or embargoes, could undermine the value of the fund’s foreign investments, prevent the fund from realizing the full value of its foreign investments or prevent the fund from selling foreign securities it holds.
Financial reporting standards for companies based in foreign markets differ from those in the US. Additionally, foreign securities markets generally are smaller and less liquid than US markets. To the extent that the fund invests in non-US dollar denominated foreign securities, changes in currency exchange rates may affect the US dollar value of foreign securities or the income or gain received on these securities. In addition, because non-US markets may be open on days when the fund does not price its shares, the value of the foreign securities in the fund’s portfolio may change on days when shareholders will not be able to purchase or sell the fund’s shares.
Foreign governments may restrict investment by foreigners, limit withdrawal of trading profit or currency from the country, restrict currency exchange or seize foreign investments. The foreign investments of the fund may also be subject to foreign withholding or other taxes. Foreign brokerage commissions and other fees are generally higher than those for US investments, and the transactions and custody of foreign assets may involve delays in payment, delivery or recovery of money or investments.
Foreign markets can have liquidity risks beyond those typical of US markets. Because foreign exchanges generally are smaller and less liquid than US exchanges, buying and selling foreign investments can be more difficult and costly. Relatively small transactions can sometimes materially affect the price and availability of foreign securities. In certain situations, it may become virtually impossible to sell a foreign investment in an orderly fashion at a price that approaches portfolio management's estimate of its value. For the same reason, it may at times be difficult to value the fund’s foreign investments.
Emerging markets risk. Foreign investment risks are greater in emerging markets than in developed markets. Investments in emerging markets are often considered speculative.
Emerging markets countries typically have economic and political systems that are less developed, and can be expected to be less stable than developed markets. For example, the economies of such countries can be subject to rapid and unpredictable rates of inflation or deflation.
Applicable regulatory, accounting, auditing and financial reporting and recordkeeping standards may be less rigorous in emerging markets countries and there may be significant differences between financial statements prepared in accordance with emerging markets countries’ accounting standards and practices and those prepared in accordance with international accounting standards. In particular, the assets and profits appearing on the financial statements of an emerging market country’s issuer may not reflect its financial position or results of operations in the way they would be reflected had such financial statements been prepared in accordance with US Generally Accepted Accounting Principles. The quality of audits in
Prospectus May 1, 2026
101
Fund Details
emerging markets countries may be unreliable. Consequently, the fund may not be provided the same degree of protection or information as would generally apply in developed countries and the fund may be exposed to significant losses.
There is also substantially less publicly available information about emerging market issuers than there is about issuers in developed countries. Therefore, disclosure of certain material information may not be made, and less information may be available to the fund and other investors than would be the case if the fund’s investments were restricted to securities of issuers in developed countries.
Convertible securities risk. The market value of a convertible security performs like that of a regular debt security; that is, when interest rates rise, the price of a convertible security generally declines. In addition, convertible securities are subject to the risk that the issuer will not be able to pay interest or dividends when due, and their price may change based on changes in the issuer’s financial condition. Because a convertible security derives a portion of its value from the common stock into which it may be converted, market and issuer risks that apply to the underlying common stock could impact the price of the convertible security. Certain types of convertible securities may decline in value or lose their value entirely in the event the issuer's financial condition becomes significantly impaired.
Preferred stock risk. Preferred stock generally has a preference as to dividends and liquidation over an issuer’s common stock but ranks junior to debt securities in an issuer’s capital structure. Preferred stock is subject to many of the risks associated with debt securities, including interest rate risk. In addition, preferred stock may not pay a dividend, an issuer may suspend payment of dividends on preferred stock at any time, and in certain situations an issuer may call or redeem its preferred stock or convert it to common stock.
Securities lending risk. Securities lending involves the risk that the fund may lose money because the borrower of the loaned securities fails to return the securities in a timely manner or at all. A delay in the recovery of loaned securities could interfere with the fund’s ability to vote proxies or settle transactions. Delayed settlement may limit the ability of the fund to reinvest the proceeds of a sale of securities or prevent the fund from selling securities at times and prices it considers desirable. The fund could also lose money in the event of a decline in the value of the collateral provided for the loaned securities, or a decline in the value of any investments made with cash collateral or even a loss of rights in the collateral should the borrower of the securities fail financially while holding the securities.
Derivatives risk. Derivatives involve risks different from, and possibly greater than, the risks associated with investing directly in securities and other more traditional investments. Risks associated with derivatives may
include the risk that the derivative is not well correlated with the underlying asset, security or index to which it relates; the risk that derivatives may result in losses or missed opportunities; the risk that the fund will be unable to sell the derivative because of an illiquid secondary market; the risk that a counterparty is unwilling or unable to meet its obligation, which risk may be heightened in derivative transactions entered into “over-the-counter” (i.e., not on an exchange or contract market); and the risk that the derivative transaction could expose the fund to the effects of leverage, which could increase the fund's exposure to the market and magnify potential losses.
There is no guarantee that derivatives, to the extent employed, will have the intended effect, and their use could cause lower returns or even losses to the fund. The use of derivatives by the fund to hedge risk may reduce the opportunity for gain by offsetting the positive effect of favorable price movements.
Counterparty risk. A financial institution or other counterparty with whom the fund does business, or that underwrites, distributes or guarantees any investments or contracts that the fund owns or is otherwise exposed to, may decline in financial health and become unable to honor its commitments. This could cause losses for the fund or could delay the return or delivery of collateral or other assets to the fund.
IPO risk. Prices of securities bought in an initial public offering (IPO) may rise and fall rapidly, often because of investor perceptions rather than economic reasons. To the extent a mutual fund is small in size, its IPO investments may have a significant impact on its performance since they may represent a larger proportion of the fund’s overall portfolio as compared to the portfolio of a larger fund.
Liquidity risk. In certain situations, it may be difficult or impossible to sell an investment and/or the fund may sell certain investments at a price or time that is not advantageous in order to meet redemption requests or other cash needs. Unusual market conditions, such as an unusually high volume of redemptions or other similar conditions could increase liquidity risk for the fund.
This risk can be ongoing for any security that does not trade actively or in large volumes, for any security that trades primarily on smaller markets, and for investments that typically trade only among a limited number of large investors (such as certain types of derivatives or restricted securities). In unusual market conditions, even normally liquid securities may be affected by a degree of liquidity risk (i.e., if the number and capacity of traditional market participants is reduced). This may affect only certain securities or an overall securities market.
Pricing risk. If market conditions make it difficult to value some investments, the fund may value these investments using more subjective methods and the value determined for an investment may be materially different from the value realized upon such investment’s sale. As a result, you
Prospectus May 1, 2026
102
Fund Details
could pay more than the market value when buying fund shares or receive less than the market value when selling fund shares.
Secondary markets may be subject to irregular trading activity, wide bid/ask spreads and extended trade settlement periods, which may prevent the fund from being able to realize full value and thus sell a security for its full valuation. This could cause a material decline in the fund’s net asset value.
Operational and technology risk. The fund and the entities with which it interacts directly or indirectly, including the fund’s service providers and counterparties, issuers of securities held by the fund and other market participants, are susceptible to operational and technology risks, including those related to human errors, processing errors, communication errors, system failures, cybersecurity incidents, and the use of artificial intelligence, among others, which may impair the fund’s operations and/or result in losses for the fund. For example, the fund’s or its service providers’ assets or sensitive or confidential information may be misappropriated, data may be corrupted and operations may be disrupted (e.g., cyber-attacks, operational failures or broader disruptions may cause the release of private shareholder information or confidential fund information, interfere with the processing of shareholder transactions, impact the ability to calculate the fund’s net asset value and impede trading). Market events and disruptions also may trigger a volume of transactions that overloads current information technology and communication systems and processes, impacting the ability to conduct the fund’s operations.
While the fund and its service providers may establish business continuity and other plans and processes that seek to address the possibility of and fallout from cyber-attacks, disruptions or failures, there are inherent limitations in such plans and systems, including that they do not apply to third parties, such as fund counterparties, issuers of securities held by the fund or other market participants, as well as the possibility that certain risks have not been identified or that unknown threats may emerge in the future and there is no assurance that such plans and processes will be effective. Among other situations, disruptions (for example, pandemics or health crises) that cause prolonged periods of remote work or significant employee absences at the fund’s service providers could impact the ability to conduct the fund’s operations. In addition, the fund cannot directly control any cybersecurity plans and systems, including artificial intelligence, put in place by its service providers, fund counterparties, issuers of securities held by the fund or other market participants.
Cyber-attacks may include unauthorized attempts by third parties to improperly access, modify, disrupt the operations of, or prevent access to the systems of the fund’s service providers or counterparties, issuers of securities held by the fund or other market participants or data within
them. In addition, power or communications outages, acts of god, information technology equipment malfunctions, operational errors, and inaccuracies within software or data processing systems may also disrupt business operations or impact critical data.
Cyber-attacks, disruptions, or failures may adversely affect the fund and its shareholders or cause reputational damage and subject the fund to regulatory fines, litigation costs, penalties or financial losses, reimbursement or other compensation costs, and/or additional compliance costs. In addition, cyber-attacks, disruptions, or failures involving a fund counterparty could affect such counterparty’s ability to meet its obligations to the fund, which may result in losses to the fund and its shareholders. Similar types of operational and technology risks are also present for issuers of securities held by the fund, which could have material adverse consequences for such issuers, and may cause the fund’s investments to lose value. Furthermore, as a result of cyber-attacks, disruptions, or failures, an exchange or market may close or issue trading halts on specific securities or the entire market, which may result in the fund being, among other things, unable to buy or sell certain securities or financial instruments or unable to accurately price its investments.
For example, the fund relies on various sources to calculate its NAV. Therefore, the fund is subject to certain operational risks associated with reliance on third party service providers and data sources. NAV calculation may be impacted by operational risks arising from factors such as failures in systems and technology. Such failures may result in delays in the calculation of the fund’s NAV and/or the inability to calculate NAV over extended time periods. The fund may be unable to recover any losses associated with such failures.
In addition, the development and use of artificial intelligence technologies are expanding rapidly and may be employed by service providers that support the operations of the fund as well as by issuers of securities held by the fund. Artificial intelligence technologies rely on complex algorithms and large data sets, which may produce incomplete, inaccurate, or biased outcomes and lead to errors in decision making, reputational damage, legal or operational challenges, and investment losses negatively affecting the fund. Artificial intelligence technologies and their current and potential future applications, and the regulatory frameworks within which they operate, continue to evolve rapidly, and it is impossible to anticipate the full scope of future impacts such developments may have and the associated risks to the fund.
Other Policies and Risks
While the previous pages describe the main points of each fund’s strategy and risks, there are a few other matters to know about:
Prospectus May 1, 2026
103
Fund Details
■
Although major changes tend to be infrequent, each fund’s Board could change a fund's investment objective without seeking shareholder approval. However, the Board of DWS Alternative Asset Allocation VIP, DWS CROCI® U.S. VIP, DWS Government Money Market VIP, DWS High Income VIP, DWS Small Mid Cap Growth VIP and DWS Small Mid Cap Value VIP will provide shareholders with at least 60 days notice prior to making any changes to the fund's 80% investment policy, as described herein. Any major changes to a fund could result in significant portfolio turnover and/or significant redemptions from the fund which could raise transaction costs.
■
The following is applicable to all funds except DWS Government Money Market VIP. When, in the Advisor's opinion, it is advisable to adopt a temporary defensive position because of unusual and adverse or other market conditions, up to 100% of each fund's assets may be held in cash or invested in money market securities or other short-term investments. Short-term investments consist of (1) foreign and domestic obligations of sovereign governments and their agencies and instrumentalities, authorities and political subdivisions; (2) other short-term rated debt securities or, if unrated, determined to be of comparable quality in the opinion of the Advisor; (3) commercial paper; (4) bank obligations, including negotiable certificates of deposit, time deposits and bankers' acceptances; and (5) repurchase agreements. Short-term investments may also include shares of money market mutual funds. To the extent a fund invests in such instruments, the fund will not be pursuing its investment objective. However, portfolio management may choose to not use these strategies for various reasons, even in volatile market conditions.
■
Portfolio management measures credit quality at the time it buys securities, using independent rating agencies or, for unrated securities, its own judgment. All securities must meet the credit quality standards applied by portfolio management at the time they are purchased. If a security’s credit quality changes, portfolio management will decide what to do with the security, based on its assessment of what would most benefit a fund.
■
The following is applicable to DWS Government Money Market VIP only. While the fund does not intend to impose a liquidity fee in connection with the implementation of federal regulations relating to money market funds, the fund may elect to do so in the future.
■
The following is applicable to DWS Global Income Builder VIP only. Prices of securities bought in an initial public offering (IPO) may rise and fall rapidly, often because of investor perceptions rather than economic reasons. To the extent a mutual fund is small in size, its IPO investments may have a significant impact on its performance since they may represent a larger proportion of the fund’s overall portfolio as compared to the portfolio of a larger fund.
■
The following is applicable to DWS Global Income Builder VIP only. If the fund sells a security short and subsequently has to buy the security back at a higher price, the fund will lose money on the transaction. Any loss will be increased by the amount of compensation, interest or dividends and transaction costs the fund must pay to a lender of the security. The amount the fund could lose on a short sale is theoretically unlimited (as compared to a long position, where the maximum loss is the amount invested). The use of short sales, which has the effect of leveraging the fund, could increase the exposure of the fund to the market, increase losses and increase the volatility of returns. The fund may not always be able to close out a short position at a particular time or at an acceptable price. A lender may request that borrowed securities be returned to it on short notice, and the fund may have to buy the borrowed securities at an unfavorable price. If this occurs at a time that other short sellers of the same security also want to close out their positions, it is more likely that the fund will have to cover its short sale at an unfavorable price and potentially reduce or eliminate any gain, or cause a loss, as a result of the short sale.
■
From time to time, a fund may have a concentration of shareholder accounts holding a significant percentage of shares outstanding. Investment activities of these shareholders could have a material impact on a fund.
■
Your fund assets may be at risk of being transferred to the appropriate state if you fail to maintain a valid address and/or if certain activity does not occur in your account within the time specified by state abandoned property law. Contact your insurance company for additional information.
■
Shareholders of a fund (which may include affiliated and/or non-affiliated registered investment companies that invest in a fund) may make relatively large redemptions or purchases of fund shares. These transactions may cause a fund to have to sell securities or invest additional cash, as the case may be. While it is impossible to predict the overall impact of these transactions over time, there could be adverse effects on a fund’s performance to the extent that a fund may be required to sell securities or invest cash at times when it would not otherwise do so. These transactions could adversely impact a fund’s liquidity and increase transaction costs, which may adversely affect a fund’s performance. These transactions could also adversely impact a fund’s ability to implement its investment strategies and pursue its investment objective, and, as a result, a larger portion of a fund’s assets may be held in cash or cash equivalents. In addition, large redemptions could significantly reduce a fund’s assets, which may result in an increase in a fund’s expense ratio on account of expenses being spread over a smaller asset base and/or the loss of fee breakpoints.
Prospectus May 1, 2026
104
Fund Details
Potential negative interest rates
The following is applicable to DWS Government Money Market VIP only. In the event that the fund has a negative gross yield as a result of negative interest rates (a “negative interest rate event”), it may be challenging or impossible to maintain a stable net asset value (NAV) of $1.00 per share. However, regulations that govern the operation of money market funds permit the fund, if experiencing a negative interest rate event, to seek to continue to provide a stable NAV of $1.00 per share by using a Reverse Distribution Mechanism (RDM) which reduces the number of shares in proportion to the fund’s negative income. Shares may continue to have a NAV of $1.00 per share, but each shareholder would have fewer shares. The fund will use an RDM to cancel shares held by shareholders only if the fund’s Board determines that using an RDM is in the best interests of the fund and its shareholders.
If the fund chooses to use an RDM to cancel fund shares, the fund’s per-share NAV may remain stable, but shareholders will lose money as a result of the fund’s negative gross yield. In the event that shares are canceled, tax treatment of distributions and shareholder basis is uncertain. You should consult with your tax advisor to determine whether you will experience any negative tax consequences as a result of the fund’s use of an RDM. Account statements will include disclosure regarding share cancellations if an RDM is used.
For More Information
All funds except DWS Government Money Market VIP
This prospectus doesn’t tell you about every policy or risk of investing in each fund. If you want more information on each fund’s allowable securities and investment practices and the characteristics and risks of each one, you may want to request a copy of the Statement of Additional Information (the back cover tells you how to do this).
Keep in mind that there is no assurance that a fund will achieve its investment objective.
A complete list of each fund’s portfolio holdings as of the month-end is posted on dws.com on or after the last day of the following month. More frequent posting of portfolio holdings information may be made from time to time on dws.com. The posted portfolio holdings information is available by fund and generally remains accessible at least until the date on which a fund files its Form N-CSR or publicly available Form N-PORT with the SEC for the period that includes the date as of which the posted information is current. In addition, each fund’s (except DWS High Income VIP) top ten equity holdings and other fund information is posted on dws.com as of the calendar quarter-end on or after the 10th calendar day following quarter-end. Each fund’s Statement of Additional Information includes a description of a fund’s policies and procedures with respect to the disclosure of a fund’s portfolio holdings.
DWS Government Money Market VIP
This prospectus doesn’t tell you about every policy or risk of investing in each fund. If you want more information on each fund’s allowable securities and investment practices and the characteristics and risks of each one, you may want to request a copy of the Statement of Additional Information.
Keep in mind that there is no assurance that a fund will achieve its objective.
A schedule of each fund’s portfolio holdings, including information required by applicable regulations, is posted once each month on dws.com (the Web site does not form a part of this prospectus). Portfolio holdings as of each month-end are posted to the Web site within five business days of the date of the applicable portfolio holdings information. More frequent posting of portfolio holdings information may be made from time to time on dws.com. The posted portfolio holdings information is available by fund and generally remains accessible for a period of not less than six months. Each fund also may post on the Web site, on the same or a more frequent basis, various depictions of portfolio characteristics such as the allocation of the portfolio across various security types, market sectors and sub-sectors and maturities, liquidity and risk characteristics of the portfolio. Each fund’s Statement of Additional Information includes a description of a fund’s policies and procedures with respect to the disclosure of a fund’s portfolio holdings.
Who Manages and Oversees the Funds
The Investment Advisor
DWS Investment Management Americas, Inc. (“DIMA” or the “Advisor”), with headquarters at 875 Third Avenue, New York, NY 10022, is the investment advisor for each fund. Under the oversight of the Board, the Advisor, or a subadvisor, makes investment decisions, buys and sells securities for each fund and conducts research that leads to these purchase and sale decisions. The Advisor is an indirect, wholly-owned subsidiary of DWS Group GmbH & Co. KGaA (“DWS Group”), a separate, publicly-listed financial services firm that is an indirect, majority-owned subsidiary of Deutsche Bank AG. The Advisor and its predecessors have more than 95 years of experience managing mutual funds and provide a full range of global investment advisory services to institutional and retail clients.
DWS represents the asset management activities conducted by DWS Group or any of its subsidiaries, including DIMA, other affiliated investment advisors and DWS Distributors, Inc. (“DDI” or the “Distributor”). DWS is a global organization that offers a wide range of investing expertise and resources, including hundreds of portfolio managers and analysts and an office network that reaches the world’s major investment centers. This well-resourced
Prospectus May 1, 2026
105
Fund Details
global investment platform brings together a wide variety of experience and investment insight across industries, regions, asset classes and investing styles.
The Advisor may utilize the resources of its global investment platform to provide investment management services through branch offices or affiliates located outside the US. In some cases, the Advisor may also utilize its branch offices or affiliates located in the US or outside the US to perform certain services, such as trade execution, trade matching and settlement, or various administrative, back-office or other services. To the extent services are performed outside the US, such activity may be subject to both US and foreign regulation. It is possible that the jurisdiction in which the Advisor or its affiliate performs such services may impose restrictions or limitations on portfolio transactions that are different from, and in addition to, those that apply in the US.
With respect to DWS Alternative Asset Allocation VIP, the Advisor or its affiliates earn fees at varying rates for providing services to the underlying DWS funds or Xtrackers ETFs. It may therefore have a conflict of interest in selecting the underlying DWS funds or Xtrackers ETFs and in determining whether to invest in an unaffiliated mutual fund, ETF or a hedge fund, from which it and its affiliates will not receive any fees. However, the Advisor is a fiduciary to the fund and will select investments that it believes are appropriate to meet the fund's investment objective.
Management Fee. The Advisor receives a management fee from each fund. Below are the management rates paid by each fund for the most recent fiscal year, as a percentage of each fund’s average daily net assets:
|
Fund Name |
Fee Paid |
|
DWS Alternative Asset Alloca-
tion VIP |
0.100
%* |
|
DWS Global Income Builder
VIP |
0.370
% |
|
DWS Small Mid Cap Value VIP |
0.603
%** |
|
DWS International Opportuni-
ties VIP |
0.173
%** |
|
DWS High Income VIP |
0.296
%** |
|
DWS CROCI® U.S. VIP |
0.512
%** |
|
DWS Government Money
Market VIP |
0.235
% |
|
DWS Small Mid Cap Growth
VIP |
0.550
% |
*
Management fee has two components: (i) a fee on assets invested in exchange-traded funds and mutual funds; and (ii) a fee on assets not covered in (i) above (“Other Assets”). The Advisor currently intends to invest primarily in exchange-traded funds and mutual funds. However, in the future, the fund may invest a larger portion, or all, of its assets in Other Assets. If the fund’s assets are entirely invested in Other Assets, the management fee would be 1.00% of average daily net assets. However, in such a situation, the Acquired Fund (Underlying Fund) Fees and Expenses are expected to decrease.
**
Reflects the effect of expense limitations and/or fee waivers then in effect.
The following waivers are currently in effect:
For DWS Alternative Asset Allocation VIP, the Advisor has contractually agreed to waive its fees and/or reimburse fund expenses through September 30, 2026 to the extent necessary to maintain the fund’s total annual operating expenses (excluding certain expenses such as extraordinary expenses, taxes, brokerage and interest expenses) at 1.06% for Class A shares. The agreement may only be terminated with the consent of the fund’s Board. Because acquired fund fees and expenses are presented as of the fund’s most recent fiscal year end, individual shareholders may experience total operating expenses higher or lower than this expense cap depending upon when shares are redeemed and the fund’s actual allocations to acquired funds.
For DWS Global Income Builder VIP, the Advisor has contractually agreed through September 30, 2026 to waive its fees and/or reimburse certain operating expenses to the extent necessary to maintain the fund’s total annual operating expenses (excluding certain expenses such as extraordinary expenses, taxes, brokerage and interest expenses and acquired funds fees and expenses) at 0.67% for Class A shares. The agreement may only be terminated with the consent of the fund’s Board.
DWS Global Income Builder VIP may invest in other mutual funds advised by the Advisor and its affiliates (“affiliated mutual funds”). In the case of an investment in DWS
Prospectus May 1, 2026
106
Fund Details
Emerging Markets Fixed Income Fund or DWS High Income Fund, the Advisor has agreed to apply a management fee credit to the fund equal to the management fee of DWS Emerging Markets Fixed Income Fund or DWS High Income Fund, as applied to the amount of assets invested by the fund in DWS Emerging Markets Fixed Income Fund or DWS High Income Fund.
For DWS Small Mid Cap Value VIP, the Advisor has contractually agreed through April 30, 2027 to waive its fees and/or reimburse certain operating expenses to the extent necessary to maintain the fund’s total annual operating expenses (excluding certain expenses such as extraordinary expenses, taxes, brokerage and interest expenses and acquired funds fees and expenses) at a ratio no higher than 0.80% for Class A shares. The agreement may only be terminated with the consent of the fund’s Board.
For DWS International Opportunities VIP, the Advisor has contractually agreed through April 30, 2027 to waive its fees and/or reimburse fund expenses to the extent necessary to maintain the fund’s total annual operating expenses (excluding certain expenses such as extraordinary expenses. taxes, brokerage and interest expenses and acquired funds fees and expenses) at a ratio no higher than 0.86% for Class A shares. The agreement may only be terminated with the consent of the fund’s Board.
For DWS High Income VIP, the Advisor has contractually agreed through April 30, 2027 to waive its fees and/or reimburse certain operating expenses of the fund to the extent necessary to maintain the fund’s total annual operating expenses (excluding certain expenses such as extraordinary expenses, taxes, brokerage and interest expenses and acquired funds fees and expenses) at a ratio no higher than 0.71% for Class A shares. The agreement may only be terminated with the consent of the fund’s Board.
For DWS CROCI® U.S. VIP, the Advisor has contractually agreed through April 30, 2027 to waive its fees and/or reimburse certain operating expenses of the fund to the extent necessary to maintain the fund’s total annual operating expenses (excluding certain expenses such as extraordinary expenses, taxes, brokerage and interest expenses and acquired funds fees and expenses) at a ratio no higher than 0.71% for Class A shares. The agreement may only be terminated with the consent of the fund’s Board.
For DWS Government Money Market VIP, the Advisor has contractually agreed through September 30, 2026 to waive its fees and/or reimburse certain operating expenses to the extent necessary to maintain the fund’s total annual operating expenses (excluding certain expenses such as extraordinary expenses, taxes, brokerage and interest expenses) at 0.51% for Class A shares. The agreement may only be terminated with the consent of the fund’s Board.
The Advisor may, from time to time, voluntarily waive a portion of its fees and/or reimburse certain operating expenses of the fund. These voluntary waivers and/or reimbursements may be terminated at any time at the option of the Advisor.
The Advisor and its affiliates may voluntarily waive a portion of their fees and/or reimburse certain expenses to the extent necessary to assist the fund in attempting to avoid a negative yield. There is no guarantee that the fund will avoid a negative yield. These voluntary waivers and/or reimbursements may be amended or terminated at any time at the option of the Advisor. These voluntary waivers and/or reimbursements are in addition to any existing contractual expense limitations.
For DWS Small Mid Cap Growth VIP, the Advisor has contractually agreed through September 30, 2026 to waive its fees and/or reimburse certain operating expenses to the extent necessary to maintain the fund’s total annual operating expenses (excluding certain expenses such as extraordinary expenses, taxes, brokerage and interest expenses and acquired funds fees and expenses) at 0.85% for Class A shares. The agreement may only be terminated with the consent of the fund’s Board.
A discussion regarding the basis for the Board's approval of each fund’s investment management agreement and, as applicable, subadvisory agreement, is contained in the most recent financial statements and other information report for the annual period ended December 31 and the semi-annual period ended June 30 (see the back cover).
Under a separate administrative services agreement between each fund and the Advisor, each fund pays the Advisor a fee of 0.097% of the fund’s average daily net assets for providing most of each fund's administrative services. The administrative services fee discussed above is included in the fees and expenses table under “Other expenses.”
Subadvisor for DWS Alternative Asset Allocation VIP
RREEF America L.L.C. (RREEF), an investment advisor registered with the SEC, is located at 222 South Riverside Plaza, Chicago, Illinois 60606. RREEF is an indirect wholly owned subsidiary of DWS Group. RREEF has provided real estate investment management services to institutional investors since 1975 across a diversified portfolio of industrial properties, office buildings, residential apartments and shopping centers. RREEF has also been an investment advisor of real estate securities since 1993.
To the extent that the fund invests directly in securities, RREEF provides investment advisory and management services to the portions of DWS Alternative Asset Allocation VIP's portfolio allocated to global real estate and global infrastructure securities. RREEF makes investment decisions, buys and sells securities for the fund and conducts research that leads to purchase and sale decisions. The Advisor pays a fee to RREEF pursuant to an investment subadvisory agreement between the Advisor and RREEF.
Prospectus May 1, 2026
107
Fund Details
Multi-Manager Structure. The Advisor, subject to the approval of the Board, has ultimate responsibility to oversee any subadvisor to a fund and to recommend the hiring, termination and replacement of subadvisors. Each fund and the Advisor have received an order from the SEC that permits the Advisor to appoint or replace certain subadvisors, to manage all or a portion of a fund’s assets and enter into, amend or terminate a subadvisory agreement with certain subadvisors, in each case subject to the approval of a fund’s Board but without obtaining shareholder approval (“multi-manager structure”). The multi-manager structure applies to subadvisors that are not affiliated with the fund or the Advisor (“nonaffiliated subadvisors”), as well as subadvisors that are indirect or direct, wholly-owned subsidiaries of the Advisor or that are indirect or direct, wholly-owned subsidiaries of the same company that, indirectly or directly, wholly owns the Advisor (“wholly-owned subadvisors”). Pursuant to the SEC order, the Advisor, with the approval of a fund’s Board, has the discretion to terminate any subadvisor and allocate and reallocate a fund’s assets among any other nonaffiliated subadvisors or wholly-owned subadvisors (including terminating a nonaffiliated subadvisor and replacing it with a wholly-owned subadvisor). Each fund and the Advisor are subject to the conditions imposed by the SEC order, including the condition that within 90 days of hiring a new subadvisor pursuant to the multi-manager structure, each fund will provide shareholders with an information statement containing information about the new subadvisor. The shareholders of each fund have approved the multi-manager structure described herein.
Management
DWS Alternative Asset Allocation VIP
The following Portfolio Manager is primarily responsible for the day-to-day management of the fund.
Darwei Kung, Managing Director and Head of Investment Strategy Liquid Real Assets. Portfolio Manager of the fund. Began managing the fund in 2013.
■
Joined DWS in 2006; previously worked as a Director, Engineering and Business Development at Calpoint LLC from 2001-2004.
■
Head of Investment Strategy Liquid Real Assets: New York.
■
BS and MS, University of Washington, Seattle; MS and MBA, Carnegie Mellon University.
DWS Global Income Builder VIP
The following Portfolio Managers are jointly and primarily responsible for the day-to-day management of the fund.
Darwei Kung, Managing Director and Head of Investment Strategy Liquid Real Assets. Portfolio Manager of the fund. Began managing the fund in 2013.
■
Joined DWS in 2006; previously worked as a Director, Engineering and Business Development at Calpoint LLC from 2001-2004.
■
Head of Investment Strategy Liquid Real Assets: New York.
■
BS and MS, University of Washington, Seattle; MS and MBA, Carnegie Mellon University.
Di Kumble, CFA, Managing Director and Senior Portfolio Manager Equity. Portfolio Manager of the fund. Began managing the fund in 2014.
■
Joined DWS in 2003 with seven years of industry experience. Prior to joining, she served as a Portfolio Manager at Graham Capital Management. Previously, she worked as a Quantitative Strategist at ITG Inc. and Morgan Stanley.
■
Senior Portfolio Manager, Head of Tax Managed Equities: New York.
■
BS, Beijing University; PhD in Chemistry, Princeton University.
DWS Small Mid Cap Value VIP
The following Portfolio Managers are jointly and primarily responsible for the day-to-day management of the fund.
Pankaj Bhatnagar, PhD, Managing Director and Head of Investment Strategy Equity. Portfolio Manager of the fund. Began managing the fund in 2019.
■
Joined DWS in 2000 with seven years of industry experience; previously, served in Quantitative Strategy roles at Nomura Securities, Credit Suisse and Salomon Brothers.
■
Head of Core Equity and Head of Systematic and Quantitative Management: Americas.
■
Degree in Civil Engineering, Indian Institute of Technology; MBA, Kent State University; PhD in Finance, University of North Carolina at Chapel Hill.
Hiten Shah, Director and Senior Portfolio Manager Equity. Portfolio Manager of the fund. Began managing the fund in 2024.
■
Joined DWS in 2017 with 19 years of industry experience; previously, Senior Consultant at the firm with responsibility for the implementation of BlackRock's Aladdin platform in the US; Portfolio Manager for multi-asset portable alpha strategies at Oppenheimer Funds; Portfolio Manager for global macro and fixed income at various companies, including True North Partners, HSBC, Societe General and GE; and Analyst, Metlife Investments.
■
Senior Portfolio Manager for Quantitative Equity: New York.
■
BA in Economics, Rutgers University.
DWS International Opportunities VIP
The following Portfolio Manager is primarily responsible for the day-to-day management of the fund.
Sebastian P. Werner, PhD, Managing Director and Head of Investment Strategy Equity. Lead Portfolio Manager of the fund. Began managing the fund in 2013.
Prospectus May 1, 2026
108
Fund Details
■
Joined DWS in 2008; previously, he served as a Research Assistant for the Endowed Chair of Asset Management at the European Business School, Oestrich-Winkel while earning his PhD.
■
Portfolio Manager for Global and US Growth Equities: New York.
■
MBA in International Management from the Thunderbird School of Global Management; Master’s Degree (“Diplom-Kaufmann”) and PhD in Finance (“Dr.rer.pol.”) from the European Business School, Oestrich-Winkel.
DWS High Income VIP
The following Portfolio Managers are jointly and primarily responsible for the day-to-day management of the fund.
Kirk Maurer, CFA, Director and Portfolio Manager Fixed Income. Portfolio Manager of the fund. Began managing the fund in 2023.
■
Joined DWS in 2014 with 19 years of industry experience. Prior to joining, he was a director in portfolio management and research at Babson Capital Management. Previously, he served in portfolio management and as co-director of research at Caywood-Scholl Capital Management. Prior to that, he was a high yield research analyst at Waddell and Reed. He started his career as an analyst at Conseco Capital Management.
■
Portfolio Manager – Fixed Income: Jacksonville, FL.
■
BBA in Economics from Southern Illinois University.
Sarah Rowin, CFA, Director and Senior Portfolio Manager & Team Lead Fixed Income. Portfolio Manager of the fund. Began managing the fund in 2023.
■
Joined DWS in 2014 with 11 years of industry experience. Prior to joining, she worked as an analyst for high yield and distressed securities at GMP Securities. Previously, she served as an investment grade and high yield analyst at CreditSights.
■
Senior Portfolio Manager & Team Lead / Fixed Income: New York.
■
BA in Economics from the University of Pennsylvania; CFA Charterholder.
Nick Soroka, Director and Senior Portfolio Manager & Team Lead Fixed Income. Portfolio Manager of the fund. Began managing the fund in 2023.
■
Joined DWS in 2019 with over a year of industry experience. Prior to joining, he was a quantamental analyst at Ascend Capital. Prior to Ascend he worked at SpendVest, a fintech investing startup. Previously, he was an engineer in the U.S. Army.
■
Senior Portfolio Manager – Fixed Income: New York.
■
BS in Civil Engineering from United States Military Academy; MBA from Stanford Graduate School of Business.
DWS CROCI® U.S. VIP
The following Portfolio Managers are jointly and primarily responsible for the day-to-day management of the fund.
Di Kumble, CFA, Managing Director and Senior Portfolio Manager Equity. Portfolio Manager of the fund. Began managing the fund in 2016.
■
Joined DWS in 2003 with seven years of industry experience. Prior to joining, she served as a Portfolio Manager at Graham Capital Management. Previously, she worked as a Quantitative Strategist at ITG Inc. and Morgan Stanley.
■
Senior Portfolio Manager, Head of Tax Managed Equities: New York.
■
BS, Beijing University; PhD in Chemistry, Princeton University.
John Moody, Vice President and Portfolio Manager Equity. Portfolio Manager of the fund. Began managing the fund in 2016.
■
Joined DWS in 1998. Prior to his current role, served as a Business Manager for Active Equity. Previously, he was a Portfolio Analyst for EAFE, Global and Technology Funds and an Investment Accountant for International Funds. He began his career as a Client Service Associate for the International Institutional Equity Group.
■
Portfolio Analyst/Portfolio Manager: New York.
■
BS in Business Management, Fairfield University.
DWS Government Money Market VIP
A group of investment professionals is responsible for the day-to-day management of the fund. These investment professionals have a broad range of experience managing money market funds.
DWS Small Mid Cap Growth VIP
The following Portfolio Manager is primarily responsible for the day-to-day management of the fund.
Peter Barsa, Director and Senior Portfolio Manager Equity. Portfolio Manager of the fund. Began managing the fund in 2017.
■
Joined DWS in 1999.
■
Portfolio Manager for DWS Global Small Cap, US Small Cap Growth, US Small Mid Cap Growth, and Health and Wellness: New York.
■
Previously served as an equity research analyst covering consumer discretionary and consumer staples and as a global small cap equity research generalist.
■
BS in Finance, Villanova University.
Each fund’s Statement of Additional Information provides additional information about a portfolio manager’s investments in each fund, a description of the portfolio management compensation structure and information regarding other accounts managed.
Prospectus May 1, 2026
109
Fund Details
Investing in the Funds
Your Investment in the Funds
The information in this section may affect anyone who selects one or more funds as an investment option in a variable annuity contract or variable life insurance policy that offers one or more funds. These contracts and policies are described in separate prospectuses issued by participating insurance companies. Each fund assumes no responsibility for such prospectuses.
For an analysis of the fees associated with an investment in the fund or similar funds, please refer to the current and hypothetical expense calculators for Variable Insurance Products which can be found at dws.com/en-us/resources/fund-expense-calculator/ (the Web site does not form a part of this prospectus).
Policies About Transactions
The information in this prospectus applies to Class A shares of each fund. Each fund offers one class of shares (except DWS Alternative Asset Allocation VIP and DWS Small Mid Cap Value VIP, which offer two classes of shares). Class A shares are offered at net asset value and are not subject to 12b-1 fees.
Technically, the shareholders of Deutsche DWS Variable Series II are the participating insurance companies (the “insurance companies”) that offer each fund as choices for holders of certain variable annuity contracts or variable life insurance policies (the “contract(s)”) issued or sponsored by the insurance companies. The insurance companies may pass through voting rights to the contract owners. Each fund does not sell shares directly to the public. Each fund sells shares only to separate accounts of insurance companies. As a contract owner, your premium payments are allocated to a fund by the insurance companies in accordance with your contract. Please see the contract prospectus that accompanies this prospectus for a detailed explanation of your contract. Depending on context in the prospectus, the terms “you” and “yours” refer to either a contract owner or to the insurance company that issues the contract. References to “buying,”“purchasing” or “holding” fund shares refer only to the insurance company, not the contract owner.
Please bear in mind that there are important differences between DWS retail funds available to any investor (a “Retail Fund”) and those that are only available through
certain financial institutions, such as insurance companies. For example, Retail Funds, unlike a fund, are not sold to insurance company separate accounts to fund investments in variable insurance contracts. In addition, the investment objective, policies and strategies of a fund, while similar to those of a Retail Fund, are not identical. Retail Funds may be smaller or larger than a fund and have different expense ratios than the fund. As a result, the performance of a fund and a Retail Fund will differ.
Should any conflict between contract owners arise that would require that a substantial amount of net assets be withdrawn from a fund, orderly portfolio management could be disrupted to the potential detriment of shareholders of that fund.
Each fund currently does not foresee any disadvantages to the holders of variable annuity contracts or variable life insurance policies arising from the fact that the interests of the holders of such contracts and policies may differ. Nevertheless, the Board intends to monitor events in order to identify any material irreconcilable conflicts that may arise and to determine what action, if any, should be taken in any such event.
Each fund has a verification process for new insurance company accounts to help the government fight the funding of terrorism and money laundering activities. Federal law requires all financial institutions to obtain, verify and record information that identifies each insurance company that opens an account. This means that when an insurance company opens an account, a fund will ask for its name, address and other information that will allow a fund to identify the company. This information will be verified to ensure the identity of all insurance companies opening an account.
For certain insurance companies, a fund might request additional information (for instance, a fund would ask for documents such as the insurance company’s articles of incorporation) to help a fund verify the insurance company’s identity.
Each fund will not complete the purchase of any shares for an account until all information has been provided and the application has been submitted in “good order.” Once the application is determined to be in good order, the purchase(s) will be effected at the net asset value per share next calculated.
| Prospectus May 1, 2026 | 110 | Investing in the Funds |
Since DWS Government Money Market VIP will be investing in instruments that normally require immediate payment in Federal funds (monies credited to a bank’s account with its regional Federal Reserve Bank), that fund has adopted certain procedures for the convenience of its shareholders and to ensure that DWS Government Money Market VIP receives investable funds.
Each fund may reject a new account application if the insurance company doesn’t provide any required or requested identifying information, or for other reasons.
Buying and Selling Shares
Each fund is open for business each day the New York Stock Exchange is open. Each fund calculates its share price for each class every business day, as of the close of regular trading on the New York Stock Exchange (typically 4:00 p.m. Eastern time, but sometimes earlier, as in the case of scheduled half-day trading, shortened trading hours due to emergency circumstances or unscheduled suspensions of trading).
Each fund continuously sells shares to each insurance company separate account, without a sales charge, at the net asset value per share next determined after a proper purchase order is placed by the insurance company. The insurance company offers contract owners units in its separate accounts which correspond to shares in a fund. Each insurance company submits purchase and redemption orders to a fund based on allocation instructions for premium payments, transfer instructions and surrender or partial withdrawal requests for contract owners, as set forth in the accompanying prospectus for the contracts. These orders reflect the amount of premium payments to be invested, surrender and transfer requests, and other matters. Redemption orders are effected at the next net asset value per share determined after a proper redemption order is placed by the insurance company. Contract owners should look at their contract prospectuses for redemption procedures and fees.
Important information about buying and selling shares
■
After receiving a contract owner’s order, the insurance company buys or sells shares at the net asset value next calculated on any day each fund is open for business. A temporary intraday suspension or disruption of regular trading on the New York Stock Exchange will not be treated as the close of regular trading for that day if trading resumes and therefore will not impact the time at which each fund calculates its share price on that day. In the event of an early close of regular trading on the
New York Stock Exchange, such as in the case of scheduled half-day trading, shortened trading hours due to emergency circumstances or unscheduled suspensions of trading, each fund will calculate its share price as of the early close on that day. In such event, an order received before the early close will generally be effected at the share price calculated that day and an order received after the early close will generally be effected at the share price calculated on the next business day.
■
Unless otherwise instructed, each fund normally makes payment of the proceeds from the sale of shares the next business day but always within seven calendar days.
■
Redemptions will generally be in the form of cash, though each fund reserves the right to redeem in kind as described below. Each fund typically expects to satisfy redemption requests by using available cash or by selling portfolio securities if available cash is not sufficient to meet redemptions. Each fund (except DWS Alternative Asset Allocation VIP) may utilize an existing line of credit for temporary coverage in the event of a cash shortfall. Each fund may also utilize interfund lending, though such use is expected to be rare. Each fund may use any of these methods of satisfying redemption requests under normal or stressed market conditions. During periods of distressed market conditions, when a significant portion of each fund’s portfolio may be comprised of less-liquid investments, each fund may be more likely to pay redemption proceeds by giving you securities.
■
Each fund does not issue share certificates.
■
Each fund reserves the right to reject purchases of shares for any reason.
■
Each fund reserves the right to withdraw or suspend the offering of shares at any time.
■
Each fund reserves the right to reject purchases of shares or to suspend or postpone redemptions at times when the New York Stock Exchange is closed (other than customary closings), trading is restricted or when an emergency exists that prevents a fund from disposing of its portfolio securities or pricing its shares.
■
Each fund may refuse, cancel or rescind any purchase order; freeze any account (meaning the insurance company will not be able to purchase shares in its account); suspend account services; and/or involuntarily redeem the account if we think that the account is being used for fraudulent or illegal purposes by the insurance company; one or more of these actions will be taken when, at the sole discretion of each fund, they are deemed to be in each fund’s best interests or when each fund is requested or compelled to do so by governmental authority or by applicable law.
Prospectus May 1, 2026
111
Investing in the Funds
■
Each fund may close and liquidate an account if the fund is unable to verify provided information, or for other reasons; if the fund decides to close the account, the shares will be redeemed at the net asset value per share next calculated after we determine to close the account; the insurance company may be subject to gain or loss on the redemption of the fund shares and may incur tax liability.
■
Each fund may pay for shares sold by “redeeming in kind,” that is, by distributing to you marketable securities (which typically will involve brokerage costs for you to liquidate) rather than cash, but which will be taxable to the same extent as a redemption for cash; each fund generally won’t make a redemption in kind unless your requests over a 90-day period total more than $250,000 or 1% of the value of each fund’s net assets, whichever is less.
■
A purchase order from an insurance company separate account may not be accepted if the sale of fund shares has been suspended or if it is determined that the purchase would be detrimental to the interests of a fund.
■
Neither DWS nor a fund will be responsible for any losses resulting from fraud if we reasonably believe that any order or instruction was made by an individual authorized to act on the account. We will consider all transactions to be properly processed if discrepancies are not reported promptly.
Market timing policies and procedures. Short-term and excessive trading of fund shares may present risks to long-term shareholders, including potential dilution in the value of fund shares, interference with the efficient management of a fund’s portfolio (including losses on the sale of investments), taxable gains to remaining shareholders and increased brokerage and administrative costs. These risks may be more pronounced if a fund invests in certain securities, such as those that trade in foreign markets, are illiquid or do not otherwise have “readily available market quotations.” Certain investors may seek to employ short-term trading strategies aimed at exploiting variations in portfolio valuation that arise from the nature of the securities held by a fund (e.g., “time zone arbitrage”). Each fund discourages short-term and excessive trading and has adopted policies and procedures that are intended to detect and deter short-term and excessive trading.
Each fund also reserves the right to reject or cancel a purchase or exchange order for any reason without prior notice. For example, a fund may in its discretion reject or cancel a purchase or an exchange order even if the transaction is not subject to the transaction limitation described below if the Advisor believes that there appears to be a pattern of short-term or excessive trading activity by a shareholder or deems any other trading activity harmful or disruptive to a fund. Each fund, through its Advisor and transfer agent, will monitor changes in investment direction (CID) transactions that exceed a certain dollar amount by a shareholder within a fund within a specified time
period. A CID transaction is a transaction opposite to the prior transaction, which can be a purchase, redemption or exchange of the same fund. Each fund may take other trading activity into account if a fund believes such activity is of an amount or frequency that may be harmful to long-term shareholders or disruptive to portfolio management. The Advisor’s practices for identifying excessive short-term trading activity (e.g., the number of CID transactions, the dollar threshold and the time period) may change from time to time. If the Advisor determines that an investor has engaged in excessive short-term trading, the Advisor may issue the shareholder and/or the shareholder’s financial intermediary, if any, a written warning and/or may block the shareholder from further purchases of or exchanges into the fund’s shares.
Each fund reserves the right to maintain a block indefinitely if it deems that the shareholder’s activity was harmful to a fund, or that the pattern of activity suggests a pattern of abuse. The rights of a shareholder to redeem shares of a DWS fund are not affected by a block on purchases and exchanges.
Each fund may make exceptions to the transaction policy for certain types of transactions if, in the opinion of the Advisor, the transactions do not represent short-term or excessive trading or are not abusive or harmful to a fund, such as, but not limited to, systematic transactions, required minimum retirement distributions, transactions initiated by a fund or administrator and transactions by certain qualified funds-of-funds.
In certain circumstances where shareholders hold shares of a fund through an insurance company, a fund may rely upon the insurance company’s policy to deter short-term or excessive trading if the Advisor believes that the insurance company’s policy is reasonably designed to detect and deter transactions that are not in the best interests of a fund. An insurance company’s policy relating to short-term or excessive trading may be more or less restrictive than the DWS funds’ policy, may permit certain transactions not permitted by the DWS funds’ policies, or prohibit transactions not subject to the DWS funds’ policies.
The Advisor may also accept undertakings from an insurance company to enforce short-term or excessive trading policies on behalf of a fund that provide a substantially similar level of protection for each fund against such transactions. For example, certain insurance companies may have contractual, legal or operational restrictions that prevent them from blocking an account. In such instances, the insurance company may use alternate techniques that the Advisor considers to be a reasonable substitute for such a block.
In addition, if a fund invests some portion of its assets in foreign securities, it has adopted certain fair valuation practices intended to protect the fund from “time zone arbitrage” with respect to its foreign securities holdings
Prospectus May 1, 2026
112
Investing in the Funds
and other trading practices that seek to exploit variations in portfolio valuation that arise from the nature of the securities held by a fund. (See “How each Fund Calculates Share Price.”)
There is no assurance that these policies and procedures will be effective in limiting short-term and excessive trading in all cases. For example, the Advisor may not be able to effectively monitor, detect or limit short-term or excessive trading by underlying shareholders that occurs through omnibus accounts maintained by broker-dealers or other financial intermediaries. The Advisor reviews trading activity at the omnibus level to detect short-term or excessive trading. If the Advisor has reason to suspect that short-term or excessive trading is occurring at the omnibus level, the Advisor will contact the financial intermediary to request underlying shareholder level activity. Depending on the amount of fund shares held in such omnibus accounts (which may represent most of a fund’s shares), short-term and/or excessive trading of fund shares could adversely affect long-term shareholders in a fund. If short-term or excessive trading is identified, the Advisor will take appropriate action.
Each fund’s market timing policies and procedures may be modified or terminated at any time.
Since DWS Government Money Market VIP holds short-term instruments and is intended to provide liquidity to shareholders, the Advisor does not monitor or limit short-term and excessive trading activity in DWS Government Money Market VIP and, accordingly, the Board has not approved any policies and procedures designed to limit this activity. However, the fund reserves the right to and may reject or cancel a purchase or exchange order into a money market fund for any reason, including if, in the opinion of the Advisor, there appears to be a pattern of short-term and excessive trading by an investor in other DWS funds.
How to receive account information
If you are a contract owner, you should contact your insurance company or the organization that provides recordkeeping services for information about your account.
Please see the contract prospectus that accompanies this prospectus for the customer service telephone number.
How to select shares
Shares in a fund are available in connection with certain variable annuity and life insurance arrangements. Each insurance company has different provisions about how and when their contract owners may select fund shares. Each insurance company is responsible for communicating its contract owners’ instructions to a fund. Contract owners should contact their insurance company to effect transactions in connection with a fund.
How each Fund Calculates Share Price
To calculate net asset value per share, or NAV, each fund uses the following equation:
|
( |
Total
Assets |
− |
Total
Liabilities |
) |
÷ |
Total Number of
Shares Outstanding |
= |
NAV |
The price at which you buy and sell shares for each fund is the NAV. To obtain each fund's most recent share price, go to dws.com (we have included our Web site address as an inactive textual reference and do not intend it to be an active link to our Web site; the Web site does not form a part of this prospectus) or call the telephone number included in this prospectus.
The Board has designated the Advisor as the valuation designee for each fund pursuant to Rule 2a-5 under the 1940 Act. The Advisor’s Pricing Committee typically values securities using readily available market quotations or prices supplied by independent pricing services (which are considered fair values under Rule 2a-5). The Advisor has adopted fair valuation procedures that provide methodologies for fair valuing securities when pricing service prices or market quotations are not readily available, including when a security’s value or a meaningful portion of the value of a fund's portfolio is believed to have been materially affected by a significant event, such as a natural disaster, an economic event like a bankruptcy filing, or a substantial fluctuation in domestic or foreign markets that has occurred between the close of the exchange or market on which the security is principally traded (for example, a foreign exchange or market) and the close of the New York Stock Exchange. In such a case, a fund’s value for a security is likely to be different from the last quoted market price or pricing service prices. In addition, due to the subjective and variable nature of fair value pricing, it is possible that the value determined for a particular asset may be materially different from the value realized upon such asset’s sale.
It is expected that the greater the percentage of fund assets that is invested in non-US securities, the more extensive will be a fund’s use of fair value pricing. This is intended to reduce a fund’s exposure to “time zone arbitrage” and other harmful trading practices. (See “Market timing policies and procedures.”)
To the extent that a fund invests in securities that are traded primarily in foreign markets, the value of its holdings could change at a time when you aren’t able to buy or sell fund shares through the contract. This is because some foreign markets are open on days and at times when each fund doesn’t price the shares.
For DWS Government Money Market VIP, in valuing securities, the Advisor typically uses amortized cost to account for any premiums or discounts above or below the face value of any securities the fund buys, and round the per share NAV to the nearest whole cent. The fund seeks to maintain a stable $1.00 share price.
Prospectus May 1, 2026
113
Investing in the Funds
Financial intermediary support payments
The Advisor, the Distributor and/or their affiliates may pay additional compensation, out of their own assets and not as an additional charge to each fund, to selected affiliated and unaffiliated brokers, dealers, participating insurance companies or other financial intermediaries (“financial representatives”) in connection with the sale and/or distribution of fund shares or the retention and/or servicing of fund investors and fund shares (“revenue sharing”). Such revenue sharing payments are in addition to any distribution or service fees payable under any Rule 12b-1 or service plan of each fund, any recordkeeping/sub-transfer agency/networking fees payable by each fund (generally through the Distributor or an affiliate) and/or the Distributor or Advisor to certain financial representatives for performing such services and any sales charges, commissions, non-cash compensation arrangements expressly permitted under applicable rules of the Financial Industry Regulatory Authority or other concessions described in the fee table or elsewhere in this prospectus or the Statement of Additional Information as payable to all financial representatives. For example, the Advisor, the Distributor and/or their affiliates may, using their legitimate profits, compensate financial representatives for providing a fund with “shelf space” or access to a financial representative’s platform (including the costs associated with establishing and maintaining the fund on such platform) or fund offering list or other marketing programs, including, without limitation, inclusion of the fund on preferred or recommended sales lists, mutual fund “supermarket” platforms and other formal sales programs; granting the Distributor access to the financial representative’s sales force; granting the Distributor access to the financial representative’s conferences and meetings; assistance in training and educating the financial representative’s personnel; and obtaining other forms of marketing support. In addition, revenue sharing payments may consist of the Distributor’s and/or its affiliates’ payment or reimbursement of ticket charges that would otherwise be assessed by a financial representative on an investor’s fund transactions. In some cases, financial representatives may determine to credit all or a portion of revenue sharing payments back to investors.
The level of revenue sharing payments made to financial representatives may be a fixed fee or based upon one or more of the following factors: gross sales, current assets and/or number of accounts of each fund attributable to the financial representative, the particular fund or fund type or other measures as agreed to by the Advisor, the Distributor and/or their affiliates and the financial representatives or any combination thereof. The amount of these payments is determined at the discretion of the Advisor, the Distributor and/or their affiliates from time to time, may be substantial, and may be different for different financial representatives based on, for example, the nature of the services provided by the financial representative.
The Advisor, the Distributor and/or their affiliates currently make revenue sharing payments from their own assets in connection with the sale and/or distribution of DWS fund shares or the retention and/or servicing of investors to financial representatives in amounts that generally range from 0.01% up to 0.25% of assets of each fund serviced and maintained by the financial representative, 0.05% to 0.25% of sales of each fund attributable to the financial representative, a flat fee of up to $95,000, or any combination thereof. These amounts are annual figures typically paid on a quarterly basis and are subject to change at the discretion of the Advisor, the Distributor and/or their affiliates. Receipt of, or the prospect of receiving, this additional compensation may influence your financial representative’s recommendation of each fund or of any particular share class of each fund. You should review your financial representative’s compensation disclosure and/or talk to your financial representative to obtain more information on how this compensation may have influenced your financial representative’s recommendation of each fund. Additional information regarding these revenue sharing payments is included in each fund’s Statement of Additional Information, which is available to you on request at no charge (see the back cover of this prospectus for more information on how to request a copy of the Statement of Additional Information).
The Advisor, the Distributor and/or their affiliates may also make such revenue sharing payments to financial representatives under the terms discussed above in connection with the distribution of both DWS funds and non-DWS funds by financial representatives to retirement plans that obtain recordkeeping services from ADP, Inc. or to 403(b) plans that obtain recordkeeping services from Ascensus, Inc. on the DWS-branded retirement plan platform (the “Platform”). The level of revenue sharing payments is based upon sales of both the DWS funds and the non-DWS funds by the financial representative on the Platform or current assets of both the DWS funds and the non-DWS funds serviced and maintained by the financial representative on the Platform.
It is likely that broker-dealers that execute portfolio transactions for each fund will include firms that also sell shares of the DWS funds to their customers. However, the Advisor will not consider sales of DWS fund shares as a factor in the selection of broker-dealers to execute portfolio transactions for the DWS funds. Accordingly, the Advisor has implemented policies and procedures reasonably designed to prevent its traders from considering sales of DWS fund shares as a factor in the selection of broker-dealers to execute portfolio transactions for each fund. In addition, the Advisor, the Distributor and/or their affiliates will not use fund brokerage to pay for their obligation to provide additional compensation to financial representatives as described above.
Prospectus May 1, 2026
114
Investing in the Funds
Distributions
DWS Government Money Market VIP intends to declare its net investment income as a dividend daily and distribute dividends monthly. All other funds intend to declare and distribute dividends from their net investment income and capital gains, if any, annually. Each fund may make additional distributions if necessary.
All distributions will be reinvested in shares of a fund unless we are informed by an insurance company that they should be paid out in cash. For DWS Government Money Market VIP any unpaid dividends will be received when the insurance company redeems its entire account, unless the insurance company elects to receive unpaid dividends on the next monthly dividend payment date. The insurance companies will be informed about the amount and character of distributions from the fund for federal income tax purposes.
Taxes
Each fund intends to qualify each year as a regulated investment company under Subchapter M of the Internal Revenue Code of 1986, as amended (the “Code”), and intends to meet all requirements necessary to avoid paying any federal income or excise taxes.
Generally, owners of variable annuity and variable life contracts are not subject to current federal income taxation on income or gains realized with respect to such contracts. However, some distributions from such contracts, whether made prior to or during the annuity payment period, may be taxable at ordinary income tax rates. In addition, distributions made to an owner who is younger than 59½ may be subject to a 10% penalty tax. For further information concerning federal income tax consequences for the holders of variable annuity contracts and variable life insurance policies, such holders should consult the prospectus used in connection with the issuance of their particular contracts or policies.
In order for investors to receive the favorable federal income tax treatment available to holders of variable annuity and variable life contracts, the separate accounts underlying such contracts, as well as the funds in which such accounts invest, must meet certain diversification requirements. Each fund intends to diversify its assets such that a separate account investing in the fund will comply with these requirements with respect to the amounts invested in a fund. If a fund or separate account does not meet such requirements or if a fund were to fail to qualify as a regulated investment company for any taxable year and could not or did not cure such failure, income allocable to the contracts associated with the separate account may be taxable currently for federal income tax purposes to the holders of such contracts and income from prior periods with respect to such contracts also could be taxable, most likely in the year of the failure. In addition, if a fund were to fail to qualify and be eligible for treatment as a regulated investment company for any
taxable year and could not or did not cure such failure, the fund would be subject to tax on its taxable income at corporate rates.
Under Treasury regulations, insurance companies holding the separate accounts may have to report to the IRS losses above a certain amount resulting from a sale or disposition of a fund’s shares.
The discussion above is generally based on the assumption that shares of a fund will be respected as owned by insurance company separate accounts. If this is not the case (for example, because the IRS finds an impermissible level of “investor control” over the investment options underlying variable contracts), the advantageous federal income tax treatment provided in respect of insurance company separate accounts under the Code will no longer be available. In that situation, the person or persons determined to own the fund shares will be currently taxed for federal income tax purposes on fund distributions, and on the proceeds of any redemption of fund shares.
Participating insurance companies should consult their own tax advisors as to whether distributions from a fund are subject to federal income tax if they are retained as part of policy reserves.
Fund investments in securities of foreign issuers may be subject to withholding and other taxes at the source, including on dividend or interest payments, which will reduce a fund's return on such securities.
Each fund’s investments in certain debt obligations may cause each fund to recognize taxable income in excess of the cash generated by such investments. Thus, each fund could be required at times to liquidate other investments in order to satisfy its distribution requirements.
The preceding is a brief summary of certain of the relevant federal income tax considerations. Because each shareholder’s and contract holder’s tax situation is unique, ask your tax professional about the tax consequences of your investments, including possible federal, foreign, state or local taxes.
Prospectus May 1, 2026
115
Investing in the Funds
Financial Highlights
The financial highlights are designed to help you understand recent financial performance. The figures in the first part of each table are for a single share. The total return figures represent the percentage that an investor in a fund would have earned (or lost), assuming all dividends and distributions were reinvested. This information was audited by Ernst & Young LLP, an independent registered public accounting firm, whose report, along with each fund’s
financial statements, is included in each fund’s annual financial statements and other information reports (see the back cover). This information does not reflect charges and fees associated with the separate account that invests in the fund or any variable life insurance policy or variable annuity contract for which the fund is an investment option. These charges and fees will reduce returns.
| Prospectus May 1, 2026 | 116 | Financial Highlights |
|
DWS Alternative Asset Allocation VIP — Class A | |||||
|
|
Years Ended December 31, | ||||
|
|
2025 |
2024 |
2023 |
2022 |
2021 |
|
Selected Per Share Data | |||||
|
Net asset value, beginning of period |
$12.95 |
$12.74 |
$12.99 |
$15.13 |
$13.70 |
|
Income (loss) from investment operations: |
|
|
|
|
|
|
Net investment incomea |
.51 |
.52 |
.47 |
.88 |
1.04 |
|
Net realized and unrealized gain (loss) |
.81 |
.18 |
.29 |
(1.93
) |
.69 |
|
Total from investment operations |
1.32 |
.70 |
.76 |
(1.05
) |
1.73 |
|
Less distributions from: |
|
|
|
|
|
|
Net investment income |
(.56
) |
(.48
) |
(.89
) |
(1.08
) |
(.30
) |
|
Net realized gains |
— |
(.01
) |
(.12
) |
(.01
) |
— |
|
Total distributions |
(.56
) |
(.49
) |
(1.01
) |
(1.09
) |
(.30
) |
|
Net asset value, end of period |
$13.71 |
$12.95 |
$12.74 |
$12.99 |
$15.13 |
|
Total Return (%)b |
10.50 |
5.64 |
6.19 |
(7.42
) |
12.74 |
|
Ratios to Average Net Assets and Supplemental Data | |||||
|
Net assets, end of period ($ millions) |
61 |
56 |
51 |
46 |
47 |
|
Ratio of expenses (%)c,d |
.24 |
.23 |
.23 |
.23 |
.23 |
|
Ratio of net investment income (%) |
3.86 |
4.02 |
3.76 |
6.44 |
7.13 |
|
Portfolio turnover rate (%) |
18 |
25 |
0 |
12 |
19 |
|
a |
Based on average shares outstanding during the period. |
|
b |
Total return would have been lower if the Advisor had not reduced some Underlying DWS Funds’ expenses. |
|
c |
The Fund invests in other Funds and indirectly bears its proportionate share of fees and expenses incurred by the Underlying Funds in which the
Fund is invested. This ratio does not include these indirect fees and expenses. |
|
d |
Expense ratio does not reflect charges and fees associated with the separate account that invests in the Fund or any variable life insurance policy or
variable annuity contract for which the Fund is an investment option. |
| Prospectus May 1, 2026 | 117 | Financial Highlights |
|
DWS Global Income Builder VIP — Class A | |||||
|
|
Years Ended December 31, | ||||
|
|
2025 |
2024 |
2023 |
2022 |
2021 |
|
Selected Per Share Data | |||||
|
Net asset value, beginning of period |
$23.65 |
$22.49 |
$20.22 |
$26.78 |
$25.07 |
|
Income (loss) from investment operations: |
|
|
|
|
|
|
Net investment incomea |
.78 |
.98 |
.73 |
.61 |
.62 |
|
Net realized and unrealized gain (loss) |
2.23 |
1.00 |
2.21 |
(4.47
) |
2.08 |
|
Total from investment operations |
3.01 |
1.98 |
2.94 |
(3.86
) |
2.70 |
|
Less distributions from: |
|
|
|
|
|
|
Net investment income |
(1.12
) |
(.82
) |
(.67
) |
(.69
) |
(.62
) |
|
Net realized gains |
(3.19
) |
— |
— |
(2.01
) |
(.37
) |
|
Total distributions |
(4.31
) |
(.82
) |
(.67
) |
(2.70
) |
(.99
) |
|
Net asset value, end of period |
$22.35 |
$23.65 |
$22.49 |
$20.22 |
$26.78 |
|
Total Return (%) |
15.80 |
9.10 |
14.89 |
(14.98
) |
10.95 |
|
Ratios to Average Net Assets and Supplemental Data | |||||
|
Net assets, end of period ($ millions) |
116 |
110 |
110 |
103 |
131 |
|
Ratio of expenses (%)b |
.62 |
.63 |
.65 |
.65 |
.61 |
|
Ratio of net investment income (%) |
3.56 |
4.20 |
3.47 |
2.80 |
2.36 |
|
Portfolio turnover rate (%) |
165 |
294 |
180 |
95 |
104 |
|
a |
Based on average shares outstanding during the period. |
|
b |
Expense ratio does not reflect charges and fees associated with the separate account that invests in the Fund or any variable life insurance policy or
variable annuity contract for which the Fund is an investment option. |
| Prospectus May 1, 2026 | 118 | Financial Highlights |
|
DWS Small Mid Cap Value VIP — Class A | |||||
|
|
Years Ended December 31, | ||||
|
|
2025 |
2024 |
2023 |
2022 |
2021 |
|
Selected Per Share Data | |||||
|
Net asset value, beginning of period |
$13.81 |
$13.86 |
$12.73 |
$15.47 |
$12.00 |
|
Income (loss) from investment operations: |
|
|
|
|
|
|
Net investment incomea |
.08 |
.14 |
.15 |
.15 |
.11 |
|
Net realized and unrealized gain (loss) |
1.93 |
.68 |
1.64 |
(2.57
) |
3.54 |
|
Total from investment operations |
2.01 |
.82 |
1.79 |
(2.42
) |
3.65 |
|
Less distributions from: |
|
|
|
|
|
|
Net investment income |
(.14
) |
(.17
) |
(.15
) |
(.12
) |
(.18
) |
|
Net realized gains |
(1.59
) |
(.70
) |
(.51
) |
(.20
) |
— |
|
Total distributions |
(1.73
) |
(.87
) |
(.66
) |
(.32
) |
(.18
) |
|
Net asset value, end of period |
$14.09 |
$13.81 |
$13.86 |
$12.73 |
$15.47 |
|
Total Return (%)b |
18.21 |
6.21 |
14.95 |
(15.80
) |
30.50 |
|
Ratios to Average Net Assets and Supplemental Data | |||||
|
Net assets, end of period ($ millions) |
68 |
65 |
67 |
64 |
82 |
|
Ratio of expenses before expense reductions (%)c |
.87 |
.87 |
.87 |
.87 |
.85 |
|
Ratio of expenses after expense reductions (%)c |
.82 |
.82 |
.81 |
.83 |
.83 |
|
Ratio of net investment income (%) |
.61 |
.98 |
1.16 |
1.14 |
.76 |
|
Portfolio turnover rate (%) |
53 |
41 |
28 |
33 |
32 |
|
a |
Based on average shares outstanding during the period. |
|
b |
Total return would have been lower had certain expenses not been reduced. |
|
c |
Expense ratio does not reflect charges and fees associated with the separate account that invests in the Fund or any variable life insurance policy or
variable annuity contract for which the Fund is an investment option. |
| Prospectus May 1, 2026 | 119 | Financial Highlights |
|
DWS International Opportunities VIP — Class A | |||||
|
|
Years Ended December 31, | ||||
|
|
2025 |
2024 |
2023 |
2022 |
2021 |
|
Selected Per Share Data | |||||
|
Net asset value, beginning of period |
$16.32 |
$15.11 |
$13.12 |
$18.80 |
$17.65 |
|
Income (loss) from investment operations: |
|
|
|
|
|
|
Net investment incomea |
.18 |
.15 |
.18 |
.11 |
.08 |
|
Net realized and unrealized gain (loss) |
2.89 |
1.25 |
1.92 |
(5.45
) |
1.34 |
|
Total from investment operations |
3.07 |
1.40 |
2.10 |
(5.34
) |
1.42 |
|
Less distributions from: |
|
|
|
|
|
|
Net investment income |
(.17
) |
(.19
) |
(.11
) |
(.15
) |
(.06
) |
|
Net realized gains |
— |
— |
— |
(.19
) |
(.21
) |
|
Total distributions |
(.17
) |
(.19
) |
(.11
) |
(.34
) |
(.27
) |
|
Net asset value, end of period |
$19.22 |
$16.32 |
$15.11 |
$13.12 |
$18.80 |
|
Total Return (%)b |
18.92 |
9.37 |
16.04 |
(28.51
) |
8.11 |
|
Ratios to Average Net Assets and Supplemental Data | |||||
|
Net assets, end of period ($ millions) |
23 |
20 |
20 |
19 |
22 |
|
Ratio of expenses before expense reductions (%)c |
1.29 |
1.34 |
1.35 |
1.32 |
1.33 |
|
Ratio of expenses after expense reductions (%)c |
.84 |
.84 |
.89 |
.92 |
.90 |
|
Ratio of net investment income (%) |
.99 |
.94 |
1.27 |
.78 |
.41 |
|
Portfolio turnover rate (%) |
21 |
8 |
13 |
17 |
20 |
|
a |
Based on average shares outstanding during the period. |
|
b |
Total return would have been lower had certain expenses not been reduced. |
|
c |
Expense ratio does not reflect charges and fees associated with the separate account that invests in the Fund or any variable life insurance policy or
variable annuity contract for which the Fund is an investment option. |
| Prospectus May 1, 2026 | 120 | Financial Highlights |
|
DWS High Income VIP — Class A | |||||
|
|
Years Ended December 31, | ||||
|
|
2025 |
2024 |
2023 |
2022 |
2021 |
|
Selected Per Share Data | |||||
|
Net asset value, beginning of period |
$5.67 |
$5.63 |
$5.34 |
$6.18 |
$6.23 |
|
Income (loss) from investment operations: |
|
|
|
|
|
|
Net investment incomea |
.35 |
.35 |
.33 |
.27 |
.27 |
|
Net realized and unrealized gain (loss) |
.13 |
.03 |
.25 |
(.81
) |
(.03
) |
|
Total from investment operations |
.48 |
.38 |
.58 |
(.54
) |
.24 |
|
Less distributions from: |
|
|
|
|
|
|
Net investment income |
(.41
) |
(.34
) |
(.29
) |
(.30
) |
(.29
) |
|
Net asset value, end of period |
$5.74 |
$5.67 |
$5.63 |
$5.34 |
$6.18 |
|
Total Return (%)b |
8.94 |
7.14 |
11.34 |
(8.88
) |
4.00 |
|
Ratios to Average Net Assets and Supplemental Data | |||||
|
Net assets, end of period ($ millions) |
43 |
43 |
43 |
41 |
51 |
|
Ratio of expenses before expense reductions (%)c |
.94 |
.91 |
.90 |
.90 |
.84 |
|
Ratio of expenses after expense reductions (%)c |
.73 |
.70 |
.70 |
.71 |
.71 |
|
Ratio of net investment income (%) |
6.28 |
6.27 |
6.07 |
4.82 |
4.32 |
|
Portfolio turnover rate (%) |
154 |
143 |
62 |
45 |
56 |
|
a |
Based on average shares outstanding during the period. |
|
b |
Total return would have been lower had certain expenses not been reduced. |
|
c |
Expense ratio does not reflect charges and fees associated with the separate account that invests in the Fund or any variable life insurance policy or
variable annuity contract for which the Fund is an investment option. |
| Prospectus May 1, 2026 | 121 | Financial Highlights |
|
DWS CROCI® U.S. VIP — Class A | |||||
|
|
Years Ended December 31, | ||||
|
|
2025 |
2024 |
2023 |
2022 |
2021 |
|
Selected Per Share Data | |||||
|
Net asset value, beginning of period |
$18.08 |
$15.59 |
$13.14 |
$16.05 |
$12.92 |
|
Income (loss) from investment operations: |
|
|
|
|
|
|
Net investment incomea |
.29 |
.22 |
.24 |
.23 |
.24 |
|
Net realized and unrealized gain (loss) |
2.32 |
2.52 |
2.45 |
(2.68
) |
3.17 |
|
Total from investment operations |
2.61 |
2.74 |
2.69 |
(2.45
) |
3.41 |
|
Less distributions from: |
|
|
|
|
|
|
Net investment income |
(.25
) |
(.25
) |
(.24
) |
(.25
) |
(.28
) |
|
Net realized gains |
(1.62
) |
— |
— |
(.21
) |
— |
|
Total distributions |
(1.87
) |
(.25
) |
(.24
) |
(.46
) |
(.28
) |
|
Net asset value, end of period |
$18.82 |
$18.08 |
$15.59 |
$13.14 |
$16.05 |
|
Total Return (%)b |
17.19 |
17.76 |
20.76 |
(15.40
) |
26.69 |
|
Ratios to Average Net Assets and Supplemental Data | |||||
|
Net assets, end of period ($ millions) |
146 |
138 |
131 |
116 |
149 |
|
Ratio of expenses before expense reductions (%)c |
.80 |
.78 |
.79 |
.79 |
.78 |
|
Ratio of expenses after expense reductions (%)c |
.71 |
.68 |
.68 |
.65 |
.71 |
|
Ratio of net investment income (%) |
1.66 |
1.31 |
1.69 |
1.66 |
1.62 |
|
Portfolio turnover rate (%) |
76 |
60 |
60 |
60 |
99 |
|
a |
Based on average shares outstanding during the period. |
|
b |
Total return would have been lower had certain expenses not been reduced. |
|
c |
Expense ratio does not reflect charges and fees associated with the separate account that invests in the Fund or any variable life insurance policy or
variable annuity contract for which the Fund is an investment option. |
| Prospectus May 1, 2026 | 122 | Financial Highlights |
|
DWS Government Money Market VIP — Class A | |||||
|
|
Years Ended December 31, | ||||
|
|
2025 |
2024 |
2023 |
2022 |
2021 |
|
Selected Per Share Data | |||||
|
Net asset value, beginning of period |
$1.00 |
$1.00 |
$1.00 |
$1.00 |
$1.00 |
|
Income (loss) from investment operations: |
|
|
|
|
|
|
Net investment income |
.039 |
.048 |
.047 |
.013 |
.000
* |
|
Net realized gain (loss) |
.000
* |
.000
* |
.000
* |
(.000
)* |
(.000
)* |
|
Total from investment operations |
.039 |
.048 |
.047 |
.013 |
.000
* |
|
Less distributions from: |
|
|
|
|
|
|
Net investment income |
(.039
) |
(.048
) |
(.047
) |
(.013
) |
(.000
)* |
|
Net asset value, end of period |
$1.00 |
$1.00 |
$1.00 |
$1.00 |
$1.00 |
|
Total Return (%) |
3.96 |
4.92 |
4.75 |
1.29
a |
.01
a |
|
Ratios to Average Net Assets and Supplemental Data | |||||
|
Net assets, end of period ($ millions) |
208 |
215 |
286 |
187 |
197 |
|
Ratio of expenses before expense reductions (%)b |
.40 |
.40 |
.39 |
.40 |
.42 |
|
Ratio of expenses after expense reductions (%)b |
.40 |
.40 |
.39 |
.32 |
.06 |
|
Ratio of net investment income (%) |
3.89 |
4.80 |
4.70 |
1.25 |
.01 |
|
a |
Total return would have been lower had certain expenses not been reduced. |
|
b |
Expense ratio does not reflect charges and fees associated with the separate account that invests in the Fund or any variable life insurance policy or
variable annuity contract for which the Fund is an investment option. |
|
* |
Amount is less than $.0005. |
| Prospectus May 1, 2026 | 123 | Financial Highlights |
|
DWS Small Mid Cap Growth VIP — Class A | |||||
|
|
Years Ended December 31, | ||||
|
|
2025 |
2024 |
2023 |
2022 |
2021 |
|
Selected Per Share Data | |||||
|
Net asset value, beginning of period |
$14.27 |
$13.70 |
$11.97 |
$18.87 |
$17.43 |
|
Income (loss) from investment operations: |
|
|
|
|
|
|
Net investment income (loss)a |
(.01
) |
(.03
) |
.00
* |
(.00
)* |
(.06
) |
|
Net realized and unrealized gain (loss) |
.96 |
.73 |
2.17 |
(5.10
) |
2.43 |
|
Total from investment operations |
.95 |
.70 |
2.17 |
(5.10
) |
2.37 |
|
Less distributions from: |
|
|
|
|
|
|
Net investment income |
— |
— |
(.00
)* |
— |
(.01
) |
|
Net realized gains |
(1.03
) |
(.13
) |
(.44
) |
(1.80
) |
(.92
) |
|
Total distributions |
(1.03
) |
(.13
) |
(.44
) |
(1.80
) |
(.93
) |
|
Net asset value, end of period |
$14.19 |
$14.27 |
$13.70 |
$11.97 |
$18.87 |
|
Total Return (%) |
8.11 |
5.15 |
18.83
b |
(28.02
)b |
13.84 |
|
Ratios to Average Net Assets and Supplemental Data | |||||
|
Net assets, end of period ($ millions) |
48 |
49 |
53 |
50 |
75 |
|
Ratio of expenses before expense reductions (%)c |
.85 |
.83 |
.85 |
.83 |
.78 |
|
Ratio of expenses after expense reductions (%)c |
.85 |
.83 |
.84 |
.81 |
.78 |
|
Ratio of net investment income (loss) (%) |
(.08
) |
(.22
) |
.02 |
(.02
) |
(.33
) |
|
Portfolio turnover rate (%) |
11 |
4 |
4 |
11 |
16 |
|
a |
Based on average shares outstanding during the period. |
|
b |
Total return would have been lower had certain expenses not been reduced. |
|
c |
Expense ratio does not reflect charges and fees associated with the separate account that invests in the Fund or any variable life insurance policy or
variable annuity contract for which the Fund is an investment option. |
|
* |
Amount is less than $.005. |
| Prospectus May 1, 2026 | 124 | Financial Highlights |
Appendix
Hypothetical Expense Summary
Using the annual fund operating expense ratios presented in the fee tables in the fund’s prospectus, the Hypothetical Expense Summary shows the estimated fees and expenses, in actual dollars, that would be charged on a hypothetical investment of $10,000 in the fund held for the next 10 years and the impact of such fees and expenses on fund returns for each year and cumulatively, assuming a 5% return for each year. The historical rate of return for the fund may be higher or lower than 5% and, for money market funds, is typically less than 5%. The tables also assume that all dividends and distributions are reinvested. The annual fund expense ratios shown are net of any contractual fee waivers or expense reimbursements, if
any, for the period of the contractual commitment. Also, please note that if you are investing through a third party provider, that provider may have fees and expenses separate from those of the fund that are not reflected here. Mutual fund fees and expenses fluctuate over time and actual expenses may be higher or lower than those shown.
The Hypothetical Expense Summary should not be used or construed as an offer to sell, a solicitation of an offer to buy or a recommendation or endorsement of any specific mutual fund. You should carefully review the fund’s prospectus to consider the investment objective, risks, expenses and charges of the fund prior to investing.
DWS Alternative Asset Allocation VIP — Class A
|
|
Maximum
Sales Charge:
0.00% |
Initial Hypothetical
Investment:
$10,000 |
Assumed Rate
of Return:
5% | ||
|
Year |
Cumulative
Return Before
Fees &
Expenses |
Annual
Fund
Expense
Ratios |
Cumulative
Return After
Fees &
Expenses |
Hypothetical
Year-End
Balance After
Fees &
Expenses |
Annual Fees
&
Expenses |
|
1 |
5.00% |
0.93% |
4.07% |
$10,407.00 |
$94.89 |
|
2 |
10.25% |
0.93% |
8.31% |
$10,830.56 |
$98.75 |
|
3 |
15.76% |
0.93% |
12.71% |
$11,271.37 |
$102.77 |
|
4 |
21.55% |
0.93% |
17.30% |
$11,730.11 |
$106.96 |
|
5 |
27.63% |
0.93% |
22.08% |
$12,207.53 |
$111.31 |
|
6 |
34.01% |
0.93% |
27.04% |
$12,704.38 |
$115.84 |
|
7 |
40.71% |
0.93% |
32.21% |
$13,221.44 |
$120.56 |
|
8 |
47.75% |
0.93% |
37.60% |
$13,759.56 |
$125.46 |
|
9 |
55.13% |
0.93% |
43.20% |
$14,319.57 |
$130.57 |
|
10 |
62.89% |
0.93% |
49.02% |
$14,902.38 |
$135.88 |
|
Total |
$1,142.99 | ||||
| Prospectus May 1, 2026 | 125 | Appendix |
DWS Global Income Builder VIP — Class A
|
|
Maximum
Sales Charge:
0.00% |
Initial Hypothetical
Investment:
$10,000 |
Assumed Rate
of Return:
5% | ||
|
Year |
Cumulative
Return Before
Fees &
Expenses |
Annual
Fund
Expense
Ratios |
Cumulative
Return After
Fees &
Expenses |
Hypothetical
Year-End
Balance After
Fees &
Expenses |
Annual Fees
&
Expenses |
|
1 |
5.00% |
0.61% |
4.39% |
$10,439.00 |
$62.34 |
|
2 |
10.25% |
0.61% |
8.97% |
$10,897.27 |
$65.08 |
|
3 |
15.76% |
0.61% |
13.76% |
$11,375.66 |
$67.93 |
|
4 |
21.55% |
0.61% |
18.75% |
$11,875.05 |
$70.91 |
|
5 |
27.63% |
0.61% |
23.96% |
$12,396.37 |
$74.03 |
|
6 |
34.01% |
0.61% |
29.41% |
$12,940.57 |
$77.28 |
|
7 |
40.71% |
0.61% |
35.09% |
$13,508.66 |
$80.67 |
|
8 |
47.75% |
0.61% |
41.02% |
$14,101.69 |
$84.21 |
|
9 |
55.13% |
0.61% |
47.21% |
$14,720.75 |
$87.91 |
|
10 |
62.89% |
0.61% |
53.67% |
$15,367.00 |
$91.77 |
|
Total |
$762.13 | ||||
DWS Small Mid Cap Value VIP — Class A
|
|
Maximum
Sales Charge:
0.00% |
Initial Hypothetical
Investment:
$10,000 |
Assumed Rate
of Return:
5% | ||
|
Year |
Cumulative
Return Before
Fees &
Expenses |
Annual
Fund
Expense
Ratios |
Cumulative
Return After
Fees &
Expenses |
Hypothetical
Year-End
Balance After
Fees &
Expenses |
Annual Fees
&
Expenses |
|
1 |
5.00% |
0.80% |
4.20% |
$10,420.00 |
$81.68 |
|
2 |
10.25% |
0.87% |
8.50% |
$10,850.35 |
$92.53 |
|
3 |
15.76% |
0.87% |
12.98% |
$11,298.47 |
$96.35 |
|
4 |
21.55% |
0.87% |
17.65% |
$11,765.09 |
$100.33 |
|
5 |
27.63% |
0.87% |
22.51% |
$12,250.99 |
$104.47 |
|
6 |
34.01% |
0.87% |
27.57% |
$12,756.96 |
$108.78 |
|
7 |
40.71% |
0.87% |
32.84% |
$13,283.82 |
$113.28 |
|
8 |
47.75% |
0.87% |
38.32% |
$13,832.44 |
$117.96 |
|
9 |
55.13% |
0.87% |
44.04% |
$14,403.72 |
$122.83 |
|
10 |
62.89% |
0.87% |
49.99% |
$14,998.59 |
$127.90 |
|
Total |
$1,066.11 | ||||
| Prospectus May 1, 2026 | 126 | Appendix |
DWS International Opportunities VIP — Class A
|
|
Maximum
Sales Charge:
0.00% |
Initial Hypothetical
Investment:
$10,000 |
Assumed Rate
of Return:
5% | ||
|
Year |
Cumulative
Return Before
Fees &
Expenses |
Annual
Fund
Expense
Ratios |
Cumulative
Return After
Fees &
Expenses |
Hypothetical
Year-End
Balance After
Fees &
Expenses |
Annual Fees
&
Expenses |
|
1 |
5.00% |
0.86% |
4.14% |
$10,414.00 |
$87.78 |
|
2 |
10.25% |
1.30% |
7.99% |
$10,799.32 |
$137.89 |
|
3 |
15.76% |
1.30% |
11.99% |
$11,198.89 |
$142.99 |
|
4 |
21.55% |
1.30% |
16.13% |
$11,613.25 |
$148.28 |
|
5 |
27.63% |
1.30% |
20.43% |
$12,042.94 |
$153.77 |
|
6 |
34.01% |
1.30% |
24.89% |
$12,488.53 |
$159.45 |
|
7 |
40.71% |
1.30% |
29.51% |
$12,950.61 |
$165.35 |
|
8 |
47.75% |
1.30% |
34.30% |
$13,429.78 |
$171.47 |
|
9 |
55.13% |
1.30% |
39.27% |
$13,926.68 |
$177.82 |
|
10 |
62.89% |
1.30% |
44.42% |
$14,441.97 |
$184.40 |
|
Total |
$1,529.20 | ||||
DWS High Income VIP — Class A
|
|
Maximum
Sales Charge:
0.00% |
Initial Hypothetical
Investment:
$10,000 |
Assumed Rate
of Return:
5% | ||
|
Year |
Cumulative
Return Before
Fees &
Expenses |
Annual
Fund
Expense
Ratios |
Cumulative
Return After
Fees &
Expenses |
Hypothetical
Year-End
Balance After
Fees &
Expenses |
Annual Fees
&
Expenses |
|
1 |
5.00% |
0.71% |
4.29% |
$10,429.00 |
$72.52 |
|
2 |
10.25% |
0.90% |
8.57% |
$10,856.59 |
$95.79 |
|
3 |
15.76% |
0.90% |
13.02% |
$11,301.71 |
$99.71 |
|
4 |
21.55% |
0.90% |
17.65% |
$11,765.08 |
$103.80 |
|
5 |
27.63% |
0.90% |
22.47% |
$12,247.45 |
$108.06 |
|
6 |
34.01% |
0.90% |
27.50% |
$12,749.59 |
$112.49 |
|
7 |
40.71% |
0.90% |
32.72% |
$13,272.33 |
$117.10 |
|
8 |
47.75% |
0.90% |
38.16% |
$13,816.49 |
$121.90 |
|
9 |
55.13% |
0.90% |
43.83% |
$14,382.97 |
$126.90 |
|
10 |
62.89% |
0.90% |
49.73% |
$14,972.67 |
$132.10 |
|
Total |
$1,090.37 | ||||
| Prospectus May 1, 2026 | 127 | Appendix |
DWS CROCI® U.S. VIP — Class A
|
|
Maximum
Sales Charge:
0.00% |
Initial Hypothetical
Investment:
$10,000 |
Assumed Rate
of Return:
5% | ||
|
Year |
Cumulative
Return Before
Fees &
Expenses |
Annual
Fund
Expense
Ratios |
Cumulative
Return After
Fees &
Expenses |
Hypothetical
Year-End
Balance After
Fees &
Expenses |
Annual Fees
&
Expenses |
|
1 |
5.00% |
0.71% |
4.29% |
$10,429.00 |
$72.52 |
|
2 |
10.25% |
0.79% |
8.68% |
$10,868.06 |
$84.12 |
|
3 |
15.76% |
0.79% |
13.26% |
$11,325.61 |
$87.66 |
|
4 |
21.55% |
0.79% |
18.02% |
$11,802.41 |
$91.36 |
|
5 |
27.63% |
0.79% |
22.99% |
$12,299.30 |
$95.20 |
|
6 |
34.01% |
0.79% |
28.17% |
$12,817.10 |
$99.21 |
|
7 |
40.71% |
0.79% |
33.57% |
$13,356.70 |
$103.39 |
|
8 |
47.75% |
0.79% |
39.19% |
$13,919.01 |
$107.74 |
|
9 |
55.13% |
0.79% |
45.05% |
$14,505.00 |
$112.27 |
|
10 |
62.89% |
0.79% |
51.16% |
$15,115.66 |
$117.00 |
|
Total |
$970.47 | ||||
DWS Government Money Market VIP — Class A
|
|
Maximum
Sales Charge:
0.00% |
Initial Hypothetical
Investment:
$10,000 |
Assumed Rate
of Return:
5% | ||
|
Year |
Cumulative
Return Before
Fees &
Expenses |
Annual
Fund
Expense
Ratios |
Cumulative
Return After
Fees &
Expenses |
Hypothetical
Year-End
Balance After
Fees &
Expenses |
Annual Fees
&
Expenses |
|
1 |
5.00% |
0.39% |
4.61% |
$10,461.00 |
$39.90 |
|
2 |
10.25% |
0.39% |
9.43% |
$10,943.25 |
$41.74 |
|
3 |
15.76% |
0.39% |
14.48% |
$11,447.74 |
$43.66 |
|
4 |
21.55% |
0.39% |
19.75% |
$11,975.48 |
$45.68 |
|
5 |
27.63% |
0.39% |
25.28% |
$12,527.55 |
$47.78 |
|
6 |
34.01% |
0.39% |
31.05% |
$13,105.07 |
$49.98 |
|
7 |
40.71% |
0.39% |
37.09% |
$13,709.21 |
$52.29 |
|
8 |
47.75% |
0.39% |
43.41% |
$14,341.20 |
$54.70 |
|
9 |
55.13% |
0.39% |
50.02% |
$15,002.33 |
$57.22 |
|
10 |
62.89% |
0.39% |
56.94% |
$15,693.94 |
$59.86 |
|
Total |
$492.81 | ||||
| Prospectus May 1, 2026 | 128 | Appendix |
DWS Small Mid Cap Growth VIP — Class A
|
|
Maximum
Sales Charge:
0.00% |
Initial Hypothetical
Investment:
$10,000 |
Assumed Rate
of Return:
5% | ||
|
Year |
Cumulative
Return Before
Fees &
Expenses |
Annual
Fund
Expense
Ratios |
Cumulative
Return After
Fees &
Expenses |
Hypothetical
Year-End
Balance After
Fees &
Expenses |
Annual Fees
&
Expenses |
|
1 |
5.00% |
0.85% |
4.15% |
$10,415.00 |
$86.76 |
|
2 |
10.25% |
0.85% |
8.47% |
$10,847.22 |
$90.36 |
|
3 |
15.76% |
0.85% |
12.97% |
$11,297.38 |
$94.11 |
|
4 |
21.55% |
0.85% |
17.66% |
$11,766.22 |
$98.02 |
|
5 |
27.63% |
0.85% |
22.55% |
$12,254.52 |
$102.09 |
|
6 |
34.01% |
0.85% |
27.63% |
$12,763.08 |
$106.32 |
|
7 |
40.71% |
0.85% |
32.93% |
$13,292.75 |
$110.74 |
|
8 |
47.75% |
0.85% |
38.44% |
$13,844.40 |
$115.33 |
|
9 |
55.13% |
0.85% |
44.19% |
$14,418.94 |
$120.12 |
|
10 |
62.89% |
0.85% |
50.17% |
$15,017.33 |
$125.10 |
|
Total |
$1,048.95 | ||||
Additional Index Information
DWS Alternative Asset Allocation VIP
MSCI ACWI All Cap Index captures large, mid, small and micro-cap representation across Developed Markets countries and large, mid and small cap representation across Emerging Markets countries. The index is comprehensive, covering approximately 99% of the global equity investment opportunity set.
Bloomberg Global Aggregate Index is a flagship measure of global investment grade debt from local currency markets. This multi-currency benchmark includes treasury, government-related, corporate and securitized fixed-rate bonds from both developed and emerging markets issuers.
MSCI World Index captures large and mid-cap representation across Developed Markets countries. The index covers approximately 85% of the free float-adjusted market capitalization in each country.
Bloomberg U.S. Aggregate Bond Index is a broad-based flagship benchmark that measures the investment grade, US dollar-denominated, fixed-rate taxable bond market. The index includes Treasuries, government-related and corporate securities, fixed rate agency MBS, ABS and CMBS (agency and non-agency).
DWS Global Income Builder VIP
MSCI ACWI Index captures large and mid-cap representation across Developed Markets and Emerging Markets countries. The index covers approximately 85% of the global investable equity opportunity set.
Bloomberg U.S. Universal Index measures the performance of U.S. dollar-denominated taxable bonds that are rated either investment grade or high yield. The index includes U.S. Treasury bonds, investment-grade and high yield U.S. corporate bonds, mortgage-backed securities, and Eurodollar bonds.
DWS Small Mid Cap Value VIP
Russell 3000® Index measures the performance of the largest 3,000 US companies designed to represent approximately 98% of the investable US equity market. The Russell 3000® Index is constructed to provide a comprehensive, unbiased and stable barometer of the broad market and is completely reconstituted annually to ensure new and growing equities are included.
Russell 2500™ Value Index measures the performance of the small to mid-cap value segment of the US equity universe. It includes those Russell 2500 companies with relatively lower price-to-book ratios, lower I/B/E/S forecast medium term (2 year) growth and lower sales per share historical growth (5 years). The Russell 2500™ Value Index is constructed to provide a comprehensive and unbiased barometer of the small to mid-cap value segment. The index is completely reconstituted annually to ensure larger stocks do not distort the performance and characteristics of the true small to mid-cap opportunity set and that the represented companies continue to reflect value characteristics.
| Prospectus May 1, 2026 | 129 | Appendix |
DWS International Opportunities VIP
MSCI All Country World ex USA Index captures large and mid-cap representation across Developed Markets countries (excluding the US) and Emerging Markets countries. The index covers approximately 85% of the global equity opportunity set outside the US.
DWS High Income VIP
Bloomberg U.S. Aggregate Bond Index is a broad-based flagship benchmark that measures the investment grade, US dollar-denominated, fixed-rate taxable bond market. The index includes Treasuries, government-related and corporate securities, fixed rate agency MBS, ABS and CMBS (agency and non-agency).
ICE BofA US High Yield Index tracks the performance of U.S. dollar denominated below investment grade corporate debt publicly issued in the US domestic market.
DWS CROCI® U.S. VIP
Russell 1000® Index measures the performance of the large-cap segment of the US equity universe. The Russell 1000® Index is a subset of the Russell 3000® Index which is designed to represent approximately 98% of the investable US equity market. It includes approximately 1,000 of the largest securities based on a combination of their market cap and current index membership. The Russell 1000® Index is constructed to provide a comprehensive and unbiased barometer for the large-cap segment and is completely reconstituted annually to ensure new and growing equities are included.
Russell 1000® Value Index measures the performance of the large-cap value segment of the US equity universe. It includes those Russell 1000 companies with relatively lower price-to-book ratios, lower I/B/E/S forecast medium term (2 year) growth and lower sales per share historical growth (5 years). The Russell 1000® Value Index is constructed to provide a comprehensive and unbiased barometer for the large-cap value segment. The index is completely reconstituted annually to ensure new and growing equities are included and that the represented companies continue to reflect value characteristics.
DWS Small Mid Cap Growth VIP
Russell 3000® Index measures the performance of the largest 3,000 US companies designed to represent approximately 98% of the investable US equity market. The Russell 3000® Index is constructed to provide a comprehensive, unbiased and stable barometer of the broad market and is completely reconstituted annually to ensure new and growing equities are included.
Russell 2500™ Growth Index measures the performance of the small to mid-cap growth segment of the US equity universe. It includes those Russell 2500 companies with relatively higher price-to-book ratios, higher I/B/E/S forecast medium term (2 year) growth and higher sales per share historical growth (5 years). The Russell 2500™ Growth Index is constructed to provide a comprehensive and unbiased barometer of the small to mid-cap growth market. The index is completely reconstituted annually to ensure larger stocks do not distort the performance and characteristics of the true small to mid-cap opportunity set and that the represented companies continue to reflect growth characteristics.
| Prospectus May 1, 2026 | 130 | Appendix |
To Get More Information
Fund reports. Additional information about a fund's investments is available in a fund's annual and semi-annual reports to shareholders and in Form N-CSR. In the annual report, you will find a discussion of the market conditions and investment strategies that significantly affected fund performance during its last fiscal year. In Form N-CSR, you will find the fund’s annual and semi-annual financial statements.
Statement of Additional Information (SAI). This tells you more about a fund's features and policies, including additional risk information. The SAI is incorporated by reference into this document (meaning that it’s legally part of this prospectus).
For a free copy of the SAI or a shareholder or other report or to request other information about a fund, contact DWS at the telephone number or address listed below. SAIs and shareholder reports are also available through the DWS Web site at dws.com. These documents and other information about each fund (such as fund financial statements) are available from the EDGAR Database on the
SEC’s Internet site at sec.gov. If you like, you may obtain copies of this information, after paying a duplicating fee, by e-mailing a request to publicinfo@sec.gov. The fund’s recent shareholder reports and financial statements are also in the fund’s annual and semi-annual filings with the SEC on Form N-CSR, which are available from the EDGAR Database on the SEC’s Internet site at sec.gov.
Contact Information
|
DWS |
222 South Riverside Plaza
Chicago, IL 60606-5808
dws.com |
|
|
(800) 728-3337 |
|
Distributor |
DWS Distributors, Inc.
222 South Riverside Plaza
Chicago, IL 60606-5808
(800) 621-1148 |
|
SEC File Number |
Deutsche DWS Variable Series II
811-05002 |
(05/01/26) 2A-1