UNITED STATES
SECURITIES AND EXCHANGE COMMISSION
Washington, D.C. 20549
FORM
CERTIFIED SHAREHOLDER REPORT OF REGISTERED MANAGEMENT INVESTMENT COMPANIES
Investment Company Act file number
811-05202
(Exact name of registrant as specified in charter)
c/o BNY Mellon Investment Adviser, Inc.
240 Greenwich Street
New York, New York 10286
(Address of Principal Executive Officer) (Zip Code)
Deirdre Cunnane, Esq.
240 Greenwich Street
New York, New York 10286
(Name and Address of Agent for Service)
Registrant's telephone number, including area code:
(212) 922-6400
Date of fiscal year end:
8/31
Date of reporting period:
The following N-CSR relates only to the Registrant's series listed below and does not relate to any series of the Registrant with a different fiscal year end and, therefore, different N-CSR reporting requirements. A separate N-CSR will be filed for any series with a different fiscal year end, as appropriate.
BNY Mellon Floating Rate Income Fund
ITEM 1 - Reports to Stockholders
SEMI-ANNUAL
SHAREHOLDER
REPORT
SHAREHOLDER
REPORT
February 28, 2026
This report describes changes to the Fund that occurred during the reporting period.
What were the Fund’s costs for the last six months ?
(based on a hypothetical $10,000 investment)
| Share Class | Costs of a $10,000 investment | Costs paid as a percentage of a $10,000 investment |
| Class A* | $ |
| * |
During the period, fees were waived and/or expenses reimbursed pursuant to an agreement with the Fund’s investment adviser, BNY Mellon Investment Adviser, Inc. If this agreement is not extended in the future, expenses could be higher.
|
| ** |
Annualized.
|
KEY FUND STATISTICS (AS OF 2/28/26 )
Fund Size (Millions) |
Number of Holdings |
Portfolio Turnover |
| $ |
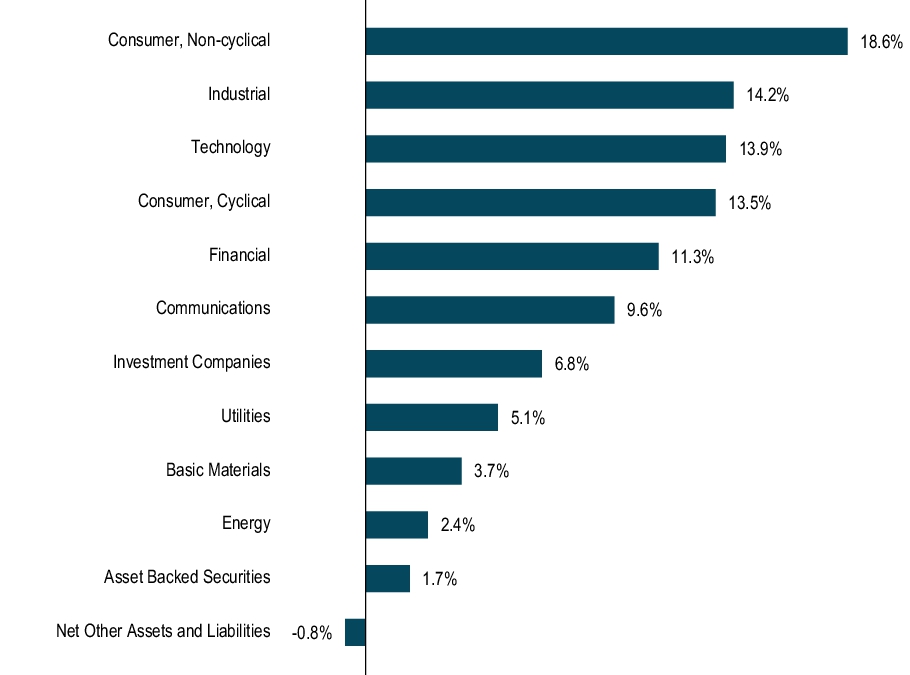
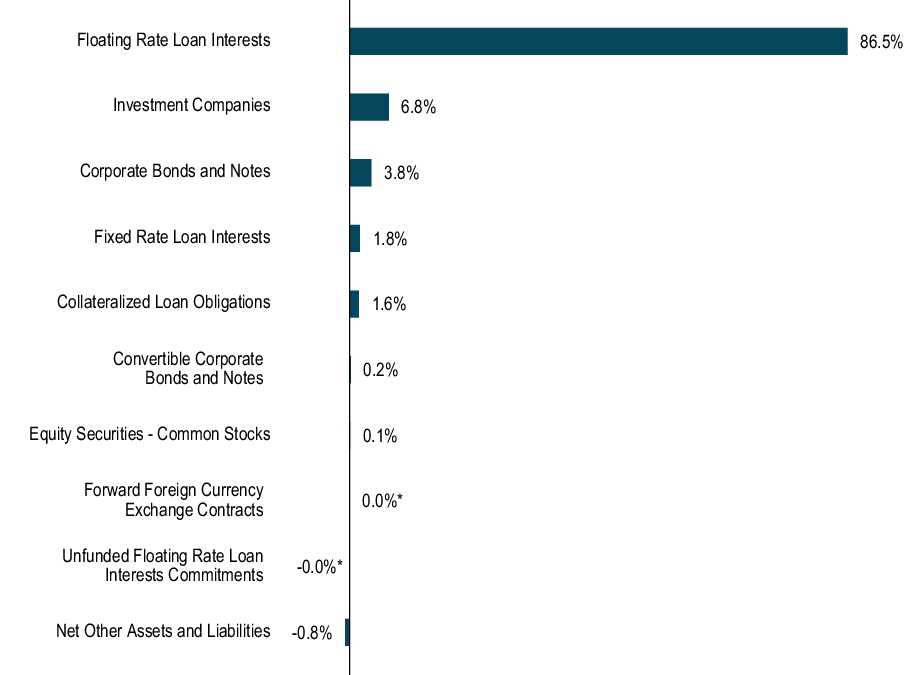
Portfolio Holdings (as of 2/28/26 )
Sector Allocation (Based on Net Assets)

Allocation of Holdings (Based on Net Assets)

* Amount represents less than .1%.
Changes in or Disagreements with Accountants
This is a summary of certain changes to the Fund since September 1, 2025 . For more complete information, you may review the Fund’s current prospectus dated December 31, 2025 at bny.com/investments/literaturecenter or upon request at 1-800-373-9387 .
For additional information about the Fund, including its prospectus, financial information, portfolio holdings and proxy voting information, please visit bny.com/investments/literaturecenter .
Not FDIC Insured. Not Bank-Guaranteed. May Lose Value
© 2026 BNY Mellon Securities Corporation, Distributor,
240 Greenwich Street, 9th Floor, New York, NY 10286
Code-6240SA0226

SEMI-ANNUAL
SHAREHOLDER
REPORT
SHAREHOLDER
REPORT
February 28, 2026
This report describes changes to the Fund that occurred during the reporting period.
What were the Fund’s costs for the last six months ?
(based on a hypothetical $10,000 investment)
| Share Class | Costs of a $10,000 investment | Costs paid as a percentage of a $10,000 investment |
| Class C* | $ |
| * |
During the period, fees were waived and/or expenses reimbursed pursuant to an agreement with the Fund’s investment adviser, BNY Mellon Investment Adviser, Inc. If this agreement is not extended in the future, expenses could be higher.
|
| ** |
Annualized.
|
KEY FUND STATISTICS (AS OF 2/28/26 )
Fund Size (Millions) |
Number of Holdings |
Portfolio Turnover |
| $ |
Portfolio Holdings (as of 2/28/26 )
Sector Allocation (Based on Net Assets)
Allocation of Holdings (Based on Net Assets)

* Amount represents less than .1%.
Changes in or Disagreements with Accountants
This is a summary of certain changes to the Fund since September 1, 2025 . For more complete information, you may review the Fund’s current prospectus dated December 31, 2025 at bny.com/investments/literaturecenter or upon request at 1-800-373-9387 .
For additional information about the Fund, including its prospectus, financial information, portfolio holdings and proxy voting information, please visit bny.com/investments/literaturecenter .
Not FDIC Insured. Not Bank-Guaranteed. May Lose Value
© 2026 BNY Mellon Securities Corporation, Distributor,
240 Greenwich Street, 9th Floor, New York, NY 10286
Code-6241SA0226
SEMI-ANNUAL
SHAREHOLDER
REPORT
SHAREHOLDER
REPORT
February 28, 2026
This report describes changes to the Fund that occurred during the reporting period.
What were the Fund’s costs for the last six months ?
(based on a hypothetical $10,000 investment)
| Share Class | Costs of a $10,000 investment | Costs paid as a percentage of a $10,000 investment |
| Class I* | $ |
| * |
During the period, fees were waived and/or expenses reimbursed pursuant to an agreement with the Fund’s investment adviser, BNY Mellon Investment Adviser, Inc. If this agreement is not extended in the future, expenses could be higher.
|
| ** |
Annualized.
|
KEY FUND STATISTICS (AS OF 2/28/26 )
Fund Size (Millions) |
Number of Holdings |
Portfolio Turnover |
| $ |
Portfolio Holdings (as of 2/28/26 )
Sector Allocation (Based on Net Assets)

Allocation of Holdings (Based on Net Assets)

* Amount represents less than .1%.
Changes in or Disagreements with Accountants
This is a summary of certain changes to the Fund since September 1, 2025 . For more complete information, you may review the Fund’s current prospectus dated December 31, 2025 at bny.com/investments/literaturecenter or upon request at 1-800-373-9387 .
For additional information about the Fund, including its prospectus, financial information, portfolio holdings and proxy voting information, please visit bny.com/investments/literaturecenter .
Not FDIC Insured. Not Bank-Guaranteed. May Lose Value
© 2026 BNY Mellon Securities Corporation, Distributor,
240 Greenwich Street, 9th Floor, New York, NY 10286
Code-6242SA0226
SEMI-ANNUAL
SHAREHOLDER
REPORT
SHAREHOLDER
REPORT
February 28, 2026
This report describes changes to the Fund that occurred during the reporting period.
What were the Fund’s costs for the last six months ?
(based on a hypothetical $10,000 investment)
| Share Class | Costs of a $10,000 investment | Costs paid as a percentage of a $10,000 investment |
| Class Y | $ |
| * |
Annualized.
|
KEY FUND STATISTICS (AS OF 2/28/26 )
Fund Size (Millions) |
Number of Holdings |
Portfolio Turnover |
| $ |
Portfolio Holdings (as of 2/28/26 )
Sector Allocation (Based on Net Assets)

Allocation of Holdings (Based on Net Assets)
* Amount represents less than .1%.
Changes in or Disagreements with Accountants
This is a summary of certain changes to the Fund since September 1, 2025 . For more complete information, you may review the Fund’s current prospectus dated December 31, 2025 at bny.com/investments/literaturecenter or upon request at 1-800-373-9387 .
For additional information about the Fund, including its prospectus, financial information, portfolio holdings and proxy voting information, please visit bny.com/investments/literaturecenter .
Not FDIC Insured. Not Bank-Guaranteed. May Lose Value
© 2026 BNY Mellon Securities Corporation, Distributor,
240 Greenwich Street, 9th Floor, New York, NY 10286
Code-0332SA0226
