Prospectus

•
Voya Government Liquid Assets Portfolio
Class/Ticker: I/IPLXX; S/ISPXX; S2/ITLXX
•
Voya High Yield Portfolio
Class/Ticker: ADV/IPYAX; I/IPIMX; S/IPHYX; S2/IPYSX
•
Voya Large Cap Growth Portfolio
Class/Ticker: ADV/IEOPX; I/IEOHX; R6/VRLCX; S/IEOSX; S2/IEOTX
•
Voya Limited Maturity Bond Portfolio
Class/Ticker: ADV/IMBAX; I/ILBPX; S/ILMBX
•
Voya U.S. Stock Index Portfolio
Class/Ticker: ADV/ISIVX; I/INGIX; S/ISJBX; S2/ISIPX
•
VY® CBRE Global Real Estate Portfolio
Class/Ticker: ADV/ICRNX; I/IRGIX; S/IRGTX; S2/IRGSX
•
VY® Columbia Real Estate Portfolio
Class/Ticker: ADV/ICRPX; I/IVRIX; S/IVRSX; S2/IVRTX
•
VY® Invesco Growth and Income Portfolio
Class/Ticker: ADV/IVGAX; I/IVGIX; S/IVGSX; S2/IVITX
•
VY® JPMorgan Emerging Markets Equity Portfolio
Class/Ticker: ADV/IJEAX; I/IJEMX; S/IJPIX; S2/IJPTX
•
VY® JPMorgan Small Cap Core Equity Portfolio
Class/Ticker: ADV/IJSAX; I/IJSIX; R6/VPRSX; S/IJSSX; S2/IJSTX
•
VY® Morgan Stanley Global Franchise Portfolio
Class/Ticker: ADV/IGFAX; R6/VPRDX; S/IVGTX; S2/IGFSX
•
VY® T. Rowe Price Capital Appreciation Portfolio
Class/Ticker: ADV/ITRAX; I/ITRIX; R6/VPRAX; S/ITCSX; S2/ITCTX
Each Portfolio's shares may be offered to insurance company separate accounts serving as investment options under variable annuity contracts and variable life insurance policies (“Variable Contracts”), qualified pension and retirement plans (“Qualified Plans”), custodial accounts, and certain investment advisers and their affiliates in connection with the creation or management of the Portfolios, other investment companies, and other permitted investors.
NOT ALL PORTFOLIOS MAY BE AVAILABLE IN ALL JURISDICTIONS, UNDER ALL VARIABLE CONTRACTS OR UNDER ALL QUALIFIED PLANS.
The U.S. Securities and Exchange Commission (the “SEC”) has not approved or disapproved these securities nor has the SEC judged whether the information in this Prospectus is accurate or adequate. Any representation to the contrary is a criminal offense.

Table of Contents
|
SUMMARY SECTION
|
|
|
1 | |
|
6 | |
|
14 | |
|
21 | |
|
29 | |
|
35 | |
|
42 | |
|
50 | |
|
56 | |
|
65 | |
|
73 | |
|
79 | |
|
88 | |
|
88 | |
|
88 | |
|
89 | |
|
89 | |
|
89 | |
|
89 | |
|
89 | |
|
90 | |
|
90 | |
|
90 | |
|
90 | |
|
92 | |
|
108 | |
|
111 | |
|
112 | |
|
112 | |
|
112 | |
|
114 | |
|
124 | |
|
124 | |
|
125 | |
|
126 | |
|
126 | |
|
128 | |
|
129 | |
|
130 | |
|
131 | |
|
135 | |
|
145 | |
|
Back Cover |
Expenses you pay each year as a % of the value of your investment
|
Class |
|
I |
S |
S2 |
|
Management Fees |
% |
|
|
|
|
Distribution and/or Shareholder Services (12b-1) Fees |
% |
|
|
|
|
Other Expenses |
% |
|
|
|
|
Total Annual Portfolio Operating Expenses |
% |
|
|
|
|
Waivers and Reimbursements1 |
% |
|
|
|
|
Total Annual Portfolio Operating Expenses After
Waivers and Reimbursements |
% |
|
|
|
1
|
Class |
|
1 Yr |
3 Yrs |
5 Yrs |
10 Yrs |
|
I |
$ |
|
|
|
|
|
S |
$ |
|
|
|
|
|
S2 |
$ |
|
|
|
|
1
Voya Government Liquid Assets Portfolio
Principal Risks
Any of the following risks, among others, could affect Portfolio performance or cause the Portfolio to lose money or to underperform market averages of other funds. The principal risks are presented in alphabetical order to facilitate readability, and their order does not imply that the realization of one risk is more likely to occur or have a greater adverse impact than another risk.
Voya Government Liquid Assets Portfolio
2
Voya Government Liquid Assets Portfolio
3
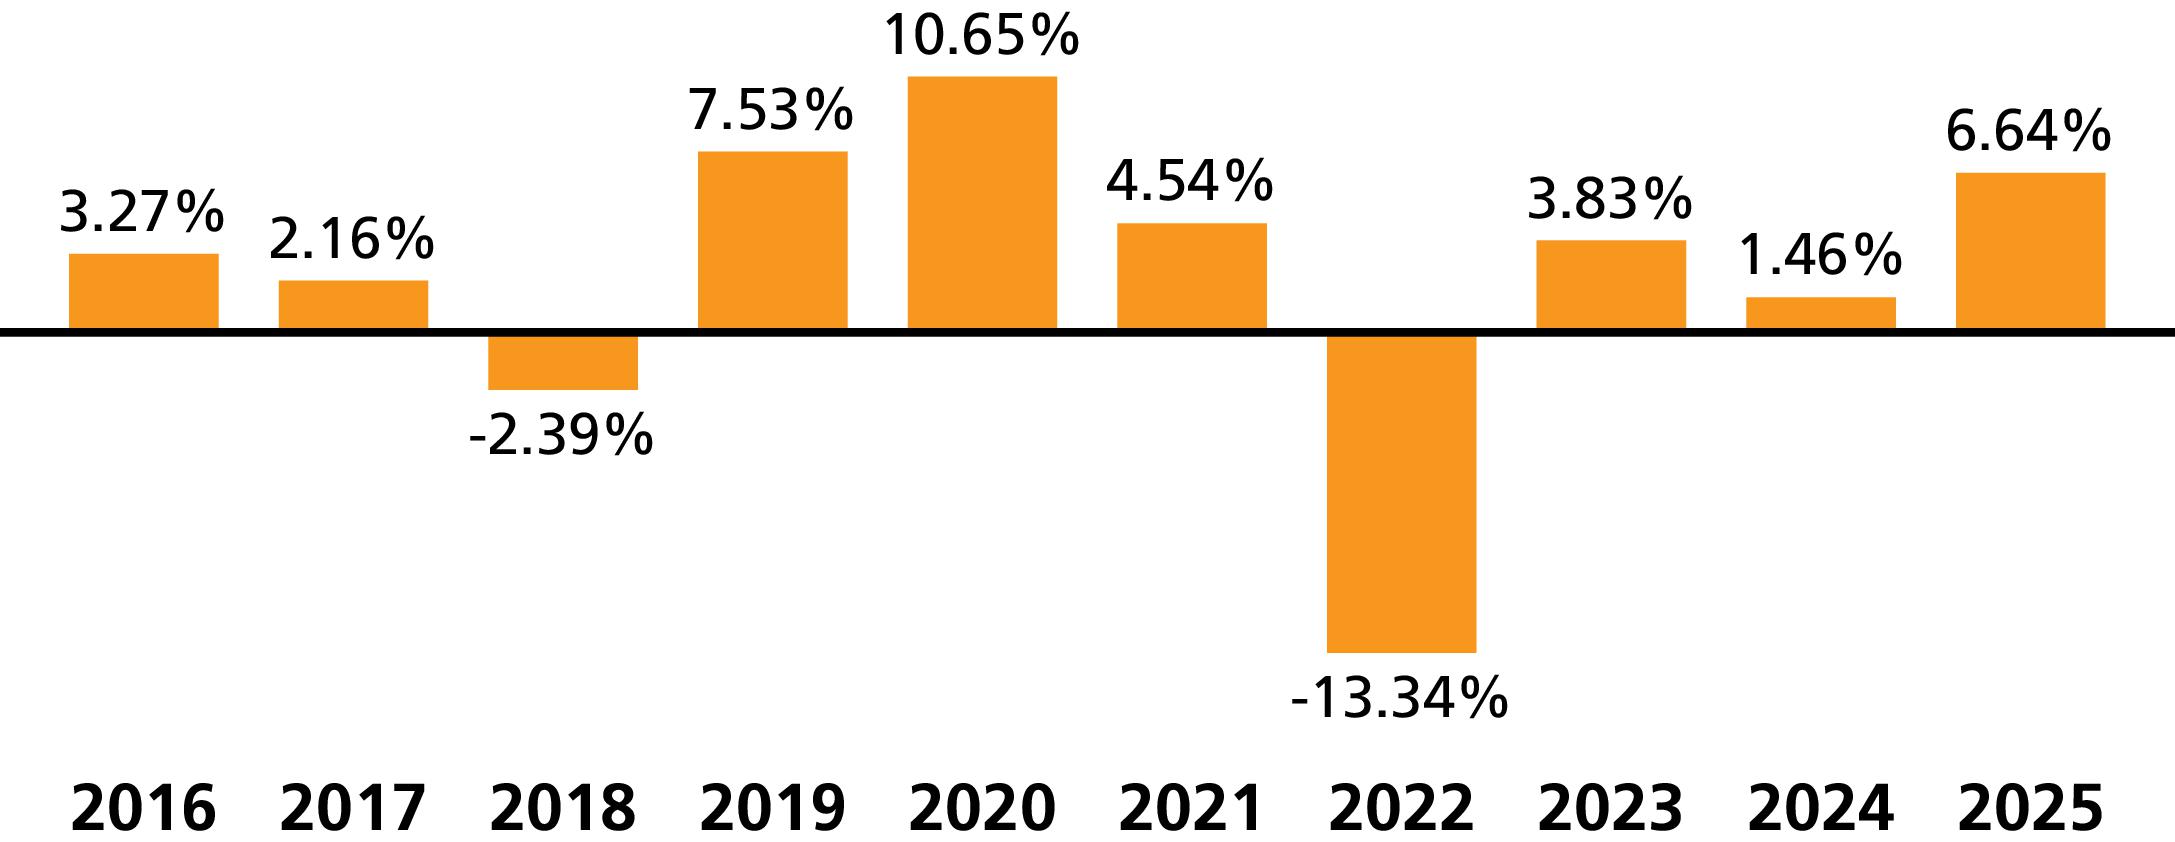
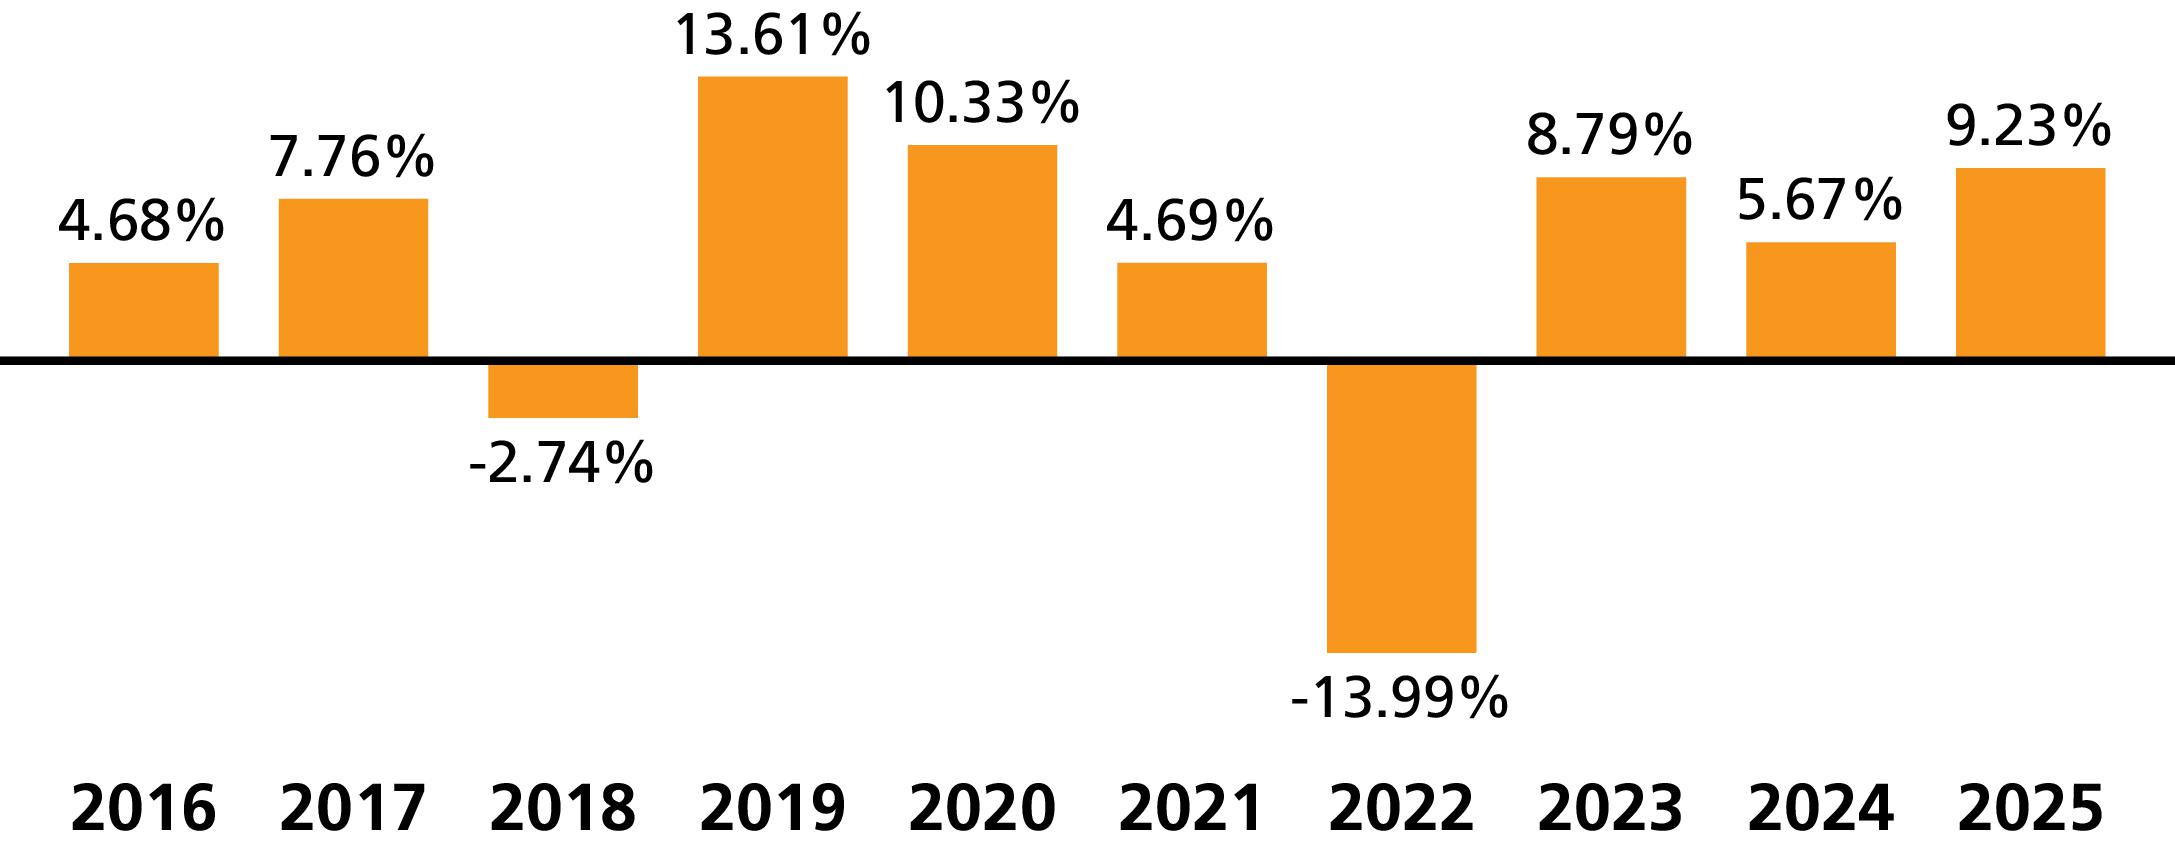
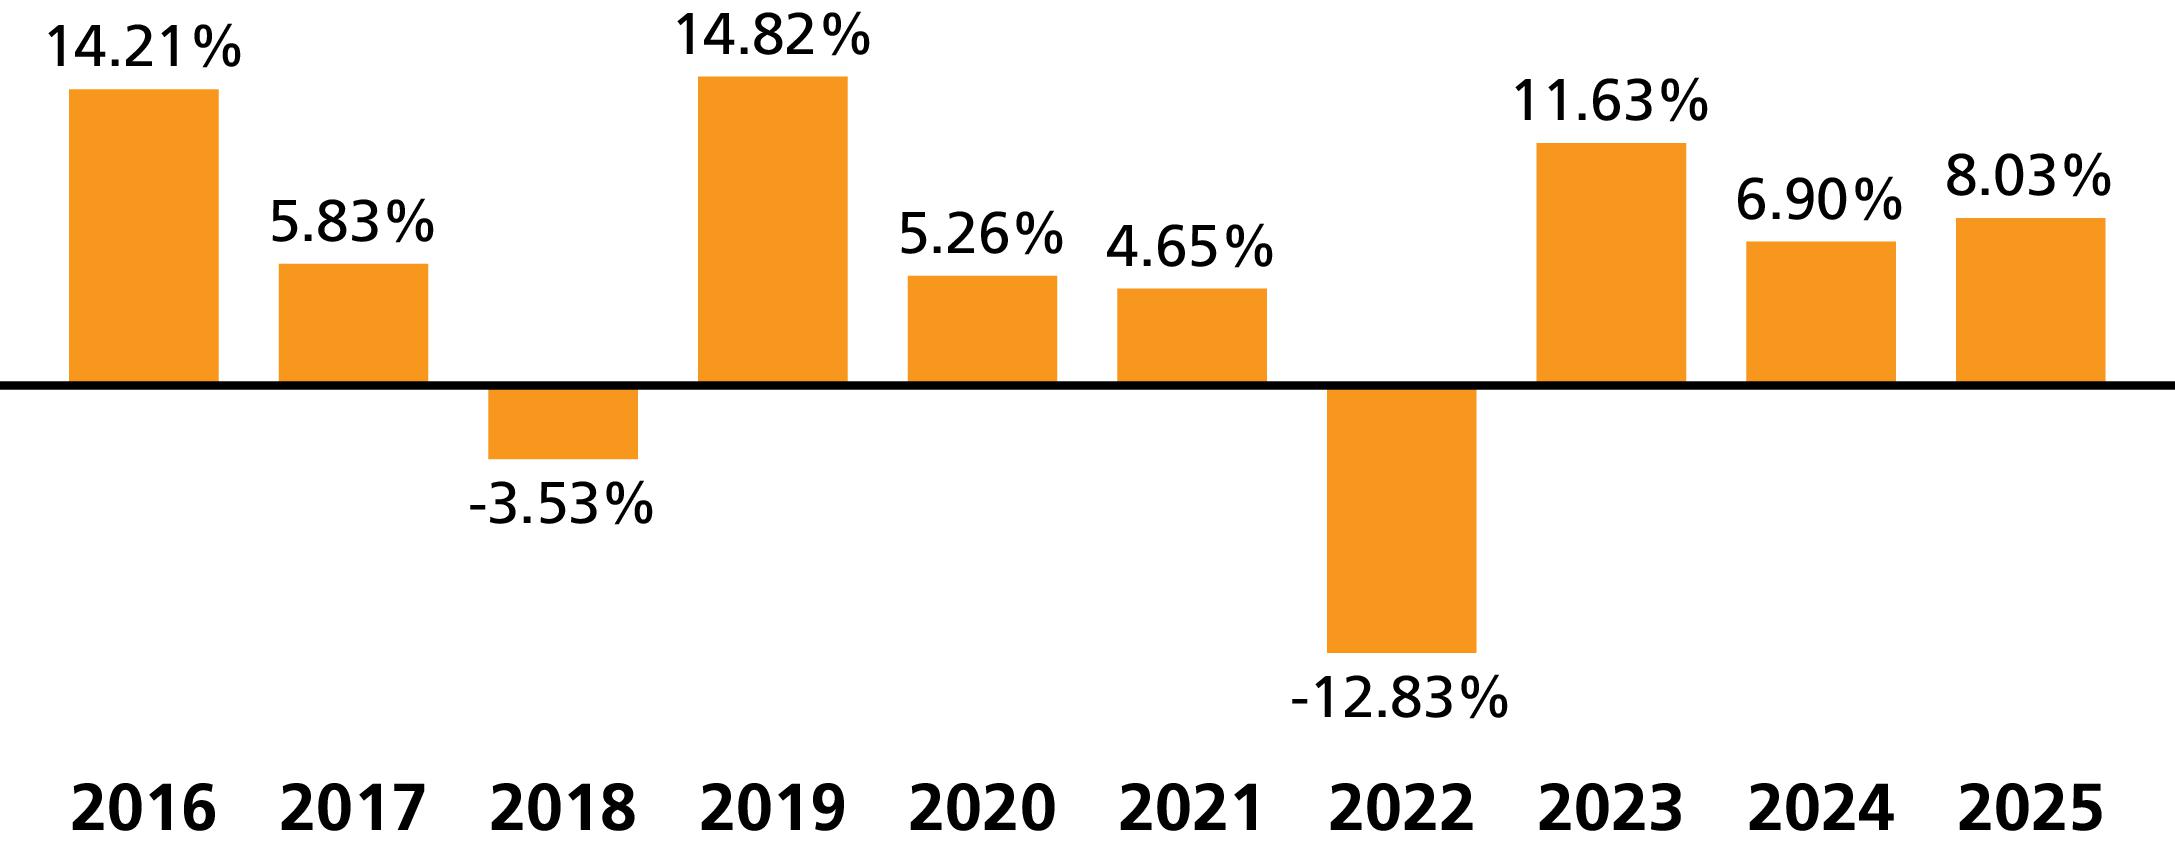
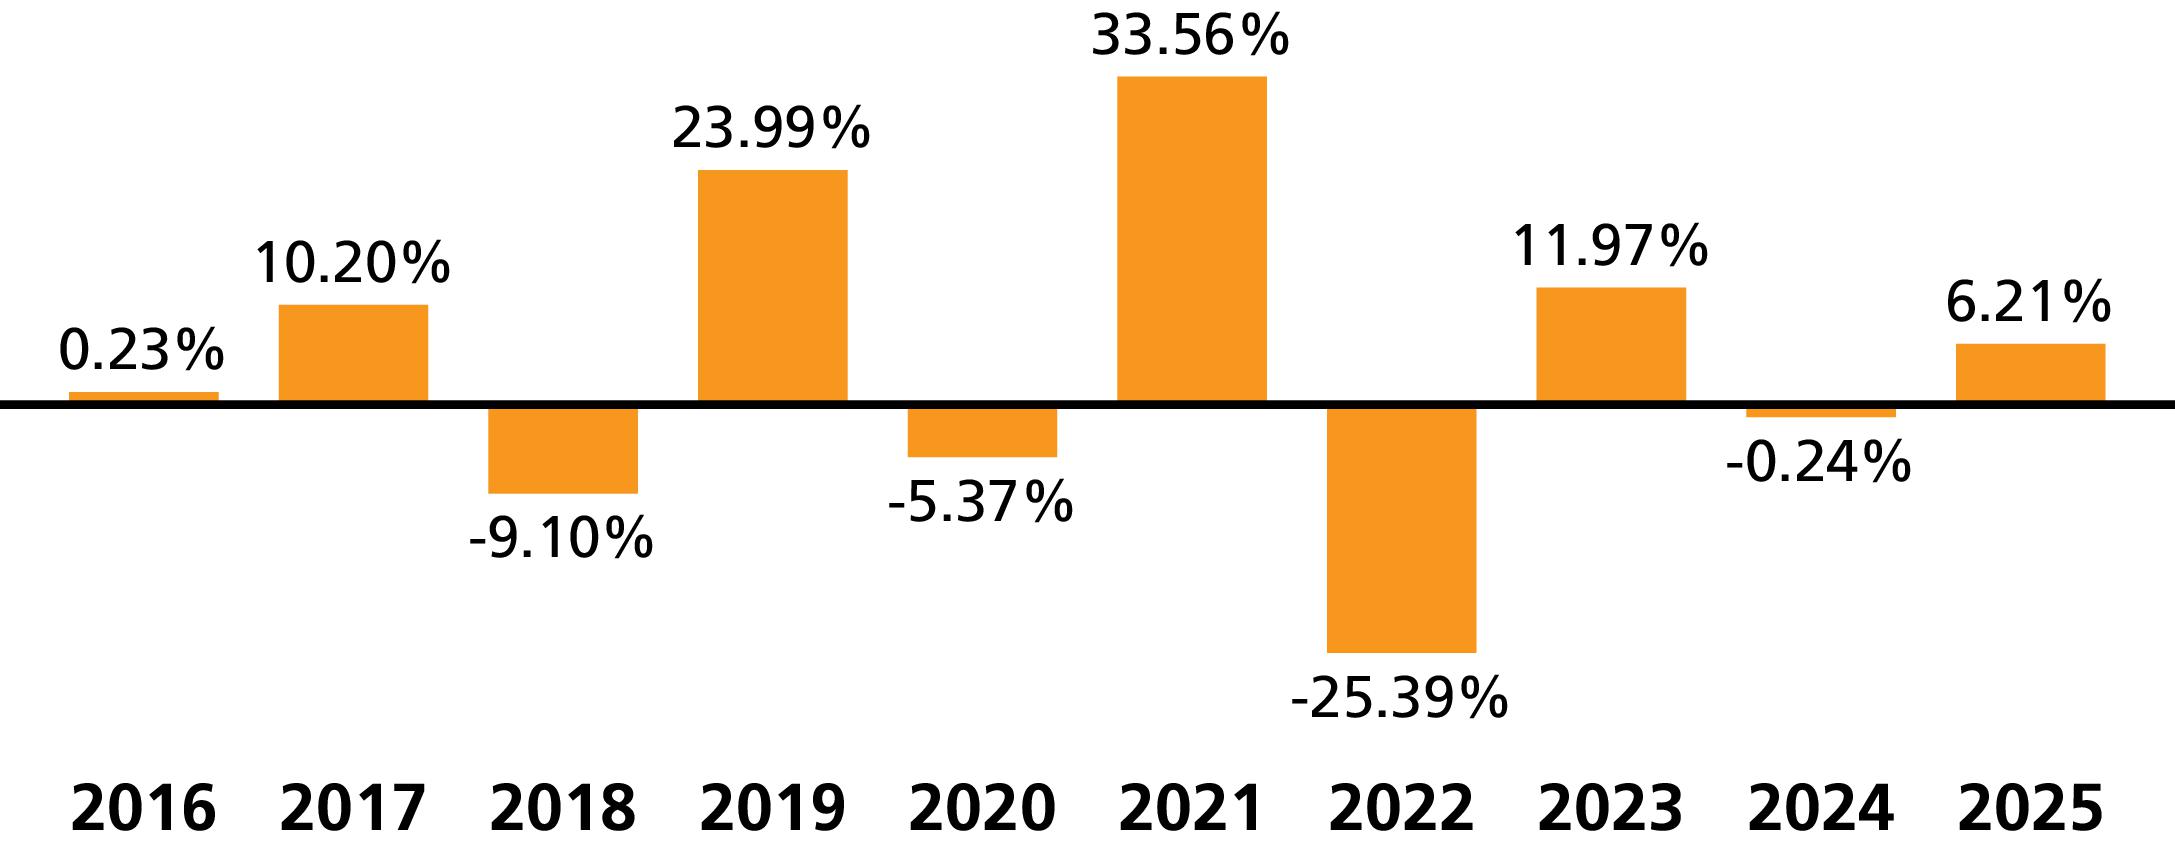
(as of December 31 of each year)
|
|
|
|
|
|
|
|
Voya Government Liquid Assets Portfolio
4
(for the periods ended December 31, 2025)
|
|
|
1 Yr |
5 Yrs |
10 Yrs |
Since
Inception |
Inception
Date |
|
Class I |
% |
|
|
|
N/A |
|
|
Class S |
% |
|
|
|
N/A |
|
|
Class S2 |
% |
|
|
|
N/A |
|
Portfolio Management
|
Investment Adviser |
|
Voya Investments, LLC |
|
Sub-Adviser |
|
Voya Investment Management Co. LLC |
|
Portfolio Managers |
|
|
Andrew Higley, CFA
Portfolio Manager (since 5/2026) |
Don Schatz
Portfolio Manager (since 5/2026) |
|
David S. Yealy
Portfolio Manager (since 11/2004) |
|
Purchase and Sale of Portfolio Shares
Shares of the Portfolio are not offered directly to the public. Purchase and sale of shares may be made only by separate accounts of insurance companies serving as investment options under Variable Contracts or by Qualified Plans, custodian accounts, and certain investment advisers and their affiliates, other investment companies, or permitted investors. Please refer to the prospectus for the appropriate insurance company separate account, investment company, or your plan documents for information on how to direct investments in, or sale from, an investment option corresponding to the Portfolio and any fees that may apply. Participating insurance companies and certain other designated organizations are authorized to receive purchase orders on the Portfolio's behalf.
Tax Information
Distributions made by the Portfolio to a Variable Contract or Qualified Plan, and exchanges and redemptions of Portfolio shares made by a Variable Contract or Qualified Plan, ordinarily do not cause the corresponding contract holder or plan participant to recognize income or gain for U.S. federal income tax purposes. See the Variable Contract prospectus or the governing documents of your Qualified Plan for information regarding the U.S. federal income tax treatment of the distributions to your Variable Contract or Qualified Plan and the holders of the contracts or plan participants.
Payments to Broker-Dealers and Other Financial Intermediaries
If you invest in the Portfolio through a Variable Contract issued by an insurance company or through a Qualified Plan that, in turn, was purchased or serviced through an insurance company, broker-dealer or other financial intermediary, the Portfolio and its Investment Adviser or distributor or their affiliates may: (1) make payments to the insurance company issuer of the Variable Contract or to the company servicing the Qualified Plan and (2) make payments to the insurance company, broker-dealer, or other financial intermediary. These payments may create a conflict of interest by: (1) influencing the insurance company or the company servicing the Qualified Plan to make the Portfolio available as an investment option for the Variable Contract or the Qualified Plan or (2) influencing the broker-dealer or other intermediary and your salesperson to recommend the Variable Contract or the pension servicing agent and/or the Portfolio over other options. Ask your salesperson or Qualified Plan administrator or visit your financial intermediary's website for more information.
Voya Government Liquid Assets Portfolio
5
Expenses you pay each year as a % of the value of your investment
|
Class |
|
ADV |
I |
S |
S2 |
|
Management Fees |
% |
|
|
|
|
|
Distribution and/or Shareholder Services (12b-1) Fees |
% |
|
|
|
|
|
Other Expenses |
% |
|
|
|
|
|
Total Annual Portfolio Operating Expenses |
% |
|
|
|
|
1
|
Class |
|
1 Yr |
3 Yrs |
5 Yrs |
10 Yrs |
|
ADV |
$ |
|
|
|
|
|
I |
$ |
|
|
|
|
|
S |
$ |
|
|
|
|
|
S2 |
$ |
|
|
|
|
6
Voya High Yield Portfolio
Principal Risks
Voya High Yield Portfolio
7
Voya High Yield Portfolio
8
Voya High Yield Portfolio
9
Voya High Yield Portfolio
10
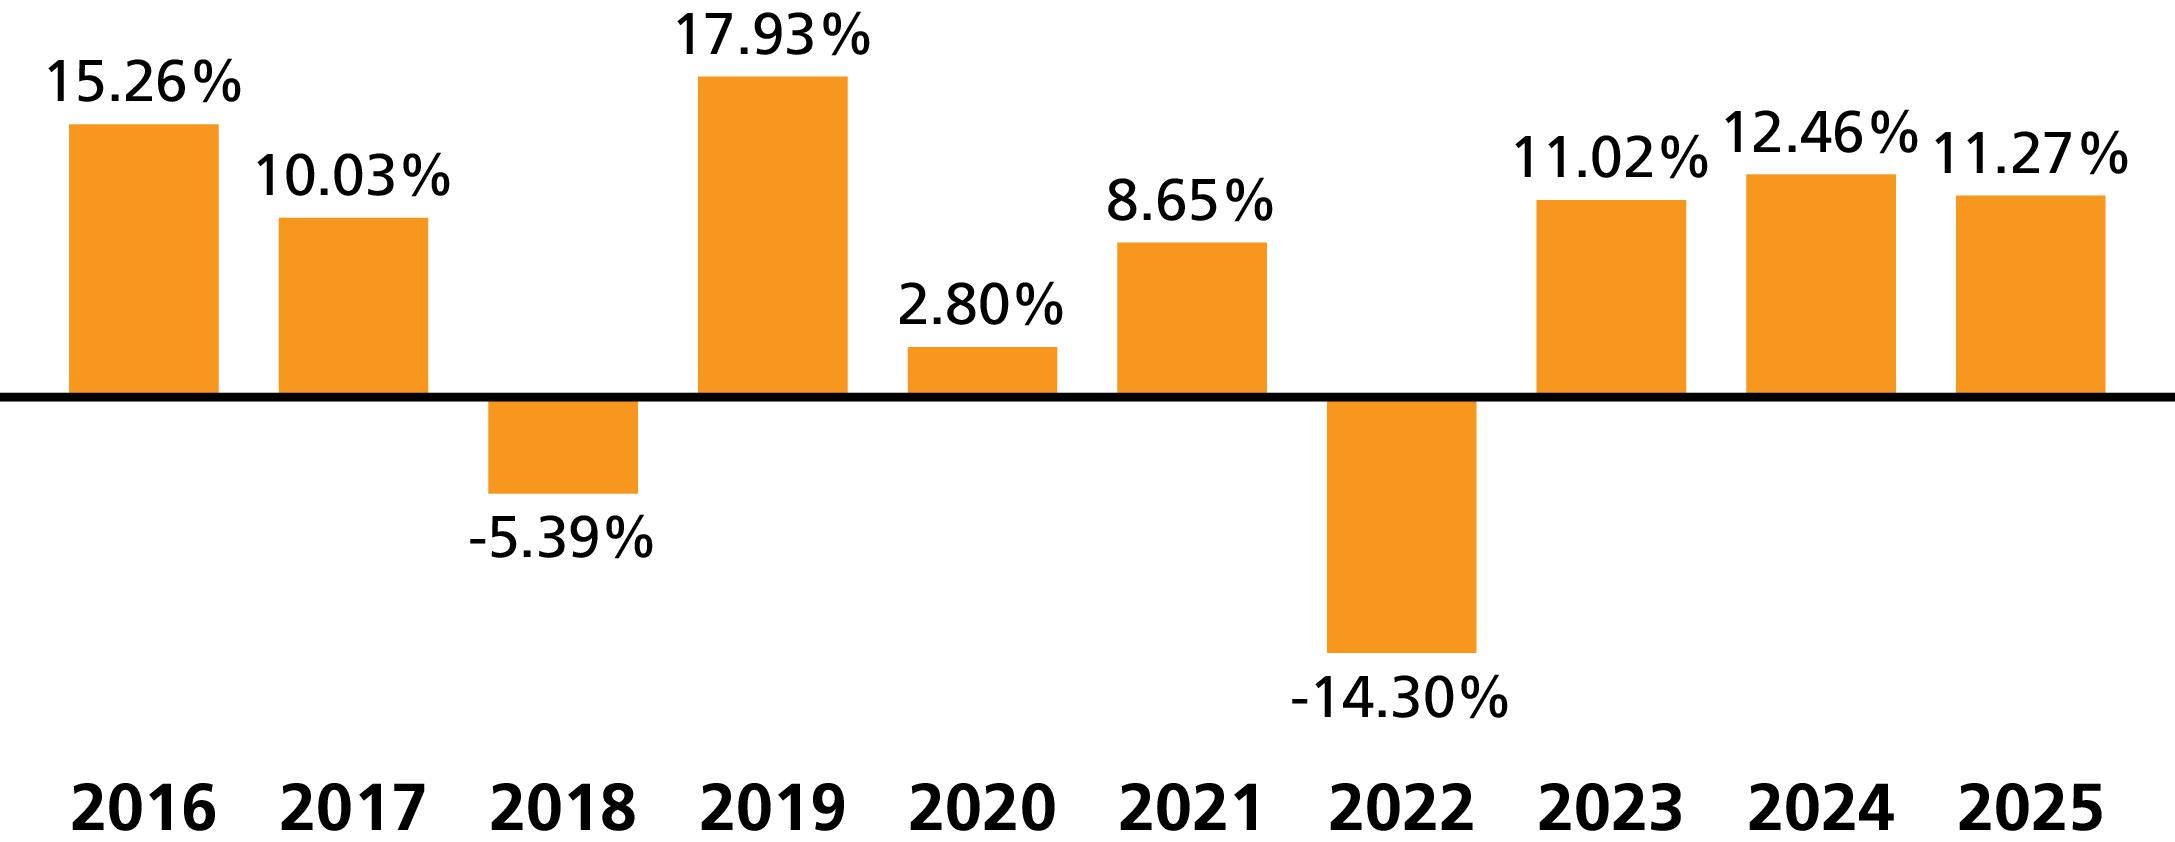
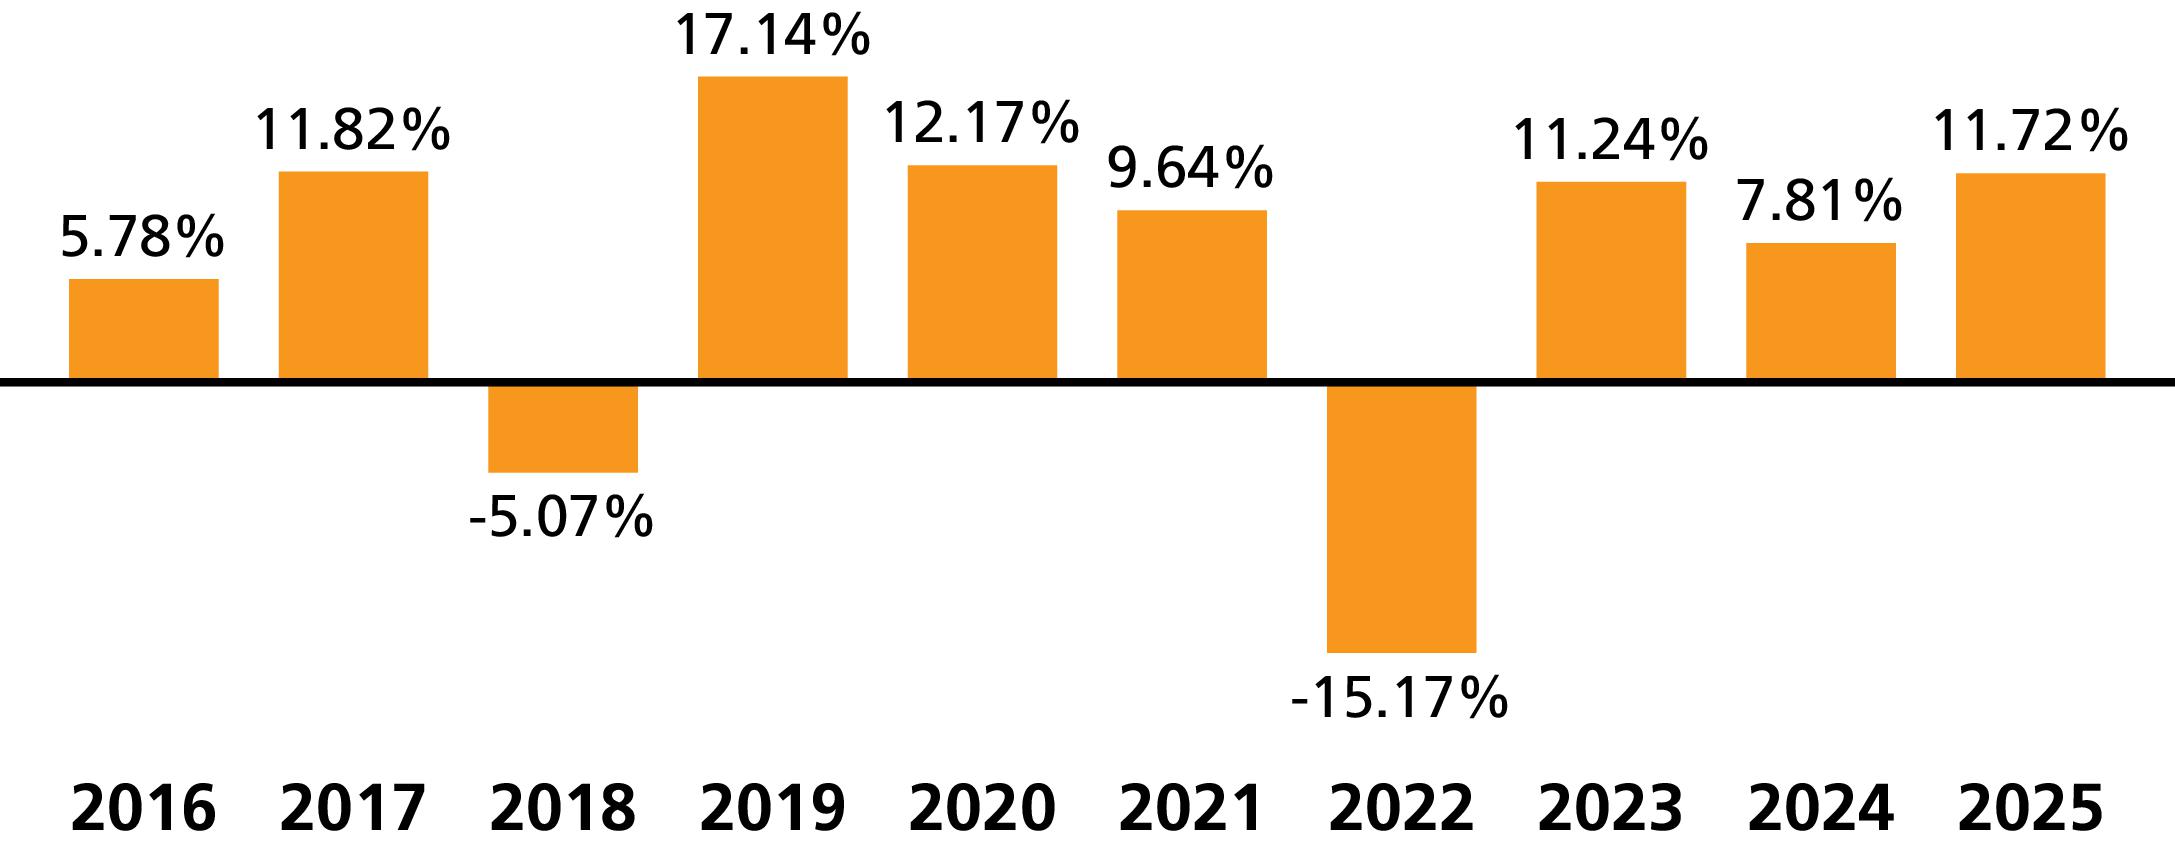
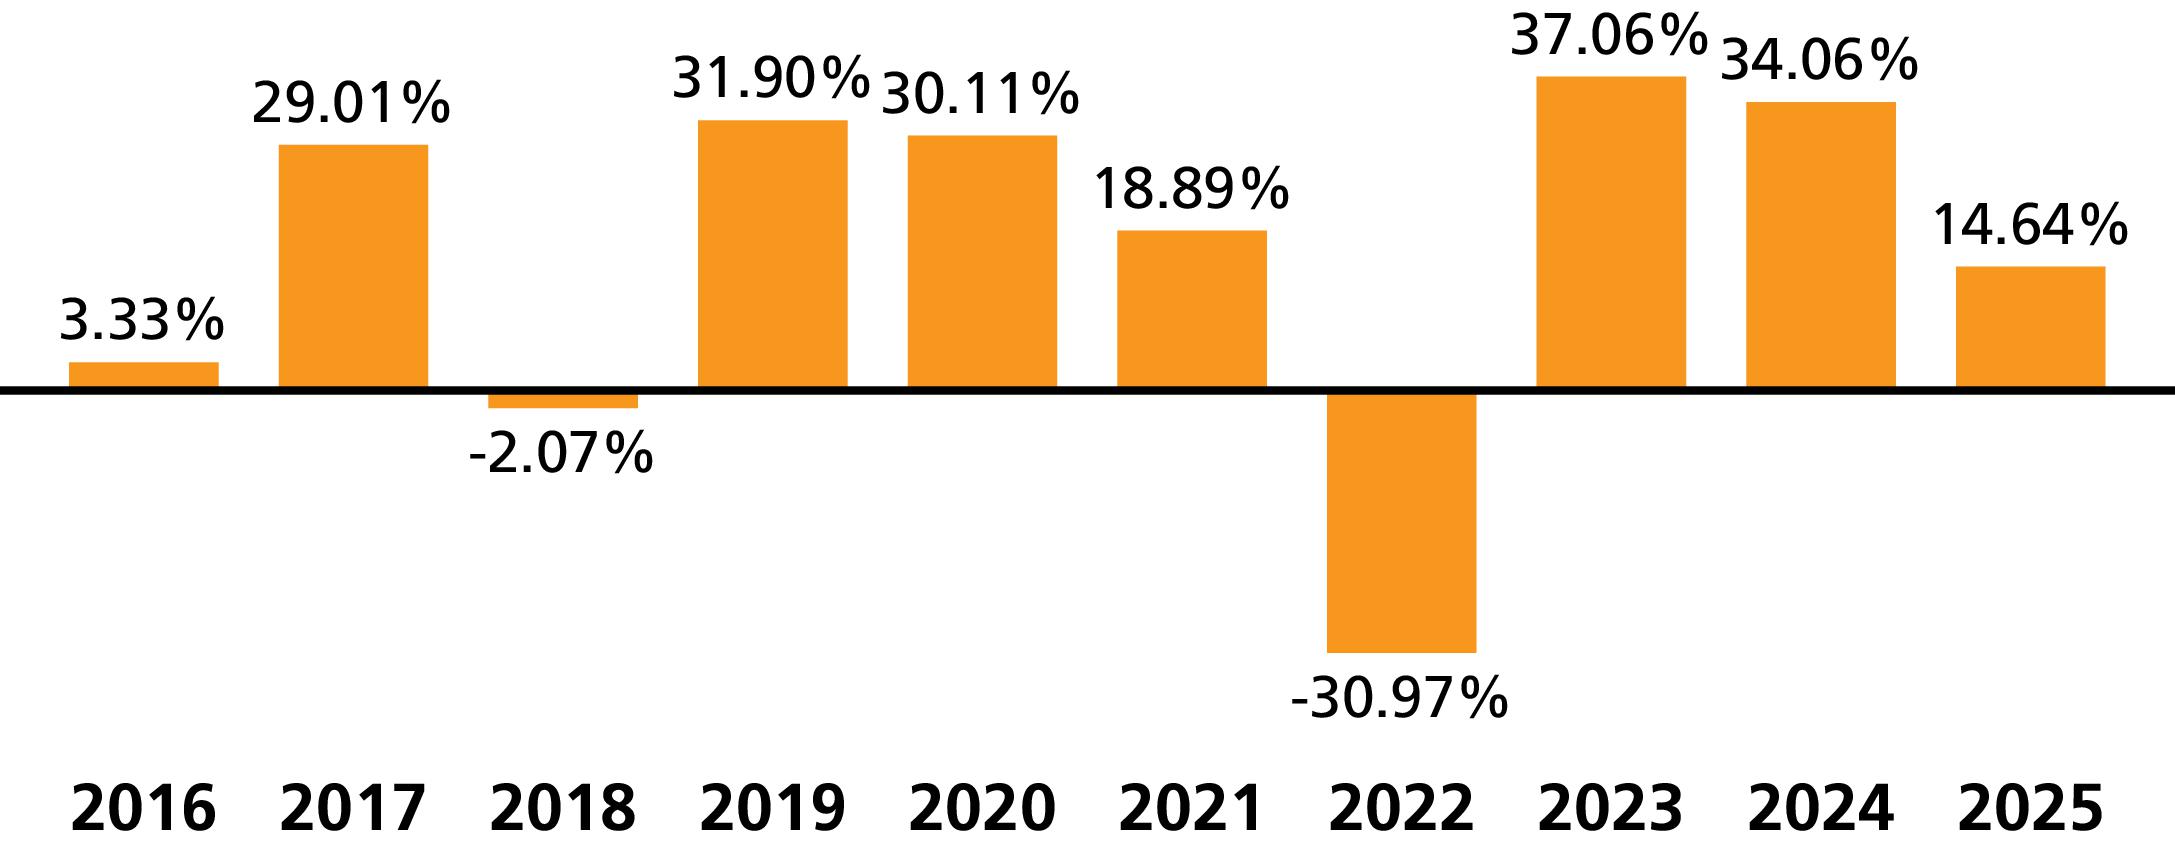
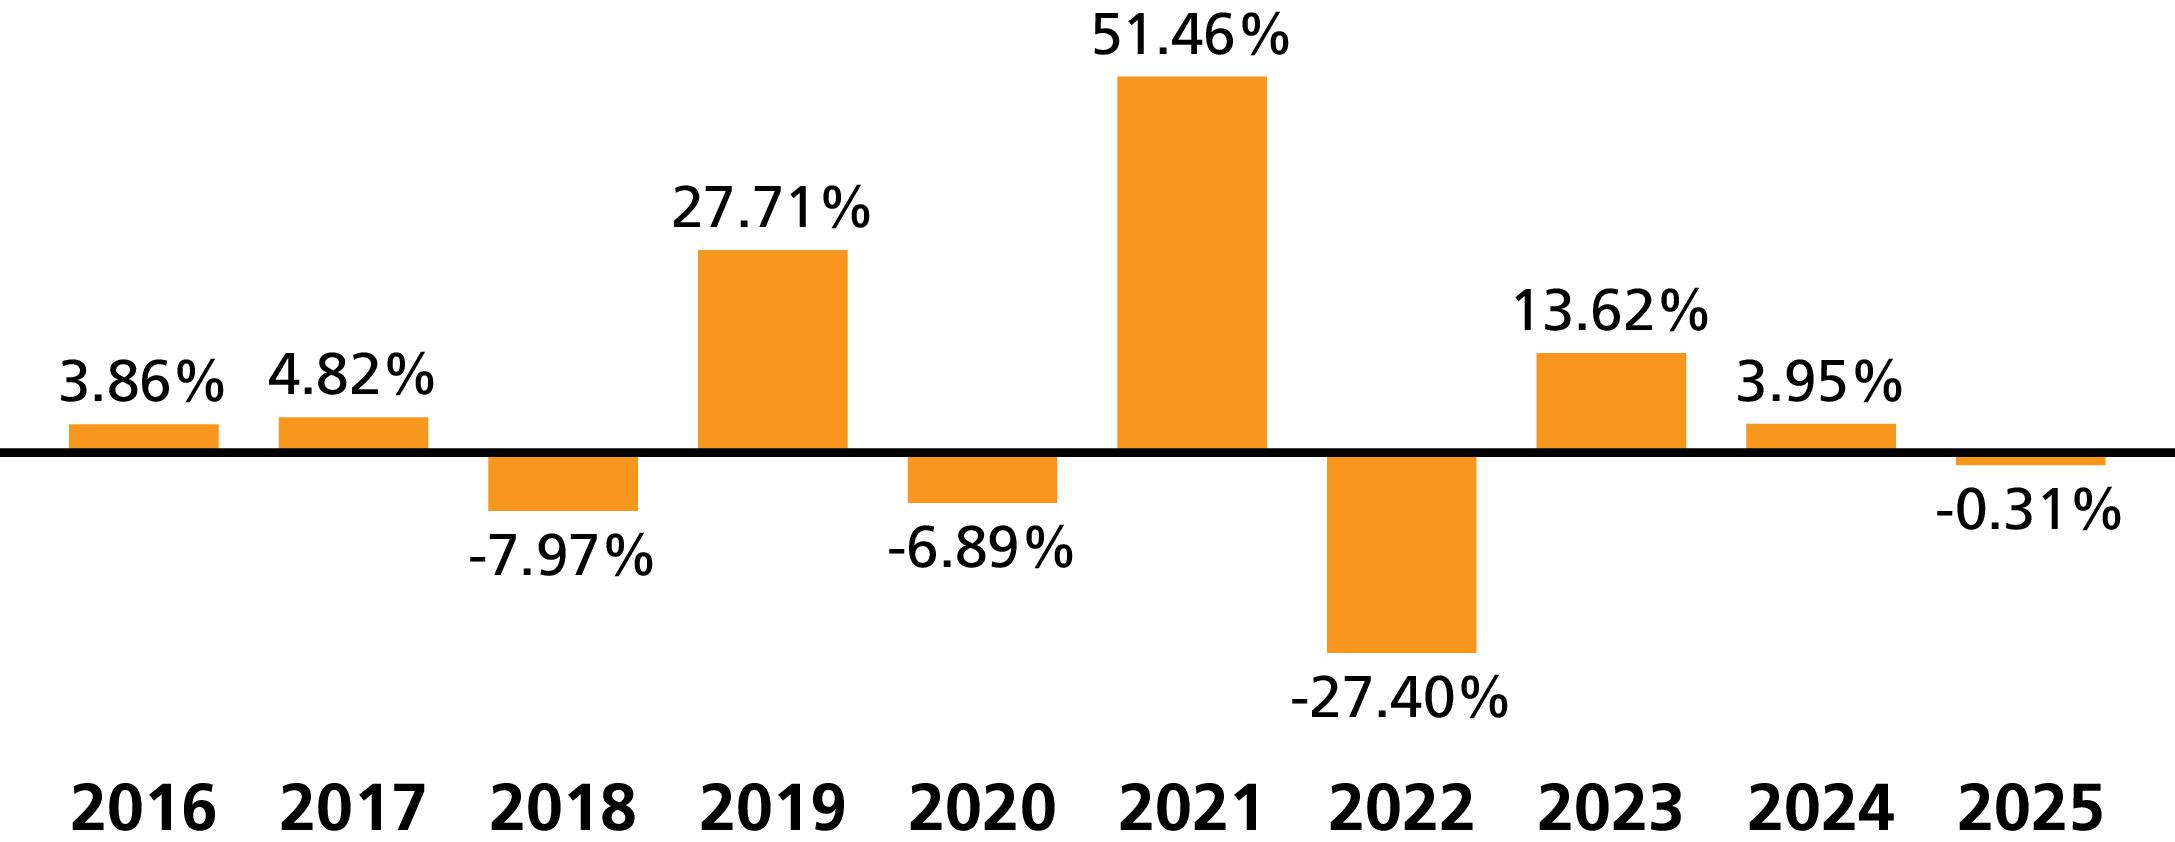
(as of December 31 of each year)
|
|
|
|
|
|
|
|
Voya High Yield Portfolio
11
(for the periods ended December 31, 2025)
|
|
|
1 Yr |
5 Yrs |
10 Yrs |
Since
Inception |
Inception
Date |
|
Class ADV |
% |
|
|
|
N/A |
|
|
Bloomberg U.S. Aggregate Bond Index1 |
% |
|
- |
|
N/A |
|
|
ICE BofA U.S. High Yield Index1,2 |
% |
|
|
|
N/A |
|
|
Bloomberg High Yield Bond - 2% Issuer Constrained Composite Index1 |
% |
|
|
|
N/A |
|
|
Class I |
% |
|
|
|
N/A |
|
|
Bloomberg U.S. Aggregate Bond Index1 |
% |
|
- |
|
N/A |
|
|
ICE BofA U.S. High Yield Index1,2 |
% |
|
|
|
N/A |
|
|
Bloomberg High Yield Bond - 2% Issuer Constrained Composite Index1 |
% |
|
|
|
N/A |
|
|
Class S |
% |
|
|
|
N/A |
|
|
Bloomberg U.S. Aggregate Bond Index1 |
% |
|
- |
|
N/A |
|
|
ICE BofA U.S. High Yield Index1,2 |
% |
|
|
|
N/A |
|
|
Bloomberg High Yield Bond - 2% Issuer Constrained Composite Index1 |
% |
|
|
|
N/A |
|
|
Class S2 |
% |
|
|
|
N/A |
|
|
Bloomberg U.S. Aggregate Bond Index1 |
% |
|
- |
|
N/A |
|
|
ICE BofA U.S. High Yield Index1,2 |
% |
|
|
|
N/A |
|
|
Bloomberg High Yield Bond - 2% Issuer Constrained Composite Index1 |
% |
|
|
|
N/A |
|
1
2
Portfolio Management
|
Investment Adviser |
|
Voya Investments, LLC |
|
Sub-Adviser |
|
Voya Investment Management Co. LLC |
|
Portfolio Managers |
|
|
Justin Kass, CFA
Portfolio Manager (since 6/2025) |
David J. Oberto
Portfolio Manager (since 6/2025) |
|
Ethan Turner, CFA
Portfolio Manager (since 6/2025) |
|
Purchase and Sale of Portfolio Shares
Shares of the Portfolio are not offered directly to the public. Purchase and sale of shares may be made only by separate accounts of insurance companies serving as investment options under Variable Contracts or by Qualified Plans, custodian accounts, and certain investment advisers and their affiliates, other investment companies, or permitted investors. Please refer to the prospectus for the appropriate insurance company separate account, investment company, or your plan documents for information on how to direct investments in, or sale from, an investment option corresponding to the Portfolio and any fees that may apply. Participating insurance companies and certain other designated organizations are authorized to receive purchase orders on the Portfolio's behalf.
Tax Information
Distributions made by the Portfolio to a Variable Contract or Qualified Plan, and exchanges and redemptions of Portfolio shares made by a Variable Contract or Qualified Plan, ordinarily do not cause the corresponding contract holder or plan participant to recognize income or gain for U.S. federal income tax purposes. See the Variable Contract prospectus or the governing documents of your Qualified Plan for information regarding the U.S. federal income tax treatment of the distributions to your Variable Contract or Qualified Plan and the holders of the contracts or plan participants.
Payments to Broker-Dealers and Other Financial Intermediaries
If you invest in the Portfolio through a Variable Contract issued by an insurance company or through a Qualified Plan that, in turn, was purchased or serviced through an insurance company, broker-dealer or other financial intermediary, the Portfolio and its Investment Adviser or distributor or their affiliates may: (1) make payments to the insurance company issuer of the Variable Contract or to the company servicing the Qualified Plan and (2) make payments to the insurance company, broker-dealer, or other financial intermediary. These payments may create a conflict of interest by: (1) influencing the insurance company
Voya High Yield Portfolio
12
or the company servicing the Qualified Plan to make the Portfolio available as an investment option for the Variable Contract or the Qualified Plan or (2) influencing the broker-dealer or other intermediary and your salesperson to recommend the Variable Contract or the pension servicing agent and/or the Portfolio over other options. Ask your salesperson or Qualified Plan administrator or visit your financial intermediary's website for more information.
Voya High Yield Portfolio
13
Expenses you pay each year as a % of the value of your investment
|
Class |
|
ADV |
I |
R6 |
S |
S2 |
|
Management Fees |
% |
|
|
|
|
|
|
Distribution and/or Shareholder Services (12b-1) Fees |
% |
|
|
|
|
|
|
Other Expenses |
% |
|
|
|
|
|
|
Total Annual Portfolio Operating Expenses |
% |
|
|
|
|
|
|
Waivers and Reimbursements1 |
% |
( |
( |
( |
( |
( |
|
Total Annual Portfolio Operating Expenses After
Waivers and Reimbursements |
% |
|
|
|
|
|
1
|
Class |
|
1 Yr |
3 Yrs |
5 Yrs |
10 Yrs |
|
ADV |
$ |
|
|
|
|
|
I |
$ |
|
|
|
|
|
R6 |
$ |
|
|
|
|
|
S |
$ |
|
|
|
|
|
S2 |
$ |
|
|
|
|
14
Voya Large Cap Growth Portfolio
Principal Risks
Voya Large Cap Growth Portfolio
15
Voya Large Cap Growth Portfolio
16
Voya Large Cap Growth Portfolio
17
Voya Large Cap Growth Portfolio
18
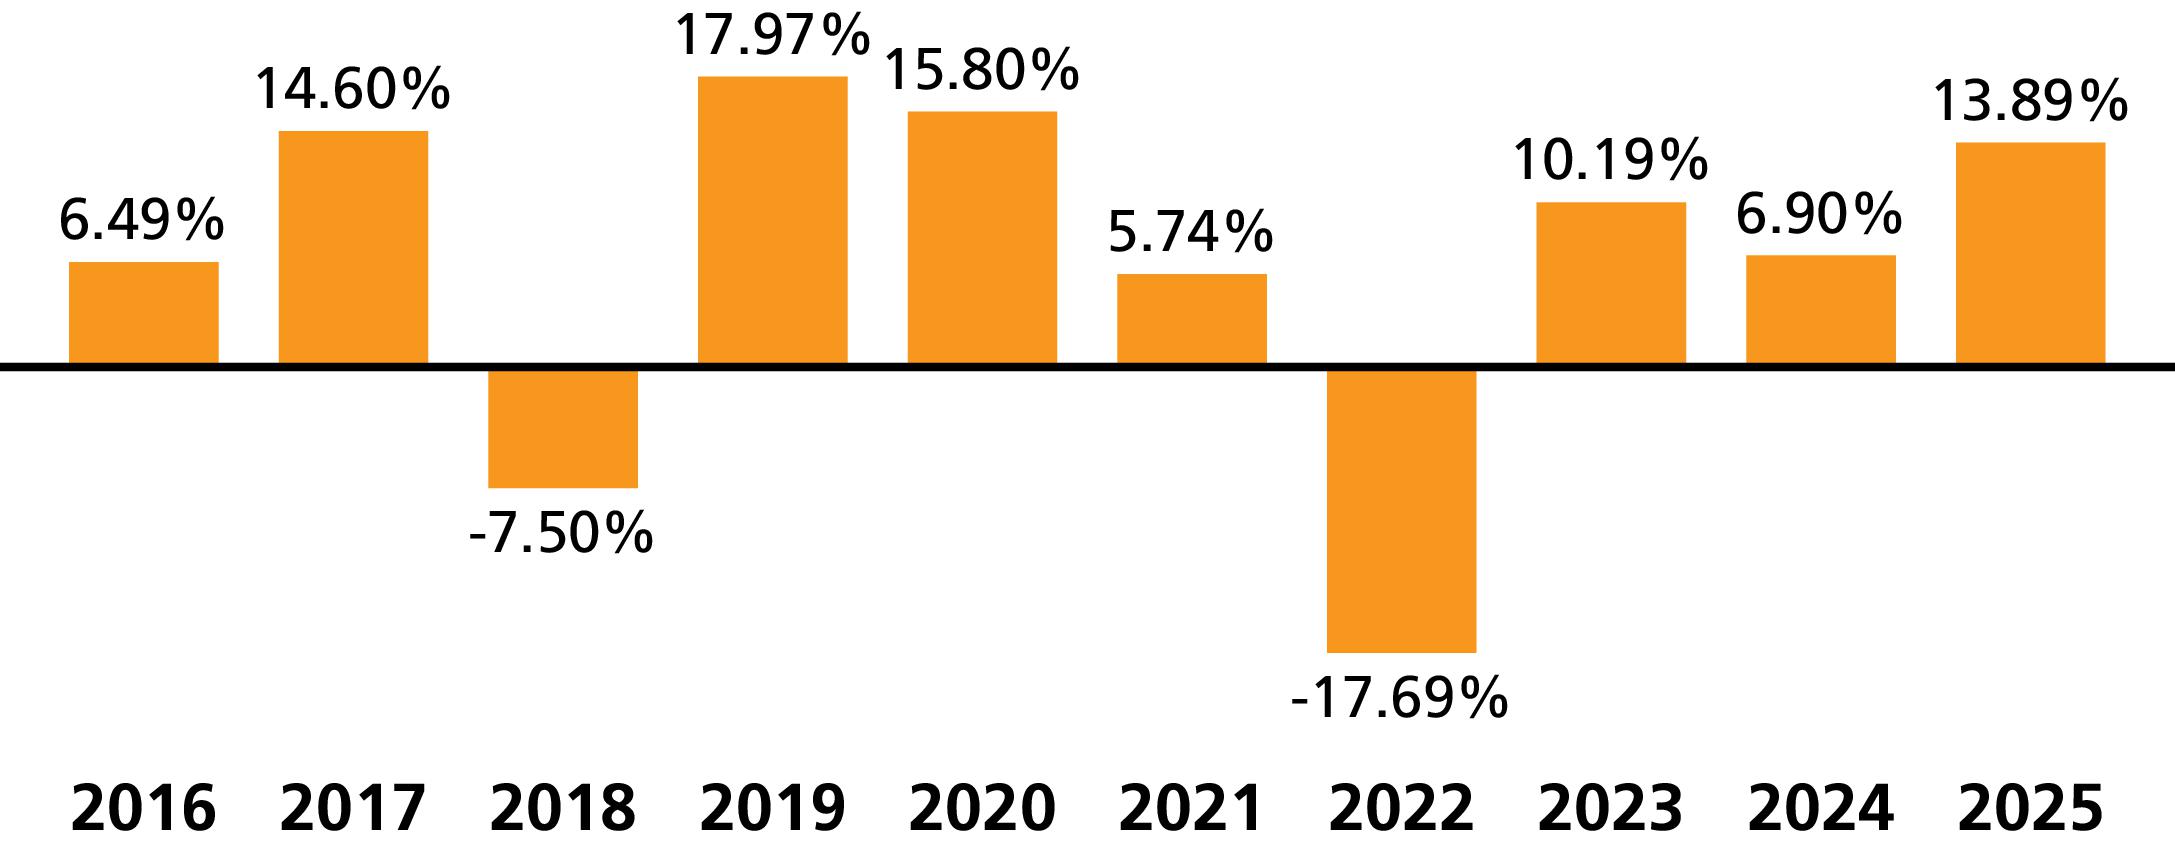
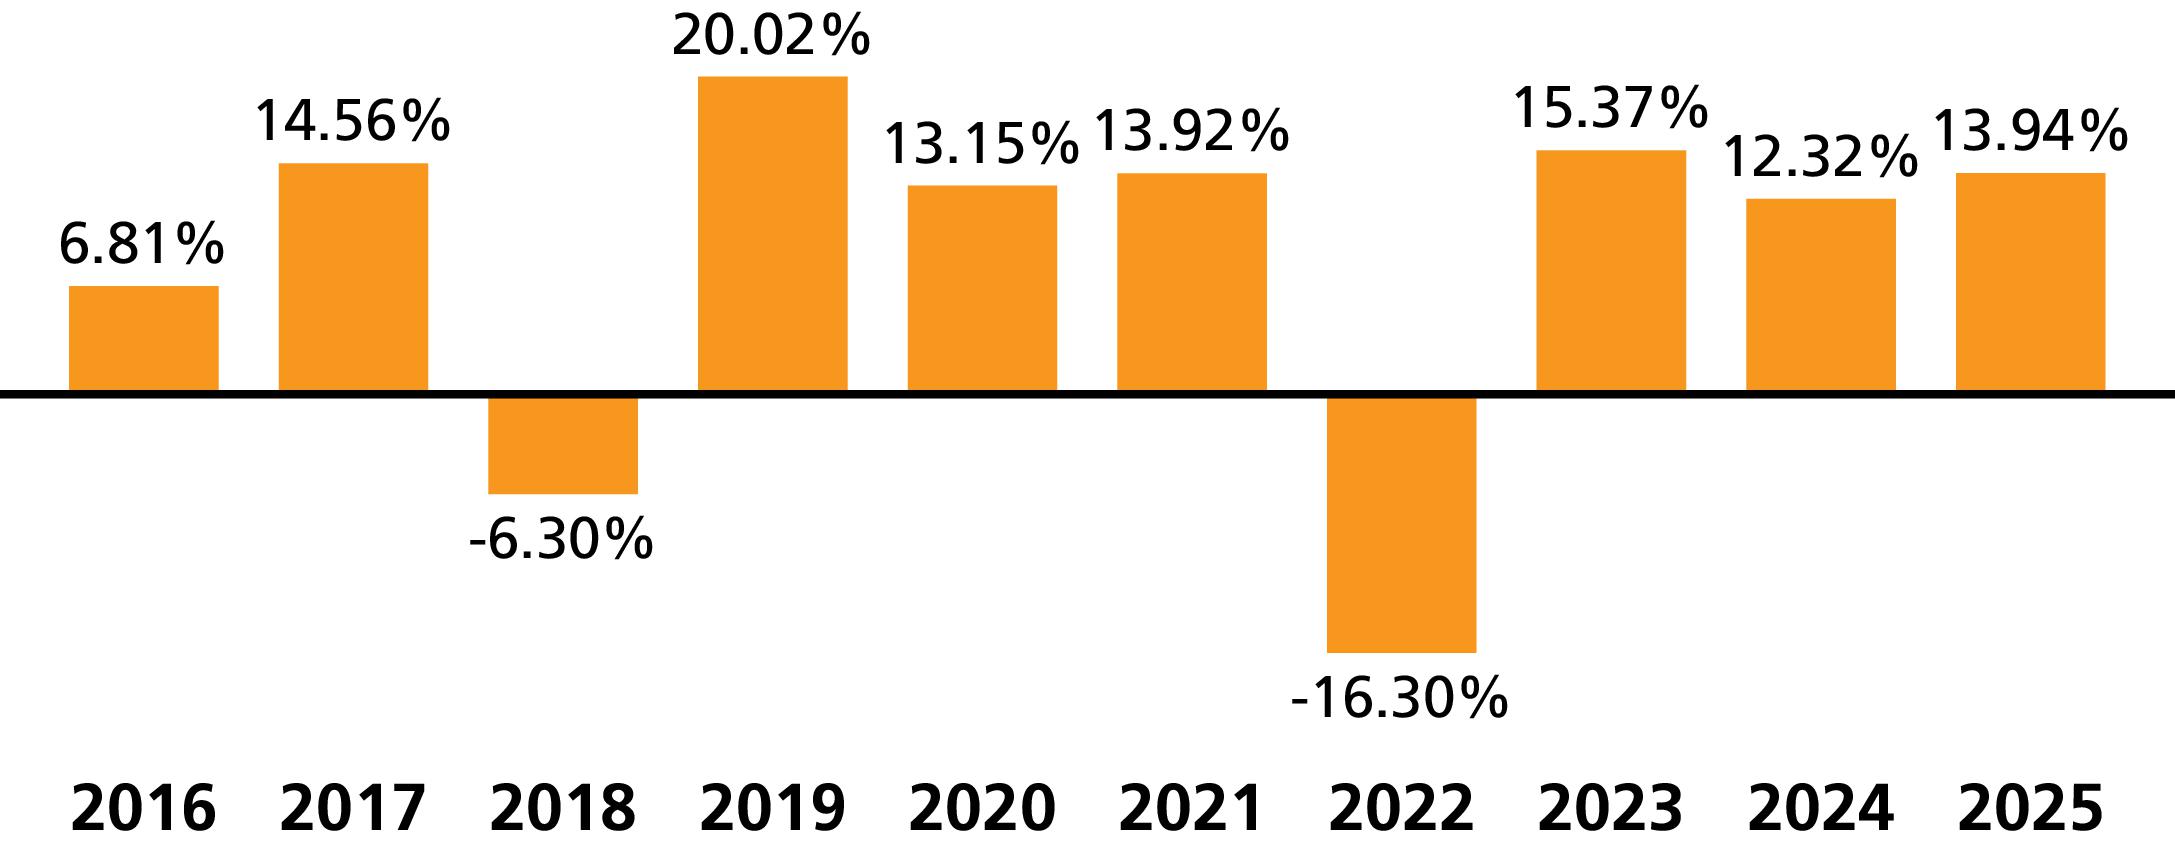
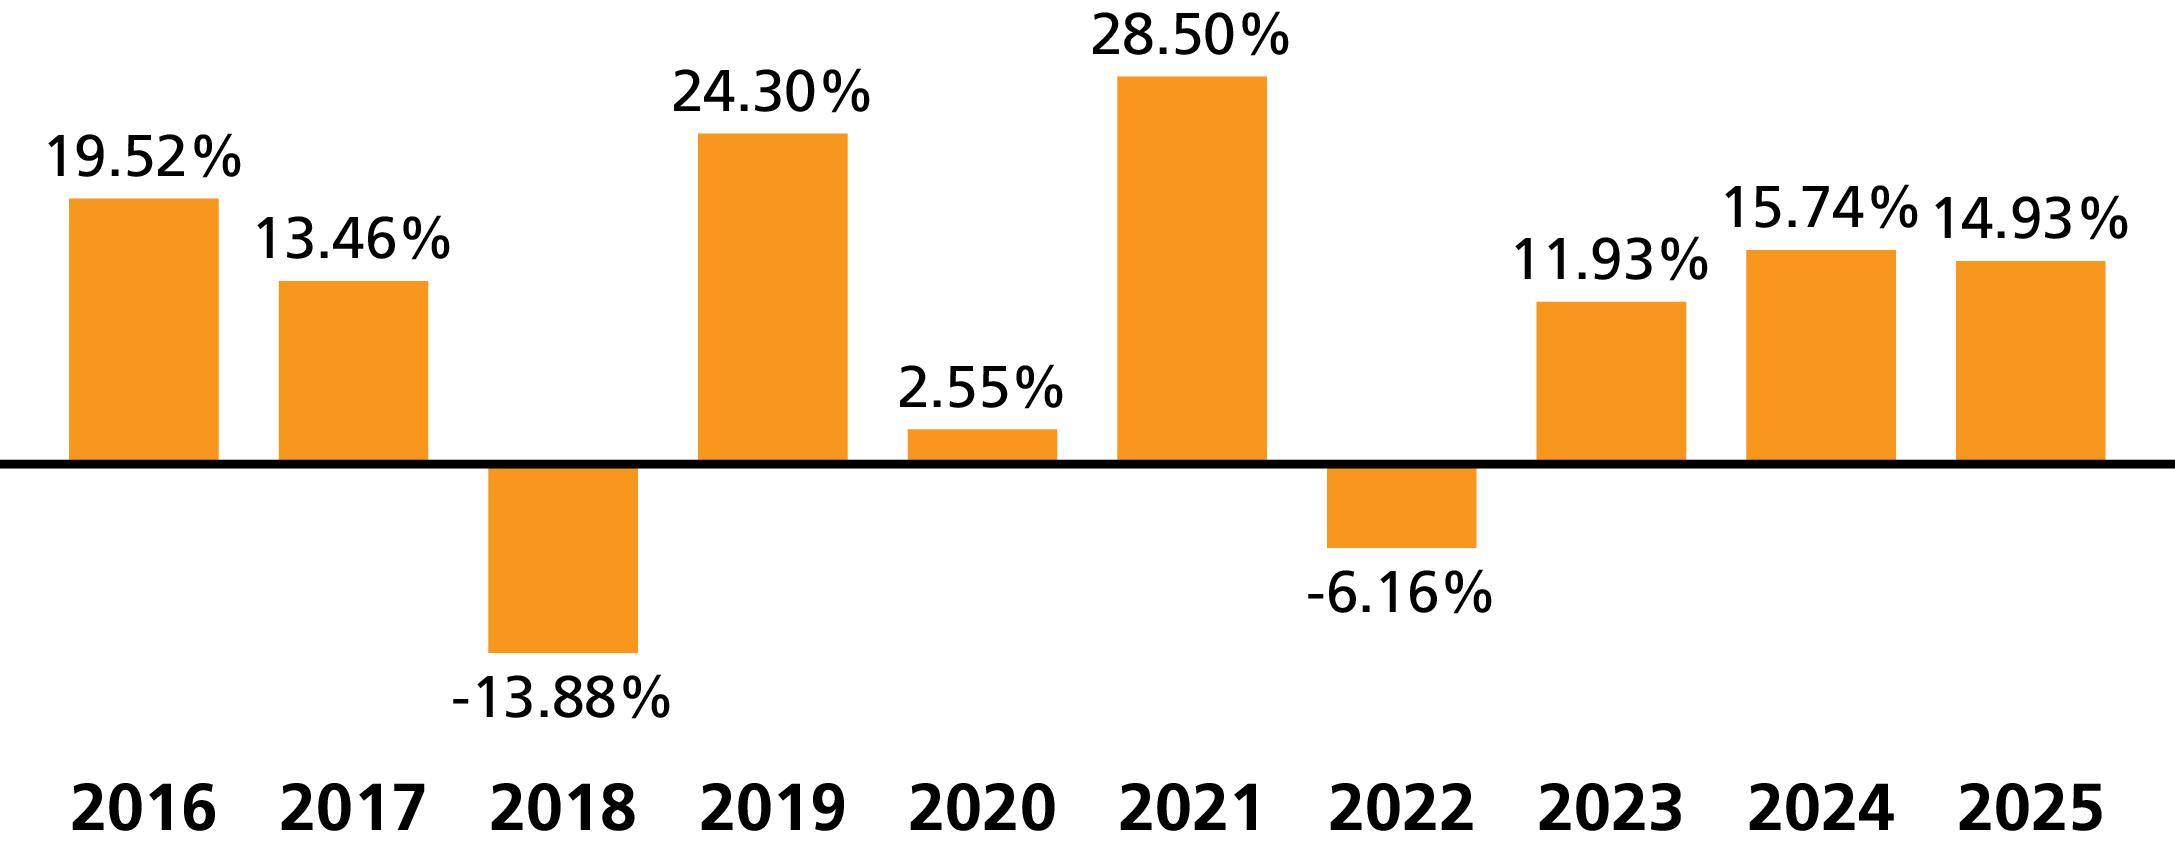
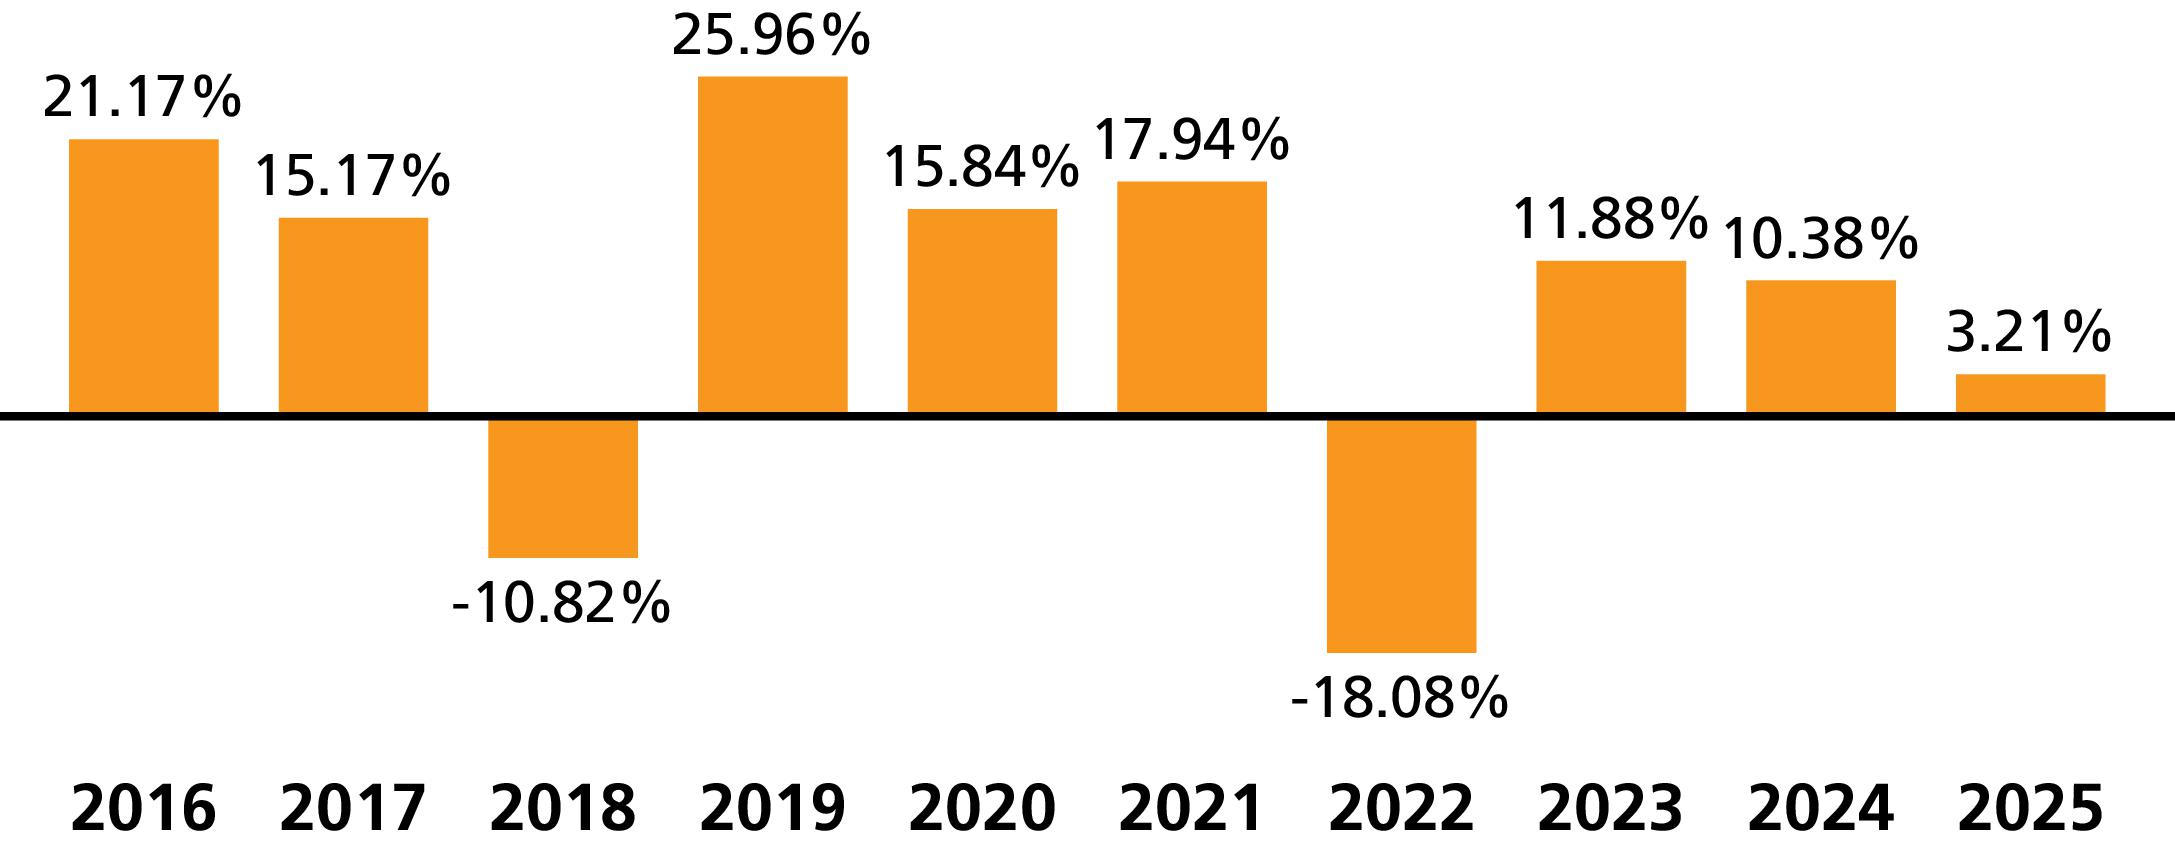
(as of December 31 of each year)
|
|
|
|
|
|
|
|
(for the periods ended December 31, 2025)
|
|
|
1 Yr |
5 Yrs |
10 Yrs |
Since
Inception |
Inception
Date |
|
Class ADV |
% |
|
|
|
N/A |
|
|
Russell 3000® Index1 |
% |
|
|
|
N/A |
|
|
Russell 1000® Growth Index1 |
% |
|
|
|
N/A |
|
|
Class I |
% |
|
|
|
N/A |
|
|
Russell 3000® Index1 |
% |
|
|
|
N/A |
|
|
Russell 1000® Growth Index1 |
% |
|
|
|
N/A |
|
|
Class R6 |
% |
|
|
|
N/A |
|
|
Russell 3000® Index1 |
% |
|
|
|
N/A |
|
|
Russell 1000® Growth Index1 |
% |
|
|
|
N/A |
|
|
Class S |
% |
|
|
|
N/A |
|
|
Russell 3000® Index1 |
% |
|
|
|
N/A |
|
|
Russell 1000® Growth Index1 |
% |
|
|
|
N/A |
|
|
Class S2 |
% |
|
|
|
N/A |
|
|
Russell 3000® Index1 |
% |
|
|
|
N/A |
|
|
Russell 1000® Growth Index1 |
% |
|
|
|
N/A |
|
1
Portfolio Management
|
Investment Adviser |
|
Voya Investments, LLC |
|
Sub-Adviser |
|
Voya Investment Management Co. LLC |
|
Portfolio Managers |
|
|
Kristy Finnegan, CFA
Portfolio Manager (since 8/2019) |
Leigh Todd, CFA
Portfolio Manager (since 12/2021) |
|
Sub-Adviser |
|
T. Rowe Price Associates, Inc. |
|
Portfolio Managers |
|
|
Eric DeVilbiss
Portfolio Manager (since 4/2026) |
James Stillwagon
Portfolio Manager (since 10/2025) |
Purchase and Sale of Portfolio Shares
Shares of the Portfolio are not offered directly to the public. Purchase and sale of shares may be made only by separate accounts of insurance companies serving as investment options under Variable Contracts or by Qualified Plans, custodian accounts, and certain investment advisers and their affiliates, other investment companies, or permitted investors. Please refer to the prospectus for the appropriate insurance company separate account, investment company, or your plan documents for information on how to direct investments in, or sale from, an investment option corresponding to the Portfolio and any fees that may apply. Participating insurance companies and certain other designated organizations are authorized to receive purchase orders on the Portfolio's behalf.
Voya Large Cap Growth Portfolio
19
Tax Information
Distributions made by the Portfolio to a Variable Contract or Qualified Plan, and exchanges and redemptions of Portfolio shares made by a Variable Contract or Qualified Plan, ordinarily do not cause the corresponding contract holder or plan participant to recognize income or gain for U.S. federal income tax purposes. See the Variable Contract prospectus or the governing documents of your Qualified Plan for information regarding the U.S. federal income tax treatment of the distributions to your Variable Contract or Qualified Plan and the holders of the contracts or plan participants.
Payments to Broker-Dealers and Other Financial Intermediaries
If you invest in the Portfolio through a Variable Contract issued by an insurance company or through a Qualified Plan that, in turn, was purchased or serviced through an insurance company, broker-dealer or other financial intermediary, the Portfolio and its Investment Adviser or distributor or their affiliates may: (1) make payments to the insurance company issuer of the Variable Contract or to the company servicing the Qualified Plan and (2) make payments to the insurance company, broker-dealer, or other financial intermediary. These payments may create a conflict of interest by: (1) influencing the insurance company or the company servicing the Qualified Plan to make the Portfolio available as an investment option for the Variable Contract or the Qualified Plan or (2) influencing the broker-dealer or other intermediary and your salesperson to recommend the Variable Contract or the pension servicing agent and/or the Portfolio over other options. Ask your salesperson or Qualified Plan administrator or visit your financial intermediary's website for more information.
Voya Large Cap Growth Portfolio
20
Expenses you pay each year as a % of the value of your investment
|
Class |
|
ADV |
I |
S |
|
Management Fees |
% |
|
|
|
|
Distribution and/or Shareholder Services (12b-1) Fees |
% |
|
|
|
|
Other Expenses |
% |
|
|
|
|
Total Annual Portfolio Operating Expenses |
% |
|
|
|
|
Class |
|
1 Yr |
3 Yrs |
5 Yrs |
10 Yrs |
|
ADV |
$ |
|
|
|
|
|
I |
$ |
|
|
|
|
|
S |
$ |
|
|
|
|
21
Voya Limited Maturity Bond Portfolio
Voya Limited Maturity Bond Portfolio
22
Principal Risks
Voya Limited Maturity Bond Portfolio
23
Voya Limited Maturity Bond Portfolio
24
Voya Limited Maturity Bond Portfolio
25
Voya Limited Maturity Bond Portfolio
26
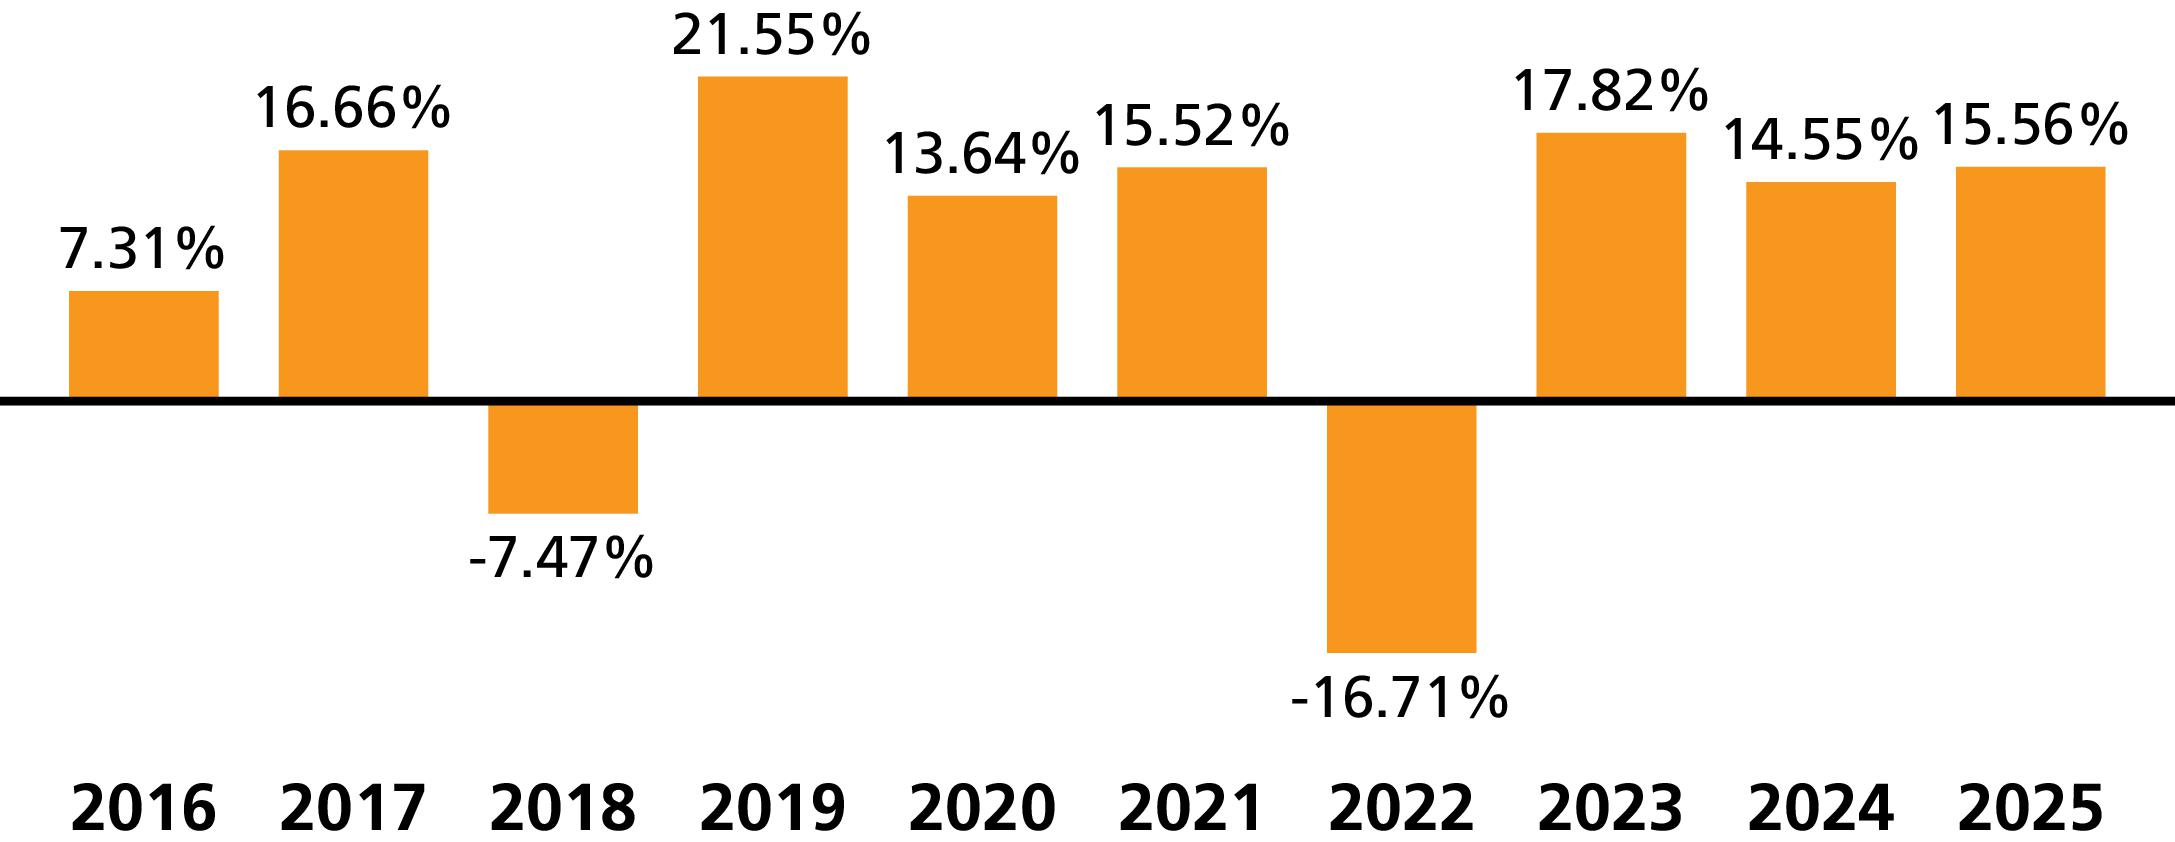
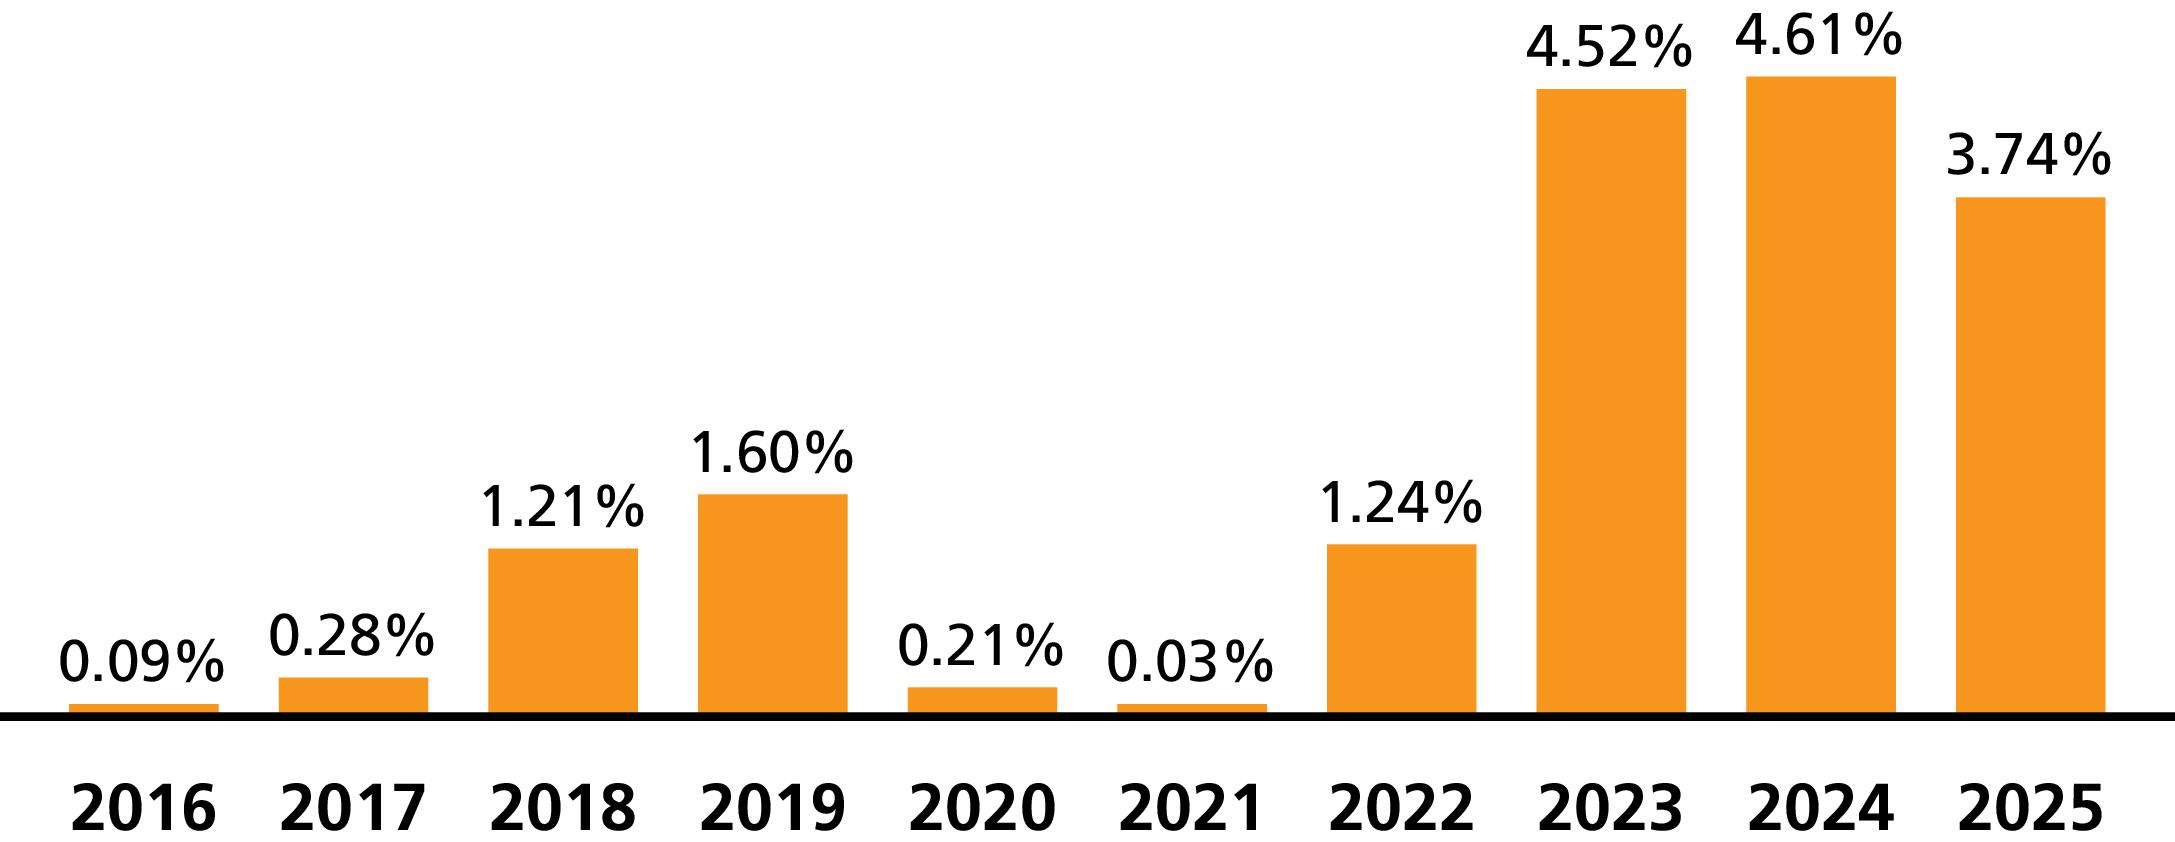
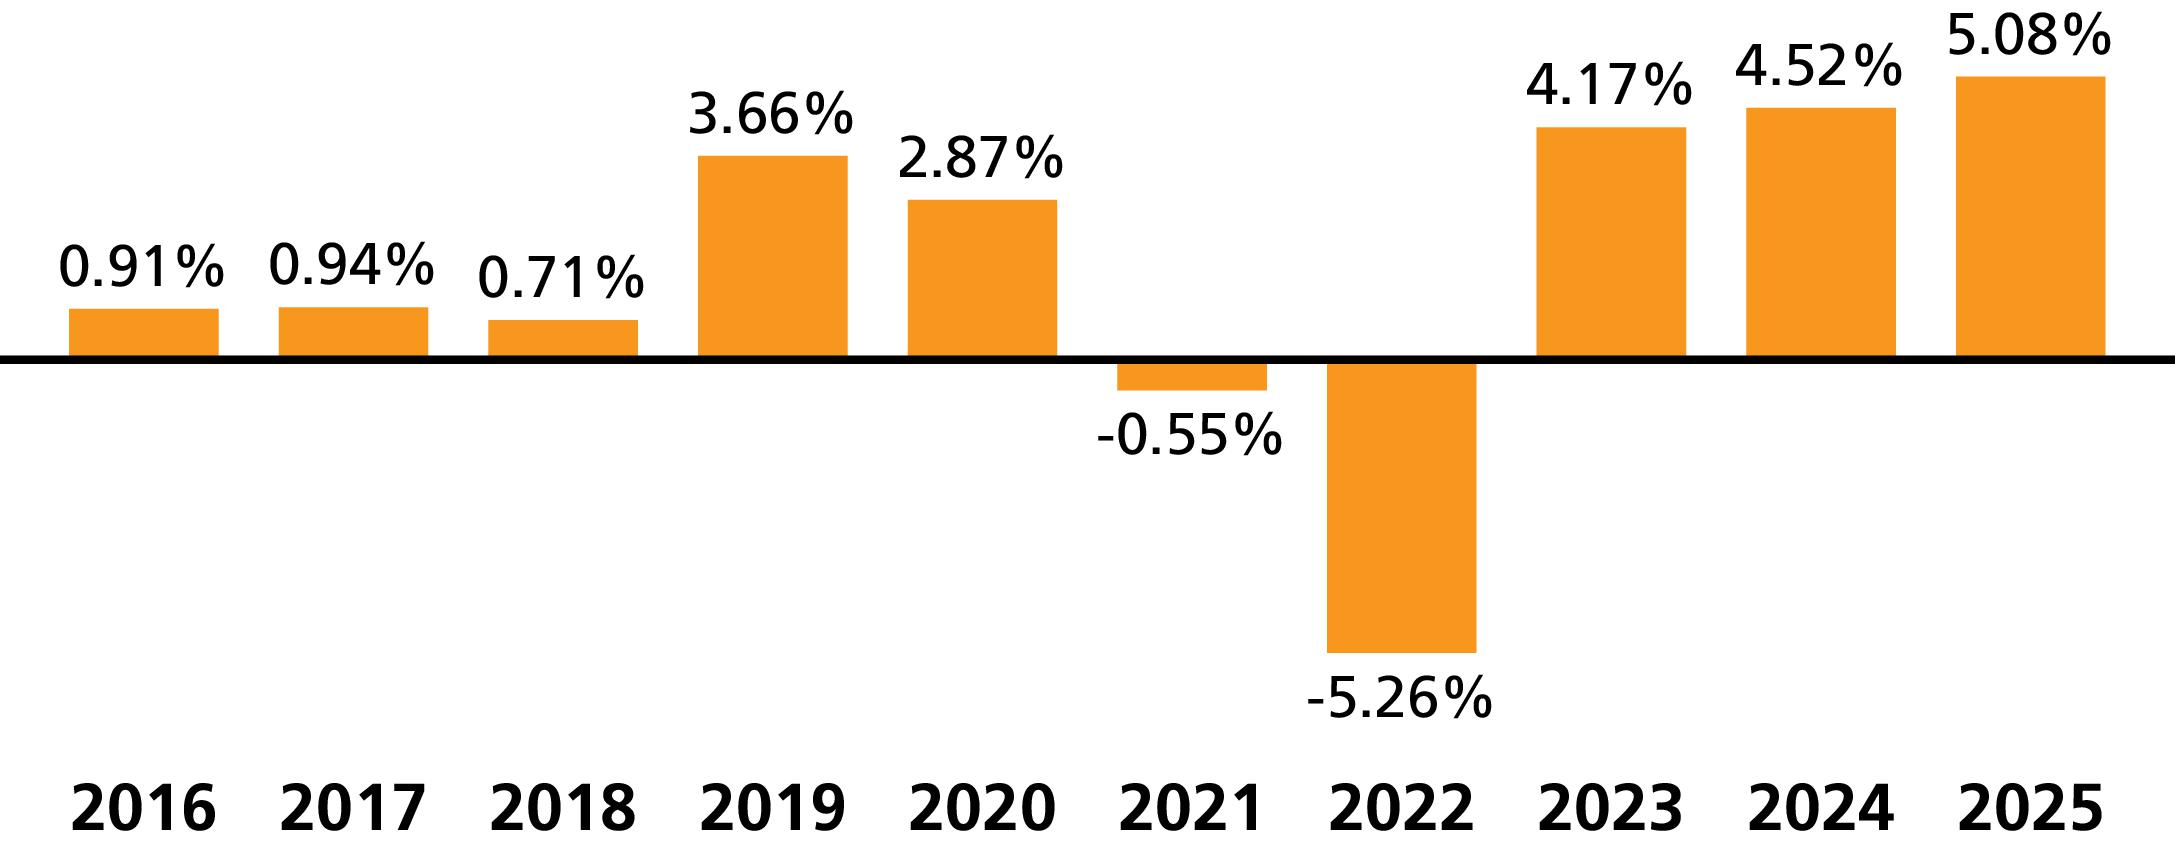
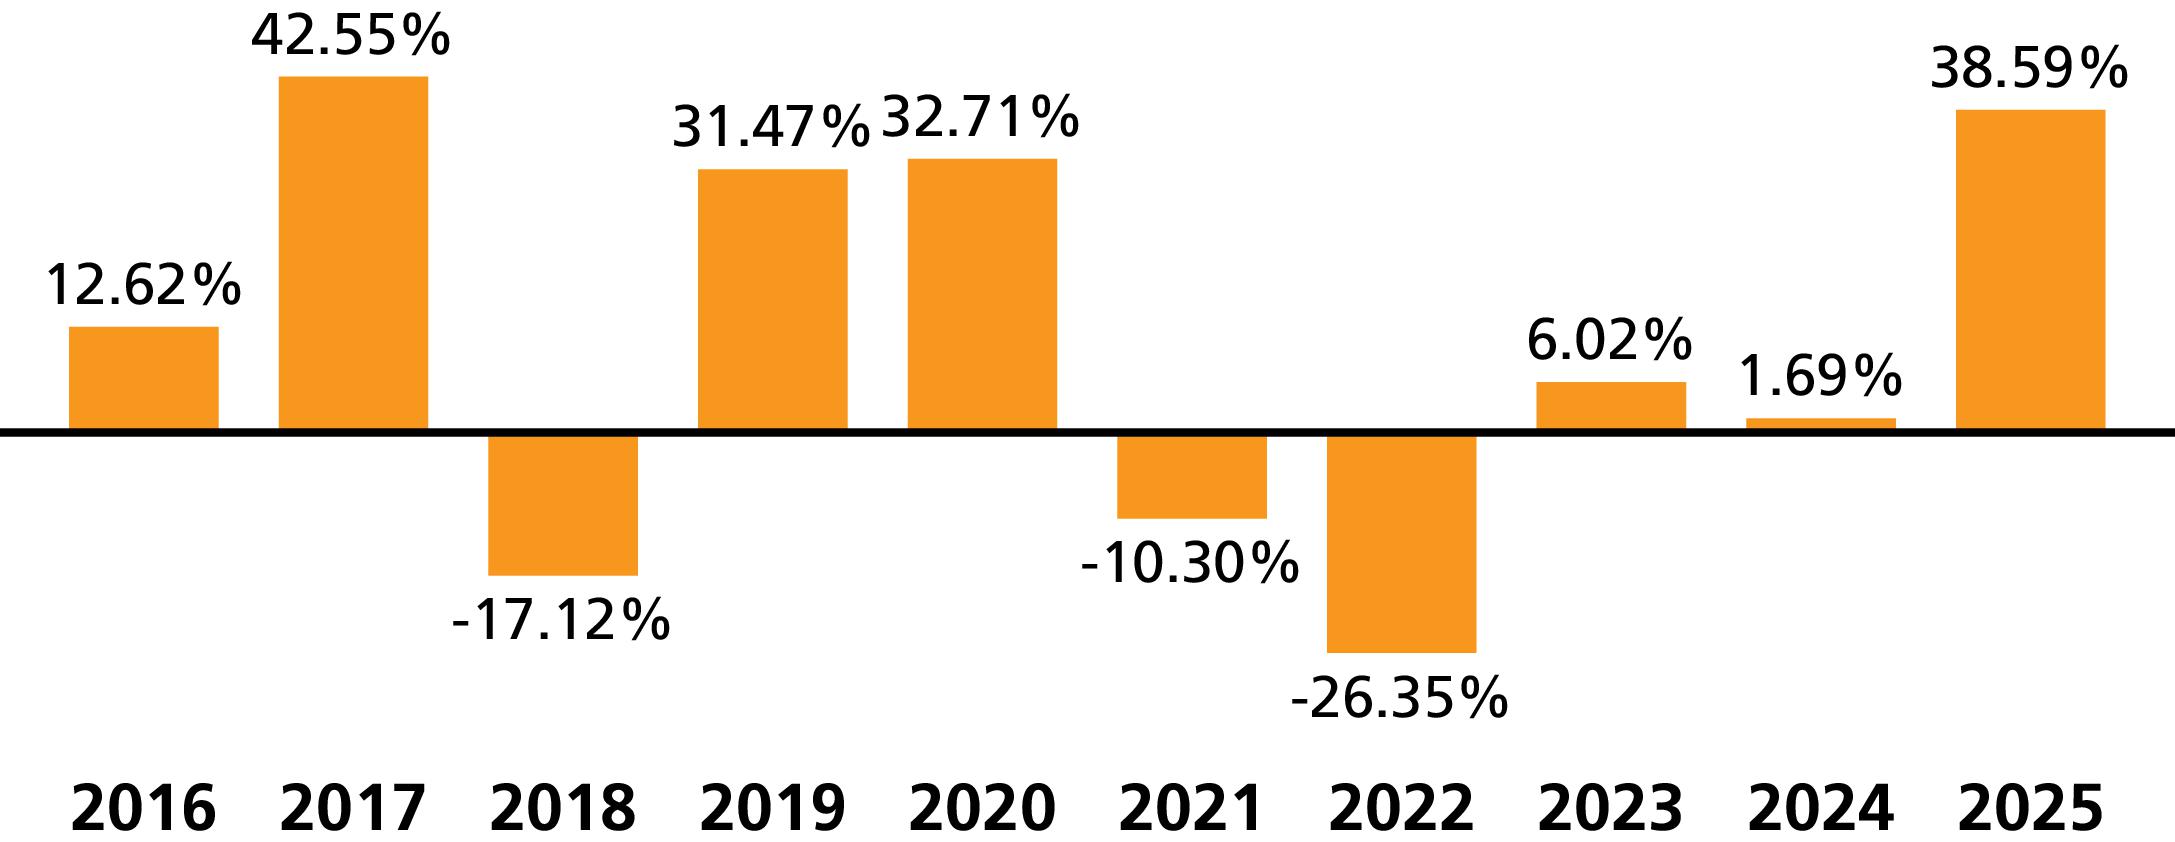
(as of December 31 of each year)
|
|
|
|
|
|
|
|
(for the periods ended December 31, 2025)
|
|
|
1 Yr |
5 Yrs |
10 Yrs |
Since
Inception |
Inception
Date |
|
Class ADV |
% |
|
|
|
N/A |
|
|
Bloomberg U.S. Aggregate Bond Index1 |
% |
|
- |
|
N/A |
|
|
Bloomberg U.S. 1-3 Year Government/Credit Bond Index1 |
% |
|
|
|
N/A |
|
Voya Limited Maturity Bond Portfolio
27
|
|
|
1 Yr |
5 Yrs |
10 Yrs |
Since
Inception |
Inception
Date |
|
Class I |
% |
|
|
|
N/A |
|
|
Bloomberg U.S. Aggregate Bond Index1 |
% |
|
- |
|
N/A |
|
|
Bloomberg U.S. 1-3 Year Government/Credit Bond Index1 |
% |
|
|
|
N/A |
|
|
Class S |
% |
|
|
|
N/A |
|
|
Bloomberg U.S. Aggregate Bond Index1 |
% |
|
- |
|
N/A |
|
|
Bloomberg U.S. 1-3 Year Government/Credit Bond Index1 |
% |
|
|
|
N/A |
|
1
Portfolio Management
|
Investment Adviser |
|
Voya Investments, LLC |
|
Sub-Adviser |
|
Voya Investment Management Co. LLC |
|
Portfolio Managers |
|
|
Sean Banai, CFA
Portfolio Manager (since 7/2021) |
David Goodson
Portfolio Manager (since 4/2017) |
|
Rajen Jadav, CFA
Portfolio Manager (since 2/2026) |
Anuranjan Sharma
Portfolio Manager (since 2/2026) |
|
Vinay Viralam, CFA
Portfolio Manager (since 2/2026) |
|
Purchase and Sale of Portfolio Shares
Shares of the Portfolio are not offered directly to the public. Purchase and sale of shares may be made only by separate accounts of insurance companies serving as investment options under Variable Contracts or by Qualified Plans, custodian accounts, and certain investment advisers and their affiliates, other investment companies, or permitted investors. Please refer to the prospectus for the appropriate insurance company separate account, investment company, or your plan documents for information on how to direct investments in, or sale from, an investment option corresponding to the Portfolio and any fees that may apply. Participating insurance companies and certain other designated organizations are authorized to receive purchase orders on the Portfolio's behalf.
Tax Information
Distributions made by the Portfolio to a Variable Contract or Qualified Plan, and exchanges and redemptions of Portfolio shares made by a Variable Contract or Qualified Plan, ordinarily do not cause the corresponding contract holder or plan participant to recognize income or gain for U.S. federal income tax purposes. See the Variable Contract prospectus or the governing documents of your Qualified Plan for information regarding the U.S. federal income tax treatment of the distributions to your Variable Contract or Qualified Plan and the holders of the contracts or plan participants.
Payments to Broker-Dealers and Other Financial Intermediaries
If you invest in the Portfolio through a Variable Contract issued by an insurance company or through a Qualified Plan that, in turn, was purchased or serviced through an insurance company, broker-dealer or other financial intermediary, the Portfolio and its Investment Adviser or distributor or their affiliates may: (1) make payments to the insurance company issuer of the Variable Contract or to the company servicing the Qualified Plan and (2) make payments to the insurance company, broker-dealer, or other financial intermediary. These payments may create a conflict of interest by: (1) influencing the insurance company or the company servicing the Qualified Plan to make the Portfolio available as an investment option for the Variable Contract or the Qualified Plan or (2) influencing the broker-dealer or other intermediary and your salesperson to recommend the Variable Contract or the pension servicing agent and/or the Portfolio over other options. Ask your salesperson or Qualified Plan administrator or visit your financial intermediary's website for more information.
Voya Limited Maturity Bond Portfolio
28
Expenses you pay each year as a % of the value of your investment
|
Class |
|
ADV |
I |
S |
S2 |
|
Management Fees |
% |
|
|
|
|
|
Distribution and/or Shareholder Services (12b-1) Fees |
% |
|
|
|
|
|
Other Expenses |
% |
|
|
|
|
|
Total Annual Portfolio Operating Expenses |
% |
|
|
|
|
|
Waivers and Reimbursements1 |
% |
|
|
( |
|
|
Total Annual Portfolio Operating Expenses After
Waivers and Reimbursements |
% |
|
|
|
|
1
|
Class |
|
1 Yr |
3 Yrs |
5 Yrs |
10 Yrs |
|
ADV |
$ |
|
|
|
|
|
I |
$ |
|
|
|
|
|
S |
$ |
|
|
|
|
|
S2 |
$ |
|
|
|
|
29
Voya U.S. Stock Index Portfolio
Principal Risks
Voya U.S. Stock Index Portfolio
30
Voya U.S. Stock Index Portfolio
31
Voya U.S. Stock Index Portfolio
32
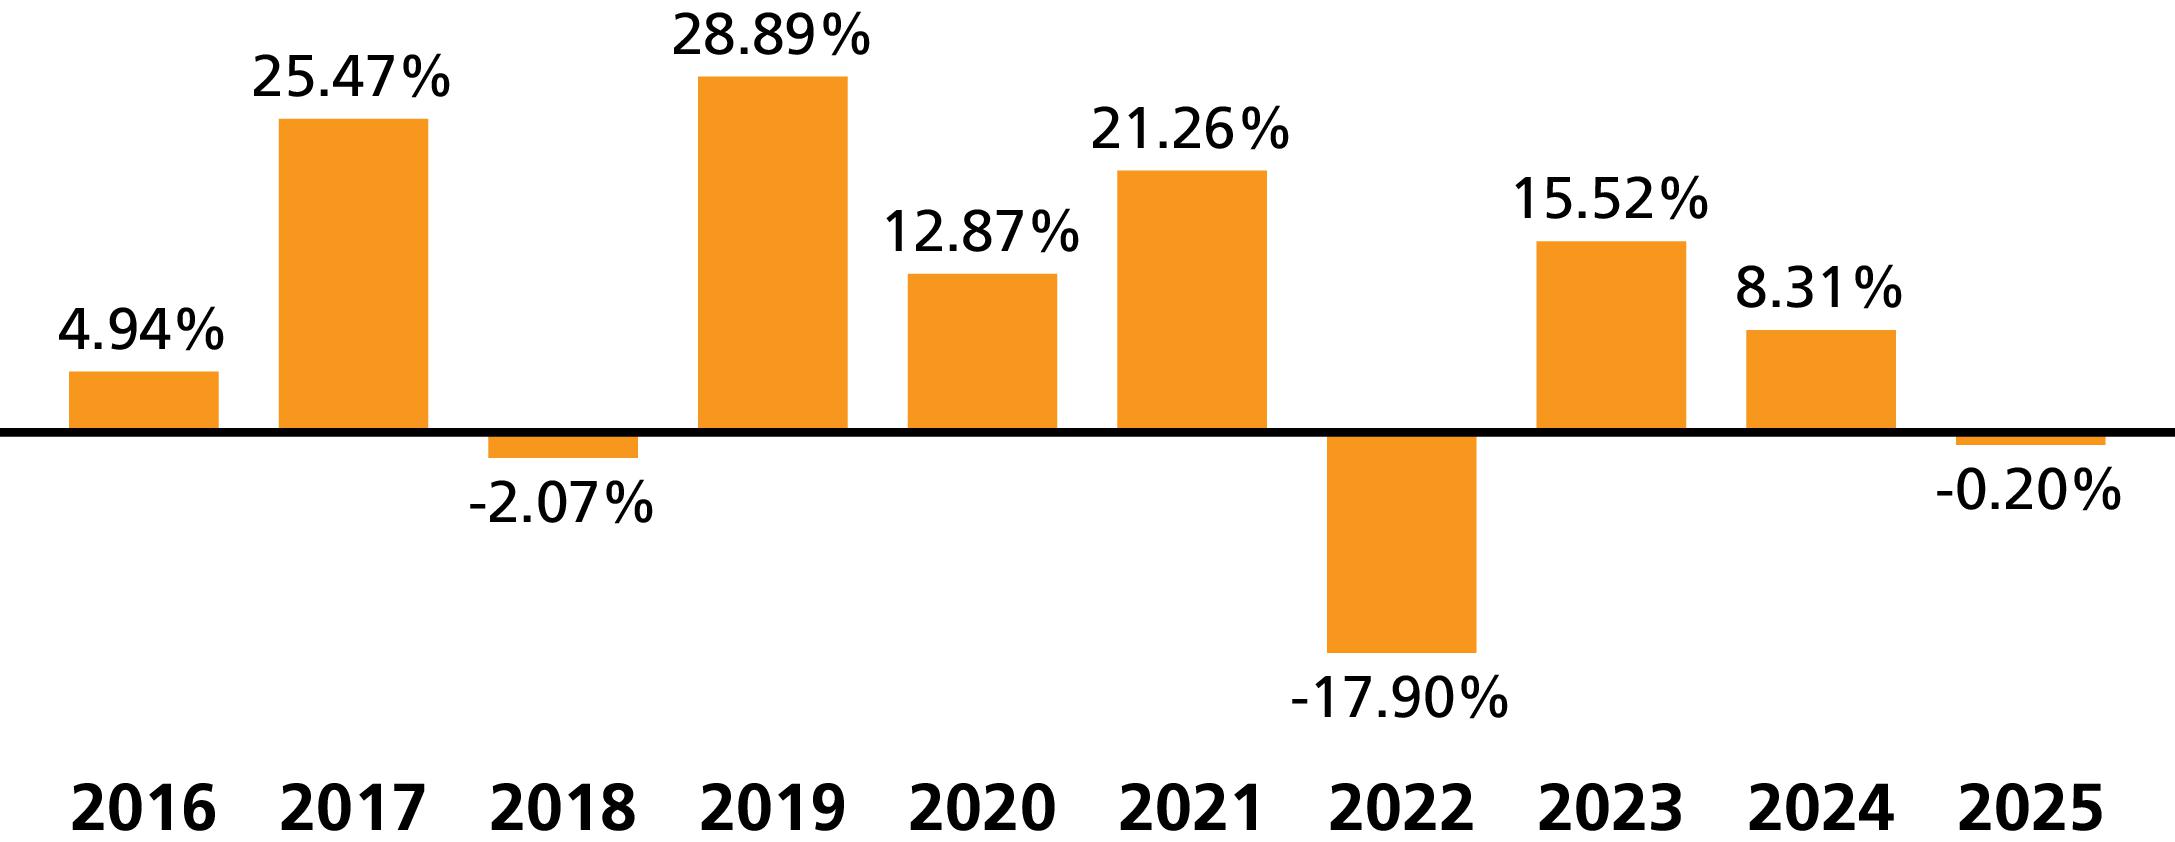
(as of December 31 of each year)
|
|
|
|
|
|
|
|
(for the periods ended December 31, 2025)
|
|
|
1 Yr |
5 Yrs |
10 Yrs |
Since
Inception |
Inception
Date |
|
Class ADV |
% |
|
|
|
N/A |
|
|
Russell 3000® Index1 |
% |
|
|
|
N/A |
|
|
S&P 500® Index1 |
% |
|
|
|
N/A |
|
|
Class I |
% |
|
|
|
N/A |
|
|
Russell 3000® Index1 |
% |
|
|
|
N/A |
|
|
S&P 500® Index1 |
% |
|
|
|
N/A |
|
|
Class S |
% |
|
|
|
N/A |
|
|
Russell 3000® Index1 |
% |
|
|
|
N/A |
|
|
S&P 500® Index1 |
% |
|
|
|
N/A |
|
|
Class S2 |
% |
|
|
|
N/A |
|
|
Russell 3000® Index1 |
% |
|
|
|
N/A |
|
|
S&P 500® Index1 |
% |
|
|
|
N/A |
|
1
Portfolio Management
|
Investment Adviser |
|
Voya Investments, LLC |
|
Sub-Adviser |
|
Voya Investment Management Co. LLC |
|
Portfolio Managers |
|
|
Mark Buccigross
Portfolio Manager (since 2/2025) |
Kai Yee Wong
Portfolio Manager (since 6/2013) |
Purchase and Sale of Portfolio Shares
Shares of the Portfolio are not offered directly to the public. Purchase and sale of shares may be made only by separate accounts of insurance companies serving as investment options under Variable Contracts or by Qualified Plans, custodian accounts, and certain investment advisers and their affiliates, other investment companies, or permitted investors. Please refer to the prospectus for the appropriate insurance company separate account, investment company, or your plan documents for information on how to direct investments in, or sale from, an investment option corresponding to the Portfolio and any fees that may apply. Participating insurance companies and certain other designated organizations are authorized to receive purchase orders on the Portfolio's behalf.
Voya U.S. Stock Index Portfolio
33
Tax Information
Distributions made by the Portfolio to a Variable Contract or Qualified Plan, and exchanges and redemptions of Portfolio shares made by a Variable Contract or Qualified Plan, ordinarily do not cause the corresponding contract holder or plan participant to recognize income or gain for U.S. federal income tax purposes. See the Variable Contract prospectus or the governing documents of your Qualified Plan for information regarding the U.S. federal income tax treatment of the distributions to your Variable Contract or Qualified Plan and the holders of the contracts or plan participants.
Payments to Broker-Dealers and Other Financial Intermediaries
If you invest in the Portfolio through a Variable Contract issued by an insurance company or through a Qualified Plan that, in turn, was purchased or serviced through an insurance company, broker-dealer or other financial intermediary, the Portfolio and its Investment Adviser or distributor or their affiliates may: (1) make payments to the insurance company issuer of the Variable Contract or to the company servicing the Qualified Plan and (2) make payments to the insurance company, broker-dealer, or other financial intermediary. These payments may create a conflict of interest by: (1) influencing the insurance company or the company servicing the Qualified Plan to make the Portfolio available as an investment option for the Variable Contract or the Qualified Plan or (2) influencing the broker-dealer or other intermediary and your salesperson to recommend the Variable Contract or the pension servicing agent and/or the Portfolio over other options. Ask your salesperson or Qualified Plan administrator or visit your financial intermediary's website for more information.
Voya U.S. Stock Index Portfolio
34
Expenses you pay each year as a % of the value of your investment
|
Class |
|
ADV |
I |
S |
S2 |
|
Management Fees |
% |
|
|
|
|
|
Distribution and/or Shareholder Services (12b-1) Fees |
% |
|
|
|
|
|
Other Expenses |
% |
|
|
|
|
|
Total Annual Portfolio Operating Expenses |
% |
|
|
|
|
|
Waivers and Reimbursements2 |
% |
( |
( |
( |
( |
|
Total Annual Portfolio Operating Expenses After Waivers and
Reimbursements |
% |
|
|
|
|
1
2
|
Class |
|
1 Yr |
3 Yrs |
5 Yrs |
10 Yrs |
|
ADV |
$ |
|
|
|
|
|
I |
$ |
|
|
|
|
|
S |
$ |
|
|
|
|
|
S2 |
$ |
|
|
|
|
35
VY® CBRE Global Real Estate Portfolio
Principal Risks
VY® CBRE Global Real Estate Portfolio
36
VY® CBRE Global Real Estate Portfolio
37
VY® CBRE Global Real Estate Portfolio
38
VY® CBRE Global Real Estate Portfolio
39
(as of December 31 of each year)
|
|
|
|
|
|
|
|
(for the periods ended December 31, 2025)
|
|
|
1 Yr |
5 Yrs |
10 Yrs |
Since
Inception |
Inception
Date |
|
Class ADV |
% |
|
|
|
N/A |
|
|
MSCI ACWI1 |
% |
|
|
|
N/A |
|
|
FTSE EPRA Nareit Developed Index1 |
% |
|
|
|
N/A |
|
|
S&P 500® Index2 |
% |
|
|
|
N/A |
|
VY® CBRE Global Real Estate Portfolio
40
|
|
|
1 Yr |
5 Yrs |
10 Yrs |
Since
Inception |
Inception
Date |
|
Class I |
% |
|
|
|
N/A |
|
|
MSCI ACWI1 |
% |
|
|
|
N/A |
|
|
FTSE EPRA Nareit Developed Index1 |
% |
|
|
|
N/A |
|
|
S&P 500® Index2 |
% |
|
|
|
N/A |
|
|
Class S |
% |
|
|
|
N/A |
|
|
MSCI ACWI1 |
% |
|
|
|
N/A |
|
|
FTSE EPRA Nareit Developed Index1 |
% |
|
|
|
N/A |
|
|
S&P 500® Index2 |
% |
|
|
|
N/A |
|
|
Class S2 |
% |
|
|
|
N/A |
|
|
MSCI ACWI1 |
% |
|
|
|
N/A |
|
|
FTSE EPRA Nareit Developed Index1 |
% |
|
|
|
N/A |
|
|
S&P 500® Index2 |
% |
|
|
|
N/A |
|
1
2
Portfolio Management
|
Investment Adviser |
|
Voya Investments, LLC |
|
Sub-Adviser |
|
CBRE Investment Management Listed Real Assets, LLC |
|
Portfolio Managers |
|
|
Christopher S. Reich, CFA
Portfolio Manager (since 1/2020) |
Joseph P. Smith, CFA
Portfolio Manager (since 2/2007) |
|
Kenneth S. Weinberg, CFA
Portfolio Manager (since 1/2022) |
|
Purchase and Sale of Portfolio Shares
Shares of the Portfolio are not offered directly to the public. Purchase and sale of shares may be made only by separate accounts of insurance companies serving as investment options under Variable Contracts or by Qualified Plans, custodian accounts, and certain investment advisers and their affiliates, other investment companies, or permitted investors. Please refer to the prospectus for the appropriate insurance company separate account, investment company, or your plan documents for information on how to direct investments in, or sale from, an investment option corresponding to the Portfolio and any fees that may apply. Participating insurance companies and certain other designated organizations are authorized to receive purchase orders on the Portfolio's behalf.
Tax Information
Distributions made by the Portfolio to a Variable Contract or Qualified Plan, and exchanges and redemptions of Portfolio shares made by a Variable Contract or Qualified Plan, ordinarily do not cause the corresponding contract holder or plan participant to recognize income or gain for U.S. federal income tax purposes. See the Variable Contract prospectus or the governing documents of your Qualified Plan for information regarding the U.S. federal income tax treatment of the distributions to your Variable Contract or Qualified Plan and the holders of the contracts or plan participants.
Payments to Broker-Dealers and Other Financial Intermediaries
If you invest in the Portfolio through a Variable Contract issued by an insurance company or through a Qualified Plan that, in turn, was purchased or serviced through an insurance company, broker-dealer or other financial intermediary, the Portfolio and its Investment Adviser or distributor or their affiliates may: (1) make payments to the insurance company issuer of the Variable Contract or to the company servicing the Qualified Plan and (2) make payments to the insurance company, broker-dealer, or other financial intermediary. These payments may create a conflict of interest by: (1) influencing the insurance company or the company servicing the Qualified Plan to make the Portfolio available as an investment option for the Variable Contract or the Qualified Plan or (2) influencing the broker-dealer or other intermediary and your salesperson to recommend the Variable Contract or the pension servicing agent and/or the Portfolio over other options. Ask your salesperson or Qualified Plan administrator or visit your financial intermediary's website for more information.
VY® CBRE Global Real Estate Portfolio
41
Expenses you pay each year as a % of the value of your investment
|
Class |
|
ADV |
I |
S |
S2 |
|
Management Fees |
% |
|
|
|
|
|
Distribution and/or Shareholder Services (12b-1) Fees |
% |
|
|
|
|
|
Other Expenses |
% |
|
|
|
|
|
Total Annual Portfolio Operating Expenses |
% |
|
|
|
|
|
Waivers and Reimbursements2 |
% |
( |
( |
( |
( |
|
Total Annual Portfolio Operating Expenses After Waivers and
Reimbursements |
% |
|
|
|
|
1
2
|
Class |
|
1 Yr |
3 Yrs |
5 Yrs |
10 Yrs |
|
ADV |
$ |
|
|
|
|
|
I |
$ |
|
|
|
|
|
S |
$ |
|
|
|
|
|
S2 |
$ |
|
|
|
|
42
VY® Columbia Real Estate Portfolio
Principal Risks
VY® Columbia Real Estate Portfolio
43
VY® Columbia Real Estate Portfolio
44
VY® Columbia Real Estate Portfolio
45
VY® Columbia Real Estate Portfolio
46
VY® Columbia Real Estate Portfolio
47
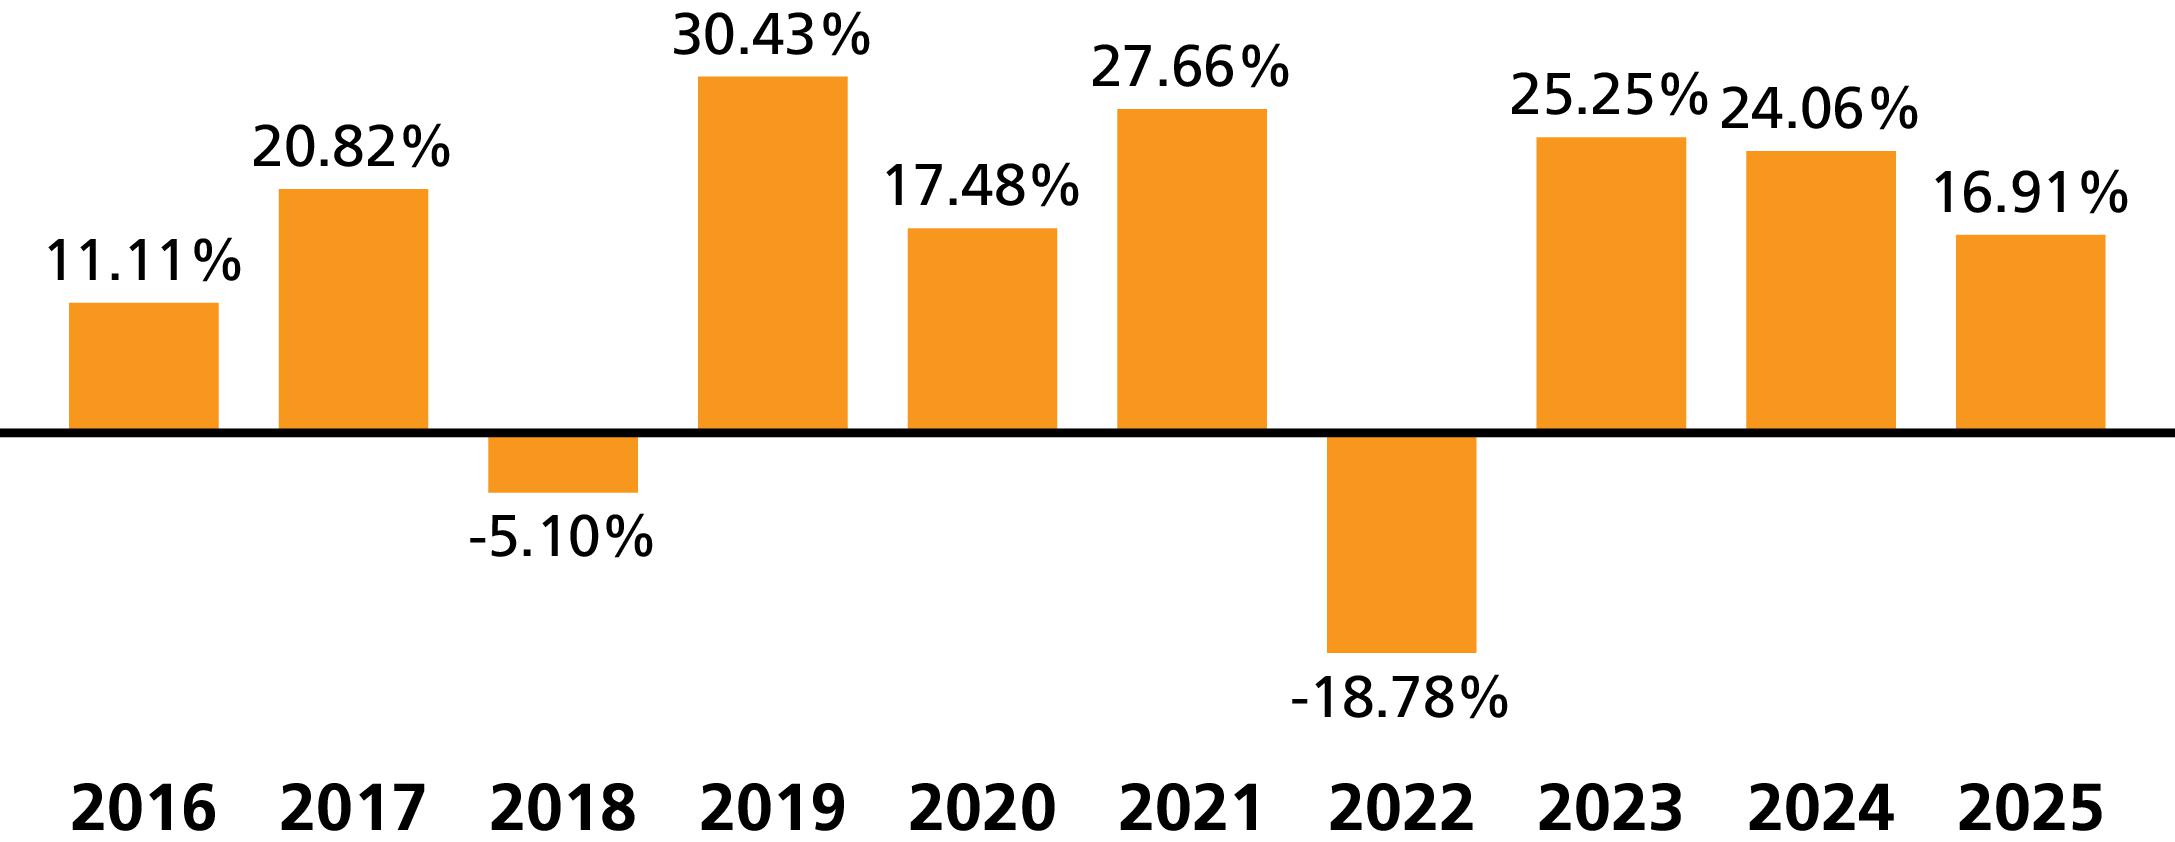
(as of December 31 of each year)
|
|
|
|
|
|
|
|
(for the periods ended December 31, 2025)
|
|
|
1 Yr |
5 Yrs |
10 Yrs |
Since
Inception |
Inception
Date |
|
Class ADV |
% |
- |
|
|
N/A |
|
|
Russell 3000® Index1 |
% |
|
|
|
N/A |
|
|
FTSE Nareit Equity REITs Index2,3 |
% |
|
|
|
N/A |
|
|
MSCI U.S. REIT® Index1,3 |
% |
|
|
|
N/A |
|
|
Class I |
% |
|
|
|
N/A |
|
|
Russell 3000® Index1 |
% |
|
|
|
N/A |
|
|
FTSE Nareit Equity REITs Index2,3 |
% |
|
|
|
N/A |
|
|
MSCI U.S. REIT® Index1,3 |
% |
|
|
|
N/A |
|
|
Class S |
% |
|
|
|
N/A |
|
|
Russell 3000® Index1 |
% |
|
|
|
N/A |
|
|
FTSE Nareit Equity REITs Index2,3 |
% |
|
|
|
N/A |
|
|
MSCI U.S. REIT® Index1,3 |
% |
|
|
|
N/A |
|
|
Class S2 |
% |
- |
|
|
N/A |
|
|
Russell 3000® Index1 |
% |
|
|
|
N/A |
|
|
FTSE Nareit Equity REITs Index2,3 |
% |
|
|
|
N/A |
|
|
MSCI U.S. REIT® Index1,3 |
% |
|
|
|
N/A |
|
1
2
3
Portfolio Management
|
Investment Adviser |
|
Voya Investments, LLC |
|
Sub-Adviser |
|
Columbia Management Investment Advisers, LLC |
|
Portfolio Managers |
|
|
Sander Bunck
Portfolio Manager (since 1/2026) |
Alban Lhonneur
Portfolio Manager (since 1/2026) |
|
Daniel Winterbottom, CFA
Portfolio Manager (since 1/2026) |
|
Purchase and Sale of Portfolio Shares
Shares of the Portfolio are not offered directly to the public. Purchase and sale of shares may be made only by separate accounts of insurance companies serving as investment options under Variable Contracts or by Qualified Plans, custodian accounts, and certain investment advisers and their affiliates, other investment companies, or permitted investors. Please refer to the prospectus for the appropriate insurance company separate account, investment company, or your plan documents
VY® Columbia Real Estate Portfolio
48
for information on how to direct investments in, or sale from, an investment option corresponding to the Portfolio and any fees that may apply. Participating insurance companies and certain other designated organizations are authorized to receive purchase orders on the Portfolio's behalf.
Tax Information
Distributions made by the Portfolio to a Variable Contract or Qualified Plan, and exchanges and redemptions of Portfolio shares made by a Variable Contract or Qualified Plan, ordinarily do not cause the corresponding contract holder or plan participant to recognize income or gain for U.S. federal income tax purposes. See the Variable Contract prospectus or the governing documents of your Qualified Plan for information regarding the U.S. federal income tax treatment of the distributions to your Variable Contract or Qualified Plan and the holders of the contracts or plan participants.
Payments to Broker-Dealers and Other Financial Intermediaries
If you invest in the Portfolio through a Variable Contract issued by an insurance company or through a Qualified Plan that, in turn, was purchased or serviced through an insurance company, broker-dealer or other financial intermediary, the Portfolio and its Investment Adviser or distributor or their affiliates may: (1) make payments to the insurance company issuer of the Variable Contract or to the company servicing the Qualified Plan and (2) make payments to the insurance company, broker-dealer, or other financial intermediary. These payments may create a conflict of interest by: (1) influencing the insurance company or the company servicing the Qualified Plan to make the Portfolio available as an investment option for the Variable Contract or the Qualified Plan or (2) influencing the broker-dealer or other intermediary and your salesperson to recommend the Variable Contract or the pension servicing agent and/or the Portfolio over other options. Ask your salesperson or Qualified Plan administrator or visit your financial intermediary's website for more information.
VY® Columbia Real Estate Portfolio
49
Expenses you pay each year as a % of the value of your investment
|
Class |
|
ADV |
I |
S |
S2 |
|
Management Fees |
% |
|
|
|
|
|
Distribution and/or Shareholder Services (12b-1) Fees |
% |
|
|
|
|
|
Other Expenses |
% |
|
|
|
|
|
Total Annual Portfolio Operating Expenses |
% |
|
|
|
|
1
|
Class |
|
1 Yr |
3 Yrs |
5 Yrs |
10 Yrs |
|
ADV |
$ |
|
|
|
|
|
I |
$ |
|
|
|
|
|
S |
$ |
|
|
|
|
|
S2 |
$ |
|
|
|
|
50
VY® Invesco Growth and Income Portfolio
Principal Risks
VY® Invesco Growth and Income Portfolio
51
VY® Invesco Growth and Income Portfolio
52
VY® Invesco Growth and Income Portfolio
53
(as of December 31 of each year)
|
|
|
|
|
|
|
|
(for the periods ended December 31, 2025)
|
|
|
1 Yr |
5 Yrs |
10 Yrs |
Since
Inception |
Inception
Date |
|
Class ADV |
% |
|
|
|
N/A |
|
|
Russell 3000® Index1 |
% |
|
|
|
N/A |
|
|
Russell 1000® Value Index1 |
% |
|
|
|
N/A |
|
|
Class I |
% |
|
|
|
N/A |
|
|
Russell 3000® Index1 |
% |
|
|
|
N/A |
|
|
Russell 1000® Value Index1 |
% |
|
|
|
N/A |
|
|
Class S |
% |
|
|
|
N/A |
|
|
Russell 3000® Index1 |
% |
|
|
|
N/A |
|
|
Russell 1000® Value Index1 |
% |
|
|
|
N/A |
|
|
Class S2 |
% |
|
|
|
N/A |
|
|
Russell 3000® Index1 |
% |
|
|
|
N/A |
|
|
Russell 1000® Value Index1 |
% |
|
|
|
N/A |
|
1
Portfolio Management
|
Investment Adviser |
|
Voya Investments, LLC |
|
Sub-Adviser |
|
Invesco Advisers, Inc. |
|
Portfolio Managers |
|
|
Will Guthrie, CFA
Portfolio Manager (since 6/2026) |
Brian Jurkash
Co-Lead Portfolio Manager (since 4/2015) |
|
Sergio Marcheli
Portfolio Manager (since 4/2003) |
Matthew Titus, CFA
Co-Lead Portfolio Manager (since 1/2016) |
Purchase and Sale of Portfolio Shares
Shares of the Portfolio are not offered directly to the public. Purchase and sale of shares may be made only by separate accounts of insurance companies serving as investment options under Variable Contracts or by Qualified Plans, custodian accounts, and certain investment advisers and their affiliates, other investment companies, or permitted investors. Please refer to the prospectus for the appropriate insurance company separate account, investment company, or your plan documents for information on how to direct investments in, or sale from, an investment option corresponding to the Portfolio and any fees that may apply. Participating insurance companies and certain other designated organizations are authorized to receive purchase orders on the Portfolio's behalf.
VY® Invesco Growth and Income Portfolio
54
Tax Information
Distributions made by the Portfolio to a Variable Contract or Qualified Plan, and exchanges and redemptions of Portfolio shares made by a Variable Contract or Qualified Plan, ordinarily do not cause the corresponding contract holder or plan participant to recognize income or gain for U.S. federal income tax purposes. See the Variable Contract prospectus or the governing documents of your Qualified Plan for information regarding the U.S. federal income tax treatment of the distributions to your Variable Contract or Qualified Plan and the holders of the contracts or plan participants.
Payments to Broker-Dealers and Other Financial Intermediaries
If you invest in the Portfolio through a Variable Contract issued by an insurance company or through a Qualified Plan that, in turn, was purchased or serviced through an insurance company, broker-dealer or other financial intermediary, the Portfolio and its Investment Adviser or distributor or their affiliates may: (1) make payments to the insurance company issuer of the Variable Contract or to the company servicing the Qualified Plan and (2) make payments to the insurance company, broker-dealer, or other financial intermediary. These payments may create a conflict of interest by: (1) influencing the insurance company or the company servicing the Qualified Plan to make the Portfolio available as an investment option for the Variable Contract or the Qualified Plan or (2) influencing the broker-dealer or other intermediary and your salesperson to recommend the Variable Contract or the pension servicing agent and/or the Portfolio over other options. Ask your salesperson or Qualified Plan administrator or visit your financial intermediary's website for more information.
VY® Invesco Growth and Income Portfolio
55
Expenses you pay each year as a % of the value of your investment
|
Class |
|
ADV |
I |
S |
S2 |
|
Management Fees |
% |
|
|
|
|
|
Distribution and/or Shareholder Services (12b-1) Fees |
% |
|
|
|
|
|
Other Expenses |
% |
|
|
|
|
|
Total Annual Portfolio Operating Expenses |
% |
|
|
|
|
|
Waivers and Reimbursements1 |
% |
( |
( |
( |
( |
|
Total Annual Portfolio Operating Expenses After Waivers and
Reimbursements |
% |
|
|
|
|
1
|
Class |
|
1 Yr |
3 Yrs |
5 Yrs |
10 Yrs |
|
ADV |
$ |
|
|
|
|
|
I |
$ |
|
|
|
|
|
S |
$ |
|
|
|
|
|
S2 |
$ |
|
|
|
|
56
VY® JPMorgan Emerging Markets Equity Portfolio
VY® JPMorgan Emerging Markets Equity Portfolio
57
Principal Risks
VY® JPMorgan Emerging Markets Equity Portfolio
58
VY® JPMorgan Emerging Markets Equity Portfolio
59
VY® JPMorgan Emerging Markets Equity Portfolio
60
VY® JPMorgan Emerging Markets Equity Portfolio
61
VY® JPMorgan Emerging Markets Equity Portfolio
62
(as of December 31 of each year)
|
|
|
|
|
|
|
|
(for the periods ended December 31, 2025)
|
|
|
1 Yr |
5 Yrs |
10 Yrs |
Since
Inception |
Inception
Date |
|
Class ADV |
% |
|
- |
|
N/A |
|
|
MSCI ACWI Ex-U.S. Index1 |
% |
|
|
|
N/A |
|
|
MSCI Emerging Markets IndexSM1 |
% |
|
|
|
N/A |
|
|
Class I |
% |
|
|
|
N/A |
|
|
MSCI ACWI Ex-U.S. Index1 |
% |
|
|
|
N/A |
|
|
MSCI Emerging Markets IndexSM1 |
% |
|
|
|
N/A |
|
|
Class S |
% |
|
|
|
N/A |
|
|
MSCI ACWI Ex-U.S. Index1 |
% |
|
|
|
N/A |
|
|
MSCI Emerging Markets IndexSM1 |
% |
|
|
|
N/A |
|
|
Class S2 |
% |
|
- |
|
N/A |
|
|
MSCI ACWI Ex-U.S. Index1 |
% |
|
|
|
N/A |
|
|
MSCI Emerging Markets IndexSM1 |
% |
|
|
|
N/A |
|
1
Portfolio Management
|
Investment Adviser |
|
Voya Investments, LLC |
|
Sub-Adviser |
|
|
J.P. Morgan Investment Management Inc. | |
|
Portfolio Managers |
|
|
John Citron, CFA
Portfolio Manager (since 3/2025) |
Leon Eidelman, CFA
Portfolio Manager (since 4/2013) |
|
Austin Forey
Portfolio Manager (since 4/2005) |
Amit Mehta, CFA
Portfolio Manager (since 4/2013) |
Purchase and Sale of Portfolio Shares
Shares of the Portfolio are not offered directly to the public. Purchase and sale of shares may be made only by separate accounts of insurance companies serving as investment options under Variable Contracts or by Qualified Plans, custodian accounts, and certain investment advisers and their affiliates, other investment companies, or permitted investors. Please refer to the prospectus for the appropriate insurance company separate account, investment company, or your plan documents for information on how to direct investments in, or sale from, an investment option corresponding to the Portfolio and any fees that may apply. Participating insurance companies and certain other designated organizations are authorized to receive purchase orders on the Portfolio's behalf.
VY® JPMorgan Emerging Markets Equity Portfolio
63
Tax Information
Distributions made by the Portfolio to a Variable Contract or Qualified Plan, and exchanges and redemptions of Portfolio shares made by a Variable Contract or Qualified Plan, ordinarily do not cause the corresponding contract holder or plan participant to recognize income or gain for U.S. federal income tax purposes. See the Variable Contract prospectus or the governing documents of your Qualified Plan for information regarding the U.S. federal income tax treatment of the distributions to your Variable Contract or Qualified Plan and the holders of the contracts or plan participants.
Payments to Broker-Dealers and Other Financial Intermediaries
If you invest in the Portfolio through a Variable Contract issued by an insurance company or through a Qualified Plan that, in turn, was purchased or serviced through an insurance company, broker-dealer or other financial intermediary, the Portfolio and its Investment Adviser or distributor or their affiliates may: (1) make payments to the insurance company issuer of the Variable Contract or to the company servicing the Qualified Plan and (2) make payments to the insurance company, broker-dealer, or other financial intermediary. These payments may create a conflict of interest by: (1) influencing the insurance company or the company servicing the Qualified Plan to make the Portfolio available as an investment option for the Variable Contract or the Qualified Plan or (2) influencing the broker-dealer or other intermediary and your salesperson to recommend the Variable Contract or the pension servicing agent and/or the Portfolio over other options. Ask your salesperson or Qualified Plan administrator or visit your financial intermediary's website for more information.
VY® JPMorgan Emerging Markets Equity Portfolio
64
Expenses you pay each year as a % of the value of your investment
|
Class |
|
ADV |
I |
R6 |
S |
S2 |
|
Management Fees |
% |
|
|
|
|
|
|
Distribution and/or Shareholder Services (12b-1) Fees |
% |
|
|
|
|
|
|
Other Expenses |
% |
|
|
|
|
|
|
Total Annual Portfolio Operating Expenses |
% |
|
|
|
|
|
|
Class |
|
1 Yr |
3 Yrs |
5 Yrs |
10 Yrs |
|
ADV |
$ |
|
|
|
|
|
I |
$ |
|
|
|
|
|
R6 |
$ |
|
|
|
|
|
S |
$ |
|
|
|
|
|
S2 |
$ |
|
|
|
|
65
VY® JPMorgan Small Cap Core Equity Portfolio
Principal Risks
VY® JPMorgan Small Cap Core Equity Portfolio
66
VY® JPMorgan Small Cap Core Equity Portfolio
67
VY® JPMorgan Small Cap Core Equity Portfolio
68
VY® JPMorgan Small Cap Core Equity Portfolio
69
(as of December 31 of each year)
|
|
|
|
|
|
|
|
VY® JPMorgan Small Cap Core Equity Portfolio
70
(for the periods ended December 31, 2025)
|
|
|
1 Yr |
5 Yrs |
10 Yrs |
Since
Inception |
Inception
Date |
|
Class ADV |
% |
|
|
|
N/A |
|
|
Russell 3000® Index1 |
% |
|
|
|
N/A |
|
|
Russell 2000® Index1 |
% |
|
|
|
N/A |
|
|
Class I |
% |
|
|
|
N/A |
|
|
Russell 3000® Index1 |
% |
|
|
|
N/A |
|
|
Russell 2000® Index1 |
% |
|
|
|
N/A |
|
|
Class R6 |
% |
|
|
|
N/A |
|
|
Russell 3000® Index1 |
% |
|
|
|
N/A |
|
|
Russell 2000® Index1 |
% |
|
|
|
N/A |
|
|
Class S |
% |
|
|
|
N/A |
|
|
Russell 3000® Index1 |
% |
|
|
|
N/A |
|
|
Russell 2000® Index1 |
% |
|
|
|
N/A |
|
|
Class S2 |
% |
|
|
|
N/A |
|
|
Russell 3000® Index1 |
% |
|
|
|
N/A |
|
|
Russell 2000® Index1 |
% |
|
|
|
N/A |
|
1
Portfolio Management
|
Investment Adviser |
|
Voya Investments, LLC |
|
Sub-Adviser |
|
|
J.P. Morgan Investment Management Inc. | |
|
Portfolio Managers |
|
|
Wonseok Choi, Ph.D.
Portfolio Manager (since 11/2019) |
Akash Gupta, CFA
Portfolio Manager (since 11/2019) |
|
Phillip D. Hart, CFA
Portfolio Manager (since 11/2011) |
Robert Ippolito, CFA
Portfolio Manager (since 5/2023) |
|
Daniel J. Percella, CFA
Portfolio Manager (since 5/2014) |
Don San Jose, CFA
Portfolio Manager (since 11/2011) |
Purchase and Sale of Portfolio Shares
Shares of the Portfolio are not offered directly to the public. Purchase and sale of shares may be made only by separate accounts of insurance companies serving as investment options under Variable Contracts or by Qualified Plans, custodian accounts, and certain investment advisers and their affiliates, other investment companies, or permitted investors. Please refer to the prospectus for the appropriate insurance company separate account, investment company, or your plan documents for information on how to direct investments in, or sale from, an investment option corresponding to the Portfolio and any fees that may apply. Participating insurance companies and certain other designated organizations are authorized to receive purchase orders on the Portfolio's behalf.
Tax Information
Distributions made by the Portfolio to a Variable Contract or Qualified Plan, and exchanges and redemptions of Portfolio shares made by a Variable Contract or Qualified Plan, ordinarily do not cause the corresponding contract holder or plan participant to recognize income or gain for U.S. federal income tax purposes. See the Variable Contract prospectus or the governing documents of your Qualified Plan for information regarding the U.S. federal income tax treatment of the distributions to your Variable Contract or Qualified Plan and the holders of the contracts or plan participants.
Payments to Broker-Dealers and Other Financial Intermediaries
If you invest in the Portfolio through a Variable Contract issued by an insurance company or through a Qualified Plan that, in turn, was purchased or serviced through an insurance company, broker-dealer or other financial intermediary, the Portfolio and its Investment Adviser or distributor or their affiliates may: (1) make payments to the insurance company issuer of the Variable Contract or to the company servicing the Qualified Plan and (2) make payments to the insurance company, broker-dealer, or other financial intermediary. These payments may create a conflict of interest by: (1) influencing the insurance company or the company servicing the Qualified Plan to make the Portfolio available as an investment option for the Variable Contract
VY® JPMorgan Small Cap Core Equity Portfolio
71
or the Qualified Plan or (2) influencing the broker-dealer or other intermediary and your salesperson to recommend the Variable Contract or the pension servicing agent and/or the Portfolio over other options. Ask your salesperson or Qualified Plan administrator or visit your financial intermediary's website for more information.
VY® JPMorgan Small Cap Core Equity Portfolio
72
Expenses you pay each year as a % of the value of your investment
|
Class |
|
ADV |
R6 |
S |
S2 |
|
Management Fees |
% |
|
|
|
|
|
Distribution and/or Shareholder Services (12b-1) Fees |
% |
|
|
|
|
|
Other Expenses |
% |
|
|
|
|
|
Total Annual Portfolio Operating Expenses |
% |
|
|
|
|
|
Waivers and Reimbursements |
% |
|
|
|
|
|
Total Annual Portfolio Operating Expenses After
Waivers and Reimbursements |
% |
|
|
|
|
1
|
Class |
|
1 Yr |
3 Yrs |
5 Yrs |
10 Yrs |
|
ADV |
$ |
|
|
|
|
|
R6 |
$ |
|
|
|
|
|
S |
$ |
|
|
|
|
|
S2 |
$ |
|
|
|
|
73
VY® Morgan Stanley Global Franchise Portfolio
Principal Risks
VY® Morgan Stanley Global Franchise Portfolio
74
VY® Morgan Stanley Global Franchise Portfolio
75
VY® Morgan Stanley Global Franchise Portfolio
76
(as of December 31 of each year)
|
|
|
|
|
|
|
|
(for the periods ended December 31, 2025)
|
|
|
1 Yr |
5 Yrs |
10 Yrs |
Since
Inception |
Inception
Date |
|
Class ADV |
% |
- |
|
|
N/A |
|
|
MSCI ACWI1 |
% |
|
|
|
N/A |
|
|
MSCI World IndexSM1 |
% |
|
|
|
N/A |
|
|
Class R6 |
% |
|
|
|
N/A |
|
|
MSCI ACWI1 |
% |
|
|
|
N/A |
|
|
MSCI World IndexSM1 |
% |
|
|
|
N/A |
|
VY® Morgan Stanley Global Franchise Portfolio
77
|
|
|
1 Yr |
5 Yrs |
10 Yrs |
Since
Inception |
Inception
Date |
|
Class S |
% |
|
|
|
N/A |
|
|
MSCI ACWI1 |
% |
|
|
|
N/A |
|
|
MSCI World IndexSM1 |
% |
|
|
|
N/A |
|
|
Class S2 |
% |
|
|
|
N/A |
|
|
MSCI ACWI1 |
% |
|
|
|
N/A |
|
|
MSCI World IndexSM1 |
% |
|
|
|
N/A |
|
1
Portfolio Management
|
Investment Adviser |
|
Voya Investments, LLC |
|
Sub-Adviser |
|
Morgan Stanley Investment Management Inc. |
|
Sub-Sub-Adviser |
|
Morgan Stanley Investment Management Limited |
|
Portfolio Managers |
|
|
Alex Gabriele
Portfolio Manager (since 9/2017) |
Anton Kryachok
Portfolio Manager (since 10/2025) |
|
William D. Lock
Portfolio Manager (since 6/2009) |
Isabelle Mast
Portfolio Manager (since 10/2025) |
|
Bruno Paulson
Portfolio Manager (since 5/2010) |
Richard Perrott
Portfolio Manager (since 9/2017) |
Purchase and Sale of Portfolio Shares
Shares of the Portfolio are not offered directly to the public. Purchase and sale of shares may be made only by separate accounts of insurance companies serving as investment options under Variable Contracts or by Qualified Plans, custodian accounts, and certain investment advisers and their affiliates, other investment companies, or permitted investors. Please refer to the prospectus for the appropriate insurance company separate account, investment company, or your plan documents for information on how to direct investments in, or sale from, an investment option corresponding to the Portfolio and any fees that may apply. Participating insurance companies and certain other designated organizations are authorized to receive purchase orders on the Portfolio's behalf.
Tax Information
Distributions made by the Portfolio to a Variable Contract or Qualified Plan, and exchanges and redemptions of Portfolio shares made by a Variable Contract or Qualified Plan, ordinarily do not cause the corresponding contract holder or plan participant to recognize income or gain for U.S. federal income tax purposes. See the Variable Contract prospectus or the governing documents of your Qualified Plan for information regarding the U.S. federal income tax treatment of the distributions to your Variable Contract or Qualified Plan and the holders of the contracts or plan participants.
Payments to Broker-Dealers and Other Financial Intermediaries
If you invest in the Portfolio through a Variable Contract issued by an insurance company or through a Qualified Plan that, in turn, was purchased or serviced through an insurance company, broker-dealer or other financial intermediary, the Portfolio and its Investment Adviser or distributor or their affiliates may: (1) make payments to the insurance company issuer of the Variable Contract or to the company servicing the Qualified Plan and (2) make payments to the insurance company, broker-dealer, or other financial intermediary. These payments may create a conflict of interest by: (1) influencing the insurance company or the company servicing the Qualified Plan to make the Portfolio available as an investment option for the Variable Contract or the Qualified Plan or (2) influencing the broker-dealer or other intermediary and your salesperson to recommend the Variable Contract or the pension servicing agent and/or the Portfolio over other options. Ask your salesperson or Qualified Plan administrator or visit your financial intermediary's website for more information.
VY® Morgan Stanley Global Franchise Portfolio
78
Expenses you pay each year as a % of the value of your investment
|
Class |
|
ADV |
I |
R6 |
S |
S2 |
|
Management Fees |
% |
|
|
|
|
|
|
Distribution and/or Shareholder Services (12b-1) Fees |
% |
|
|
|
|
|
|
Other Expenses |
% |
|
|
|
|
|
|
Total Annual Portfolio Operating Expenses |
% |
|
|
|
|
|
|
Class |
|
1 Yr |
3 Yrs |
5 Yrs |
10 Yrs |
|
ADV |
$ |
|
|
|
|
|
I |
$ |
|
|
|
|
|
R6 |
$ |
|
|
|
|
|
S |
$ |
|
|
|
|
|
S2 |
$ |
|
|
|
|
79
VY® T. Rowe Price Capital Appreciation Portfolio
VY® T. Rowe Price Capital Appreciation Portfolio
80
Principal Risks
VY® T. Rowe Price Capital Appreciation Portfolio
81
VY® T. Rowe Price Capital Appreciation Portfolio
82
VY® T. Rowe Price Capital Appreciation Portfolio
83
VY® T. Rowe Price Capital Appreciation Portfolio
84
VY® T. Rowe Price Capital Appreciation Portfolio
85
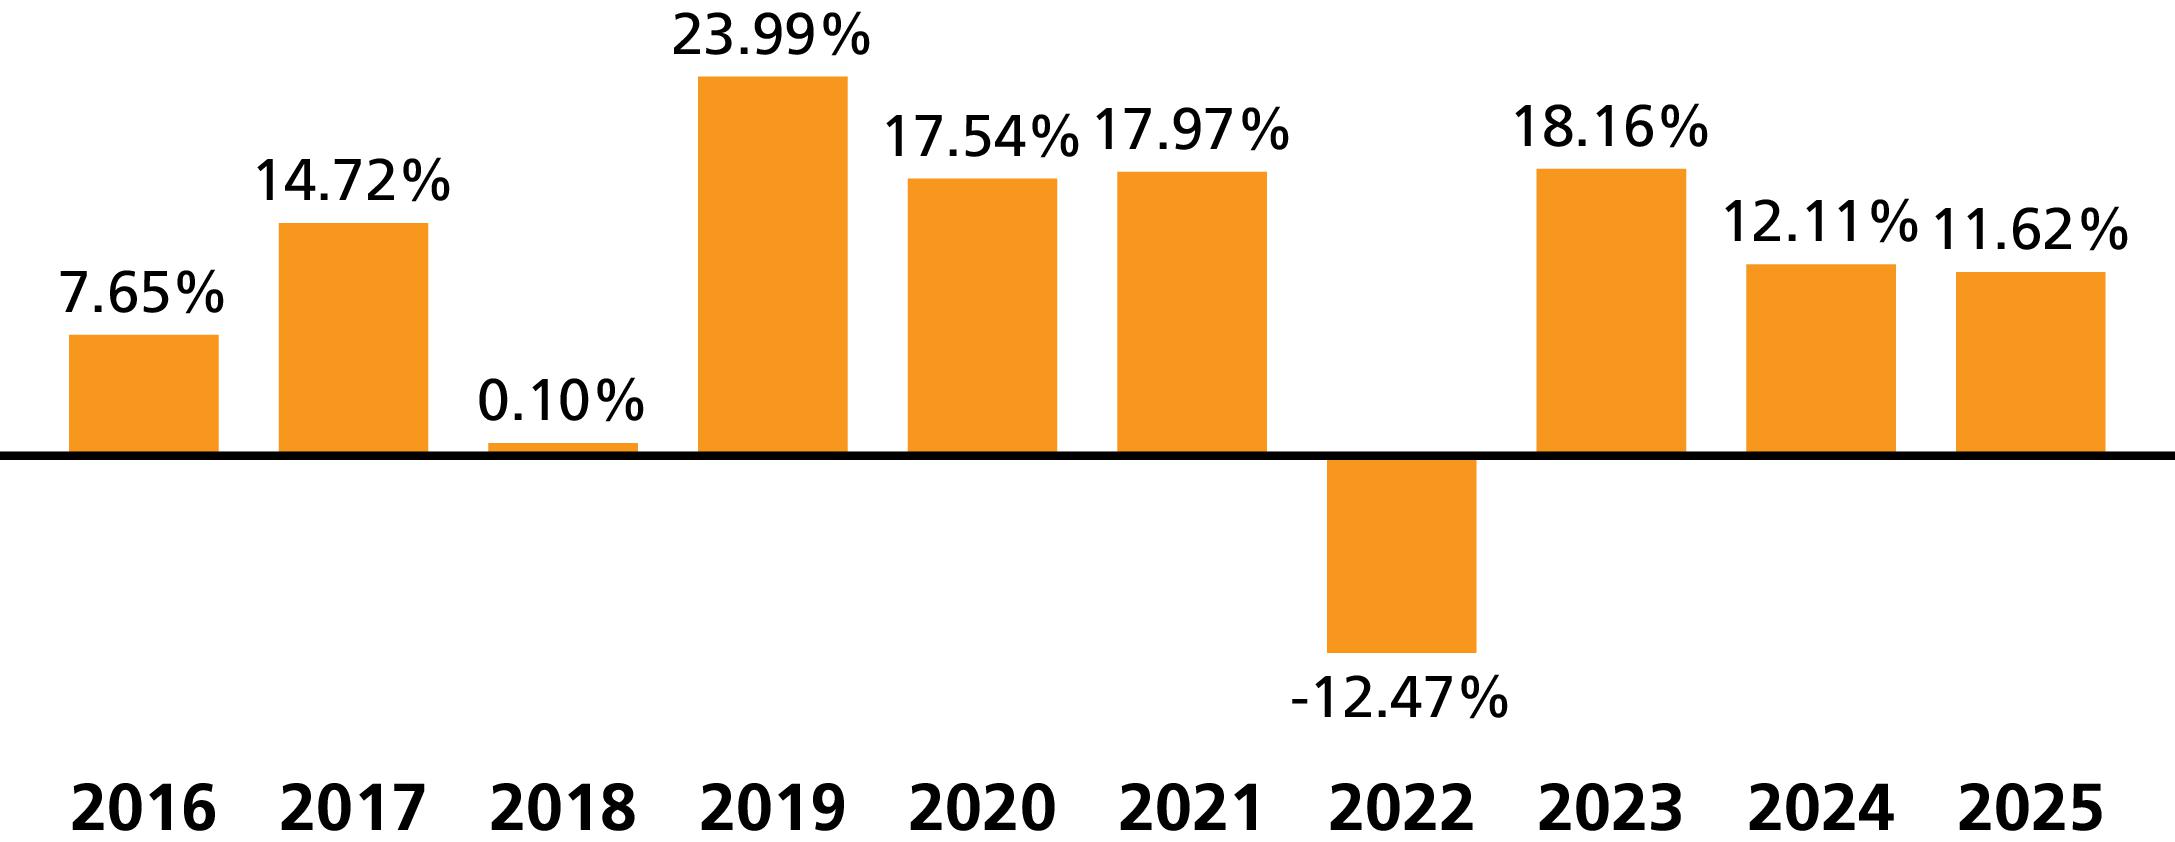
(as of December 31 of each year)
|
|
|
|
|
|
|
|
(for the periods ended December 31, 2025)
|
|
|
1 Yr |
5 Yrs |
10 Yrs |
Since
Inception |
Inception
Date |
|
Class ADV |
% |
|
|
|
N/A |
|
|
MSCI ACWI1 |
% |
|
|
|
N/A |
|
|
Bloomberg U.S. Aggregate Bond Index2 |
% |
|
- |
|
N/A |
|
|
S&P 500® Index2 |
% |
|
|
|
N/A |
|
|
Bloomberg U.S. Government/Credit Index2 |
% |
|
- |
|
N/A |
|
|
60% S&P 500® Index; 40% Bloomberg U.S. Government/Credit Index2 |
% |
|
|
|
N/A |
|
|
Class I |
% |
|
|
|
N/A |
|
|
MSCI ACWI1 |
% |
|
|
|
N/A |
|
|
Bloomberg U.S. Aggregate Bond Index2 |
% |
|
- |
|
N/A |
|
|
S&P 500® Index2 |
% |
|
|
|
N/A |
|
|
Bloomberg U.S. Government/Credit Index2 |
% |
|
- |
|
N/A |
|
|
60% S&P 500® Index; 40% Bloomberg U.S. Government/Credit Index2 |
% |
|
|
|
N/A |
|
|
Class R6 |
% |
|
|
|
N/A |
|
|
MSCI ACWI1 |
% |
|
|
|
N/A |
|
|
Bloomberg U.S. Aggregate Bond Index2 |
% |
|
- |
|
N/A |
|
|
S&P 500® Index2 |
% |
|
|
|
N/A |
|
|
Bloomberg U.S. Government/Credit Index2 |
% |
|
- |
|
N/A |
|
|
60% S&P 500® Index; 40% Bloomberg U.S. Government/Credit Index2 |
% |
|
|
|
N/A |
|
|
Class S |
% |
|
|
|
N/A |
|
|
MSCI ACWI1 |
% |
|
|
|
N/A |
|
|
Bloomberg U.S. Aggregate Bond Index2 |
% |
|
- |
|
N/A |
|
|
S&P 500® Index2 |
% |
|
|
|
N/A |
|
|
Bloomberg U.S. Government/Credit Index2 |
% |
|
- |
|
N/A |
|
|
60% S&P 500® Index; 40% Bloomberg U.S. Government/Credit Index2 |
% |
|
|
|
N/A |
|
|
Class S2 |
% |
|
|
|
N/A |
|
|
MSCI ACWI1 |
% |
|
|
|
N/A |
|
|
Bloomberg U.S. Aggregate Bond Index2 |
% |
|
- |
|
N/A |
|
|
S&P 500® Index2 |
% |
|
|
|
N/A |
|
|
Bloomberg U.S. Government/Credit Index2 |
% |
|
- |
|
N/A |
|
|
60% S&P 500® Index; 40% Bloomberg U.S. Government/Credit Index2 |
% |
|
|
|
N/A |
|
1
2
VY® T. Rowe Price Capital Appreciation Portfolio
86
Portfolio Management
|
Investment Adviser |
|
Voya Investments, LLC |
|
Sub-Adviser |
|
T. Rowe Price Associates, Inc. |
|
Sub-Sub-Adviser |
|
T. Rowe Price Investment Management, Inc. |
|
Portfolio Managers |
|
|
David R. Giroux, CFA
Portfolio Manager (since 7/2006) |
Vivek Rajeswaran
Portfolio Manager (since 6/2025) |
|
Mike Signore
Portfolio Manager (since 6/2025) |
Brian Solomon, CFA
Portfolio Manager (since 6/2025) |
Purchase and Sale of Portfolio Shares
Shares of the Portfolio are not offered directly to the public. Purchase and sale of shares may be made only by separate accounts of insurance companies serving as investment options under Variable Contracts or by Qualified Plans, custodian accounts, and certain investment advisers and their affiliates, other investment companies, or permitted investors. Please refer to the prospectus for the appropriate insurance company separate account, investment company, or your plan documents for information on how to direct investments in, or sale from, an investment option corresponding to the Portfolio and any fees that may apply. Participating insurance companies and certain other designated organizations are authorized to receive purchase orders on the Portfolio's behalf.
Tax Information
Distributions made by the Portfolio to a Variable Contract or Qualified Plan, and exchanges and redemptions of Portfolio shares made by a Variable Contract or Qualified Plan, ordinarily do not cause the corresponding contract holder or plan participant to recognize income or gain for U.S. federal income tax purposes. See the Variable Contract prospectus or the governing documents of your Qualified Plan for information regarding the U.S. federal income tax treatment of the distributions to your Variable Contract or Qualified Plan and the holders of the contracts or plan participants.
Payments to Broker-Dealers and Other Financial Intermediaries
If you invest in the Portfolio through a Variable Contract issued by an insurance company or through a Qualified Plan that, in turn, was purchased or serviced through an insurance company, broker-dealer or other financial intermediary, the Portfolio and its Investment Adviser or distributor or their affiliates may: (1) make payments to the insurance company issuer of the Variable Contract or to the company servicing the Qualified Plan and (2) make payments to the insurance company, broker-dealer, or other financial intermediary. These payments may create a conflict of interest by: (1) influencing the insurance company or the company servicing the Qualified Plan to make the Portfolio available as an investment option for the Variable Contract or the Qualified Plan or (2) influencing the broker-dealer or other intermediary and your salesperson to recommend the Variable Contract or the pension servicing agent and/or the Portfolio over other options. Ask your salesperson or Qualified Plan administrator or visit your financial intermediary's website for more information.
VY® T. Rowe Price Capital Appreciation Portfolio
87
KEY PORTFOLIO INFORMATION
This Prospectus contains information about each Portfolio and is designed to provide you with important information to help you with your investment decisions. Please read it carefully and keep it for future reference.
Each Portfolio's Statement of Additional Information (the “SAI”) is incorporated by reference into (legally made a part of) this Prospectus. It identifies investment restrictions, more detailed risk descriptions, a description of how the bond rating system works, and other information that may be helpful to you in your decision to invest. You may obtain a copy, without charge, from each Portfolio.
Neither this Prospectus, nor the related SAI, nor other communications to shareholders, such as proxy statements, is intended, or should be read, to be or give rise to an agreement or contract between Voya Investors Trust (the “Trust”), the Board of Trustees (the “Board”), or each Portfolio and any investor, or to give rise to any rights to any shareholder or other person other than any rights under U.S. federal or state law.
Other Voya mutual funds may also be offered to the public that have similar names, investment objectives, and principal investment strategies as those of a Portfolio. You should be aware that each Portfolio is likely to differ from these other Voya mutual funds in size and cash flow pattern, as well as other factors. Accordingly, the performance of each Portfolio can be expected to vary from the performance of other Voya mutual funds.
Other mutual funds and/or funds-of-funds may invest in a Portfolio. So long as a Portfolio accepts investments by other investment companies, it will not purchase securities of other investment companies, except to the extent permitted under the Investment Company Act of 1940, as amended, and the rules and regulations thereunder, and under the terms of applicable no-action relief or exemptive orders granted thereunder (the “1940 Act”).
Each Portfolio is a series of the Trust, a Massachusetts business trust. Each Portfolio is managed by Voya Investments, LLC (“Voya Investments” or the “Investment Adviser”).
Portfolio shares may be classified into different classes of shares. The classes of shares of a Portfolio would be substantially the same except for different expenses, certain related rights, and certain shareholder services. All share classes of a Portfolio have a common investment objective and investment portfolio.
Fundamental Investment Policies
Fundamental investment policies contained in the SAI may not be changed without shareholder approval. Other policies and investment strategies may be changed without a shareholder vote.
Portfolio Diversification
Each Portfolio's diversification status is outlined in the table below. A diversified fund may not, as to 75% of its total assets, invest more than 5% of its total assets in any one issuer and may not purchase more than 10% of the outstanding voting securities of any one issuer (other than securities issued or guaranteed by the U.S. government or any of its agencies or instrumentalities, or other investment companies). A non-diversified fund is not limited by the 1940 Act in the percentage of its assets that it may invest in the obligations of a single issuer.
|
Portfolio |
Diversified |
Non-Diversified |
|
Voya Government Liquid Assets Portfolio |
X |
|
|
Voya High Yield Portfolio |
X |
|
|
Voya Large Cap Growth Portfolio |
|
X |
|
Voya Limited Maturity Bond Portfolio |
X |
|
|
Voya U.S. Stock Index Portfolio1
|
X |
|
|
VY® CBRE Global Real Estate Portfolio |
X |
|
|
VY® Columbia Real Estate Portfolio |
|
X |
|
VY® Invesco Growth and Income Portfolio |
X |
|
|
VY® JPMorgan Emerging Markets Equity Portfolio |
X |
|
|
VY® JPMorgan Small Cap Core Equity Portfolio |
X |
|
|
VY® Morgan Stanley Global Franchise Portfolio |
|
X |
|
VY® T. Rowe Price Capital Appreciation Portfolio |
X |
|
1
In seeking to track the performance of the Index, the Portfolio may become “non-diversified,” as defined in the 1940 Act, as a result of a change in relative market capitalizations or index weightings of one or more components of the Index.
88
KEY PORTFOLIO INFORMATION (continued)
Investor Diversification
Although each Portfolio is designed to serve as a component of a diversified investment portfolio of securities, no single mutual fund can provide an appropriate investment program for all investors. You should evaluate a Portfolio in the context of your personal financial situation, investment objectives, and other investments.
Temporary Defensive Positions
When the Investment Adviser or a sub-adviser (each, a “Sub-Adviser”) anticipates adverse or unusual market, economic, political, or other conditions, a Portfolio may temporarily depart from its principal investment strategies as a defensive measure. In such circumstances, a Portfolio may make investments believed to present less risk, such as cash, cash equivalents, money market fund shares and other money market instruments, higher quality debt instruments, more liquid securities, or others. While a Portfolio invests defensively, it may not achieve its investment objective. A Portfolio's defensive investment position may not be effective in protecting its value. It is impossible to predict accurately how long such defensive position may be utilized.
Percentage and Rating Limitations
Unless otherwise indicated or as required by applicable law or regulation, the percentage and rating limitations on Portfolio investments listed in this Prospectus apply at the time of investment. If such a limitation is complied with at the time of an investment, any subsequent change in percentage resulting from a change in values or assets or a change in market capitalization of a company, or any subsequent change in rating, will generally not constitute a violation of that limitation.
Investment Not Guaranteed
Please note your investment is not a bank deposit and is not insured or guaranteed by the Federal Deposit Insurance Corporation, the Federal Reserve Board, or any other government agency.
Shareholder Reports
Each Portfolio's fiscal year ends December 31. Shareholders are provided with annual and semi-annual shareholder reports that highlight key information to shareholders. Other information, including financial statements, is available on the Voya funds’ website (https://individuals.voya.com/literature), delivered free of charge upon request, and filed with the SEC on a semi-annual basis on Form N-CSR. You may elect to receive shareholder reports and other communications from a fund electronically anytime by contacting your financial intermediary (such as a broker-dealer or bank) or, if you are a direct investor, by calling 1-800-992-0180 or by sending an e-mail request to Voyaim_literature@voya.com.
89
MORE INFORMATION ABOUT THE PORTFOLIOS
Additional Information About the Investment Objective
Each Portfolio's investment objective is non-fundamental and may be changed by a vote of the Board, without shareholder approval. A Portfolio will provide 60 days' prior written notice of any change in a non-fundamental investment objective. There is no guarantee a Portfolio will achieve its investment objective.
Additional Information About Principal Investment Strategies
For a complete description of each Portfolio's principal investment strategies, please see the Portfolio's summary prospectus or the Portfolio’s summary section in this Prospectus.
Additional Information About 80% Investment Policies Related to Portfolio Names
Each Portfolio listed in the table below has adopted a policy to invest in accordance with the investment focus that the Portfolio’s name suggests (the “80% Investment Policy”). A Portfolio will provide shareholders with at least 60 days' prior notice of any change in its 80% Investment Policy.
For purposes of satisfying its 80% Investment Policy, each Portfolio listed below may also invest in derivatives and other synthetic instruments and other investment companies, including ETFs, as applicable, that provide investment exposure to, or exposure to risk factors associated with, the investment focus that the Portfolio's name suggests.
|
Portfolio |
80% Investment Policy |
Additional Information About the 80%
Investment Policy |
|
Voya Government Liquid Assets Portfolio |
Under normal circumstances, the Portfolio
invests at least 80% of its net assets (plus
the amount of any borrowings for
investment purposes) in government
securities and repurchase agreements that
are collateralized by government securities
(for purposes of this 80% policy,
“Government Liquid Assets”). |
For purposes of this 80% policy,
government securities means any security
issued or guaranteed as to principal or
interest by the United States, or by a
person controlled or supervised by and
acting as an agency or instrumentality of
the government of the United States
pursuant to authority granted by the
Congress of the United States; or any
certificate of deposit for any of the
foregoing. |
|
Voya High Yield Portfolio |
Under normal circumstances, the Portfolio
invests at least 80% of its net assets (plus
the amount of any borrowings for
investment purposes) in a diversified
portfolio of high-yield bonds. |
For purposes of this 80% policy, high-yield
bonds include, without limitation, bonds,
debt instruments, and other fixed income
and income-producing debt instruments,
of any kind, issued or guaranteed by
governmental or private-sector entities
that are rated below investment grade by
one or more NRSROs or, if unrated,
determined by the Portfolio to be of
comparable quality. |
|
Voya Large Cap Growth Portfolio |
Under normal circumstances, the Portfolio
invests at least 80% of its net assets (plus
the amount of any borrowings for
investment purposes) in investments tied
to large-capitalization growth companies. |
For purposes of this 80% policy,
large-capitalization growth companies
means companies with market
capitalizations that fall within the
capitalization range of companies within
the Russell 1000® Growth Index and that
the Portfolio expects to generate capital
appreciation. |
90
MORE INFORMATION ABOUT THE PORTFOLIOS (continued)
|
Portfolio |
80% Investment Policy |
Additional Information About the 80%
Investment Policy |
|
Voya Limited Maturity Bond Portfolio |
Under normal circumstances, the Portfolio
invests at least 80% of its net assets (plus
the amount of any borrowings for
investment purposes) in a diversified
portfolio of bonds that are limited maturity
debt instruments. |
For purposes of this 80% policy, bonds
include, without limitation, bonds, debt
instruments, and other fixed income and
income-producing debt instruments, of
any kind, issued or guaranteed by
governmental or private-sector entities. |
|
Voya U.S. Stock Index Portfolio |
Under normal circumstances, the Portfolio
invests at least 80% of its net assets (plus
the amount of any borrowings for
investment purposes) in investments tied
to the S&P 500® Index (the “Index”). |
For purposes of this 80% policy,
investments tied to the Index include,
without limitation, equity securities of
companies included in the Index;
convertible securities that are convertible
into equity securities of companies
included in the Index; derivatives whose
economic returns are, by design, closely
equivalent to the returns of the Index or its
components; and ETFs that track the
Index. |
|
VY® CBRE Global Real Estate Portfolio |
Under normal circumstances, the Portfolio
invests at least 80% of its net assets (plus
the amount of any borrowings for
investment purposes) in investments tied
to companies that are principally engaged
in the real estate industry. |
For purposes of this 80% policy, a
company is principally engaged in the real
estate industry if the company: (i) derives
at least 50% of its total revenue or
earnings from owning, operating, leasing,
developing, constructing, financing,
managing, brokering, and/or selling
commercial, industrial, or residential real
estate; or (ii) has at least 50% of its
assets invested in real estate. For
purposes of this 80% policy, companies
principally engaged in the real estate
industry may include, without limitation,
REITs, master limited partnerships, real
estate owners, real estate managers, real
estate brokers, real estate dealers, and
companies with substantial real estate
holdings. |
|
VY® Columbia Real Estate Portfolio |
Under normal circumstances, the Portfolio
invests at least 80% of its net assets (plus
the amount of any borrowings for
investment purposes) in investments tied
to companies that are principally engaged
in the real estate industry. |
For purposes of this 80% policy, a
company is principally engaged in the real
estate industry if at least 50% of its gross
income or net profits are attributable to
the ownership, construction, management,
or sale of residential, commercial, or
industrial real estate. For purposes of this
80% policy, companies principally
engaged in the real estate industry may
include, without limitation, REITs, master
limited partnerships, real estate owners,
real estate managers, real estate brokers,
real estate dealers, and companies with
substantial real estate holdings. |
91
MORE INFORMATION ABOUT THE PORTFOLIOS (continued)
|
Portfolio |
80% Investment Policy |
Additional Information About the 80%
Investment Policy |
|
VY® JPMorgan Emerging Markets Equity
Portfolio |
Under normal circumstances, the Portfolio
invests at least 80% of its net assets (plus
the amount of any borrowings for
investment purposes) in equity securities
of issuers in emerging markets. |
For purposes of this 80% policy, emerging
markets means most countries in the
world except Australia, Canada, Japan,
New Zealand, the United Kingdom, the
United States, and most of the countries
of western Europe and Hong Kong. For
purposes of this 80% policy, equity
securities include, without limitation,
common stock, preferred stock,
convertible securities, depositary receipts,
participatory notes or other structured
notes, real estate-related securities
(including REITs), trust or partnership
interests, rights and warrants to buy
common stock, privately placed securities,
and IPOs. |
|
VY® JPMorgan Small Cap Core Equity
Portfolio |
Under normal circumstances, the Portfolio
invests at least 80% of its net assets (plus
the amount of any borrowings for
investment purposes) in equity securities
of small-capitalization companies. |
For purposes of this 80% policy,
small-capitalization companies means
companies with market capitalizations
that fall within the capitalization range of
companies within the Russell 2000®
Index. For purposes of this 80% policy,
equity securities include, without
limitation, common stock, preferred stock,
convertible securities, depositary receipts,
participatory notes or other structured
notes, real estate-related securities
(including REITs), trust or partnership
interests, rights and warrants to buy
common stock, privately placed securities,
and IPOs. |
Additional Information About the Principal Risks
All mutual funds involve risk—some more than others—and there is always the chance that you could lose money or not earn as much as you hope. Each Portfolio's risk profile is largely a factor of the principal securities in which it invests and investment techniques that it uses. Below is a discussion of the principal risks associated with certain types of the investments in which a Portfolio may invest and certain of the investment practices that a Portfolio may use. The discussion below expands on the risks included in each Portfolio's summary section of the Prospectus. The principal risks are presented in alphabetical order to facilitate readability, and their order does not imply that the realization of one risk is more likely to occur or have a greater adverse impact than another risk.
Many of the investment techniques and strategies discussed in this Prospectus and in the SAI are discretionary, which means that the Investment Adviser or Sub-Adviser, as the case may be, can decide whether to use them. A Portfolio may invest in these securities or use these techniques as part of its principal investment strategies. However, the Investment Adviser or Sub-Adviser may also use these investment techniques or make investments in securities that are not a part of a Portfolio’s principal investment strategies.
For more information about these and other types of securities and investment techniques that may be used by each Portfolio, see the SAI.
92
MORE INFORMATION ABOUT THE PORTFOLIOS (continued)
Asset Allocation: Investment performance depends on the manager’s skill in allocating assets among the asset classes in which a Portfolio invests and in choosing investments within those asset classes. There is a risk that the manager may allocate assets or investments to or within an asset class that underperforms compared to other asset classes or investments. A Portfolio may underperform funds that allocate their assets differently than the Portfolio, due to differences in the relative performance of asset classes and subsets of asset classes.
Bank Instruments: Bank instruments include certificates of deposit, fixed time deposits, bankers’ acceptances, and other debt and deposit-type obligations issued by banks. Changes in economic, regulatory, or political conditions, or other events that affect the banking industry may have an adverse effect on bank instruments or banking institutions that serve as counterparties in transactions with a Portfolio. In the event of a bank insolvency or failure, a Portfolio may be considered a general creditor of the bank, and it might lose some or all of the funds deposited with the bank. Even where it is recognized that a bank might be in danger of insolvency or failure, a Portfolio might not be able to withdraw or transfer its money from the bank in time to avoid any adverse effects of the insolvency or failure. Volatility in the banking system may impact the viability of banking and financial services institutions. In the event of failure of any of the financial institutions where a Portfolio maintains its cash and cash equivalents, there can be no assurance that the Portfolio would be able to access uninsured funds in a timely manner or at all and the Portfolio may incur losses. Any such event could adversely affect the business, liquidity, financial position and performance of the Portfolio.
Borrowing: Borrowing creates leverage, which may increase expenses and increase the impact of a Portfolio’s other risks. Borrowing may exaggerate any increase or decrease in a Portfolio’s net asset value causing a Portfolio to be more volatile than a fund that does not borrow. Borrowing for investment purposes is considered to be speculative and may result in losses to a Portfolio.
Cash/Cash Equivalents: Investments in cash or cash equivalents may lower returns and result in potential lost opportunities to participate in market appreciation which could negatively impact a Portfolio’s performance and ability to achieve its investment objective.
Changing Distribution Level: A Portfolio normally expects to receive income which may include interest, dividends and/or capital gains, depending upon its investments. The distribution amounts paid by a Portfolio will vary and generally depend on the amount of income a Portfolio earns (less expenses) on its portfolio holdings, and capital gains or losses it recognizes. A decline in a Portfolio’s income or net capital gains arising from its investments may reduce its distribution level.
China Investing Risks: The Chinese economy is generally considered an emerging and volatile market. Although China has experienced a relatively stable political environment in recent years, there is no guarantee that such stability will be maintained in the future. Significant portions of the Chinese securities markets may become rapidly illiquid because Chinese issuers have the ability to suspend the trading of their equity securities under certain circumstances, and have shown a willingness to exercise that option in response to market volatility, epidemics, pandemics, adverse economic, market or political events, and other events. Political, regulatory and diplomatic events, such as the U.S.-China “trade war” that intensified in 2018, could have an adverse effect on the Chinese or Hong Kong economies and on related investments. In addition, U.S. or foreign government restrictions on investments in Chinese companies or other intervention could negatively affect the implementation of a Portfolio’s investment strategies, such as by precluding the Portfolio from making certain investments or causing the Portfolio to sell investments at disadvantageous times.
•
Investing through Bond Connect: Chinese debt instruments trade on the China Interbank Bond Market (the “CIBM”) and may be purchased through a market access program, known as “Bond Connect,” that is designed to, among other things, enable foreign (non-U.S.) investment in the People’s Republic of China. There are significant risks inherent in investing in Chinese debt instruments, similar to the risks of investing in debt instruments in other emerging markets. The prices of debt instruments traded on the CIBM may fluctuate significantly due to low trading volume and potential lack of liquidity. The rules to access debt instruments that trade on the CIBM through Bond Connect are relatively new and subject to change, which may adversely affect a Portfolio's ability to invest in these instruments and to enforce its rights as a beneficial owner of these instruments. Trading through Bond Connect is subject to a number of restrictions that may affect a Portfolio’s investments and returns.
93
MORE INFORMATION ABOUT THE PORTFOLIOS (continued)
•
Investing through Stock Connect: Shares in mainland China-based companies that trade on Chinese stock exchanges such as the Shanghai Stock Exchange and the Shenzhen Stock Exchange (“China A-Shares”) may be purchased directly or indirectly through the Shanghai-Hong Kong Stock Connect (“Stock Connect”), a mutual market access program designed to, among other things, enable foreign investment in the People’s Republic of China (“PRC”) via brokers in Hong Kong. There are significant risks inherent in investing in China A-Shares through Stock Connect. The underdeveloped state of PRC’s investment and banking systems subjects the settlement, clearing, and registration of China A-Shares transactions to heightened risks. Stock Connect can only operate when both PRC and Hong Kong markets are open for trading and when banking services are available in both markets on the corresponding settlement days. As such, if either or both markets are closed on a U.S. trading day, a Portfolio may not be able to dispose of its China A-Shares in a timely manner, which could adversely affect the Portfolio’s performance.
•
Variable Interest Entities: Many Chinese companies use a structure known as a variable interest entity (a “VIE”) to address Chinese restrictions on direct foreign investment in Chinese companies operating in certain sectors. A Portfolio’s investment exposure to VIEs may pose additional risks because the Portfolio’s investment is not made directly in the VIE (the actual Chinese operating company), but rather in a holding company domiciled outside of China (a “Holding Company”) whose interests in the business of the underlying Chinese operating company (the VIE) are established through contracts rather than through equity ownership. The VIE (which a Portfolio is restricted from owning under Chinese law) is generally owned by Chinese nationals, and the Holding Company (in which a Portfolio invests) holds only contractual rights (rather than equity ownership) relating to the VIE, typically including a contractual claim on the VIE’s profits. Shares of the Holding Company, in turn, are traded on exchanges outside of China and are available to non-Chinese investors such as a Portfolio. While the VIE structure is a longstanding practice in China, until recently, such arrangements had not been formally recognized under Chinese law. However, in late 2021, the Chinese government signaled its interest in implementing filing requirement rules that would both affirm the legality of VIE structures and regulate them. How these filing requirements will operate in practice, and what will be required for approval, remains unclear. While there is optimism that these actions will reduce uncertainty over Chinese actions on VIEs, there is also caution given how unresolved the process is. Until these rules are finalized, and potentially afterwards depending on how they are implemented, there remains significant uncertainty associated with VIE investments.
There is a risk that the Chinese government may cease to tolerate VIE structures at any time or impose new restrictions on the structure, in each case either generally or with respect to specific issuers. In such a scenario, the Chinese operating company could be subject to penalties, including revocation of its business and operating license, or the Holding Company could forfeit its interest in the business of the Chinese operating company. Further, in case of a dispute between the Holding Company investors and the Chinese owners of the VIE, the Holding Company’s contractual claims with respect to the VIE may be unenforceable in China, thus limiting the remedies and rights of Holding Company investors such as a Portfolio. Control over a VIE may also be jeopardized if a natural person who holds the equity interest in the VIE breaches the terms of the contractual arrangements, is subject to legal proceedings, or if any physical instruments or property of the VIE, such as seals, business registration certificates, financial data and licensing arrangements (sometimes referred to as “chops”), are used without authorization. In the event of such an occurrence, a Portfolio, as a foreign investor, may have little or no legal recourse. Such legal uncertainty may be exploited against the interests of the Holding Company investors such as a Portfolio.
A Portfolio will typically have little or no ability to influence the VIE through proxy voting or other means because it is not a VIE owner/shareholder. Foreign (non-U.S.) companies listed on U.S. stock exchanges, including companies using the VIE structure, could also face delisting or other ramifications for failure to meet the expectations and/or requirements of the SEC, the Public Company Accounting Oversight Board, or other U.S. regulators. Any of these risks could reduce the liquidity and value of a Portfolio’s investments in Holding Companies or render them valueless.
Collateralized Loan Obligations and Other Collateralized Obligations: A collateralized loan obligation ( “ CLO ” ) is an obligation of a trust or other special purpose vehicle typically collateralized by a pool of loans, which may include senior secured and unsecured loans and subordinate corporate loans, including loans that may be rated below investment grade, or equivalent unrated loans. CLOs may incur management fees and administration fees. The risks of investing in a CLO depend largely on the type of the collateral held in the CLO portfolio and the tranche of securities in which
94
MORE INFORMATION ABOUT THE PORTFOLIOS (continued)
a Portfolio may invest, and can generally be summarized as a combination of economic risks of the underlying loans combined with the risks associated with the CLO structure governing the priority of payments, and include interest rate risk, credit risk, liquidity risk, prepayment and extension risk, and the risk of default of the underlying asset, among others.
Company: The price of a company’s stock could decline or underperform for many reasons, including, among others, poor management, financial problems, reduced demand for the company’s goods or services, regulatory fines and judgments, or business challenges. If a company is unable to meet its financial obligations, declares bankruptcy, or becomes insolvent, its stock could become worthless.
Concentration: To the extent that a Portfolio “concentrates,” as that term is defined in the 1940 Act, its assets in securities of a particular industry or group of industries, the Portfolio may be more sensitive to financial, economic, business, political, regulatory, and other developments and conditions, including natural or other disasters, affecting issuers in a particular industry or group of industries, and if securities of such industry or group of industries fall out of favor, the Portfolio could underperform, or be more volatile than, a fund that is more broadly invested across industries.
•
Real Estate Industry: Investments in companies involved in the real estate industry, including real estate investment trusts, may be subject to risks similar to those associated with the direct ownership of real estate, including terrorist attacks, war, or other acts that destroy real property. In addition, these investments may be affected by such factors as falling real estate prices, rising interest rates or property taxes, high foreclosure rates, zoning changes, overbuilding, overall declines in the economy, and the management skill and creditworthiness of the company. Real estate investment trusts may also be affected by tax and regulatory requirements. The prices of real estate-related assets generally have not decreased as much as may be expected based on historical correlations between interest rates and prices of real estate-related assets. This presents an increased risk of a correction or severe downturn in real estate-related asset prices, which could adversely impact the value of other investments as well (such as loans, securitized debt, and other debt instruments). This risk is particularly present with respect to commercial real estate-related asset prices, and the value of other investments with a connection to the commercial real estate sector. As examples of the current risks faced by real estate-related assets: tenant vacancy rates, tenant turnover and tenant concentration have increased; owners of real estate have faced headwinds, delinquencies, and difficulties in collecting rents and other payments (which increases the risk of owners being unable to pay or otherwise defaulting on their own borrowings and obligations); property values have declined; inflation, upkeep costs, and other expenses have increased; and rents have declined for many properties.
Convertible Securities: Convertible securities are securities that are convertible into or exercisable for common stocks at a stated price or rate. Convertible securities are subject to the usual risks associated with debt instruments, such as interest rate risk and credit risk. In addition, because convertible securities react to changes in the value of the underlying stock, they are subject to market risk. Synthetic convertible securities may present a greater degree of market risk, and may be more volatile, less liquid and more difficult to price accurately than less complex securities. The value of a convertible security will normally fluctuate in some proportion to changes in the value of the underlying stock because of the conversion or exercise feature. However, the value of a convertible security may not increase or decrease as rapidly as the underlying stock. Convertible securities may be rated below investment grade and therefore may be subject to greater levels of credit risk and liquidity risk. In the event the issuer of a convertible security is unable to meet its financial obligations, declares bankruptcy, or becomes insolvent, a Portfolio could lose money; such events may also have the effect of reducing a Portfolio's distributable income. There is a risk that a Portfolio may convert a convertible security at an inopportune time, which may decrease the Portfolio’s returns.
Covenant-Lite Loans: Loans in which a Portfolio may invest or to which a Portfolio may gain exposure indirectly through its investments in collateralized debt obligations, CLOs or other types of structured securities may be considered “covenant-lite” loans. Covenant-lite refers to loans which do not incorporate traditional performance-based financial maintenance covenants. Covenant-lite does not refer to a loan’s seniority in a borrower’s capital structure nor to a lack of the benefit from a legal pledge of the borrower’s assets and does not necessarily correlate to the overall credit quality of the borrower. Covenant-lite loans generally do not include terms which allow a lender to take action based on a borrower’s performance relative to its covenants. Such actions may include the ability to renegotiate and/or re-set the credit spread on the loan with a borrower, and even to declare a default or force the borrower into bankruptcy restructuring if certain criteria are breached. Covenant-lite loans typically still provide lenders with other covenants that restrict a borrower from incurring additional debt or engaging in certain actions. Such covenants can only be
95
MORE INFORMATION ABOUT THE PORTFOLIOS (continued)
breached by an affirmative action of the borrower, rather than by a deterioration in the borrower’s financial condition. Accordingly, a Portfolio may have fewer rights against a borrower when it invests in, or has exposure to, covenant-lite loans and, accordingly, may have a greater risk of loss on such investments as compared to investments in, or exposure to, loans with additional or more conventional covenants.
Credit: A Portfolio could lose money if the issuer or guarantor of a debt instrument in which the Portfolio invests, or the counterparty to a derivative contract the Portfolio entered into, is unable or unwilling, or is perceived (whether by market participants, rating agencies, pricing services, or otherwise) as unable or unwilling, to meet its financial obligations. Asset-backed (including mortgage-backed) securities that are not issued by U.S. government agencies may have a greater risk of default because they are not guaranteed by either the U.S. government or an agency or instrumentality of the U.S. government. The credit quality of typical asset-backed securities depends primarily on the credit quality of the underlying assets and the structural support (if any) provided to the securities.
Credit Default Swaps: A Portfolio may enter into credit default swaps, either as a buyer or a seller of the swap. A buyer of a credit default swap is generally obligated to pay the seller an upfront or a periodic stream of payments over the term of the contract until a credit event, such as a default, on a reference obligation has occurred. If a credit event occurs, the seller generally must pay the buyer the “par value” (full notional value) of the swap in exchange for an equal face amount of deliverable obligations of the reference entity described in the swap, or the seller may be required to deliver the related net cash amount if the swap is cash settled. As a seller of a credit default swap, a Portfolio would effectively add leverage to its portfolio because, in addition to its total net assets, the Portfolio would be subject to investment exposure on the full notional value of the swap. Credit default swaps are particularly subject to counterparty, credit, valuation, liquidity and leveraging risks, and the risk that the swap may not correlate with its reference obligation as expected. Certain standardized credit default swaps are subject to mandatory central clearing. Central clearing is expected to reduce counterparty credit risk and increase liquidity; however, there is no assurance that it will achieve that result, and in the meantime, central clearing and related requirements expose a Portfolio to different kinds of costs and risks. In addition, credit default swaps expose a Portfolio to the risk of improper valuation.
Currency: To the extent that a Portfolio invests directly or indirectly in foreign (non-U.S.) currencies or in securities denominated in, or that trade in, foreign (non-U.S.) currencies, it is subject to the risk that those foreign (non-U.S.) currencies will decline in value relative to the U.S. dollar or, in the case of hedging positions, that the U.S. dollar will decline in value relative to the currency being hedged by the Portfolio through foreign currency exchange transactions. Currency rates may fluctuate significantly over short periods of time. Currency rates may be affected by changes in market interest rates, intervention (or the failure to intervene) by the U.S. or foreign (non-U.S.) governments, central banks or supranational entities such as the International Monetary Fund, by the imposition of currency controls, or other political or economic developments in the U.S. or abroad.
Deflation: Deflation occurs when prices throughout the economy decline over time — the opposite of inflation. Unless repayment of the original bond principal upon maturity (as adjusted for inflation) is guaranteed, when there is deflation, the principal and income of an inflation-protected bond will decline and could result in losses.
Derivative Instruments: Derivative instruments are subject to a number of risks, including the risk of changes in the market price of the underlying asset, reference rate, or index, credit risk with respect to the counterparty, risk of loss due to changes in market interest rates, liquidity risk, valuation risk, and volatility risk. The amounts required to purchase certain derivatives may be small relative to the magnitude of exposure assumed by a Portfolio. Therefore, the purchase of certain derivatives may have an economic leveraging effect on a Portfolio and exaggerate any increase or decrease in the net asset value. Derivatives may not perform as expected, so a Portfolio may not realize the intended benefits. When used for hedging purposes, the change in value of a derivative may not correlate as expected with the asset, reference rate, or index being hedged. When used as an alternative or substitute for direct cash investment, the return provided by the derivative may not provide the same return as direct cash investment. Generally, derivatives are sophisticated financial instruments whose performance is derived, at least in part, from the performance of an underlying asset, reference rate, or index. Derivatives include, among other things, swap agreements, options, forward foreign currency exchange contracts, and futures. Certain derivatives in which a Portfolio may invest may be negotiated over-the-counter with a single counterparty and as a result are subject to credit risks related to the counterparty’s ability or willingness to perform its obligations; any deterioration in the counterparty’s creditworthiness could adversely affect the value of the derivative. In addition, derivatives and their underlying instruments may experience periods of illiquidity which could cause a Portfolio to hold a position it might otherwise sell, or to sell a position it otherwise might hold at an
96
MORE INFORMATION ABOUT THE PORTFOLIOS (continued)
inopportune time or price. A manager might imperfectly judge the direction of the market. For instance, if a derivative is used as a hedge to offset investment risk in another security, the hedge might not correlate to the market’s movements and may have unexpected or undesired results such as a loss or a reduction in gains. The U.S. government has enacted legislation that provides for regulation of the derivatives market, including clearing, margin, reporting, and registration requirements. The European Union (and other jurisdictions outside of the European Union, including the United Kingdom) has implemented or is in the process of implementing similar requirements, which may affect a Portfolio when it enters into a derivatives transaction with a counterparty organized in that jurisdiction or otherwise subject to that jurisdiction’s derivatives regulations. Because these requirements continue to evolve, their ultimate impact remains unclear. Central clearing is expected to reduce counterparty credit risk and increase liquidity; however, there is no assurance that it will achieve that result, and, in the meantime, central clearing and related requirements expose a Portfolio to different kinds of costs and risks.
•
Contracts for Differences (“CFDs”): CFDs are swap arrangements in which the parties agree that their return (or loss) will be based on the relative performance of two or more individual securities, different groups or baskets of securities or other instruments where the parties agree to exchange the difference in the settlement price between the open and closing trades on a particular asset(s). CFDs enable investors to speculate on whether a market will go up or down, and profit from the price movement without owning the underlying asset(s). CFDs essentially allow investors to trade the direction of securities, including over the very short term. CFDs are subject to the risks described above under Derivatives Instruments.
•
Swaps: In a typical swap transaction, two parties agree to exchange the return earned on a specified underlying reference for a fixed return or the return from another underlying reference during a specified period of time. Swaps may be difficult to value and may be illiquid. Swaps could result in Portfolio losses if the underlying asset or reference does not perform as anticipated. Swaps create significant investment leverage such that a relatively small price movement in a swap may result in immediate and substantial losses to a Portfolio. A Portfolio may only close out a swap with its particular counterparty, and may only transfer a position with the consent of that counterparty. Certain swaps, such as short swap transactions and total return swaps, have the potential for unlimited losses, regardless of the size of the initial position.
Dividend: Companies that issue dividend yielding equity securities are not required to continue to pay dividends on such securities. Therefore, there is a possibility that such companies could reduce or eliminate the payment of dividends in the future. As a result, a Portfolio’s ability to execute its investment strategy may be limited.
Environmental, Social, and Governance (Equity): A Sub-Adviser’s consideration of ESG factors in selecting investments for a Portfolio is based on information that is not standardized, some of which can be qualitative and subjective by nature. A Sub-Adviser’s assessment of ESG factors in respect of a company may rely on third-party data that might be incorrect or based on incomplete or inaccurate information. There is no minimum percentage of a Portfolio’s assets that will be invested in companies that a Sub-Adviser views favorably in light of ESG factors, and the Sub-Adviser may choose not to invest in companies that compare favorably to other companies on the basis of ESG factors. It is possible that a Portfolio will have less exposure to certain companies due to a Sub-Adviser’s assessment of ESG factors than other comparable mutual funds. There can be no assurance that an investment selected by a Sub-Adviser, which includes its consideration of ESG factors, when available, will provide more favorable investment performance than another potential investment, and such an investment may, in fact, underperform other potential investments.
Environmental, Social, and Governance (Fixed Income): A Sub-Adviser’s consideration of ESG factors in selecting investments for a Portfolio is based on information that is not standardized, some of which can be qualitative and subjective by nature. A Sub-Adviser’s assessment of ESG factors in respect of obligations of an issuer may rely on third-party data that might be incorrect or based on incomplete or inaccurate information. There is no minimum percentage of a Portfolio’s assets that will be invested in obligations of issuers that a Sub-Adviser views favorably in light of ESG factors, and the Sub-Adviser may choose not to invest in obligations of issuers that compare favorably to obligations of other issuers on the basis of ESG factors. It is possible that a Portfolio will have less exposure to obligations of certain issuers due to a Sub-Adviser’s assessment of ESG factors than other comparable mutual funds. There can be no assurance that an investment selected by a Sub-Adviser, which includes its consideration of ESG factors, when available, will provide more favorable investment performance than another potential investment, and such an investment may, in fact, underperform other potential investments.
97
MORE INFORMATION ABOUT THE PORTFOLIOS (continued)
Floating Rate Loans: In the event a borrower fails to pay scheduled interest or principal payments on a floating rate loan (which can include certain bank loans), a Portfolio will experience a reduction in its income and a decline in the market value of such floating rate loan. If a floating rate loan is held by a Portfolio through another financial institution, or the Portfolio relies upon another financial institution to administer the loan, the receipt of scheduled interest or principal payments may be subject to the credit risk of such financial institution. Investors in floating rate loans may not be afforded the protections of the anti-fraud provisions of the Securities Act of 1933, as amended, and the Securities Exchange Act of 1934, as amended, because loans may not be considered “securities” under such laws. Additionally, the value of collateral, if any, securing a floating rate loan can decline or may be insufficient to meet the borrower’s obligations under the loan, and such collateral may be difficult to liquidate. No active trading market may exist for many floating rate loans and many floating rate loans are subject to restrictions on resale. Transactions in loans typically settle on a delayed basis and may take longer than 7 days to settle. As a result, a Portfolio may not receive the proceeds from a sale of a floating rate loan for a significant period of time. Delay in the receipts of settlement proceeds may impair the ability of a Portfolio to meet its redemption obligations, and may limit the ability of the Portfolio to repay debt, pay dividends, or to take advantage of new investment opportunities.
Focused Investing: To the extent that a Portfolio invests a substantial portion of its assets in securities of a particular industry, sector, market segment, or geographic area, the Portfolio may be more sensitive to financial, economic, business, political, regulatory, and other developments and conditions, including natural or other disasters, affecting issuers in a particular industry, sector, market segment, or geographic area in which the Portfolio focuses its investments, and if securities of such industry, sector, market segment, or geographic area fall out of favor, the Portfolio could underperform, or be more volatile than, a fund that has greater diversification.
•
Financials Sector: Investments in the financials sector may be subject to credit risk, interest rate risk, and regulatory risk, among others. Banks and other financial institutions can be affected by such factors as downturns in the U.S. and foreign economies and general economic cycles, fiscal and monetary policy (including the effects of changes in interest rates), adverse developments in the real estate market, the deterioration or failure of other financial institutions, and changes in banking or securities regulations.
•
Health Care Sector: Investments in companies involved in the health care sector are strongly affected by worldwide scientific or technological developments. Products sold by companies in the health care sector may rapidly become obsolete and are also often dependent on access to resources and the company’s ability to receive patents from regulatory agencies. Many health care companies also are subject to significant government regulation and may be affected by changes in governmental policies. As a result, investments in health care companies include the risk that the economic prospects, and the share prices, of such companies can fluctuate dramatically.
•
Technology Sector: Investments in companies involved in the technology sector are subject to significant competitive pressures, such as aggressive pricing of products or services, new market entrants, competition for market share, short product cycles due to an accelerated rate of technological developments, evolving industry standards, changing customer demands, and the potential for limited earnings and/or falling profit margins. The failure of a company to adapt to such changes could have a material adverse effect on the company’s business, results of operations, and financial condition. These companies also face the risks that new services, equipment, or technologies will not be accepted by consumers and businesses or will become rapidly obsolete. These factors can affect the profitability of these companies and, as a result, the values of their securities. Many companies involved in the technology sector have limited operating histories, and prices of these companies’ securities historically have been more volatile than those of many other companies’ securities, especially over the short term.
Foreign (Non-U.S.) Investments/Developing and Emerging Markets: To the extent a Portfolio invests in securities of issuers in markets outside the U.S., its share price may be more volatile than if it invested in securities of issuers in the U.S. market due to, among other things, the following factors: comparatively unstable political, social, and economic conditions and limited or ineffectual judicial systems; wars; comparatively small market sizes, making securities less liquid and securities prices more sensitive to the movements of large investors and more vulnerable to manipulation; governmental policies or actions, such as high taxes, restrictions on currency movements, replacement of currency, potential for default on sovereign debt, trade or diplomatic disputes, which may include the imposition of economic sanctions (or the threat of new or modified sanctions) or other measures by the U.S. or other governments and supranational organizations, creation of monopolies, and seizure of private property through confiscatory taxation and expropriation or nationalization of company assets; incomplete, outdated, or unreliable information about securities issuers due to
98
MORE INFORMATION ABOUT THE PORTFOLIOS (continued)
less stringent market regulation and accounting, auditing and financial reporting standards and practices; comparatively undeveloped markets and weak banking and financial systems; market inefficiencies, such as higher transaction costs, and administrative difficulties, such as delays in processing transactions; and fluctuations in foreign currency exchange rates, which could reduce gains or widen losses.
Economic or other sanctions imposed on a foreign (non-U.S.) country or issuer by the U.S. or on the U.S. by a foreign (non-U.S.) country, could impair a Portfolio's ability to buy, sell, hold, receive, deliver, or otherwise transact in certain securities. In addition, foreign withholding or other taxes could reduce the income available for distribution to shareholders, and special U.S. tax considerations could apply to foreign (non-U.S.) investments. Depositary receipts are subject to risks of foreign (non-U.S.) investments and might not always track the price of the underlying foreign (non-U.S.) security. Markets and economies throughout the world are becoming increasingly interconnected, and conditions or events in one market, country or region may adversely impact investments or issuers in another market, country or region.
The United Kingdom (the “UK”) left the European Union (the “EU”) on January 31, 2020 (commonly known as “Brexit”). The UK and the EU entered into a Trade and Cooperation Agreement that sets out the agreement for certain parts of the future relationship from January 1, 2021, but uncertainty remains in certain areas regarding the future UK-EU relationship.
From January 1, 2021, EU laws ceased to apply in the UK, with many being assimilated into UK law. The UK government has enacted legislation to repeal, replace or make substantial amendments to these laws, with a view to them being replaced by purely domestic legislation. The process of revoking EU laws and replacing them with bespoke UK laws has already begun, creating unpredictable consequences for financial markets and investments. Brexit could significantly impact the UK, European, and global macroeconomic conditions, leading to prolonged political, legal, regulatory, tax, and economic uncertainty. This uncertainty may affect opportunities, pricing, availability, and cost of financing, regulation, values, or exit opportunities of companies or assets based in, doing business with, or having significant relationships in the UK or EU.
Additionally, certain European countries have developed increasingly strained relationships with the U.S., and if these relations were to worsen, they could adversely affect European issuers that rely on the U.S. for trade. Moreover, the national politics of countries in Europe have been unpredictable and subject to influence by disruptive political groups and ideologies, including for example, secessionist movements. The governments of European countries may be subject to change and such countries may experience social and political unrest.
Foreign (non-U.S.) investment risks may be greater in developing and emerging markets than in developed markets, for such reasons as social or political unrest, heavy economic dependence on international aid, agriculture or exports (particularly commodities), undeveloped or overburdened infrastructures and legal systems, vulnerability to natural disasters, significant and unpredictable government intervention in markets or the economy, volatile currency exchange rates, currency devaluations, runaway inflation, business practices that depart from norms for developed countries, and generally less developed or liquid markets. In certain emerging market countries, governments participate to a significant degree, through ownership or regulation, in their respective economies. Action by these governments could have a significant adverse effect on market prices of securities and payments of dividends. The Public Company Accounting Oversight Board, which regulates auditors of U.S. public companies, is unable to inspect audit work papers in certain foreign (non-U.S.) countries. Investors in foreign (non-U.S.) countries often have limited rights and few practical remedies to pursue shareholder claims, including class actions or fraud claims, and the ability of the SEC, the U.S. Department of Justice and other authorities to bring and enforce actions against foreign (non-U.S.) issuers or persons is limited. Settlement and asset custody practices for transactions in emerging markets may differ from those in developed markets. Such differences may include possible delays in settlement and certain settlement practices, such as delivery of securities prior to receipt of payment, which increases the likelihood of a “failed settlement.” Failed settlements can result in losses.
In addition, the Holding Foreign Companies Accountable Act (the “HFCAA”) could cause securities of a foreign (non-U.S.) company, including American Depositary Receipts, to be delisted from U.S. stock exchanges if the company does not allow the U.S. government to oversee the auditing of its financial information. Although the requirements of the HFCAA apply to securities of all foreign (non-U.S.) issuers, the SEC has thus far limited its enforcement efforts to securities of Chinese companies. If securities are delisted, a Portfolio’s ability to transact in such securities will be impaired, and the liquidity and market price of the securities may decline. A Portfolio may also need to seek other markets in which to transact in such securities, which could increase the Portfolio’s costs.
99
MORE INFORMATION ABOUT THE PORTFOLIOS (continued)
Growth Investing: Prices of growth-oriented stocks are more sensitive to investor perceptions of the issuer’s growth potential and may fall quickly and significantly if investors suspect that actual growth may be less than expected. There is a risk that funds that invest in growth-oriented stocks may underperform other funds that invest more broadly. Growth-oriented stocks tend to be more volatile than value-oriented stocks, and may underperform the market as a whole over any given time period. Growth-oriented stocks typically sell at relatively high valuations as compared to other types of securities. Securities of growth companies may be more volatile than other stocks because they usually invest a high portion of earnings in their business, and they may lack the dividends of value-oriented stocks that can cushion stock prices in a falling market. The market may not favor growth-oriented stocks or may not favor equities at all. In addition, earnings disappointments may lead to sharply falling prices because investors buy growth-oriented stocks in anticipation of superior earnings growth. Historically, growth-oriented stocks have been more volatile than value-oriented stocks.
High-Yield Securities: Lower-quality securities including securities that are or have fallen below investment grade (commonly referred to as “junk bonds”) have greater credit risk and liquidity risk than higher-quality (investment grade) securities, and their issuers' long-term ability to make payments is considered speculative. Prices of lower-quality bonds or other debt instruments are also more volatile, are more sensitive to negative news about the economy or the issuer, and have greater liquidity risk and price volatility.
Index Strategy (Portfolio): The index selected may underperform the overall market. To the extent a Portfolio (or a portion of the Portfolio) seeks to track an index’s performance, the Portfolio will not use defensive positions or attempt to reduce its exposure to poor performing securities in the index. To the extent a Portfolio’s investments track its target index, the Portfolio may underperform other funds that invest more broadly. Errors in index data, index computations or the construction of the index in accordance with its methodology may occur from time to time and may not be identified and corrected by the index provider for a period of time or at all, which may have an adverse impact on a Portfolio. The correlation between a Portfolio’s performance and index performance may be affected by the Portfolio’s expenses and the timing of purchases and redemptions of the Portfolio’s shares. In addition, a Portfolio’s actual holdings might not match the index and the Portfolio’s effective exposure to index securities at any given time may not precisely correlate.
Inflation-Indexed Bonds: If the index measuring inflation falls, the principal value of inflation-indexed bonds will be adjusted downward, and consequently, the interest payable on these bonds (calculated with respect to a smaller principal amount) will be reduced. In addition, inflation-indexed bonds are subject to the usual risks associated with debt instruments, such as interest rate and credit risk. Repayment of the original bond principal upon maturity (as adjusted for inflation) is guaranteed in the case of U.S. Treasury inflation-indexed bonds. For bonds that do not provide a similar guarantee, the adjusted principal value of the bond repaid at maturity may be less than the original principal.
Initial Public Offerings: Investments in IPOs and companies that have recently gone public have the potential to produce substantial gains for a Portfolio. However, there is no assurance that a Portfolio will have access to profitable IPOs or that the IPOs in which the Portfolio invests will rise in value. Furthermore, the value of securities of newly public companies may decline in value shortly after the IPO. When a Portfolio’s asset base is small, the impact of such investments on the Portfolio’s return will be magnified. If a Portfolio’s assets grow, it is likely that the effect of the Portfolio’s investment in IPOs on the Portfolio’s return will decline.
Interest in Loans: The value and the income streams of interests in loans (including participation interests in lease financings and assignments in secured variable or floating rate loans) will decline if borrowers delay payments or fail to pay altogether. A significant rise in market interest rates could increase this risk. Although loans may be fully collateralized when purchased, such collateral may become illiquid or decline in value.
Interest Rate: A rise in market interest rates generally results in a fall in the value of bonds and other debt instruments; conversely, values generally rise as market interest rates fall. Interest rate risk is generally greater for debt instruments than floating-rate instruments. The higher the credit quality of the instrument, and the longer its maturity or duration, the more sensitive it is to changes in market interest rates. Duration is a measure of sensitivity of the price of a debt instrument to a change in interest rate. The U.S. Federal Reserve Board recently lowered interest rates following a period of consistent rate increases. Declining market interest rates increase the likelihood that debt instruments will be pre-paid. Rising market interest rates have unpredictable effects on the markets and may expose debt and related markets to heightened volatility. To the extent that a Portfolio invests in debt instruments, an increase in market interest rates may lead to increased redemptions and increased portfolio turnover, which could reduce liquidity for certain
100
MORE INFORMATION ABOUT THE PORTFOLIOS (continued)
investments, adversely affect values, and increase costs. Increased redemptions may cause a Portfolio to liquidate portfolio positions when it may not be advantageous to do so and may lower returns. If dealer capacity in debt markets is insufficient for market conditions, it may further inhibit liquidity and increase volatility in debt markets. Fiscal, economic, monetary, or other governmental policies or measures have in the past, and may in the future, cause or exacerbate risks associated with interest rates, including changes in interest rates. Negative or very low interest rates could magnify the risks associated with changes in interest rates. In general, changing interest rates, including rates that fall below zero, could have unpredictable effects on markets and may expose debt and related markets to heightened volatility. In the case of inverse debt instruments, the interest rate paid by the debt instruments is a floating rate, which will generally decrease when the market rate of interest to which the inverse debt instruments are indexed increases and will increase when the market rate of interest to which the inverse debt instruments are indexed decreases. Changes to monetary policy by the U.S. Federal Reserve Board or other regulatory actions could expose debt and related markets to heightened volatility, interest rate sensitivity, and reduced liquidity, which may impact a Portfolio’s operations and return potential.
Investment Model: A Sub-Adviser’s proprietary investment model may not adequately take into account existing or unforeseen market factors or the interaction among such factors, including changes in how such factors interact, and there is no guarantee that the use of a proprietary investment model will result in effective investment decisions for a Portfolio. Proprietary investment models used by a Sub-Adviser to evaluate securities or securities markets are based on the Sub-Adviser’s understanding of the interplay of market factors and do not assure successful investment. The markets, or the price of individual securities, may be affected by factors not foreseen in the construction of the proprietary investment models. Portfolios that are actively managed, in whole or in part, according to a quantitative investment model (including models that utilize forms of artificial intelligence, such as machine learning) can perform differently from the market, based on the investment model and the factors used in the analysis, the weight placed on each factor, and changes from the factors’ historical trends. Technical issues in the design, development, implementation, application, and maintenance of the models (e.g., stale or inaccurate data, human error, programming or other software issues, coding errors, and technology failures) may create errors or limitations that might go undetected or are discovered only after the errors or limitations have negatively impacted performance.
Issuer Non-Diversification: A non-diversified investment company is subject to the risks of focusing investments in a small number of issuers, including being more susceptible to risks associated with a single economic, political or regulatory occurrence than a more diversified portfolio might be. In addition, this increases the risk that a change in the value of any one investment held by a portfolio could affect the overall value of a portfolio more than it would affect that of a diversified fund holding a greater number of investments. Accordingly, a portfolio’s value will likely be more volatile than the value of a more diversified fund. Portfolios that are non-diversified may invest a greater percentage of their assets in the securities of a single issuer (such as bonds issued by a particular state) than funds that are diversified and could underperform compared to such funds. Even though classified as non-diversified, a Portfolio may actually maintain a portfolio that is diversified with a large number of issuers. In such an event, a Portfolio would benefit less from appreciation in a single issuer than if it had greater exposure to that issuer.
Leverage: Certain transactions and investment strategies may give rise to leverage. Such transactions and investment strategies include, but are not limited to: borrowing, dollar rolls, reverse repurchase agreements, loans of portfolio securities, short sales, and the use of when-issued, delayed delivery or forward commitment transactions. The use of certain derivatives may also increase leveraging risk and, in some cases, adverse changes in the value or level of a derivative’s underlying asset, rate, or index may result in potentially unlimited losses. The use of leverage may exaggerate any increase or decrease in the net asset value, causing a Portfolio to be more volatile than if the Portfolio had not been leveraged. The use of leverage may increase expenses and increase the impact of a Portfolio’s other risks. The use of leverage may cause a Portfolio to liquidate portfolio positions when it may not be advantageous to do so to satisfy its obligations or to meet regulatory requirements resulting in increased volatility of returns. There can be no guarantee that a leveraging strategy will be successful.
Liquidity: If a security is illiquid, a Portfolio might be unable to sell the security at a time when the Portfolio’s manager might wish to sell, or at all. Further, the lack of an established secondary market may make it more difficult to value illiquid securities, exposing a Portfolio to the risk that the prices at which it sells illiquid securities will be less than the prices at which they were valued when held by a Portfolio, which could cause the Portfolio to lose money. The prices of illiquid securities may be more volatile than more liquid securities, and the risks associated with illiquid
101
MORE INFORMATION ABOUT THE PORTFOLIOS (continued)
securities may be greater in times of financial stress. Certain securities that are liquid when purchased may later become illiquid, particularly in times of overall economic distress or due to geopolitical events such as sanctions, trading halts, or wars. In addition, markets or securities may become illiquid quickly.
Market: The market values of securities will fluctuate, sometimes sharply and unpredictably, based on overall economic conditions, governmental actions or intervention, market disruptions caused by trade disputes or other factors, political developments, and other factors. Prices of equity securities tend to rise and fall more dramatically than those of debt instruments. Additionally, legislative, regulatory or tax policies or developments may adversely impact the investment techniques available to a manager, add to costs, and impair the ability of a Portfolio to achieve its investment objectives.
Market Capitalization: Stocks fall into three broad market capitalization categories: large, mid, and small. Investing primarily in one category carries the risk that, due to current market conditions, that category may be out of favor with investors. If valuations of large-capitalization companies appear to be greatly out of proportion to the valuations of mid- or small-capitalization companies, investors may migrate to the stocks of mid- and small-capitalization companies causing a fund that invests in these companies to increase in value more rapidly than a fund that invests in large-capitalization companies. Investing in mid- and small-capitalization companies may be subject to special risks associated with narrower product lines, more limited financial resources, smaller management groups, more limited publicly available information, and a more limited trading market for their stocks as compared with large-capitalization companies. As a result, stocks of mid- and small-capitalization companies may be more volatile and may decline significantly in market downturns.
Market Disruption and Geopolitical: A Portfolio is subject to the risk that geopolitical events will disrupt securities markets and adversely affect global economies and markets. Due to the increasing interdependence among global economies and markets, conditions in one country, market, or region might adversely impact markets, issuers and/or foreign exchange rates in other countries, including the United States. Wars, terrorism, global health crises and pandemics, trade disputes, tariffs and other restrictions on trade or economic sanctions, rapid technological developments (such as artificial intelligence technologies), and other geopolitical events that have led, and may continue to lead, to increased market volatility and may have adverse short- or long-term effects on U.S. and global economies and markets, generally. For example, the COVID-19 pandemic resulted in significant market volatility, exchange suspensions and closures, declines in global financial markets, higher default rates, supply chain disruptions, and a substantial economic downturn in economies throughout the world. The economic impacts of COVID-19 have created a unique challenge for real estate markets. Many businesses have either partially or fully transitioned to a remote-working environment and this transition may negatively impact the occupancy rates of commercial real estate over time. Natural and environmental disasters and systemic market dislocations are also highly disruptive to economies and markets. Military action by Russia in Ukraine, the prolonged conflict between Hamas and Israel, the Iranian conflict that commenced in February 2026, and political upheaval in Venezuela have resulted, and may continue to result, in sanctions, market disruptions, declines in regional and global stock markets, unusual volatility in global commodity markets, and disruptions to energy production or transportation, including through key shipping routes, any of which could adversely affect the value of a Portfolio's investments, including beyond a Portfolio' s direct exposure to issuers in the affected regions. The escalation or expansion of hostilities including the involvement of additional nations, could introduce further uncertainty and volatility in global energy, commodity, and financial markets. The extent and duration of these conflicts , related sanctions, and resulting market disruptions are impossible to predict but could be substantial. A number of U.S. domestic banks and foreign (non-U.S.) banks have experienced financial difficulties and, in some cases, failures. There can be no certainty that the actions taken by regulators to limit the effect of those financial difficulties and failures on other banks or other financial institutions or on the U.S. or foreign (non-U.S.) economies generally will be successful. It is possible that more banks or other financial institutions will experience financial difficulties or fail, which may affect adversely other U.S. or foreign (non-U.S.) financial institutions and economies. These events as well as other changes in foreign (non-U.S.) and domestic economic, social, and political conditions also could adversely affect individual issuers or related groups of issuers, securities markets, interest rates, credit ratings, inflation, investor sentiment, and other factors affecting the value of a Portfolio’s investments. Any of these occurrences could disrupt the operations of a Portfolio and of the Portfolio’s service providers. Recent technological developments in, and the increasingly widespread use of, artificial intelligence, including machine learning technology and generative artificial intelligence (“AI”), may pose risks to a Portfolio. For instance, the economy may be significantly impacted by the advanced development and increased regulation of AI. As AI is used more widely, the profitability and growth of Portfolio holdings may be impacted, which could significantly impact the overall performance of a Portfolio. The legal and regulatory frameworks within which AI operates continue to rapidly evolve, and it is not possible to predict the full extent of current or future risks related thereto.
102
MORE INFORMATION ABOUT THE PORTFOLIOS (continued)
Master Limited Partnership: Master Limited Partnerships (“MLPs”) are limited partnerships in which ownership interests are publicly traded. MLPs often own or own interests in properties or businesses that are related to oil and gas industries, including pipelines. MLP may also invest in other types of investments, including credit-related investments. Investments held by MLPs may be illiquid. Certain MLP units may trade infrequently and in limited volume and may be subject to more abrupt or erratic price movements than securities of larger or more broadly based companies. Investments in MLPs may adversely affect the ability of a Portfolio to qualify for special tax treatment as a regulated investment company. Generally, an MLP is operated under the supervision of one or more managing general partners. Limited partners (like a Portfolio when it invests in an MLP) are not involved in the day-to-day management of the partnership. A Portfolio may also invest in companies that serve (or whose affiliates serve) as the general partners of MLPs. Investments in MLPs are generally subject to many of the risks that apply to partnerships. For example, holders of units of MLPs may have limited control, limited voting rights, and fewer corporate protections as compared to investors in a corporation. Conflicts of interest may exist among unit holders, subordinated unit holders, and a general partner, including those arising from incentive distribution payments.
Mid-Capitalization Company: Investments in mid-capitalization companies may involve greater risk than is customarily associated with larger, more established companies due to the greater business risks of a limited operating history, smaller size, limited markets, and financial resources, narrow product lines, less management depth, and more reliance on key personnel. Consequently, the securities of mid-capitalization companies may have limited market stability and may be subject to more abrupt or erratic market movements than securities of larger, more established growth companies or the market averages in general.
Money Market Regulatory: Changes in government regulations may adversely affect the value of a security held by a Portfolio. The SEC has adopted amendments to money market fund regulation that permit the Portfolio to impose discretionary liquidity fees, increase the Portfolio’s daily and weekly liquid asset minimum requirements and eliminate the ability of the Portfolio to temporarily suspend redemptions due to declines in the Portfolio's weekly liquid assets, among other changes. As of the date of this Prospectus, the Board has elected not to subject the Portfolio to such discretionary liquidity fees. These changes may result in reduced yields for money market funds, including the Portfolio, which may invest in other money market funds. The SEC or other regulators may adopt additional money market fund reforms, which may impact the structure and operation or performance of the Portfolio.
Mortgage- and/or Asset-Backed Securities: Defaults on, or low credit quality or liquidity of, the underlying assets of the asset-backed (including mortgage-backed) securities may impair the value of these securities and result in losses. There may be limitations on the enforceability of any security interest or collateral granted with respect to those underlying assets, and the value of collateral may not satisfy the obligation upon default. These securities also present a higher degree of prepayment and extension risk and interest rate risk than do other types of debt instruments. Small movements in interest rates (both increases and decreases) may quickly and significantly reduce the value of certain asset-backed securities. The value of longer-term securities generally changes more in response to changes in market interest rates than shorter-term securities.
These securities may be affected significantly by government regulation, market interest rates, market perception of the creditworthiness of an issuer servicer, and loan-to-value ratio of the underlying assets. During an economic downturn, the mortgages, commercial or consumer loans, trade or credit card receivables, installment purchase obligations, leases, or other debt obligations underlying an asset-backed security may experience an increase in defaults as borrowers experience difficulties in repaying their loans which may cause the valuation of such securities to be more volatile and may reduce the value of such securities. These risks are particularly heightened for investments in asset-backed securities that contain sub-prime loans, which are loans made to borrowers with weakened credit histories and often have higher default rates. In addition, certain types of real estate may be adversely affected by changing usage trends, such as office buildings as a result of work-from-home practices and commercial facilities as a result of an increase in online shopping, which could in turn result in defaults and declines in value of mortgage-backed securities secured by such properties.
Municipal Obligations: The municipal securities market is volatile and can be affected significantly by adverse tax, legislative, or political changes and the financial condition of the issuers of municipal securities. Among other risks, investments in municipal securities are subject to the risk that an issuer may delay payment, restructure its debt, or refuse to pay interest or repay principal on its debt. Municipal revenue obligations may be backed by the revenues generated from a specific project or facility and include industrial development bonds and private activity bonds. Private activity and industrial development bonds are dependent on the ability of the facility’s user to meet its financial obligations
103
MORE INFORMATION ABOUT THE PORTFOLIOS (continued)
and the value of any real or personal property pledged as security for such payment. Many municipal securities are issued to finance projects relating to education, health care, transportation, and utilities. Conditions in those sectors may affect the overall municipal securities market. In addition, municipal securities backed by current or anticipated revenues from a specific project or specific asset may be adversely affected by the discontinuance of the taxation supporting the project or asset or the inability to collect revenues from the project or asset. If an issuer of a municipal security does not comply with applicable tax requirements for tax-exempt status, interest from the security may become taxable, and the security could decline in value.
Non-Diversification (Index): Depending on the composition of the Index, a Portfolio may at any time, with respect to 75% of a Portfolio’s total assets, invest more than 5% of the value of its total assets in the securities of any one issuer. As a result, a Portfolio would at that time be non-diversified, as defined in the 1940 Act. A non-diversified investment company may invest a greater percentage of its assets in the securities of a single issuer than may a diversified investment company. A non-diversified investment company is subject to the risks of focusing investments in a small number of issuers, including being more susceptible to risks associated with a single economic, political or regulatory occurrence than a more diversified portfolio might be. A Portfolio may significantly underperform other mutual funds or investments due to the poor performance of relatively few securities, or even a single security, and a Portfolio’s shares may experience significant fluctuations in value.
Option Writing: When a Portfolio writes a covered call option on a security, it assumes the risk that it must sell the underlying security at an exercise price that may be lower than the market price of the security, and it gives up the opportunity to profit from a price increase in the underlying security above the exercise price. In addition, a Portfolio continues to bear the risk of a decline in the value of the underlying security.
When a Portfolio writes an index call option, it assumes the risk that it must pay the purchaser of the option a cash payment equal to any appreciation in the value of the index over the strike price of the call option during the option’s term. While the amount of a Portfolio’s potential loss is offset by the premium received when the option was written, the amount of the loss is theoretically unlimited. When writing a covered call option, a Portfolio may be unable to sell the underlying security during the term of the option, including to take advantage of new investment opportunities. If a covered call option written by a Portfolio expires unexercised, the Portfolio will realize a capital gain equal to the premium received at the time the option was written; however, in return for the premium received, a Portfolio gives up the opportunity to profit from any price increase in the underlying security above the exercise price during the term of the option, and, as long as its obligation under such call option continues, has retained the risk of loss should the price of the underlying security decline.
There can be no assurances that the option strategy will be effective and that a Portfolio will be able to exercise a transaction at a desirable price and time.
Other Investment Companies: The main risk of investing in other investment companies, including ETFs, is the risk that the value of an investment company’s underlying investments might decrease. Shares of investment companies that are listed on an exchange may trade at a discount or premium from their net asset value. You will pay a proportionate share of the expenses of those other investment companies (including management fees, administration fees, and custodial fees) in addition to a Portfolio’s expenses. The investment policies of the other investment companies may not be the same as those of a Portfolio; as a result, an investment in the other investment companies may be subject to additional or different risks than those to which a Portfolio is typically subject.
ETFs are exchange-traded investment companies that are, in many cases, designed to provide investment results corresponding to an index. Additional risks of investments in ETFs include that: (i) an active trading market for an ETF’s shares may not develop or be maintained; or (ii) trading may be halted if the listing exchanges’ officials deem such action appropriate, the shares are delisted from an exchange, or the activation of market-wide “circuit breakers” (which are tied to large decreases in stock prices) halts trading of an ETF’s shares. In addition, shares of ETFs may trade at a premium or discount to net asset value and are subject to secondary market trading risks. Secondary markets may be subject to irregular trading activity, wide bid/ask spreads, and extended trade settlement periods in times of market stress because market makers and authorized participants may step away from making a market in an ETF’s shares, which could cause a material decline in the ETF’s net asset value.
Other Investment Companies (Money Market Funds): A money market fund may only invest in other investment companies that qualify as money market funds under Rule 2a-7 of the 1940 Act, and there is a risk that such money market funds may not comply with Rule 2a-7. You will pay a proportionate share of the expenses of those other investment
104
MORE INFORMATION ABOUT THE PORTFOLIOS (continued)
companies (including management fees, administration fees, and custodial fees) in addition to the expenses of a Portfolio. The investment policies of the other investment companies may not be the same as those of a Portfolio; as a result, an investment in the other investment companies may be subject to additional or different risks than those to which a Portfolio is typically subject.
Portfolio Turnover: A high portfolio turnover rate may increase transaction costs, which may lower a Portfolio’s performance and may increase the likelihood of capital gains distributions.
Preferred Stocks: Preferred stocks represent an equity interest in a company that generally entitles the holder to receive, in preference to the holders of other securities such as common stocks, dividends, and a fixed share of the proceeds resulting from a liquidation of the company. Some preferred stocks also entitle their holders to receive additional liquidation proceeds on the same basis as holders of a company’s common stock, and thus also represent an ownership interest in that company.
Preferred stock may pay fixed or adjustable rates of return. Preferred stock is subject to issuer-specific and market risks applicable generally to equity securities. In addition, a company’s preferred stock generally pays dividends only after the company makes required payments to holders of its bonds and other debt. For this reason, the value of preferred stock will usually react more strongly than bonds and other debt to actual or perceived changes in the company’s financial condition or prospects.
Preferred stock of smaller companies may be more vulnerable to adverse developments than preferred stock of larger companies.
Preferred stock includes certain hybrid securities and other types of preferred stock with different features from those of traditional preferred stock described above. Preferred stocks that are hybrid securities possess various features of both debt and traditional preferred stock and as such, they may constitute senior debt, junior debt, or preferred shares in an issuer’s capital structure. Therefore, unlike traditional preferred stock, hybrid securities may not be subordinate to a company’s debt instruments.
Preferred stock may include features permitting or requiring the issuer to defer or omit distributions. Among other things, such deferral or omission may result in adverse tax consequences for a Portfolio. Preferred stock generally does not have voting rights with respect to the issuer unless dividends have been in arrears for certain specified periods of time. Preferred stock may be less liquid than other securities. As a result, preferred stock is subject to the risk that they may be unable to be sold at the time desired by a Portfolio or at prices approximating the values at which the Portfolio is carrying the stock on its books. In addition, over longer periods of time, certain types of preferred stock may become more scarce or less liquid as a result of legislative changes. Such events may negatively affect the prices of stock held by a Portfolio, which may result in losses to the Portfolio. In addition, an issuer of preferred stock may redeem the stock prior to a specified date, which may occur due to changes in tax or securities laws or corporate actions. A redemption by the issuer may negatively impact the return of the preferred stock.
Prepayment and Extension: Many types of debt instruments are subject to prepayment and extension risk. Prepayment risk is the risk that the issuer of a debt instrument will pay back the principal earlier than expected. This risk is heightened in a falling market interest rate environment. Prepayment may expose a Portfolio to a lower rate of return upon reinvestment of principal. Also, if a debt instrument subject to prepayment has been purchased at a premium, the value of the premium would be lost in the event of prepayment. Extension risk is the risk that the issuer of a debt instrument will pay back the principal later than expected. This risk is heightened in a rising market interest rate environment. This may negatively affect performance, as the value of the debt instrument decreases when principal payments are made later than expected. Additionally, a Portfolio may be prevented from investing proceeds it would have received at a given time at the higher prevailing interest rates.
Real Estate Companies and Real Estate Investment Trusts: Investing in real estate companies and REITs may subject a Portfolio to risks similar to those associated with the direct ownership of real estate, including losses from casualty or condemnation, changes in local and general economic conditions, supply and demand, market interest rates, zoning laws, regulatory limitations on rents, property taxes, overbuilding, high foreclosure rates, and operating expenses in addition to terrorist attacks, wars, or other acts that destroy real property. Some REITs may invest in a limited number of properties, in a narrow geographic area or in a single property type, which increases the risk that a Portfolio could be unfavorably affected by the poor performance of a single investment or investment type. These companies are also sensitive to factors such as changes in real estate values and property taxes, market interest rates, cash flow
105
MORE INFORMATION ABOUT THE PORTFOLIOS (continued)
of underlying real estate assets, supply and demand, and the management skill and creditworthiness of the issuer. Borrowers could default on or sell investments the REIT holds, which could reduce the cash flow needed to make distributions to investors. In addition, REITs may also be affected by tax and regulatory requirements in that a REIT may not qualify for favorable tax treatment or regulatory exemptions. Investments in REITs are affected by the management skill of the REIT’s sponsor. A Portfolio will indirectly bear its proportionate share of expenses, including management fees, paid by each REIT in which it invests.
Real Estate Companies and Real Estate Investment Trusts – VY® Columbia Real Estate Portfolio: Investing in real estate companies and REITs may subject the Portfolio to risks similar to those associated with the direct ownership of real estate, including losses from casualty or condemnation, changes in local and general economic conditions, supply and demand, market interest rates, zoning laws, regulatory limitations on rents, property taxes, overbuilding, high foreclosure rates, and operating expenses in addition to terrorist attacks, wars, or other acts that destroy real property. REITs are affected by the management skill of the REIT’s sponsor. The Portfolio will indirectly bear its proportionate share of expenses, including management fees, paid by each REIT in which it invests. The value of interests in a REIT may be affected by, among other factors, changes in the value of the underlying properties owned by the REIT, changes in the prospect for earnings and/or cash flow growth of the REIT itself, defaults by borrowers or tenants, market saturation, decreases in market rates for rents, and other economic, political, or regulatory matters affecting the real estate industry, including REITs. REITs and similar non-U.S. entities depend upon specialized management skills, may have limited financial resources, may have less trading volume in their securities, and may be subject to more abrupt or erratic price movements than the overall securities markets. In a rising interest rate environment, the stock prices of real estate-related investments may decline and the borrowing costs of these companies may increase. REITs are also subject to the risk of failing to qualify for favorable tax treatment under the Internal Revenue Code of 1986, as amended. The failure of a REIT to continue to qualify as a REIT for tax purposes can materially and adversely affect its value. Some REITs (especially mortgage REITs) are affected by risks similar to those associated with investments in debt securities including changes in interest rates and the quality of credit extended. Because the value of REITs and other real estate-related companies may fluctuate widely in response to changes in factors affecting the real estate markets, the value of an investment in the Portfolio may be more volatile than the value of an investment in a fund that is invested in a more diverse range of market sectors.
Repurchase Agreements: In the event that the other party to a repurchase agreement defaults on its obligations, a Portfolio would generally seek to sell the underlying security serving as collateral for the repurchase agreement. However, the value of collateral may be insufficient to satisfy the counterparty's obligation and/or a Portfolio may encounter delay and incur costs before being able to sell the security. Such a delay may involve loss of interest or a decline in price of the security, which could result in a loss. In addition, if a Portfolio is characterized by a court as an unsecured creditor, it would be at risk of losing some or all of the principal and interest involved in the transaction.
Restricted Securities: Securities that are legally restricted as to resale (such as those issued in private placements), including securities governed by Rule 144A and Regulation S, and securities that are offered in reliance on Section 4(a)(2) of the Securities Act of 1933, as amended, are referred to as “restricted securities.” Restricted securities may be sold in private placement transactions between issuers and their purchasers and may be neither listed on an exchange nor traded in other established markets. Due to the absence of a public trading market, restricted securities may be more volatile, less liquid, and more difficult to value than publicly-traded securities. The price realized from the sale of these securities could be less than the amount originally paid or less than their fair value if they are resold in privately negotiated transactions. In addition, these securities may not be subject to disclosure and other investment protection requirements that are afforded to publicly-traded securities. Certain restricted securities represent investments in smaller, less seasoned issuers, which may involve greater risk.
Securities Lending: Securities lending involves two primary risks: “ investment risk ” and “ borrower default risk. ” When lending securities, a Portfolio will receive cash or U.S. government securities as collateral. Investment risk is the risk that a Portfolio will lose money from the investment of the cash collateral received from the borrower. Borrower default risk is the risk that a Portfolio will lose money due to the failure of a borrower to return a borrowed security. Securities lending may result in leverage. The use of leverage may exaggerate any increase or decrease in the net asset value, causing a Portfolio to be more volatile. The use of leverage may increase expenses and increase the impact of a Portfolio’s other risks.
106
MORE INFORMATION ABOUT THE PORTFOLIOS (continued)
A Portfolio seeks to minimize investment risk by limiting the investment of cash collateral to high-quality instruments of short maturity. In the event of a borrower default, a Portfolio will be protected to the extent the Portfolio is able to exercise its rights in the collateral promptly and the value of such collateral is sufficient to purchase replacement securities. A Portfolio is protected by its securities lending agent, which has agreed to indemnify the Portfolio from losses resulting from borrower default.
Short Sales: Short sales involve selling a security a Portfolio does not own with the hope of purchasing the same security at a later date at a lower price. When a Portfolio sells a security short and the price of that security rises, a Portfolio will incur a loss equal to the increase in price from the time that the short sale was entered into plus any transaction costs (i.e., premiums and interest) paid to the broker-dealer to borrow the security. Short sales create leverage which may exaggerate any increase or decrease in a Portfolio’s net asset value causing a Portfolio to be more volatile than a fund that does not engage in short sales.
Short sales expose a Portfolio to the risk that it will be required to buy the security sold short (also known as “covering” the short position) at a time when the security has appreciated in value, thus resulting in a loss, and the potential loss may be greater for this type of short sale than for a short sale “against the box.” A short sale is “against the box” to the extent that a Portfolio contemporaneously owns, or has the right to obtain at no added cost, securities identical to those sold short. A short sale “against the box” may be used to hedge against market risks when the manager believes that the price of a security may decline, causing the value of a security owned by a Portfolio or a security convertible into or exchangeable for such security, to decline. In such case, any future losses in the long position would be reduced by a gain in the short position. The extent to which such gains or losses in the long position are reduced will depend upon the amount of securities sold short relative to the amount of the securities a Portfolio owns.
Small-Capitalization Company: Investments in small-capitalization companies may involve greater risk than is customarily associated with larger, more established companies due to the greater business risks of a limited operating history, small size, limited markets and financial resources, narrow product lines, less management depth and more reliance on key personnel. The securities of small-capitalization companies are subject to liquidity risk as they are often traded over-the-counter and may not be traded in volumes typically seen on national securities exchanges.
Sovereign Debt: Sovereign debt is issued or guaranteed by foreign (non-U.S.) government entities. Investments in sovereign debt are subject to the risk that a government entity may delay payment, restructure its debt, or refuse to pay interest or repay principal on its sovereign debt due to cash flow problems, insufficient foreign currency reserves, political considerations, social changes, the relative size of its debt position to its economy, or its failure to put in place economic reforms required by the International Monetary Fund or other multilateral agencies. If a government entity defaults, it may ask for more time in which to pay or for further loans. There is no legal process for collecting amounts owed on sovereign debt, such as bankruptcy proceedings, that a government does not pay.
Special Situations: A “ special situation ” arises when, in a manager’s opinion, securities of a particular company will appreciate in value within a reasonable period because of unique circumstances applicable to the company. Special situations investments often involve much greater risk than is inherent in ordinary investments. Investments in special situation companies may not appreciate and a Portfolio’s performance could suffer if an anticipated development does not occur or does not produce the anticipated result.
Structured Notes: Structured notes are investments, the interest rate or principal of which is linked to currencies, interest rates, commodities, indices, or other financial indicators (each, a “reference instrument”). Structured notes may entail a greater degree of market risk than other types of debt instruments because the investor also bears the risk of the reference instrument. Structured notes may be more volatile, less liquid, and more difficult to accurately price than less complex securities and other types of debt instruments. In addition, structured notes are subject to other risks, including interest rate risk, credit risk, and liquidity risk.
U.S. Government Securities and Obligations: U.S. government securities are obligations of, or guaranteed by, the U.S. government, its agencies, or government-sponsored enterprises. U.S. government securities are subject to market risk and interest rate risk, and may be subject to varying degrees of credit risk. Some U.S. government securities are backed by the full faith and credit of the U.S. government and are guaranteed as to both principal and interest by the U.S. Treasury. These include direct obligations of the U.S. Treasury such as U.S. Treasury notes, bills, and bonds, as well as indirect obligations including certain securities of the Government National Mortgage Association, the Small Business Administration, and the Farmers Home Administration, among others. Other U.S. government securities are
107
MORE INFORMATION ABOUT THE PORTFOLIOS (continued)
not direct obligations of the U.S. Treasury, but rather are backed by the ability to borrow directly from the U.S. Treasury, including certain securities of the Federal Financing Bank, the Federal Home Loan Bank, and the U.S. Postal Service. Other U.S. government securities are backed solely by the credit of the agency or instrumentality itself and are neither guaranteed nor insured by the U.S. government and, therefore, involve greater risk. These include securities issued by the Federal Home Loan Bank, the Federal Home Loan Mortgage Corporation, and the Federal Farm Credit Bank, among others. Consequently, the investor must look principally to the agency issuing or guaranteeing the obligation for ultimate repayment. No assurance can be given that the U.S. government would provide financial support to such agencies if it is not obligated to do so by law. The impact of greater governmental scrutiny into the operations of certain agencies and government-sponsored enterprises may adversely affect the value of securities issued by these entities. U.S. government securities may be subject to price declines due to changing market interest rates. From time to time, uncertainty regarding the status of negotiations in the U.S. government to increase the statutory debt ceiling could increase the risk that the U.S. government may default on payments on certain U.S. government securities, cause the credit rating of the U.S. government to be downgraded, increase volatility in the stock and bond markets, result in higher interest rates, reduce prices of U.S. Treasury securities, and/or increase the costs of various kinds of debt. If a U.S. government-sponsored entity is negatively impacted by legislative or regulatory action (or lack thereof), is unable to meet its obligations, or its creditworthiness declines, the performance of a Portfolio that holds securities of the entity will be adversely impacted. There is no assurance that the U.S. Congress will act to raise the debt ceiling; a failure to do so could cause market turmoil and substantial investment risks that cannot now be fully predicted.
Value Investing: Securities that appear to be undervalued may never appreciate to the extent expected. Further, because the prices of value-oriented securities tend to correlate more closely with economic cycles than growth-oriented securities, they generally are more sensitive to changing economic conditions, such as changes in market interest rates, corporate earnings and industrial production. The manager may be wrong in its assessment of a company’s value and the securities a Portfolio holds may not reach their full values. Risks associated with value investing include that a security that is perceived by the manager to be undervalued may actually be appropriately priced and, thus, may not appreciate and provide anticipated capital growth. The market may not favor value-oriented securities and may not favor equities at all. During those periods, a Portfolio’s relative performance may suffer. There is a risk that funds that invest in value-oriented securities may underperform other funds that invest more broadly.
Warrants: If the price of the underlying stock does not rise above the exercise price before the warrant expires, the warrant generally expires without any value and a Portfolio will lose any amount it paid for the warrant. Thus, investments in warrants may involve substantially more risk than investments in common stock. Warrants may trade in the same markets as their underlying stock; however, the price of the warrant does not necessarily move with the price of the underlying stock.
When-Issued, Delayed Delivery, and Forward Commitment Transactions: When-issued, delayed delivery, and forward commitment transactions involve the risk that the security a Portfolio buys will lose value prior to its delivery. These transactions may result in leverage. The use of leverage may exaggerate any increase or decrease in the net asset value, causing a Portfolio to be more volatile. The use of leverage may increase expenses and increase the impact of a Portfolio’s other risks. There also is the risk that the security will not be issued or that the other party will not meet its obligation. If this occurs, a Portfolio loses both the investment opportunity for the assets it set aside to pay for the security and any gain in the security’s price.
Zero-Coupon Bonds and Payment-in-Kind Securities: Zero-coupon bonds and payment-in-kind securities may be subject to greater fluctuations in price due to market interest rate changes than conventional interest-bearing securities. A Portfolio may have to pay out the imputed income on zero-coupon bonds without receiving the actual cash currency, resulting in a loss.
Further Information About Principal Risks
The following provides additional information about certain aspects of the principal risks described above.
Counterparty: The entity with which a Portfolio conducts portfolio-related business (such as trading or securities lending), or that underwrites, distributes or guarantees investments or agreements that the Portfolio owns or is otherwise exposed to, may refuse or may become unable to honor its obligations under the terms of a transaction or agreement. As a result, a Portfolio may sustain losses and be less likely to achieve its investment objective. A Portfolio may obtain no or limited recovery in a bankruptcy or other reorganizational proceedings, and any recovery may be significantly
108
MORE INFORMATION ABOUT THE PORTFOLIOS (continued)
delayed. Transactions that a Portfolio enters into may involve counterparties in the financials sector and, as a result, events affecting the financials sector may cause a Portfolio’s NAV to fluctuate. These risks may be greater when engaging in over-the-counter transactions or when a Portfolio conducts business with a limited number of counterparties.
Duration: One measure of risk for debt instruments is duration. Duration measures the sensitivity of a bond’s price to market interest rate movements and is one of the tools used by a portfolio manager in selecting debt instruments. Duration measures the average life of a bond on a present value basis by incorporating into one measure a bond’s yield, coupons, final maturity and call features. As a point of reference, the duration of a non-callable 7% coupon bond with a remaining maturity of 5 years is approximately 4.5 years and the duration of a non-callable 7% coupon bond with a remaining maturity of 10 years is approximately 8 years. Material changes in market interest rates may impact the duration calculation. For example, the price of a bond with an average duration of 5 years would be expected to fall approximately 5% if market interest rates rose by 1%. Conversely, the price of a bond with an average duration of 5 years would be expected to rise approximately 5% if market interest rates dropped by 1%.
Inflation: Inflation risk is the risk that the value of assets or income from a Portfolio's investments will be worth less in the future as inflation decreases the value of payments at future dates. As inflation increases, the value of a Portfolio could decline. Inflation rates may change frequently and drastically as a result of various factors and a Portfolio's investments may not keep pace with inflation, which may result in losses to the Portfolio’s investors or adversely affect the value of shareholders' investments in the Portfolio.
Investment by Other Funds: Certain funds-of-funds, including some Voya funds, may invest in a Portfolio. If investments by these other funds result in large inflows or outflows of cash from a Portfolio, a Portfolio could be required to sell securities or invest cash at times, or in ways, that could, among other things, negatively impact its performance, speed the realization of capital gains, increase its portfolio turnover, affect the liquidity of its portfolio, or increase transaction costs. The manager will monitor transactions by such funds-of-funds and will attempt to minimize any adverse effects these transactions may have on a Portfolio. If shares of a Portfolio are purchased by another fund in reliance on Section 12(d)(1)(G) of the 1940 Act or Rule 12d1-4 thereunder and the Portfolio purchases shares of other investment companies in reliance on Rule 12d1-4, the Portfolio will not be able to make new investments in other funds, including private funds, if, as a result of such investment, more than 10% of the Portfolio’s assets would be invested in other funds or private funds, subject to certain exceptions.
Leverage: Certain transactions and investment strategies may give rise to leverage. Such transactions and investment strategies include, but are not limited to: borrowing, dollar rolls, reverse repurchase agreements, loans of portfolio securities, short sales, and the use of when-issued, delayed delivery or forward commitment transactions. The use of certain derivatives may also increase leveraging risk and, in some cases, adverse changes in the value or level of a derivative’s underlying asset, rate, or index may result in potentially unlimited losses. The use of leverage may exaggerate any increase or decrease in the net asset value, causing a Portfolio to be more volatile than if the Portfolio had not been leveraged. The use of leverage may increase expenses and increase the impact of a Portfolio’s other risks. The use of leverage may cause a Portfolio to liquidate portfolio positions when it may not be advantageous to do so to satisfy its obligations or to meet regulatory requirements resulting in increased volatility of returns. There can be no guarantee that a leveraging strategy will be successful.
Manager: A Portfolio is subject to manager risk because it is an actively managed investment portfolio. The Investment Adviser, a Sub-Adviser, or each individual portfolio manager will make judgments and apply investment techniques and risk analyses in making investment decisions, but there can be no guarantee that these decisions will produce the desired results. A Portfolio’s portfolio may fail to produce the intended results, and a Portfolio’s portfolio may underperform other comparable funds because of portfolio management decisions related to, among other things, the selection of investments, portfolio construction, risk assessments, and/or the outlook on market trends and opportunities. Many managers of equity funds employ styles that are characterized as “value” or “growth.” However, these terms can have different applications by different managers. One manager’s value approach may be different from that of another, and one manager’s growth approach may be different from that of another. For example, some value managers employ a style in which they seek to identify companies that they believe are valued at a more substantial or “deeper discount” to a company’s net worth than other value managers. Therefore, some funds that are characterized as growth or value can have greater volatility than other funds managed by other managers in a growth or value style.
109
MORE INFORMATION ABOUT THE PORTFOLIOS (continued)
Operational: A Portfolio, its service providers, and other market participants increasingly depend on complex information technology and communications systems to conduct business functions. These systems are subject to a number of different threats, including operational and information security risks that could adversely affect a Portfolio and its shareholders, despite the efforts of a Portfolio and its service providers to adopt technologies, processes, and practices intended to mitigate these risks. The use of artificial intelligence (“AI”) and machine learning could exacerbate operational and information security risks or result in cybersecurity incidents that implicate personal data. Cyber-attacks, disruptions, or failures that affect a Portfolio’s service providers, counterparties, market participants, or issuers of securities held by a Portfolio may adversely affect a Portfolio and its shareholders, including by causing losses or impairing the Portfolio’s operations. Information relating to a Portfolio’s investments is delivered electronically, which can give rise to a number of risks, including, but not limited to, the risks that such communications may not be secure and may contain computer viruses or other defects, may not be accurately replicated on other systems, or may be intercepted, deleted or interfered with, without the knowledge of the sender or the intended recipient.
110
PORTFOLIO HOLDINGS INFORMATION
A description of each Portfolio's policies and procedures regarding the release of portfolio holdings information is available in the SAI. Portfolio holdings information can be reviewed online at https://individuals.voya.com/product/variable-portfolio/prospectuses-reports.
111
MANAGEMENT OF THE PORTFOLIOS
Investment Adviser
Voya Investments, an Arizona limited liability company, is registered with the SEC as an investment adviser. Voya Investments serves as the investment adviser to, and has overall responsibility for the management of, each Portfolio. Voya Investments oversees all investment advisory and portfolio management services and assists in managing and supervising all aspects of the general day-to-day business activities and operations of each Portfolio, including, but not limited to, the following: custodial, transfer agency, dividend disbursing, accounting, auditing, compliance, and related services.
Voya Investments began business as an investment adviser in 1994 and currently serves as investment adviser to certain registered investment companies, consisting of open- and closed-end registered investment companies and collateralized loan obligations. Voya Investments is an indirect subsidiary of Voya Financial, Inc. Voya Financial, Inc. is a U.S.-based financial institution whose subsidiaries operate in the retirement, investment, and insurance industries.
Voya Investments' principal business address is 7337 East Doubletree Ranch Road, Suite 100, Scottsdale, Arizona 85258.
Management Fee
The Investment Adviser receives an annual fee for its services to each Portfolio. The fee is payable in monthly installments based on the average daily net assets of each Portfolio.
The Investment Adviser is responsible for all of its own costs, including costs of the personnel required to carry out its duties.
The following table shows the aggregate annual management fee paid by each Portfolio for the most recent fiscal year as a percentage of the Portfolio’s average daily net assets.
|
|
Management Fees |
|
Voya Government Liquid Assets Portfolio |
0.27% |
|
Voya High Yield Portfolio |
0.49% |
|
Voya Large Cap Growth Portfolio |
0.65% |
|
Voya Limited Maturity Bond Portfolio |
0.27% |
|
Voya U.S. Stock Index Portfolio |
0.26% |
|
VY® CBRE Global Real Estate Portfolio |
0.90% |
|
VY® Columbia Real Estate Portfolio |
0.85% |
|
VY® Invesco Growth and Income Portfolio |
0.64% |
|
VY® JPMorgan Emerging Markets Equity Portfolio |
1.25% |
|
VY® JPMorgan Small Cap Core Equity Portfolio |
0.88% |
|
VY® Morgan Stanley Global Franchise Portfolio |
0.99% |
|
VY® T. Rowe Price Capital Appreciation Portfolio |
0.64% |
For information regarding the basis for the Board’s approval of the investment advisory and investment sub-advisory relationships, please refer to the Portfolios’ annual financial statements and other information filed on Form N-CSR which covers the one-year period ended December 31, 2025.
Expense Limitation Agreement - Voya Government Liquid Assets Portfolio
The distributor and the Investment Adviser have contractually agreed to waive a portion of their management fees and distribution and/or shareholder servicing fees, as applicable, and to reimburse certain expenses of the Portfolio to the extent necessary to assist the Portfolio in maintaining a net yield of not less than zero. There is no guarantee that the Portfolio will maintain such a yield. When distribution fees are reduced, dealer compensation may be reduced to the same extent. Management fees waived and expenses reimbursed by the Investment Adviser are subject to possible recoupment by the Investment Adviser within three years. In no event will the amount of the recoupment on any day exceed 20% of the yield (net of all expenses) of the Portfolio on that day. Distribution and servicing fees waived are subject to recoupment. This arrangement will continue through at least May 1, 2027.
Sub-Advisers
The Investment Adviser has engaged one or more sub-advisers to provide the day-to-day management of each Portfolio's portfolio. One of these sub-advisers is an affiliate of the Investment Adviser.
112
MANAGEMENT OF THE PORTFOLIOS (continued)
The Investment Adviser acts as a “manager-of-managers” for each Portfolio. The Investment Adviser has ultimate responsibility, subject to the oversight of each Portfolio’s Board, to oversee any sub-advisers and to recommend the hiring, termination, or replacement of sub-advisers. Each Portfolio and the Investment Adviser have received exemptive relief from the SEC which permits the Investment Adviser, with the approval of the Board but without obtaining shareholder approval, to enter into or materially amend a sub-advisory agreement with sub-advisers that are not affiliated with the Investment Adviser (“non-affiliated sub-advisers”) as well as sub-advisers that are indirect or direct, wholly-owned subsidiaries of the Investment Adviser or of another company that indirectly or directly wholly owns the Investment Adviser (“wholly-owned sub-advisers”).
Consistent with the “manager-of-managers” structure, the Investment Adviser delegates to the Sub-Adviser(s) of each Portfolio the responsibility for day-to-day investment management, subject to the Investment Adviser’s oversight. The Investment Adviser is responsible for, among other things, monitoring the investment program and performance of the Sub-Adviser(s). Pursuant to the exemptive relief, the Investment Adviser, with the approval of the Board, has the discretion to terminate any sub-adviser (including terminating a non-affiliated sub-adviser and replacing it with a wholly-owned sub-adviser), and to allocate and reallocate a Portfolio’s assets among other sub-advisers.
The Investment Adviser’s selection of sub-advisers presents conflicts of interest. The Investment Adviser will have an economic incentive to select sub-advisers that charge the lowest sub-advisory fees, to select sub-advisers affiliated with it, or to manage a portion of a Portfolio itself. The Investment Adviser may retain an affiliated sub-adviser (or delay terminating an affiliated sub-adviser) in order to help that sub-adviser achieve or maintain scale in an investment strategy or increase its assets under management. The Investment Adviser may select or retain an affiliated sub-adviser even in cases where another potential sub-adviser or an existing sub-adviser might charge a lower fee or have more favorable historical investment performance.
In the event that the Investment Adviser exercises its discretion to replace a sub-adviser or appoint a new sub-adviser, a Portfolio will provide shareholders with information about the new sub-adviser and the new sub-advisory agreement within 90 days. The replacement of an existing sub-adviser or appointment of a new sub-adviser may be accompanied by a change to a Portfolio’s name and/or investment strategies.
A sub-advisory agreement can be terminated by the Investment Adviser, a Portfolio’s Board, or a Sub-Adviser, provided that the conditions of such termination, as set forth in the agreement, are met. In addition, a sub-advisory agreement may be terminated by a Portfolio’s shareholders. In the event a sub-advisory agreement is terminated, the Sub-Adviser(s) may be replaced, subject to any regulatory requirements, or the Investment Adviser may assume day-to-day investment management of a Portfolio.
The “manager-of-managers” structure and reliance on the exemptive relief has been approved by each Portfolio’s shareholders.
CBRE Investment Management Listed Real Assets, LLC
CBRE Investment Management Listed Real Assets, LLC (“CBRE” or the “Sub-Adviser”), whose predecessor firm was founded in 1969, is a Delaware limited liability company and is registered with the SEC as an investment adviser. CBRE provides investment advice to institutional client accounts and is a unit of CBRE Investment Management, the independently-operated real estate investment management business of CBRE Group, Inc., a Fortune 500 and S&P 500® company headquartered in Los Angeles, California. CBRE’s principal business address is 555 East Lancaster Avenue, Suite 120, Radnor, Pennsylvania 19087.
Columbia Management Investment Advisers, LLC
Columbia Management Investment Advisers, LLC (“CMIA” or the “Sub-Adviser”) is a registered investment adviser and a wholly-owned subsidiary of Ameriprise Financial, Inc. CMIA's management experience covers all major asset classes, including equity securities, debt instruments, and money market instruments. In addition to serving as an investment adviser to traditional mutual funds, ETFs, and closed-end funds, CMIA acts as an investment adviser for itself, its affiliates, individuals, corporations, retirement plans, private investment companies, and financial intermediaries. CMIA’s principal business address is 290 Congress Street, Boston, MA 02210.
113
MANAGEMENT OF THE PORTFOLIOS (continued)
CMIA and its investment advisory affiliates (Participating Affiliates) around the world may coordinate in providing services to their clients. From time to time, CMIA may engage its Participating Affiliates to provide a variety of services, such as investment research, investment monitoring, trading, and discretionary investment management (including portfolio management) to certain accounts, including VY® Columbia Real Estate Portfolio. These Participating Affiliates will provide services to VY® Columbia Real Estate Portfolio and other accounts of CMIA either pursuant to sub-advisory agreements, delegation agreements, personnel-sharing agreements or similar inter-company or other arrangements or relationships and VY® Columbia Real Estate Portfolio will pay no additional fees and expenses as a result of any such arrangements or relationships. These Participating Affiliates, like CMIA, are direct or indirect subsidiaries of Ameriprise Financial and are registered with the appropriate respective regulators in their home jurisdictions and, where required, the SEC and the Commodity Futures Trading Commission in the United States.
Invesco Advisers, Inc.
Invesco Advisers, Inc. (“Invesco” or the “Sub-Adviser”) is a registered investment adviser and is an indirect, wholly-owned subsidiary of Invesco Ltd., a publicly traded company that, through its subsidiaries, engages in the business of investment management on an international basis. Invesco’s principal business address is 1331 Spring Street NW, Suite 2500, Atlanta, Georgia 30309.
J.P. Morgan Investment Management Inc.
J.P. Morgan Investment Management Inc. (“JPMorgan” or the “Sub-Adviser”) is an indirect, wholly-owned subsidiary of JPMorgan Chase & Co., a bank holding company. JPMorgan also provides discretionary investment services to institutional clients. JPMorgan’s principal business address is 270 Park Avenue, New York, New York 10017.
Morgan Stanley Investment Management Inc.
Morgan Stanley Investment Management Inc. (“MSIM Inc.”) is a registered investment adviser and is a direct subsidiary of Morgan Stanley. MSIM Inc.’s principal business address is 1585 Broadway, New York, New York 10019.
For VY® Morgan Stanley Global Franchise Portfolio, MSIM Inc. has entered into a sub-sub-advisory agreement whereby MSIM Inc. may delegate certain of its investment advisory services to Morgan Stanley Investment Management Limited (“MSIM Limited” or, together with MSIM Inc., the “Sub-Adviser”), as sub-sub-adviser to the Portfolio. MSIM Limited is an affiliate of MSIM Inc.. MSIM Limited’s principal business address is 25 Cabot Square, Canary Wharf, London, E14 4QA, England.
T. Rowe Price Associates, Inc.
T. Rowe Price Associates, Inc. (“T. Rowe Price”) was founded in 1937 by the late Thomas Rowe Price, Jr. and is a wholly-owned subsidiary of T. Rowe Price Group, Inc., a publicly held financial services holding company. T. Rowe Price’s principal business address is 1307 Point Street, Baltimore, Maryland 21231.
For VY® T. Rowe Price Capital Appreciation Portfolio, T. Rowe Price has entered into a sub-sub-advisory agreement whereby T. Rowe Price may delegate certain of its investment advisory services to T. Rowe Price Investment Management, Inc. (“T. Rowe Price IM” or, together with T. Rowe Price, the “Sub-Adviser”) as sub-sub-adviser to the Portfolio. T. Rowe Price IM is an affiliate of T. Rowe Price.
Voya Investment Management Co. LLC
Voya Investment Management Co. LLC (“Voya IM” or the “Sub-Adviser”), a Delaware limited liability company, was founded in 1972 and is registered with the SEC as an investment adviser. Voya IM has acted as an investment adviser or sub-adviser to mutual funds since 1994 and has managed institutional accounts since 1972. Voya IM is an indirect subsidiary of Voya Financial, Inc. and is an affiliate of the Investment Adviser. Voya IM's principal business address is 200 Park Avenue, New York, New York 10166.
Portfolio Management
The following individuals are jointly and primarily responsible for the day-to-day management of the noted Portfolios.
114
MANAGEMENT OF THE PORTFOLIOS (continued)
|
Portfolio Manager |
Investment Adviser or
Sub-Adviser |
Portfolio |
Professional Experience |
|
Sean Banai, CFA |
Voya IM |
Voya Limited
Maturity
Bond
Portfolio |
Mr. Banai, Portfolio Manager and head of
portfolio management for the
fixed-income platform, joined Voya IM in
1999. Previously, he was a senior
portfolio manager and head of
quantitative research for proprietary
fixed-income. Prior to that, Mr. Banai was
a partner in a private sector company. |
|
Mark Buccigross |
Voya IM |
Voya U.S.
Stock Index
Portfolio |
Mr. Buccigross, Portfolio Manager, is on
the quantitative equity team at Voya IM.
Prior to joining Voya IM, he worked as an
equity trader at State Street Global
Advisors, where he was responsible for
supporting U.S., Canada, and emerging
market portfolio managers across
fundamental active, active quantitative,
and passive strategies. Prior to that, Mr.
Buccigross held a similar position at GE
Asset Management. |
|
Sander Bunck |
CMIA |
VY®
Columbia
Real Estate
Portfolio |
Mr. Bunck, Portfolio Manager, re-joined
the property team in March 2023 as
senior analyst and assistant fund
manager focusing on EU and U.S.
Strategies. He was a director and
headed the real estate equity research
team at Barclays from 2017 to 2023.
Prior to that, he worked as an equity
analyst in the Thames River team
responsible for the European markets.
Sander started his career at LaSalle
Investment Management, where he was
an equity analyst in the Listed Real
Estate Securities team for four years. |
|
Wonseok Choi, Ph.D. |
JPMorgan |
VY® JPMorgan
Small Cap
Core Equity
Portfolio |
Dr. Choi, Managing Director, is a portfolio
manager and the head of quantitative
research for the U.S. Disciplined Core
Equity Group. An employee since 2006,
he is responsible for conducting
quantitative research on proprietary
models utilized in portfolio management.
Prior to joining JPMorgan, Dr. Choi
worked as a research manager at
Arrowstreet Capital, L.P., where he was
involved in developing and enhancing
the firm’s forecasting, risk, and
transaction-cost models. |
115
MANAGEMENT OF THE PORTFOLIOS (continued)
|
Portfolio Manager |
Investment Adviser or
Sub-Adviser |
Portfolio |
Professional Experience |
|
John Citron, CFA |
JPMorgan |
VY® JPMorgan
Emerging
Markets
Equity
Portfolio |
Mr. Citron, executive director, is a
portfolio manager within the Emerging
Markets and Asia Pacific (“EMAP”)
Equities team based in London. An
employee since 2009, he previously
worked as a research analyst on the
EMAP team, responsible for technology
and industrial sectors, and before that
as a research analyst within the
European Equities Research team,
responsible for the capital goods,
aerospace and defense. |
|
Eric DeVilbiss |
T. Rowe Price |
Voya Large
Cap Growth
Portfolio |
Mr. DeVilbiss, Portfolio Manager, is the
associate portfolio manager for the
Growth Stock Strategy in the U.S. Equity
Division. Previously, he was an equity
research analyst following restaurant
companies. Mr. DeVilbiss is an
Investment Advisory Committee member
of the US All-Cap Opportunities and
Global Growth Equity Strategies. Mr.
DeVilbiss was originally with T. Rowe
Price from 2006 to 2010 and returned
to T. Rowe Price in 2012. |
|
Leon Eidelman, CFA |
JPMorgan |
VY® JPMorgan
Emerging
Markets
Equity
Portfolio |
Mr. Eidelman, Portfolio Manager and
Managing Director, has been with
JPMorgan since 2002 and is responsible
for global emerging markets portfolios. |
|
Kristy Finnegan, CFA |
Voya IM |
Voya Large
Cap Growth
Portfolio |
Ms. Finnegan, Portfolio Manager of Voya
IM’s large cap growth and mid cap
growth strategies, joined Voya IM in
2001. Previously, she served as a
portfolio manager and analyst for Voya
IM’s large cap value strategies. Prior to
that, Ms. Finnegan was an investment
banking analyst at SunTrust Equitable
Securities where she focused on deals
primarily in the education and health
care sectors. |
|
Austin Forey |
JPMorgan |
VY® JPMorgan
Emerging
Markets
Equity
Portfolio |
Mr. Forey, Portfolio Manager and
Managing Director, has been at
JPMorgan (or one of its predecessors)
since 1988 and is responsible for global
emerging markets portfolios, a role he
has fulfilled since 1994. |
|
Alex Gabriele |
MSIM Limited |
VY® Morgan
Stanley Global
Franchise
Portfolio |
Mr. Gabriele, Managing Director, has
been associated with MSIM Limited in
an investment capacity since 2012. |
116
MANAGEMENT OF THE PORTFOLIOS (continued)
|
Portfolio Manager |
Investment Adviser or
Sub-Adviser |
Portfolio |
Professional Experience |
|
David R. Giroux, CFA |
T. Rowe Price IM |
VY® T. Rowe
Price Capital
Appreciation
Portfolio |
Mr. Giroux, Vice President, joined T. Rowe
Price in 1998 and joined T. Rowe Price
IM in March 2022 and has served as
portfolio manager and chairman of the T.
Rowe Price Capital Appreciation Fund
since 2006. He is the chief investment
officer for U.S. Equity Multi-Discipline
and is a portfolio manager in the U.S.
Equity Division and co-chair of the Asset
Allocation Committee. |
|
David Goodson |
Voya IM |
Voya Limited
Maturity
Bond
Portfolio |
Mr. Goodson, Senior Portfolio Manager
for mortgage-backed securities and
asset-backed securities strategies, is
head of securitized fixed-income at Voya
IM. Prior to joining Voya IM in 2002, he
was a principal at an independent
investment bank focused on
asset-backed commercial paper
transactions. Mr. Goodson began his
career as a vice-president in Wachovia
Securities’ asset-backed finance group,
marketing and executing securitizations
for the bank’s corporate clients. |
|
Akash Gupta, CFA |
JPMorgan |
VY® JPMorgan
Small Cap
Core Equity
Portfolio |
Mr. Gupta, Executive Director, is a
portfolio manager and analyst within the
U.S. Core Equity Small and Mid Cap
Team, of which he has been a member
since 2008. An employee since 2004,
Mr. Gupta previously spent over three
years in the sell-side Equity Research
Group, focusing on the electronics
manufacturing supply chain sector. |
|
Will Guthrie, CFA |
Invesco |
VY® Invesco
Growth and
Income
Portfolio |
Mr. Guthrie, Portfolio Manager, for the US
Value Equities Investment team at
Invesco, is responsible for comanaging
Invesco’s growth and income and equity
and income strategies. Mr. Guthrie
joined Invesco in 2014 as an equities
analyst. Prior to his current role, he was
a senior equities analyst. Before joining
Invesco, he was a senior associate at
Ares Management. Mr. Guthrie entered
the industry in 2004 as a financial
analyst at Edgeview Partners.
|
117
MANAGEMENT OF THE PORTFOLIOS (continued)
|
Portfolio Manager |
Investment Adviser or
Sub-Adviser |
Portfolio |
Professional Experience |
|
Phillip D. Hart, CFA |
JPMorgan |
VY® JPMorgan
Small Cap
Core Equity
Portfolio |
Mr. Hart, Managing Director, is a portfolio
manager and the head of the U.S. Core
Equity Small and Mid Cap Team. An
employee since 2003, his
responsibilities include managing small
and mid cap assets for the past 20
years and his responsibilities include
managing all of the team's strategies.
Previously, he has held roles as both a
fundamental and quantitative research
analyst in addition to helping with daily
implementation and maintenance of
portfolios. |
|
Andrew Higley, CFA |
Voya IM |
Voya Government
Liquid Assets
Portfolio |
Mr. Higley, CFA, Portfolio Manager, is a
senior vice president at Voya IM. He
serves as Head of Derivatives & Liquid
Trading and is responsible for oversight
of derivatives portfolio management and
liquid trading activities supporting fixed
income investment strategies. Prior to
joining Voya IM in 2006, Mr. Higley was a
senior trader at the Federal Home Loan
Bank of Atlanta. |
|
Robert Ippolito, CFA |
JPMorgan |
VY® JPMorgan
Small Cap
Core Equity
Portfolio |
Mr. Ippolito, Executive Director, is a
portfolio manager in the U.S. Core Equity
Small and Mid Cap Group. An employee
since 2009, Mr. Ippolito was previously
an investment analyst at Fifth Street
Management LLC. |
|
Rajen Jadav, CFA |
Voya IM |
Voya Limited
Maturity
Bond
Portfolio |
Mr. Jadav, Portfolio Manager, is a senior
vice president and portfolio manager for
the fixed income team at Voya IM. Prior
to joining Voya IM, he was a senior
product specialist at Allianz Global
Investors where he was responsible for
covering and supporting sales and
distribution of the global fixed income
team’s product offering in North
America. Prior to that, Mr. Jadav was a
portfolio manager at AllianceBernstein
where he held various positions
managing US multi-sector, US TIPS,
stable value, global multi-sector and
municipal money market portfolios. |
|
Brian Jurkash |
Invesco |
VY® Invesco
Growth and
Income
Portfolio |
Mr. Jurkash, Co-Lead Portfolio Manager,
has been associated with Invesco
and/or its affiliates since 2000. |
118
MANAGEMENT OF THE PORTFOLIOS (continued)
|
Portfolio Manager |
Investment Adviser or
Sub-Adviser |
Portfolio |
Professional Experience |
|
Justin Kass, CFA |
Voya IM |
Voya High
Yield
Portfolio |
Mr. Kass, Senior Managing Director,
Portfolio Manager, is chief investment
officer, co-head of income and growth at
Voya IM. He joined the firm as part of
Voya's acquisition of Allianz Global
Investors U.S., where he was a portfolio
manager, managing director, CIO, and
co-head of the U.S. income and growth
strategies team with portfolio
management, research and trading
responsibilities for the income and
strategies team. Prior to that at Allianz
Global Investors U.S., Mr. Kass held
portfolio manager responsibilities for the
U.S. convertible strategy and was a lead
portfolio manager for the income and
growth strategy since its inception and
was also responsible for managing
multiple closed- and open-end mutual
funds. |
|
Anton Kryachok |
MSIM Limited |
VY® Morgan
Stanley Global
Franchise
Portfolio |
Mr. Kryachok, Executive Director of MSIM
Limited, has been associated with MSIM
Limited in an investment capacity since
2021. |
|
Alban Lhonneur |
CMIA |
VY®
Columbia
Real Estate
Portfolio |
Mr. Lhonneur, Lead Portfolio Manager,
is the lead fund manager of the CT Real
Estate Equity Market Neutral Fund and
co-manager of the CT Global Real Estate
Securities Fund, CT Property Growth &
Income Fund, the Columbia Real Estate
Equity Fund and a number of segregated
accounts. Mr. Lhonneur joined Columbia
Threadneedle through the acquisition of
BMO GAM (EMEA) in 2021, having been
with BMO since July 2008. |
|
William D. Lock |
MSIM Limited |
VY® Morgan
Stanley Global
Franchise
Portfolio |
Mr. Lock, Managing Director, has been
associated with MSIM Limited in an
investment capacity since 1994. |
|
Sergio Marcheli |
Invesco |
VY® Invesco
Growth and
Income
Portfolio |
Mr. Marcheli, Portfolio Manager, joined
Invesco in 2010. Prior to that, he was
with Van Kampen Asset Management
since 2002. |
|
Isabelle Mast |
MSIM Limited |
VY® Morgan
Stanley Global
Franchise
Portfolio |
Ms. Mast, Executive Director of MSIM
Limited, has been associated with MSIM
Limited in an investment capacity since
2021. |
119
MANAGEMENT OF THE PORTFOLIOS (continued)
|
Portfolio Manager |
Investment Adviser or
Sub-Adviser |
Portfolio |
Professional Experience |
|
Amit Mehta, CFA |
JPMorgan |
VY® JPMorgan
Emerging
Markets
Equity
Portfolio |
Mr. Mehta, Portfolio Manager and
Managing Director, has been with
JPMorgan since 2011. Prior to joining
JPMorgan, he worked at Prusik
Investment Management (2009-2011)
and Atlantis Investment Management
(2007-2009) where he was an Asian
equities analyst and portfolio manager.
Prior to that, Mr. Mehta was a global
emerging markets analyst at Aviva
Investors (2004-2007). |
|
David J. Oberto |
Voya IM |
Voya High
Yield
Portfolio |
Mr. Oberto, Portfolio Manager, joined
Voya IM as part of Voya's acquisition of
Allianz Global Investors U.S., where he
was a portfolio manager and director
with portfolio management, research,
and trading responsibilities for the
income and growth strategies team. At
Allianz Global Investors U.S., he served
as portfolio manager for the U.S. High
Yield Bond strategy and was also
responsible for managing multiple
closed-end and open-end mutual funds.
Prior to that, Mr. Oberto was a portfolio
administrator, a credit default swaps
account manager and a trade-closer at
Bain Capital. |
|
Bruno Paulson |
MSIM Limited |
VY® Morgan
Stanley Global
Franchise
Portfolio |
Mr. Paulson, Managing Director, has
been associated with MSIM Limited in
an investment capacity since 2009. |
|
Daniel J. Percella, CFA |
JPMorgan |
VY® JPMorgan
Small Cap
Core Equity
Portfolio |
Mr. Percella, Managing Director, is a
research analyst and portfolio manager
within the U.S. Equity Group. An
employee since 2008, he is a research
analyst and co-portfolio manager for the
J.P. Morgan Small Cap Active Core, U.S.
Smaller Companies, and SMID Cap Core
Strategies. Prior to joining JPMorgan, Mr.
Percella was a member of Institutional
Investor-ranked equity research teams
covering the transportation sector at
Bear Stearns, Bank of America, and
Citigroup. |
|
Richard Perrott |
MSIM Limited |
VY® Morgan
Stanley Global
Franchise
Portfolio |
Mr. Perrott, Executive Director, has been
associated with MSIM Limited in an
investment capacity since 2015. |
120
MANAGEMENT OF THE PORTFOLIOS (continued)
|
Portfolio Manager |
Investment Adviser or
Sub-Adviser |
Portfolio |
Professional Experience |
|
Vivek Rajeswaran |
T. Rowe Price IM |
VY® T. Rowe
Price Capital
Appreciation
Portfolio |
Mr. Rajeswaran Portfolio Manager, joined
the T. Rowe Price IM in 2012, and his
investment experience dates from that
time. During the past five years, he has
served as an analyst in the U.S.
Equity Division, an associate portfolio
manager (beginning in 2023), and a
portfolio manager (beginning in March
2025). |
|
Christopher S. Reich, CFA |
CBRE |
VY® CBRE
Global Real
Estate
Portfolio |
Mr. Reich, Global Portfolio Manager and
Head of Quantitative Investment
Research, joined CBRE in 1999. |
|
Don San Jose, CFA |
JPMorgan |
VY® JPMorgan
Small Cap
Core Equity
Portfolio |
Mr. San Jose, Managing Director, Chief
Investment Officer of the U.S. Value
Team, and a portfolio manager within the
U.S. Equity Group, joined JPMorgan in
2000. He is responsible for managing
the J.P. Morgan Small Cap Active Core,
U.S. Smaller Companies, and SMID Cap
Core Strategies. Previously, Mr. San Jose
was an analyst in the JPMorgan
Securities’ equity research department
covering capital goods companies. Prior
to that, he was an equity research
associate at ING Baring Furman Selz. |
|
Don Schatz |
Voya IM |
Voya Government
Liquid Assets
Portfolio |
Mr. Schatz, Portfolio Manager, is a vice
president at Voya IM. Mr. Schatz is
responsible for portfolio management
activities for money market strategies, |
|
Anuranjan Sharma |
Voya IM |
Voya Limited
Maturity
Bond
Portfolio |
Mr. Sharma, Portfolio Manager and
macro strategist at Voya IM, previously
was a senior research analyst at
Oppenheimer Funds, where he was
responsible for emerging markets and
macro overlay for their multisector fund
and worked on international debt and
emerging local funds. Prior to that, Mr.
Sharma held roles at Voya IM in asset
allocation and fixed income where he
focused on global rates, foreign
exchange, and business cycle analysis
for developed and emerging markets. |
|
Mike Signore |
T. Rowe Price IM |
VY® T. Rowe
Price Capital
Appreciation
Portfolio |
Mr. Signore, Portfolio Manager, worked
for the T. Rowe Price IM from 2015 to
2018 and returned in 2020, and his
investment experience dates from 2010.
During the past five years, he has served
as an analyst in the U.S. Equity Division,
an associate portfolio manager
(beginning in 2023), and a portfolio
manager (beginning in March 2025). |
121
MANAGEMENT OF THE PORTFOLIOS (continued)
|
Portfolio Manager |
Investment Adviser or
Sub-Adviser |
Portfolio |
Professional Experience |
|
Joseph P. Smith, CFA |
CBRE |
VY® CBRE
Global Real
Estate
Portfolio |
Mr. Smith, President and Chief
Investment Officer – Listed Real Assets,
joined CBRE in 1997. |
|
Brian Solomon, CFA |
T. Rowe Price IM |
VY® T. Rowe
Price Capital
Appreciation
Portfolio |
Mr. Solomon, Portfolio Manager, joined
the T. Rowe Price IM in 2015 and his
investment experience dates from that
time. During the past five years, he has
served as an analyst in the U.S. Equity
Division, an associate portfolio manager
(beginning in 2023), and a portfolio
manager (beginning in March 2025). |
|
James Stillwagon |
T. Rowe Price |
Voya Large
Cap Growth
Portfolio |
Mr. Stillwagon, Portfolio Manager in the
U.S. Equity Division for T. Rowe, joined T.
Rowe Price in 2017. He is the president
of the US Communications and
Technology Strategy, the chairman of the
strategy's Investment Advisory
Committee, and a vice president and an
Investment Advisory Committee member
of the Science & Technology Equity, US
Large-Cap Core Growth Equity, US
Structured Research Equity, US
Tax-Efficient Multi-Cap Growth Equity,
and Institutional Large-Cap Core Growth
Equity Strategies. Mr. Stillwagon is also a
vice president of T. Rowe Price Group,
Inc. |
|
Matthew Titus, CFA |
Invesco |
VY® Invesco
Growth and
Income
Portfolio |
Mr. Titus, Co-Lead Portfolio Manager,
joined Invesco in 2016. Prior to that, he
was with American Century Investments
(2004-2016). |
|
Leigh Todd, CFA |
Voya IM |
Voya Large
Cap Growth
Portfolio |
Ms. Todd, Portfolio Manager of Voya IM's
large cap growth and mid cap growth
strategies, joined Voya IM in 2021. Prior
to that, she served as a portfolio
manager and senior research analyst at
Mellon and was a portfolio manager at
State Street Global Advisors. |
|
Ethan Turner, CFA |
Voya IM |
Voya High
Yield
Portfolio |
Mr. Turner, Portfolio Manager, joined Voya
IM as part of Voya's acquisition of Allianz
Global Investors U.S., where he was an
analyst and vice president with research
responsibilities for the income and
growth strategies team. Prior to Allianz
Global Investors U.S., he was a trading
assistant. Prior to that, Mr. Turner was a
lead analyst covering the financial sector
at Relational Investors and a financial
analyst at Sunstone Hotel Investors. |
122
MANAGEMENT OF THE PORTFOLIOS (continued)
|
Portfolio Manager |
Investment Adviser or
Sub-Adviser |
Portfolio |
Professional Experience |
|
Vinay Viralam, CFA |
Voya IM |
Voya Limited
Maturity
Bond
Portfolio |
Mr. Viralam, Portfolio Manager, is a
senior vice president and portfolio
manager for the fixed income team at
Voya IM. Prior to joining Voya IM, he
worked at Goldman Sachs Asset
Management for 11 years, focused on
cross-sector research and portfolio
management. |
|
Kenneth S. Weinberg, CFA |
CBRE |
VY® CBRE
Global Real
Estate
Portfolio |
Mr. Weinberg, Global Portfolio Manager,
joined CBRE in 2004. |
|
Daniel Winterbottom, CFA |
CMIA |
VY®
Columbia
Real Estate
Portfolio |
Mr. Winterbottom, Portfolio Manager, and
is Chief Operating Officer, co-manager of
CT Global Real Estate Securities Fund,
the Columbia Real Estate Equity Fund
and a number of segregated accounts.
Mr. Winterbottom was appointed Chief
Operating Officer – Thames River Capital
in 2025, taking on additional
operational management responsibilities
across the range of TRC funds. Mr.
Winterbottom joined Columbia
Threadneedle through the acquisition of
BMO GAM (EMEA) in 2021, having
previously been with BMO since July
2015, with a focus on global real estate
securities and portfolio analysis. |
|
Kai Yee Wong |
Voya IM |
Voya U.S.
Stock Index
Portfolio |
Ms. Wong, Portfolio Manager, joined Voya
IM in 2012 and is responsible for the
portfolio management of the index,
active quantitative, and smart beta
strategies. Prior to that, she worked as a
senior equity portfolio manager at
Northern Trust (2003-2009) where she
was responsible for managing various
global indices, including developed,
emerging, real estate, Topix, and socially
responsible benchmarks. |
|
David S. Yealy |
Voya IM |
Voya Government
Liquid Assets
Portfolio |
Mr. Yealy, Portfolio Manager, joined Voya
IM in 2004. Prior to that, he was a
managing director with Trusco Capital
Management (1991-2004) where he
managed over $9 billion of assets and
was instrumental in the development
and marketing of that firm’s cash
management business. |
Additional Information Regarding the Portfolio Managers
The SAI provides additional information about each portfolio manager’s compensation, other accounts managed by each portfolio manager, and the securities each portfolio manager owns in the Portfolio(s) the portfolio manager manages.
123
MANAGEMENT OF THE PORTFOLIOS (continued)
Distributor
Voya Investments Distributor, LLC (the “Distributor”), a Delaware limited liability company, is the principal underwriter and distributor of each Portfolio. The Distributor is an indirect subsidiary of Voya Financial, Inc. and is an affiliate of the Investment Adviser. The Distributor’s principal business address is 7337 East Doubletree Ranch Road, Suite 100, Scottsdale, Arizona 85258. See “Principal Underwriter” in the SAI.
The Distributor is a member of the Financial Industry Regulatory Authority, Inc. (“FINRA”). To obtain information about FINRA member firms and their associated persons, you may contact FINRA at www.finra.org or the Public Disclosure Hotline at 800-289-9999.
Contractual Arrangements
Each Portfolio has contractual arrangements with various service providers, which may include, among others, investment advisers, distributors, custodians and fund accounting agents, shareholder service providers, and transfer agents, who provide services to each Portfolio. Shareholders are not parties to, or intended (“third-party”) beneficiaries of, any of those contractual arrangements, and those contractual arrangements are not intended to create in any individual shareholder or group of shareholders any right to enforce them against the service providers or to seek any remedy under them against the service providers, either directly or on behalf of a Portfolio. This paragraph is not intended to limit any rights granted to shareholders under federal or state securities laws.
124
HOW SHARES ARE PRICED
Each Portfolio is open for business every day the New York Stock Exchange (the “NYSE”) opens for regular trading (each such day, a “Business Day”). The net asset value (the “NAV”) per share for each class of each Portfolio is determined each Business Day as of the close of the regular trading session (“Market Close”), as determined by the Consolidated Tape Association (the “CTA”), the central distributor of transaction prices for exchange-traded securities (normally 4:00 p.m. Eastern Time unless otherwise designated by the CTA). The NAV per share of each class of each Portfolio is calculated by taking the value of the Portfolio’s assets attributable to that class, subtracting the Portfolio’s liabilities attributable to that class, and dividing by the number of shares of that class that are outstanding. On days when a Portfolio is closed for business, Portfolio shares will not be priced, and the Portfolio will not process purchase or redemption orders. To the extent a Portfolio’s assets are traded in other markets on days when the Portfolio does not price its shares, the value of the Portfolio’s assets will likely change and you will not be able to purchase or redeem shares of the Portfolio.
Portfolio holdings for which market quotations are readily available are valued at market value. Investments in open-end registered investment companies that do not trade on an exchange are valued at the end-of-day NAV per share. The prospectuses of the open-end registered investment companies in which each Portfolio may invest explain the circumstances under which they will use fair value pricing and the effects of using fair value pricing. Foreign (non-U.S.) securities’ prices are converted into U.S. dollar amounts using the applicable exchange rates as of Market Close.
When a market quotation for a portfolio security is not readily available or is deemed unreliable (for example, when trading has been halted or there are unexpected market closures or other material events that would suggest that the market quotation is unreliable) and for purposes of determining the value of other portfolio holdings, the portfolio holding is priced at its fair value. The Board has designated the Investment Adviser, as the valuation designee, to make fair value determinations in good faith. In determining the fair value of a Portfolio’s portfolio holdings, the Investment Adviser, pursuant to its fair valuation policy, may consider inputs from pricing service providers, broker-dealers, or a Portfolio’s Sub-Adviser(s). Issuer specific events, transaction price, position size, nature and duration of restrictions on disposition of the security, market trends, bid/ask quotes of brokers, and other market data may be reviewed in the course of making a good faith determination of the fair value of a portfolio holding. Because trading hours for certain foreign (non-U.S.) securities end before Market Close, closing market quotations may become unreliable. The prices of foreign (non-U.S.) securities will generally be adjusted based on inputs from a third-party pricing service that are intended to reflect valuation changes through Market Close. Because of the inherent uncertainties of fair valuation, the values used to determine each Portfolio’s NAV may materially differ from the value received upon actual sale of those investments. Thus, fair valuation may have an unintended dilutive or accretive effect on the value of shareholders’ investments in each Portfolio.
When your Variable Contract or Qualified Plan is buying shares of a Portfolio, it will pay the NAV that is next calculated after the order from the Variable Contract owner or Qualified Plan participant is received in proper form. When the Variable Contract owner or Qualified Plan participant is selling shares, it will normally receive the NAV that is next calculated after the order form is received from the Variable Contract owner or Qualified Plan participant in proper form. Investments will be processed at the NAV next calculated after an order is received and accepted by a Portfolio or its designated agent. In order to receive that day's price, your order must be received by Market Close.
Voya Government Liquid Assets Portfolio
Voya Government Liquid Assets Portfolio uses the amortized cost method to value its portfolio securities and seeks to maintain a constant NAV of $1.00 per share, although there may be circumstances under which this goal cannot be achieved. The amortized cost method involves valuing a security at its cost and amortizing any discount or premium over the period until maturity, regardless of the impact of fluctuating interest rates or the market value of the security. Although the Portfolio's Board has established procedures designed to stabilize, to the extent reasonably possible, the share price of the Portfolio, there can be no assurance that the Portfolio's NAV can be maintained at $1.00 per share.
125
HOW TO BUY AND SELL SHARES
Each Portfolio's shares may be offered to insurance company separate accounts serving as investment options under Variable Contracts, Qualified Plans outside the separate account context, custodial accounts, certain investment advisers and their affiliates in connection with the creation or management of a Portfolio, other investment companies (as permitted by the 1940 Act), and other investors as permitted by the diversification and other requirements of section 817(h) of the Internal Revenue Code of 1986, as amended (the “Code”) and the underlying U.S. Treasury Regulations.
Class R6 shares are only offered to investors that do not require a Portfolio or an affiliate of a Portfolio (including the Investment Adviser and any affiliate of the Investment Adviser) to make, and a Portfolio or affiliate does not pay, any type of servicing, administrative, or revenue sharing payments with respect to Class R6 shares. Notwithstanding the foregoing, affiliates of Voya, including affiliates that are intermediaries that sell Class R6 shares of a Portfolio, may benefit financially from the revenue Voya receives for the services it provides to Class R6 shares of a Portfolio. Availability of Class R6 shares is subject to management’s determination of the appropriateness of investment in Class R6 shares.
Each Portfolio may not be available as an investment option in your Variable Contract, through your Qualified Plan, or other investment company. Please refer to the prospectus for the appropriate insurance company separate account, investment company, or your plan documents for information on how to direct investments in, or redemptions from, an investment option corresponding to a Portfolio and any fees that may apply. Participating insurance companies and certain other designated organizations are authorized to receive purchase orders on each Portfolio's behalf.
Each Portfolio currently does not foresee any disadvantages to investors if it serves as an investment option for Variable Contracts and if it offers its shares directly to Qualified Plans and other permitted investors. However, it is possible that the interests of Variable Contract owners, plan participants, and other permitted investors for which a Portfolio serves as an investment option might, at some time, be in conflict because of differences in tax treatment or other considerations. The Board directed the Investment Adviser to monitor events to identify any material conflicts between Variable Contract owners, plan participants, and other permitted investors and would have to determine what action, if any, should be taken in the event of such conflict. If such a conflict occurred, an insurance company participating in a Portfolio might be required to redeem the investment of one or more of its separate accounts from the Portfolio or a Qualified Plan, investment company, or other permitted investor might be required to redeem its investment, which might force the Portfolio to sell securities at disadvantageous prices. Each Portfolio may discontinue sales to a Qualified Plan and require plan participants with existing investments to redeem those investments if the Qualified Plan loses (or in the opinion of the Investment Adviser, is at risk of losing) its Qualified Plan status.
Each Portfolio reserves the right to suspend the offering of shares or to reject any specific purchase order. Each Portfolio may suspend redemptions or postpone payments when the NYSE is closed or when trading is restricted for any reason or under emergency circumstances as determined by the SEC.
Distribution Plans and Shareholder Service Plans
Each Portfolio listed in the table below has a distribution and shareholder service plan (the “12b-1 Plan”) in accordance with Rule 12b-1 under the 1940 Act for Class ADV shares. Payments are made to the Distributor on an ongoing basis as compensation for services the Distributor provides and expenses it bears in connection with the marketing and other fees to support the sale and distribution of the Class ADV shares and for shareholder services provided by securities dealers (including the Investment Adviser) and other financial intermediaries and plan administrators that provide administrative services relating to Class ADV shares and their shareholders, including Variable Contract owners or Qualified Plan participants with interests in the Portfolios. The annual distribution and shareholder service fees under the 12b-1 Plan may equal up to 0.60% (0.35% for distribution fees and 0.25% for shareholder service fees) of the average daily net assets of each Portfolio except Voya U.S. Stock Index Portfolio for which the annual distribution and shareholder service fees under the 12b-1 Plan may equal up to 0.53% (0.28% for distribution fees and 0.25% for shareholder service fees) of the average daily net assets of Voya U.S. Stock Index Portfolio.
Each Portfolio listed in the table below has a distribution plan pursuant to Rule 12b-1 (the “Distribution Plan”) in accordance with Rule 12b-1 under the 1940 Act for Class S2 shares. These payments are made to the Distributor on an ongoing basis as compensation for services the Distributor provides and expenses it bears in connection with the marketing and other fees to support the sale and distribution of the Class S2 shares of the Portfolios. Under the Distribution Plan, each Portfolio makes payments at an annual rate of 0.15% of the Portfolio’s average daily net assets attributable to its Class S2 shares.
Last, each Portfolio listed in the table below has a shareholder service plan (the “Service Plan”) for Class S and Class S2 shares. These payments are made to the Distributor in connection with shareholder services rendered to Portfolio shareholders and the maintenance of shareholders’ accounts. The Service Plan allows the Trust to enter into shareholder servicing agreements with insurance companies, broker-dealers (including the Investment Adviser) and other financial intermediaries that provide shareholder and administrative services relating to Class S and Class S2 shares of the Portfolios and their shareholders, including Variable Contract owners or Qualified Plan participants
126
HOW TO BUY AND SELL SHARES (continued)
with interests in the Portfolios. Under the Service Plan, each Portfolio makes payments at an annual rate of 0.25% of the Portfolio’s average daily net assets attributable to each of its Class S and Class S2 shares. The Distributor has agreed to waive 0.01% of the shareholder service fee for Voya U.S. Stock Index Portfolio’s Class S shares. This waiver will continue through May 1, 2027.
Because these distribution and shareholder service fees are paid out of a Portfolio’s assets on an ongoing basis, over time these fees will increase the costs of your investment and may cost you more than paying other types of sales charges.
|
Portfolio |
Class ADV |
Class S |
Class S2 |
|
Voya Government Liquid Assets Portfolio |
N/A |
0.25% |
0.40% |
|
Voya High Yield Portfolio |
0.60% |
0.25% |
0.40% |
|
Voya Large Cap Growth Portfolio |
0.60% |
0.25% |
0.40% |
|
Voya Limited Maturity Bond Portfolio |
0.60% |
0.25% |
N/A |
|
Voya U.S. Stock Index Portfolio |
0.53% |
0.25% |
0.40% |
|
VY® CBRE Global Real Estate Portfolio |
0.60% |
0.25% |
0.40% |
|
VY® Columbia Real Estate Portfolio |
0.60% |
0.25% |
0.40% |
|
VY® Invesco Growth and Income Portfolio |
0.60% |
0.25% |
0.40% |
|
VY® JPMorgan Emerging Markets Equity Portfolio |
0.60% |
0.25% |
0.40% |
|
VY® JPMorgan Small Cap Core Equity Portfolio |
0.60% |
0.25% |
0.40% |
|
VY® Morgan Stanley Global Franchise Portfolio |
0.60% |
0.25% |
0.40% |
|
VY® T. Rowe Price Capital Appreciation Portfolio |
0.60% |
0.25% |
0.40% |
127
FREQUENT TRADING - MARKET TIMING
Each Portfolio is intended for long-term investment and not as a short-term trading vehicle. Accordingly, organizations or individuals that use market timing investment strategies and make frequent transfers should not purchase shares of a Portfolio. Shares of each Portfolio are primarily sold through omnibus account arrangements with financial intermediaries, as investment options for Variable Contracts issued by insurance companies and as investment options for Qualified Plans. Omnibus accounts generally do not identify customers' trading activity on an individual basis. The Investment Adviser or affiliated entities have agreements which require such intermediaries to provide detailed account information, including trading history, upon request of a Portfolio.
The Board has made a determination not to adopt a separate policy for each Portfolio with respect to frequent purchases and redemptions of shares by a Portfolio’s shareholders, but rather to rely on the financial intermediaries to monitor frequent, short-term trading within a Portfolio by its customers. You should review the materials provided to you by your financial intermediary including, in the case of a Variable Contract, the prospectus that describes the contract or, in the case of a Qualified Plan, the plan documentation for its policies regarding frequent, short-term trading. With trading information received as a result of these agreements, a Portfolio may make a determination that certain trading activity is harmful to the Portfolio and its shareholders, even if such activity is not strictly prohibited by the intermediaries' excessive trading policy. As a result, a shareholder investing directly or indirectly in a Portfolio may have their trading privileges suspended without violating the stated excessive trading policy of the intermediary. Each Portfolio reserves the right, in its sole discretion and without prior notice, to reject, restrict, or refuse purchase orders whether directly or by exchange including purchase orders that have been accepted by a financial intermediary. Each Portfolio seeks assurances from the financial intermediaries that they have procedures adequate to monitor and address frequent, short-term trading. There is, however, no guarantee that the procedures of the financial intermediaries will be able to curtail frequent, short-term trading activity.
Each Portfolio believes that market timing or frequent, short-term trading in any account, including a Variable Contract or Qualified Plan account, is not in the best interest of the Portfolio or its shareholders. Due to the disruptive nature of this activity, it can adversely impact the ability of the Investment Adviser or the Sub-Adviser (if applicable) to invest assets in an orderly, long-term manner. Frequent trading can disrupt the management of a Portfolio and raise their expenses through: increased trading and transaction costs; forced and unplanned portfolio turnover; lost opportunity costs; and large asset swings that decrease the Portfolio's ability to provide maximum investment return to all shareholders. This in turn can have an adverse effect on a Portfolio's performance.
Portfolios that invest in foreign (non-U.S.) securities may present greater opportunities for market timers and thus be at a greater risk for excessive trading. If an event occurring after the close of a foreign market, but before the time a Portfolio computes its current NAV, causes a change in the price of the foreign (non-U.S.) security and such price is not reflected in its current NAV, investors may attempt to take advantage of anticipated price movements in securities held by a Portfolio based on such pricing discrepancies. This is often referred to as “price arbitrage.” Such price arbitrage opportunities may also occur in portfolios which do not invest in foreign (non-U.S.) securities. For example, if trading in a security held by a Portfolio is halted and does not resume prior to the time it calculates its NAV such “stale pricing” presents an opportunity for investors to take advantage of the pricing discrepancy. Similarly, portfolios that hold thinly-traded securities, such as certain small-capitalization securities, may be exposed to varying levels of pricing arbitrage. Each Portfolio has adopted fair valuation policies and procedures intended to reduce its exposure to price arbitrage, stale pricing and other potential pricing discrepancies. However, to the extent that a Portfolio does not immediately reflect these changes in market conditions, short-term trading may dilute the value of the Portfolio’s shares which negatively affects long-term shareholders.
The following transactions are excluded when determining whether trading activity is excessive:
•
Rebalancing to facilitate fund-of-fund arrangements or a Portfolio’s systematic exchange privileges; and
•
Purchases or sales initiated by certain other funds in the Voya family of funds.
Although the policies and procedures known to a Portfolio that are followed by the financial intermediaries that use the Portfolio and the monitoring by the Portfolio are designed to discourage frequent, short-term trading, none of these measures can eliminate the possibility that frequent, short-term trading activity in the Portfolio will occur. Moreover, decisions about allowing trades in a Portfolio may be required. These decisions are inherently subjective, and will be made in a manner that is in the best interest of a Portfolio's shareholders.
128
PAYMENTS TO FINANCIAL INTERMEDIARIES
Voya mutual funds may be offered as investment options in Variable Contracts issued by affiliated and non-affiliated insurance companies and in Qualified Plans. Fees derived from a Portfolio's Distribution and/or Service Plans (if applicable) may be paid to insurance companies, broker-dealers, and companies that service Qualified Plans for selling the Portfolio's shares and/or for servicing shareholder accounts. Fees derived from a Portfolio’s Service Plan may be paid to insurance companies, broker-dealers, and companies that service Qualified Plans for servicing shareholder accounts. Shareholder services may include, among other things, administrative, record keeping, or other services that insurance companies or Qualified Plans provide to the clients who use a Portfolio as an investment option. In addition, the Investment Adviser, Distributor, or their affiliated entities, out of their own resources and without additional cost to a Portfolio or its shareholders, may pay additional compensation to these insurance companies, broker-dealers, or companies that service Qualified Plans. The Investment Adviser, Distributor, or affiliated entities of a Portfolio may also share their profits with affiliated insurance companies or other Voya entities through inter-company payments.
For non-affiliated insurance companies and Qualified Plans, payments from a Portfolio's Distribution and/or Service Plans (if applicable) as well as payments (if applicable) from the Investment Adviser and/or Distributor generally are based upon an annual percentage of the average net assets held in a Portfolio by those companies. Payments to financial intermediaries by the Distributor or its affiliates or by a Portfolio may provide an incentive for insurance companies or Qualified Plans to make a Portfolio available through Variable Contracts or Qualified Plans over other mutual funds or products.
As of the date of this Prospectus, the Distributor has entered into agreements with the following non-affiliated insurance companies: C.M. Life Insurance Company, First Security Benefit Life Insurance and Annuity Company of New York, First Symetra National Life Insurance Company of New York, Lincoln Financial Group, Lincoln National Life Insurance Company, Massachusetts Mutual Life Insurance Company, Nationwide Life Insurance Company, New York Life Insurance and Annuity Corporation, Security Benefit Life Insurance Company, Security Equity Life Insurance Company, Security Life of Denver Insurance Company, Standard Life Insurance Company, Symetra Life Insurance Company, Talcott Resolution Life Insurance Company, TIAA Life Insurance Company, Transamerica Life Insurance Company, Transamerica Financial Life Insurance Company, Union Securities, Venerable Insurance and Annuity Company, and Zurich American Life Insurance Company. Except as discussed in further detail below, the fees payable under these agreements are for compensation for providing distribution and/or shareholder services for which the insurance companies are paid at annual rates that range from 0.00% to 0.55%. This is computed as a percentage of the average aggregate amount invested in the Portfolio by Variable Contract holders through the relevant insurance company's Variable Contracts.
The insurance companies issuing Variable Contracts or Qualified Plans that use a Portfolio as an investment option may also pay fees to third parties in connection with distribution of the Variable Contracts and for services provided to Variable Contract owners. Entities that service Qualified Plans may also pay fees to third parties to help service the Qualified Plans or the accounts of their participants. Neither a Portfolio, the Investment Adviser, nor the Distributor are parties to these arrangements. Variable Contract owners should consult the prospectus and statement of additional information for their Variable Contracts for a discussion of these payments and should consult with their agent or broker. Qualified Plan participants should consult with their pension servicing agent.
Ultimately, the agent or broker selling the Variable Contract to you could have a financial interest in selling you a particular product to increase the compensation they receive. Please make sure you read fully each prospectus and discuss any questions you have with your agent or broker.
Class R6
Voya mutual funds are distributed by the Distributor. The Distributor is a broker-dealer that is licensed to sell securities. The Distributor generally does not sell directly to the public but sells and markets its products through financial intermediaries. Each Voya mutual fund also has an investment adviser which is responsible for managing the money invested in each of the mutual funds. No dealer compensation is paid from the sale of Class R6 shares of a Portfolio. Class R6 shares do not have sales commissions, pay 12b-1 fees, or make payments to financial intermediaries for assisting the Distributor in promoting the sales of a Portfolio's shares. In addition, neither a Portfolio nor its affiliates (including the Investment Adviser and any affiliate of the Investment Adviser) make any type of administrative, service, or revenue sharing payments in connection with Class R6 shares. Notwithstanding the foregoing, affiliates of Voya, including affiliates that are intermediaries that sell Class R6 shares of a Portfolio, may benefit financially from the revenue Voya receives for the services it provides to Class R6 shares of a Portfolio.
129
DIVIDENDS, DISTRIBUTIONS, AND TAXES
Dividends and Distributions
Each Portfolio generally distributes most or all of its net earnings in the form of dividends, consisting of net investment income and capital gains distributions, if any. Each Portfolio distributes capital gains, if any, annually. Each Portfolio (except Voya Government Liquid Assets Portfolio, Voya High Yield Portfolio, Voya Limited Maturity Bond Portfolio, Voya U.S. Stock Index Portfolio, and VY® T. Rowe Price Capital Appreciation Portfolio) also declares dividends and pays dividends consisting of net investment income, if any, annually. Voya U.S. Stock Index Portfolio, and VY® T. Rowe Price Capital Appreciation Portfolio declare dividends and pay dividends consisting of net investment income, if any, semi-annually. Voya Government Liquid Assets Portfolio, Voya High Yield Portfolio, and Voya Limited Maturity Bond Portfolio declare dividends daily and pay dividends consisting of net investment income, if any, monthly.
All dividends and capital gains distributions will be automatically reinvested in additional shares of a Portfolio at the NAV of such shares on the payment date unless a participating insurance company’s separate account is permitted to hold cash and elects to receive payment in cash.
From time to time a portion of a Portfolio’s distributions may constitute a return of capital. To comply with U.S. federal tax laws, a Portfolio may also pay additional distributions of capital gains and/or ordinary income.
Tax Consequences
Holders of Variable Contracts should refer to the prospectus for their contracts for information regarding the tax consequences of owning such contracts and should consult their tax advisers before investing.
Each Portfolio intends to qualify as a regulated investment company (“RIC”) for U.S. federal income tax purposes by satisfying the requirements under Subchapter M of the Code, including requirements with respect to diversification of assets, distribution of income and sources of income. As a RIC, a Portfolio generally will not be subject to tax on its net investment company taxable income and net realized capital gains that it timely distributes to its shareholders.
Each Portfolio also intends to comply with the diversification requirements of Section 817(h) of the Code and the underlying regulations for Variable Contracts so that owners of these contracts should not be subject to U.S. federal tax on distributions of dividends and income from the Portfolio to an applicable insurance company's separate accounts.
Since the sole shareholders of each Portfolio will be separate accounts of insurance companies or other permitted investors, no discussion is included herein as to the U.S. federal income tax consequences at the shareholder level. For information concerning the U.S. federal income tax consequences to purchasers of Variable Contracts, see the prospectus for the applicable contract.
See the SAI for further information about tax matters.
The tax status of your investment in a Portfolio depends upon the features of your Variable Contract. For further information, please refer to the prospectus for the Variable Contract.
130
INDEX DESCRIPTIONS
The Bloomberg High Yield Bond - 2% Issuer Constrained Composite Index measures the performance of fixed-income securities. The index provides a general measure of the USD-denominated, high yield, fixed-rate corporate bond market. The index limits the exposure of the index to any one issue to 2% of the total market value of the index components.
The Bloomberg U.S. 1-3 Year Government/Credit Bond Index measures the performance of publicly issued investment grade fixed rate debt issues, including treasuries, agencies, and credit securities with a maturity of at least one year and less than three years.
The Bloomberg U.S. Aggregate Bond Index is a broad-based benchmark that measures the investment grade, US dollar-denominated, fixed-rate taxable bond market. The Bloomberg U.S. Aggregate Bond Index includes U.S. Treasuries, government-related and corporate securities, fixed-rate agency mortgage-backed securities, asset-backed securities, and commercial mortgage-backed securities (agency and non-agency). The Bloomberg U.S. Aggregate Bond Index is provided by Bloomberg Index Services Limited.
The Bloomberg U.S. Government/Credit Index includes securities in the government and credit indices. The government index includes treasuries (i.e., public obligations of the U.S. Treasury that have remaining maturities of more than one year) and agencies (i.e., publicly issued debt of U.S. government agencies, quasi-federal corporations, and corporate or foreign debt guaranteed by the U.S. government). The credit index includes publicly issued U.S. corporate and foreign debentures and secured notes that meet specified maturity, liquidity, and quality requirements.
The FTSE EPRA Nareit Developed Index is designed to track the performance of listed real estate companies and real-estate investment trusts worldwide. Relevant activities are defined as the ownership, disposal and development of income-producing real estate. Constituents are classified into distinct property sectors based on gross invested book assets, as disclosed in the latest published financial statement. Index constituents are free-float adjusted, liquidity, size and revenue screened.
The FTSE Nareit Equity REITs Index is a benchmark that includes all publicly traded Equity Real Estate Investment Trusts in the U.S., excluding Timberland and Telecommunications REITs. Equity REITs are companies that own and typically operate income-producing real estate across various sectors, such as residential, commercial, and industrial properties. The index provides a way to measure the performance of the equity REIT sector, which is known for its potential to deliver competitive total returns through high dividend income and long-term capital appreciation.
The ICE BofA U.S. High Yield Index tracks the performance of U.S. dollar denominated below investment grade corporate debt publicly issued in the U.S. domestic market.
The MSCI All Country World Ex-U.S. IndexSM is a free-float adjusted market capitalization index that is designed to measure equity market performance in the global developed and emerging markets, excluding the United States.
The MSCI All Country World IndexSM (“MSCI ACWI”) is a free-float adjusted market capitalization index that is designed to measure equity market performance in the global developed and emerging markets.
The MSCI EAFE® Index captures large- and mid-capitalization representation across 21 developed markets countries around the world, excluding the U.S. and Canada, and covers approximately 85% of the free float-adjusted market capitalization in each country. The MSCI EAFE® Index is provided by MSCI Inc.
The MSCI Emerging Markets IndexSM captures large- and mid-capitalization representation across 24 emerging markets countries and covers approximately 85% of the free float-adjusted market capitalization in each country.
The MSCI U.S. REIT® Index is a free float-adjusted market capitalization weighted index that is comprised of equity REITs. The index is based on the MSCI USA Investable Market Index, its parent index which captures large, mid and small cap securities. The index currently represents approximately 99% of the U.S. REIT universe and securities classified in the REIT sector according to the global industry classification standard. It excludes, however, mortgage REITs and selected securities REITs.
The MSCI World IndexSM is a free float-adjusted market capitalization index that is designed to measure global developed market equity performance.
The Russell 1000® Index measures the performance of the large-cap segment of the U.S. equity universe. It is a subset of the Russell 3000® Index and includes approximately 1,000 of the largest securities based on a combination of their market cap and current index membership. The index represents approximately 92% of the U.S. market.
131
INDEX DESCRIPTIONS (continued)
The Russell 1000® Growth Index measures the performance of the large-cap growth segment of the U.S. equity universe. It includes those Russell 1000® Index companies with higher price-to-book ratio and higher forecasted growth values.
The Russell 1000® Value Index measures the performance of the large-cap value segment of the U.S. equity universe. It includes those Russell 1000® Index companies with lower price-to-book ratios and lower forecasted growth values.
The Russell 2000® Index measures the performance of the small-capitalization segment of the U.S. equity universe. The Russell 2000® Index is a subset of the Russell 3000® Index, includes approximately 2,000 of the smallest securities (based on a combination of their market capitalization and current index membership), and represents approximately 7% of the total market capitalization of the Russell 3000® Index. The Russell 2000® Index is provided by FTSE Russell.
The Russell 3000® Index measures the performance of the largest 3,000 U.S. companies representing approximately 98% of the investable U.S. equity market.
The S&P 500® Index is designed as a gauge of the performance of the large-cap segment of the U.S. equity market, is composed of 500 constituent companies, and covers approximately 80% of available market capitalization. The S&P 500® Index is a float-adjusted market cap weighted index provided by S&P Dow Jones Indices LLC.
The VY® CBRE Global Real Estate Portfolio has been developed solely by the Investment Adviser and the Portfolio’s sub-adviser, CBRE Investment Management Listed Real Assets, LLC. The Portfolio is not in any way, connected to or sponsored, endorsed, sold or promoted by the London Stock Exchange Group plc and its group undertakings, including FTSE International Limited (collectively, the “LSE Group”), European Public Real Estate Association (“EPRA”), or the National Association of Real Estate Investments Trusts (“Nareit”) (and together the “Licensor Parties”). FTSE Russell is a trading name of certain of the LSE Group companies. All rights in the FTSE EPRA Nareit Developed Index vest in the Licensor Parties. “FTSE®” and “ FTSE Russell ® ” are trade marks of the relevant LSE Group company and are used by any other LSE Group company under license. “Nareit®” is a trade mark of Nareit, “EPRA®” is a trade mark of EPRA and all are used by the LSE Group under license. The FTSE EPRA Nareit Developed Index is calculated by or on behalf of FTSE International Limited or its affiliate, agent or partner. The Licensor Parties do not accept any liability whatsoever to any person arising out of (a) the use of, reliance on or any error in the FTSE EPRA Nareit Developed Index or (b) investment in or operation of the Portfolio. The Licensor Parties make no claim, prediction, warranty or representation either as to the results to be obtained from the Portfolio or the suitability of the FTSE EPRA Nareit Developed Index for the purpose to which it is being put by the Investment Adviser and/or the Portfolio’s sub-adviser.
The VY® Columbia Real Estate Portfolio has been developed solely by the Investment Adviser the Portfolio’s sub-adviser, Columbia Management Investment Advisers, LLC. The Portfolio is not in any way connected to or sponsored, endorsed, sold or promoted by FTSE International Limited (“FTSE”) or the London Stock Exchange Group plc and its group undertakings (collectively, the “LSE Group”) or Nareit. All rights in the FTSE Nareit Equity Index vest in FTSE and Nareit. “FTSE®” is a trade mark of the LSE Group and is used by FTSE International Limited (“FTSE”) under license. “NAREIT®” is a trade mark of the Nareit. The FTSE Nareit Equity Index is calculated by FTSE. Neither FTSE, nor the LSE Group, nor Nareit accept any liability whatsoever to any person arising out of (a) the use of, reliance on or any error in the FTSE Nareit Equity Index or (b) investment in or operation of the Portfolio. FTSE, the LSE Group, and Nareit make no claim, prediction, warranty or representation either as to the results to be obtained from the Portfolio or the suitability of the FTSE Nareit Equity Index for the purpose to which it is being put by the Investment Adviser and/or the Portfolio’s sub-adviser.
FTSE Russell Index Data Source: London Stock Exchange Group plc and its group undertakings (collectively, the “LSE Group”). © LSE Group 2026. FTSE Russell is a trading name of certain of the LSE Group companies. “FTSE®”, “Russell®”, “FTSE Russell®”, “Russell 1000®”, “Russell 2000®” and “Russell 3000®” are trade marks of the relevant LSE Group companies and are used by any other LSE Group company under license. All rights in the FTSE Russell indexes or data vest in the relevant LSE Group company which owns the index or the data. Neither LSE Group nor its licensors accept any liability for any errors or omissions in the indexes or data and no party may rely on any indexes or data contained in this communication. No further distribution of data from the LSE Group is permitted without the relevant LSE Group company’s express written consent. The LSE Group does not promote, sponsor or endorse the content of this communication.
SOURCE ICE DATA INDICES, LLC (“ICE DATA”), IS USED WITH PERMISSION. ICE® IS A REGISTERED TRADEMARK OF ICE DATA OR ITS AFFILIATES AND BOFA® IS A REGISTERED TRADEMARK OF BANK OF AMERICA CORPORATION LICENSED BY BANK OF AMERICA CORPORATION AND ITS AFFILIATES (“BOFA”) AND MAY NOT BE USED WITHOUT BOFA'S PRIOR WRITTEN APPROVAL. ICE DATA, ITS AFFILIATES AND THEIR RESPECTIVE THIRD PARTY SUPPLIERS DISCLAIM ANY AND ALL WARRANTIES AND REPRESENTATIONS, EXPRESS AND/OR IMPLIED, INCLUDING ANY WARRANTIES OF MERCHANTABILITY
132
INDEX DESCRIPTIONS (continued)
OR FITNESS FOR A PARTICULAR PURPOSE OR USE, INCLUDING THE INDICES, INDEX DATA AND ANY DATA INCLUDED IN, RELATED TO, OR DERIVED THEREFROM. NEITHER ICE DATA, ITS AFFILIATES NOR THEIR RESPECTIVE THIRD PARTY SUPPLIERS SHALL BE SUBJECT TO ANY DAMAGES OR LIABILITY WITH RESPECT TO THE ADEQUACY, ACCURACY, TIMELINESS OR COMPLETENESS OF THE INDICES OR THE INDEX DATA OR ANY COMPONENT THEREOF, AND THE INDICES AND INDEX DATA AND ALL COMPONENTS THEREOF ARE PROVIDED ON AN “AS IS” BASIS AND YOUR USE IS AT YOUR OWN RISK. ICE DATA, ITS AFFILIATES AND THEIR RESPECTIVE THIRD PARTY SUPPLIERS DO NOT SPONSOR, ENDORSE, OR RECOMMEND THE INVESTMENT ADVISER, ITS AFFILIATES, OR ANY OF THEIR PRODUCTS OR SERVICES.
Certain information contained herein (the “Information”) is sourced from/copyright of MSCI Inc., MSCI ESG Research LLC, or their affiliates (“MSCI”), or information providers (together, the “MSCI Parties”) and may have been used to calculate scores, signals, or other indicators. The Information is for internal use only and may not be reproduced or disseminated in whole or part without prior written permission. The Information may not be used for, nor does it constitute, an offer to buy or sell, or a promotion or recommendation of, any security, financial instrument or product, trading strategy, or index, nor should it be taken as an indication or guarantee of any future performance. Some funds may be based on or linked to MSCI indexes, and MSCI may be compensated based on the fund’s assets under management or other measures. MSCI has established an information barrier between index research and certain Information. None of the Information in and of itself can be used to determine which securities to buy or sell or when to buy or sell them. The Information is provided “as is” and the user assumes the entire risk of any use it may make or permit to be made of the Information. No MSCI Party warrants or guarantees the originality, accuracy and/or completeness of the Information and each expressly disclaims all express or implied warranties. No MSCI Party shall have any liability for any errors or omissions in connection with any Information herein, or any liability for any direct, indirect, special, punitive, consequential or any other damages (including lost profits) even if notified of the possibility of such damages.
The S&P 500® Index and associated data are a product of S&P Dow Jones Indices LLC, its affiliates and/or their licensors and have been licensed for use by Voya Services Company and certain affiliates. © 2026 S&P Dow Jones Indices LLC, its affiliates and/or their licensors. All rights reserved. Redistribution or reproduction in whole or in part are prohibited without written permission of S&P Dow Jones Indices LLC. For more information on any of S&P Dow Jones Indices LLC’s indices please visit www.spdji.com. S&P® is a registered trademark of Standard & Poor’s Financial Services LLC (“SPFS”) and Dow Jones® is a registered trademark of Dow Jones Trademark Holdings LLC (“Dow Jones”). Neither S&P Dow Jones Indices LLC, SPFS, Dow Jones, their affiliates nor their licensors (“S&P DJI”) make any representation or warranty, express or implied, as to the ability of any index to accurately represent the asset class or market sector that it purports to represent and S&P DJI shall have no liability for any errors, omissions, or interruptions of any index or the data included therein.
The S&P 500® Index is a product of S&P Dow Jones Indices LLC ( “ SPDJI ” ), and has been licensed for use by Voya Services Company and certain affiliates (“Voya”). S&P® and S&P 500 ® are trademarks of Standard & Poor’s Financial Services LLC (“S&P”); Dow Jones® is a registered trademark of Dow Jones Trademark Holdings LLC (“Dow Jones”); and these trademarks have been licensed for use by SPDJI and sublicensed for certain purposes by Voya. Voya’s investment products (the “Product”) based in whole or in part on the S&P 500® Index are not sponsored, endorsed, sold or promoted by SPDJI, S&P, Dow Jones or any of their respective affiliates (collectively, “S&P Dow Jones Indices”). S&P Dow Jones Indices makes no representation or warranty, express or implied, to the owners of the Product or any member of the public regarding the advisability of investing in the Product or purchasing securities generally or the ability of the S&P 500® Index to track general market performance. S&P Dow Jones Indices’ only relationship to Voya with respect to the Product is the licensing of the S&P 500® Index and certain trademarks, service marks and/or trade names of S&P Dow Jones Indices and/or its licensors. The S&P 500® Index is determined, composed and calculated by S&P Dow Jones Indices without regard to Voya or the Product. S&P Dow Jones Indices have no obligation to take the needs of Voya or the owners of the Product into consideration in determining, composing or calculating the S&P 500® Index. S&P Dow Jones Indices are not responsible for and have not participated in the determination of the prices, and amount of the Product or the timing of the issuance or sale of the Product or in the determination or calculation of the equation by which the Product is to be converted into cash, surrendered or redeemed, as the case may be. S&P Dow Jones Indices have no obligation or liability in connection with the administration or marketing of the Product. There is no assurance that investment products based on the S&P 500® Index will accurately track index performance or provide positive investment returns. S&P Dow Jones Indices LLC is not an investment advisor. Inclusion of a security within an index is not a recommendation by S&P Dow Jones Indices to buy, sell, or hold such security, nor is it considered to be investment advice.
133
INDEX DESCRIPTIONS (continued)
S&P DOW JONES INDICES DOES NOT GUARANTEE THE ADEQUACY, ACCURACY, TIMELINESS AND/OR THE COMPLETENESS OF THE S&P 500® INDEX OR ANY DATA RELATED THERETO OR ANY COMMUNICATION, INCLUDING BUT NOT LIMITED TO, ORAL OR WRITTEN COMMUNICATION (INCLUDING ELECTRONIC COMMUNICATIONS) WITH RESPECT THERETO. S&P DOW JONES INDICES SHALL NOT BE SUBJECT TO ANY DAMAGES OR LIABILITY FOR ANY ERRORS, OMISSIONS, OR DELAYS THEREIN. S&P DOW JONES INDICES MAKE NO EXPRESS OR IMPLIED WARRANTIES, AND EXPRESSLY DISCLAIMS ALL WARRANTIES, OF MERCHANTABILITY OR FITNESS FOR A PARTICULAR PURPOSE OR USE OR AS TO RESULTS TO BE OBTAINED BY VOYA, OWNERS OF THE PRODUCT, OR ANY OTHER PERSON OR ENTITY FROM THE USE OF THE S&P 500® INDEX OR WITH RESPECT TO ANY DATA RELATED THERETO. WITHOUT LIMITING ANY OF THE FOREGOING, IN NO EVENT WHATSOEVER SHALL S&P DOW JONES INDICES BE LIABLE FOR ANY INDIRECT, SPECIAL, INCIDENTAL, PUNITIVE, OR CONSEQUENTIAL DAMAGES INCLUDING BUT NOT LIMITED TO, LOSS OF PROFITS, TRADING LOSSES, LOST TIME OR GOODWILL, EVEN IF THEY HAVE BEEN ADVISED OF THE POSSIBILITY OF SUCH DAMAGES, WHETHER IN CONTRACT, TORT, STRICT LIABILITY, OR OTHERWISE. THERE ARE NO THIRD PARTY BENEFICIARIES OF ANY AGREEMENTS OR ARRANGEMENTS BETWEEN S&P DOW JONES INDICES AND VOYA, OTHER THAN THE LICENSORS OF S&P DOW JONES INDICES.
134
FINANCIAL HIGHLIGHTS
The financial highlights table is intended to help you understand a Portfolio's financial performance for the periods shown. Certain information reflects the financial results for a single share. The total returns in the table represent the rate of return that an investor would have earned or lost on an investment in a Portfolio (assuming reinvestment of all dividends and/or distributions). The information has been audited by Ernst & Young LLP, whose report, along with a Portfolio’s financial statements, is included in the Portfolio’s Form N-CSR, which is available upon request.
135
FINANCIAL HIGHLIGHTS (continued)
Selected data for a share of capital stock outstanding throughout each year or period.
|
|
|
Income (loss)
from
investment
operations |
|
Less distributions |
|
|
|
|
Ratios to average net assets |
Supplemental
data | |||||||
|
|
Net asset value, beginning
of year or period |
Net investment income (loss) |
Net realized and unrealized
gain (loss) |
Total from investment
operations |
From net investment income |
From net realized gains |
From return of capital |
Total distributions |
Payment from affiliate |
Net asset value, end of year or period |
Total Return(1) |
Expenses before
reductions/additions(2)(3)(4) |
Expenses net of fee waivers
and/or recoupments, if any(2)(3)(4) |
Expenses net of all
reductions/additions(2)(3)(4) |
Net investment income
(loss)(2)(3) |
Net assets, end of year or period |
Portfolio turnover rate |
|
Year or Period ended |
($) |
($) |
($) |
($) |
($) |
($) |
($) |
($) |
($) |
($) |
(%) |
(%) |
(%) |
(%) |
(%) |
($000's) |
(%) |
|
Voya Government Liquid Assets Portfolio | |||||||||||||||||
|
Class I |
|
|
|
|
|
|
|
|
|
|
|
|
|
|
|
|
|
|
12-31-25 |
1.00 |
0.04• |
— |
0.04 |
0.04 |
0.00* |
— |
0.04 |
— |
1.00 |
4.15 |
0.28 |
0.28 |
0.28 |
4.01 |
154,165 |
— |
|
12-31-24 |
1.00 |
0.05•
|
— |
0.05 |
0.05 |
0.00* |
— |
0.05 |
— |
1.00 |
5.03 |
0.28 |
0.28 |
0.28 |
4.91 |
82,795 |
— |
|
12-31-23 |
1.00 |
0.05•
|
0.00* |
0.05 |
0.05 |
— |
— |
0.05 |
— |
1.00 |
4.93 |
0.28 |
0.28 |
0.28 |
4.82 |
75,141 |
— |
|
12-31-22 |
1.00 |
0.02•
|
0.00* |
0.02 |
0.02 |
— |
— |
0.02 |
— |
1.00 |
1.51 |
0.28 |
0.24 |
0.24 |
1.65 |
77,571 |
— |
|
12-31-21 |
1.00 |
—•
|
0.00* |
0.00* |
— |
0.00* |
— |
0.00* |
— |
1.00 |
0.03 |
0.28 |
0.05 |
0.05 |
0.00* |
50,337 |
— |
|
Class S |
|
|
|
|
|
|
|
|
|
|
|
|
|
|
|
|
|
|
12-31-25 |
1.00 |
0.04• |
— |
0.04 |
0.04 |
0.00* |
— |
0.04 |
— |
1.00 |
3.90 |
0.53 |
0.53 |
0.53 |
3.76 |
239,614 |
— |
|
12-31-24 |
1.00 |
0.05•
|
— |
0.05 |
0.05 |
0.00* |
— |
0.05 |
— |
1.00 |
4.77 |
0.53 |
0.53 |
0.53 |
4.66 |
251,573 |
— |
|
12-31-23 |
1.00 |
0.05•
|
0.00* |
0.05 |
0.05 |
— |
— |
0.05 |
— |
1.00 |
4.68 |
0.53 |
0.53 |
0.53 |
4.56 |
280,488 |
— |
|
12-31-22 |
1.00 |
0.01•
|
0.00* |
0.01 |
0.01 |
— |
— |
0.01 |
— |
1.00 |
1.34 |
0.53 |
0.40 |
0.40 |
1.34 |
322,096 |
— |
|
12-31-21 |
1.00 |
—•
|
0.00* |
0.00* |
— |
0.00* |
— |
0.00* |
— |
1.00 |
0.03 |
0.53 |
0.05 |
0.05 |
0.00* |
320,548 |
— |
|
Class S2 |
|
|
|
|
|
|
|
|
|
|
|
|
|
|
|
|
|
|
12-31-25 |
1.00 |
0.04• |
— |
0.04 |
0.04 |
0.00* |
— |
0.04 |
— |
1.00 |
3.74 |
0.68 |
0.68 |
0.68 |
3.60 |
849,548 |
— |
|
12-31-24 |
1.00 |
0.05•
|
— |
0.05 |
0.05 |
0.00* |
— |
0.05 |
— |
1.00 |
4.61 |
0.68 |
0.68 |
0.68 |
4.50 |
775,154 |
— |
|
12-31-23 |
1.00 |
0.04•
|
0.00* |
0.04 |
0.04 |
— |
— |
0.04 |
— |
1.00 |
4.52 |
0.68 |
0.68 |
0.68 |
4.44 |
698,867 |
— |
|
12-31-22 |
1.00 |
0.01•
|
0.00* |
0.01 |
0.01 |
— |
— |
0.01 |
— |
1.00 |
1.24 |
0.68 |
0.52 |
0.52 |
1.37 |
609,604 |
— |
|
12-31-21 |
1.00 |
—•
|
0.00* |
0.00* |
— |
0.00* |
— |
0.00* |
— |
1.00 |
0.03 |
0.68 |
0.05 |
0.05 |
0.00* |
437,744 |
— |
|
Voya High Yield Portfolio | |||||||||||||||||
|
Class ADV |
|
|
|
|
|
|
|
|
|
|
|
|
|
|
|
|
|
|
12-31-25 |
8.70 |
0.49• |
0.19 |
0.68 |
0.49 |
— |
0.01 |
0.50 |
— |
8.88 |
8.03 |
1.10 |
1.08 |
1.08 |
5.57 |
55,207 |
147 |
|
12-31-24 |
8.65 |
0.53•
|
0.05 |
0.58 |
0.53 |
— |
— |
0.53 |
— |
8.70 |
6.90 |
1.10 |
1.08 |
1.08 |
6.10 |
57,509 |
88 |
|
12-31-23 |
8.23 |
0.50•
|
0.43 |
0.93 |
0.51 |
— |
— |
0.51 |
— |
8.65 |
11.63 |
1.09 |
1.08 |
1.08 |
5.91 |
61,268 |
47 |
|
12-31-22 |
9.94 |
0.46•
|
(1.72) |
(1.26) |
0.45 |
— |
— |
0.45 |
— |
8.23 |
(12.83) |
1.10 |
1.08 |
1.08 |
5.22 |
61,172 |
21 |
|
12-31-21 |
9.96 |
0.45•
|
0.01 |
0.46 |
0.46 |
— |
0.02 |
0.48 |
— |
9.94 |
4.65 |
1.10 |
1.08 |
1.08 |
4.52 |
79,216 |
63 |
|
Class I |
|
|
|
|
|
|
|
|
|
|
|
|
|
|
|
|
|
|
12-31-25 |
8.70 |
0.54• |
0.20 |
0.74 |
0.54 |
— |
0.01 |
0.55 |
— |
8.89 |
8.80 |
0.50 |
0.48 |
0.48 |
6.17 |
238,586 |
147 |
|
12-31-24 |
8.66 |
0.58•
|
0.04 |
0.62 |
0.58 |
— |
— |
0.58 |
— |
8.70 |
7.42 |
0.50 |
0.48 |
0.48 |
6.70 |
233,489 |
88 |
|
12-31-23 |
8.24 |
0.55•
|
0.43 |
0.98 |
0.56 |
— |
— |
0.56 |
— |
8.66 |
12.28 |
0.49 |
0.48 |
0.48 |
6.51 |
165,274 |
47 |
|
12-31-22 |
9.95 |
0.51•
|
(1.72) |
(1.21) |
0.50 |
— |
— |
0.50 |
— |
8.24 |
(12.28) |
0.50 |
0.48 |
0.48 |
5.83 |
152,175 |
21 |
|
12-31-21 |
9.97 |
0.51•
|
0.01 |
0.52 |
0.52 |
— |
0.02 |
0.54 |
— |
9.95 |
5.28 |
0.50 |
0.48 |
0.48 |
5.12 |
189,224 |
63 |
|
Class S |
|
|
|
|
|
|
|
|
|
|
|
|
|
|
|
|
|
|
12-31-25 |
8.70 |
0.52• |
0.19 |
0.71 |
0.52 |
— |
0.01 |
0.53 |
— |
8.88 |
8.41 |
0.75 |
0.73 |
0.73 |
5.93 |
22,628 |
147 |
|
12-31-24 |
8.65 |
0.56•
|
0.05 |
0.61 |
0.56 |
— |
— |
0.56 |
— |
8.70 |
7.28 |
0.75 |
0.73 |
0.73 |
6.45 |
25,957 |
88 |
|
12-31-23 |
8.23 |
0.52•
|
0.44 |
0.96 |
0.54 |
— |
— |
0.54 |
— |
8.65 |
12.01 |
0.74 |
0.73 |
0.73 |
6.26 |
174,158 |
47 |
|
12-31-22 |
9.94 |
0.49•
|
(1.72) |
(1.23) |
0.48 |
— |
— |
0.48 |
— |
8.23 |
(12.52) |
0.75 |
0.73 |
0.73 |
5.56 |
179,355 |
21 |
|
12-31-21 |
9.96 |
0.48•
|
0.01 |
0.49 |
0.49 |
— |
0.02 |
0.51 |
— |
9.94 |
5.01 |
0.75 |
0.73 |
0.73 |
4.87 |
244,800 |
63 |
See Accompanying Notes to Financial Highlights
136
FINANCIAL HIGHLIGHTS (continued)
Selected data for a share of capital stock outstanding throughout each year or period.
|
|
|
Income (loss)
from
investment
operations |
|
Less distributions |
|
|
|
|
Ratios to average net assets |
Supplemental
data | |||||||
|
|
Net asset value, beginning
of year or period |
Net investment income (loss) |
Net realized and unrealized
gain (loss) |
Total from investment
operations |
From net investment income |
From net realized gains |
From return of capital |
Total distributions |
Payment from affiliate |
Net asset value, end of year or period |
Total Return(1) |
Expenses before
reductions/additions(2)(3)(4) |
Expenses net of fee waivers
and/or recoupments, if any(2)(3)(4) |
Expenses net of all
reductions/additions(2)(3)(4) |
Net investment income
(loss)(2)(3) |
Net assets, end of year or period |
Portfolio turnover rate |
|
Year or Period ended |
($) |
($) |
($) |
($) |
($) |
($) |
($) |
($) |
($) |
($) |
(%) |
(%) |
(%) |
(%) |
(%) |
($000's) |
(%) |
|
Class S2 |
|
|
|
|
|
|
|
|
|
|
|
|
|
|
|
|
|
|
12-31-25 |
8.71 |
0.51• |
0.19 |
0.70 |
0.51 |
— |
0.01 |
0.52 |
— |
8.89 |
8.25 |
0.90 |
0.88 |
0.88 |
5.76 |
1,541 |
147 |
|
12-31-24 |
8.66 |
0.55•
|
0.05 |
0.60 |
0.55 |
— |
— |
0.55 |
— |
8.71 |
7.12 |
0.90 |
0.88 |
0.88 |
6.29 |
1,414 |
88 |
|
12-31-23 |
8.24 |
0.51•
|
0.43 |
0.94 |
0.52 |
— |
— |
0.52 |
— |
8.66 |
11.83 |
0.89 |
0.88 |
0.88 |
6.10 |
1,267 |
47 |
|
12-31-22 |
9.95 |
0.48•
|
(1.72) |
(1.24) |
0.47 |
— |
— |
0.47 |
— |
8.24 |
(12.63) |
0.90 |
0.88 |
0.88 |
5.34 |
1,407 |
21 |
|
12-31-21 |
9.97 |
0.47•
|
0.01 |
0.48 |
0.48 |
— |
0.02 |
0.50 |
— |
9.95 |
4.86 |
0.90 |
0.88 |
0.88 |
4.72 |
2,688 |
63 |
|
Voya Large Cap Growth Portfolio | |||||||||||||||||
|
Class ADV |
|
|
|
|
|
|
|
|
|
|
|
|
|
|
|
|
|
|
12-31-25 |
14.13 |
(0.36)• |
2.25 |
1.89 |
— |
2.09 |
— |
2.09 |
— |
13.93 |
14.64 |
1.31 |
1.25 |
1.25 |
(0.66) |
698,772 |
53 |
|
12-31-24 |
10.54 |
(0.09)•
|
3.68 |
3.59 |
— |
— |
— |
— |
— |
14.13 |
34.06 |
1.31 |
1.27 |
1.27 |
(0.73) |
395,905 |
42 |
|
12-31-23 |
7.69 |
(0.05)•
|
2.90 |
2.85 |
— |
— |
— |
— |
— |
10.54 |
37.06 |
1.31 |
1.27 |
1.27 |
(0.56) |
1,497,865 |
57 |
|
12-31-22 |
19.43 |
(0.07)•
|
(5.77) |
(5.84) |
— |
5.90 |
— |
5.90 |
— |
7.69 |
(30.97) |
1.31 |
1.27 |
1.27 |
(0.58) |
1,263,757 |
47 |
|
12-31-21 |
20.45 |
(0.14)•
|
3.76 |
3.62 |
— |
4.64 |
— |
4.64 |
— |
19.43 |
18.89 |
1.30 |
1.27 |
1.27 |
(0.68) |
2,085,856 |
72 |
|
Class I |
|
|
|
|
|
|
|
|
|
|
|
|
|
|
|
|
|
|
12-31-25 |
18.36 |
(0.15)• |
2.78 |
2.63 |
— |
2.09 |
— |
2.09 |
— |
18.90 |
15.33 |
0.73 |
0.67 |
0.67 |
(0.20) |
2,558,374 |
53 |
|
12-31-24 |
13.62 |
(0.01)•
|
4.75 |
4.74 |
— |
— |
— |
— |
— |
18.36 |
34.80 |
0.71 |
0.67 |
0.67 |
(0.09) |
1,518,131 |
42 |
|
12-31-23 |
9.88 |
0.01•
|
3.73 |
3.74 |
— |
— |
— |
— |
— |
13.62 |
37.86 |
0.71 |
0.67 |
0.67 |
0.05 |
1,260,097 |
57 |
|
12-31-22 |
22.48 |
0.00*•
|
(6.70) |
(6.70) |
— |
5.90 |
— |
5.90 |
— |
9.88 |
(30.50) |
0.71 |
0.67 |
0.67 |
0.02 |
1,251,871 |
47 |
|
12-31-21 |
22.90 |
(0.02)•
|
4.24 |
4.22 |
— |
4.64 |
— |
4.64 |
— |
22.48 |
19.55 |
0.70 |
0.67 |
0.67 |
(0.07) |
1,937,889 |
72 |
|
Class R6 |
|
|
|
|
|
|
|
|
|
|
|
|
|
|
|
|
|
|
12-31-25 |
18.39 |
(0.12)• |
2.75 |
2.63 |
— |
2.09 |
— |
2.09 |
— |
18.93 |
15.30 |
0.68 |
0.67 |
0.67 |
(0.12) |
72,918 |
53 |
|
12-31-24 |
13.64 |
(0.01)•
|
4.76 |
4.75 |
— |
— |
— |
— |
— |
18.39 |
34.82 |
0.68 |
0.67 |
0.67 |
(0.09) |
67,229 |
42 |
|
12-31-23 |
9.90 |
0.01•
|
3.73 |
3.74 |
— |
— |
— |
— |
— |
13.64 |
37.78 |
0.67 |
0.67 |
0.67 |
0.05 |
66,206 |
57 |
|
12-31-22 |
22.50 |
0.00* |
(6.70) |
(6.70) |
— |
5.90 |
— |
5.90 |
— |
9.90 |
(30.47) |
0.68 |
0.67 |
0.67 |
0.02 |
53,900 |
47 |
|
12-31-21 |
22.91 |
(0.02)•
|
4.25 |
4.23 |
— |
4.64 |
— |
4.64 |
— |
22.50 |
19.58 |
0.67 |
0.67 |
0.67 |
(0.08) |
95,588 |
72 |
|
Class S |
|
|
|
|
|
|
|
|
|
|
|
|
|
|
|
|
|
|
12-31-25 |
16.91 |
(0.34)• |
2.71 |
2.37 |
— |
2.09 |
— |
2.09 |
— |
17.19 |
15.09 |
0.98 |
0.92 |
0.92 |
(0.41) |
325,185 |
53 |
|
12-31-24 |
12.57 |
(0.06)•
|
4.40 |
4.34 |
— |
— |
— |
— |
— |
16.91 |
34.53 |
0.96 |
0.92 |
0.92 |
(0.38) |
304,779 |
42 |
|
12-31-23 |
9.15 |
(0.02)•
|
3.44 |
3.42 |
— |
— |
— |
— |
— |
12.57 |
37.38 |
0.96 |
0.92 |
0.92 |
(0.21) |
1,219,524 |
57 |
|
12-31-22 |
21.47 |
(0.03)•
|
(6.39) |
(6.42) |
— |
5.90 |
— |
5.90 |
— |
9.15 |
(30.66) |
0.96 |
0.92 |
0.92 |
(0.23) |
1,066,004 |
47 |
|
12-31-21 |
22.10 |
(0.07)•
|
4.08 |
4.01 |
— |
4.64 |
— |
4.64 |
— |
21.47 |
19.28 |
0.95 |
0.92 |
0.92 |
(0.33) |
1,787,956 |
72 |
|
Class S2 |
|
|
|
|
|
|
|
|
|
|
|
|
|
|
|
|
|
|
12-31-25 |
16.43 |
(0.36)• |
2.61 |
2.25 |
— |
2.09 |
— |
2.09 |
— |
16.59 |
14.79 |
1.13 |
1.07 |
1.07 |
(0.45) |
50,509 |
53 |
|
12-31-24 |
12.23 |
(0.07)•
|
4.27 |
4.20 |
— |
— |
— |
— |
— |
16.43 |
34.34 |
1.11 |
1.07 |
1.07 |
(0.50) |
43,261 |
42 |
|
12-31-23 |
8.91 |
(0.04)•
|
3.36 |
3.32 |
— |
— |
— |
— |
— |
12.23 |
37.26 |
1.11 |
1.07 |
1.07 |
(0.36) |
44,374 |
57 |
|
12-31-22 |
21.16 |
(0.05)•
|
(6.30) |
(6.35) |
— |
5.90 |
— |
5.90 |
— |
8.91 |
(30.80) |
1.11 |
1.07 |
1.07 |
(0.38) |
36,077 |
47 |
|
12-31-21 |
21.87 |
(0.10)•
|
4.03 |
3.93 |
— |
4.64 |
— |
4.64 |
— |
21.16 |
19.10 |
1.10 |
1.07 |
1.07 |
(0.48) |
64,403 |
72 |
|
Voya Limited Maturity Bond Portfolio | |||||||||||||||||
See Accompanying Notes to Financial Highlights
137
FINANCIAL HIGHLIGHTS (continued)
Selected data for a share of capital stock outstanding throughout each year or period.
|
|
|
Income (loss)
from
investment
operations |
|
Less distributions |
|
|
|
|
Ratios to average net assets |
Supplemental
data | |||||||
|
|
Net asset value, beginning
of year or period |
Net investment income (loss) |
Net realized and unrealized
gain (loss) |
Total from investment
operations |
From net investment income |
From net realized gains |
From return of capital |
Total distributions |
Payment from affiliate |
Net asset value, end of year or period |
Total Return(1) |
Expenses before
reductions/additions(2)(3)(4) |
Expenses net of fee waivers
and/or recoupments, if any(2)(3)(4) |
Expenses net of all
reductions/additions(2)(3)(4) |
Net investment income
(loss)(2)(3) |
Net assets, end of year or period |
Portfolio turnover rate |
|
Year or Period ended |
($) |
($) |
($) |
($) |
($) |
($) |
($) |
($) |
($) |
($) |
(%) |
(%) |
(%) |
(%) |
(%) |
($000's) |
(%) |
|
Class ADV |
|
|
|
|
|
|
|
|
|
|
|
|
|
|
|
|
|
|
12-31-25 |
9.30 |
0.37• |
0.09 |
0.46 |
0.36 |
— |
— |
0.36 |
— |
9.40 |
5.08 |
0.88 |
0.88 |
0.88 |
3.94 |
10,096 |
196 |
|
12-31-24 |
9.29 |
0.36•
|
0.05 |
0.41 |
0.40 |
— |
— |
0.40 |
— |
9.30 |
4.52 |
0.88 |
0.88 |
0.88 |
3.91 |
10,033 |
298 |
|
12-31-23 |
9.23 |
0.31•
|
0.07 |
0.38 |
0.32 |
— |
— |
0.32 |
— |
9.29 |
4.17 |
0.88 |
0.88 |
0.88 |
3.38 |
11,268 |
281 |
|
12-31-22 |
9.87 |
0.14•
|
(0.66) |
(0.52) |
0.12 |
— |
— |
0.12 |
— |
9.23 |
(5.26) |
0.88 |
0.88 |
0.88 |
1.53 |
13,671 |
306 |
|
12-31-21 |
10.03 |
0.05•
|
(0.10) |
(0.05) |
0.11 |
— |
— |
0.11 |
— |
9.87 |
(0.55) |
0.88 |
0.88 |
0.88 |
0.47 |
14,958 |
253 |
|
Class I |
|
|
|
|
|
|
|
|
|
|
|
|
|
|
|
|
|
|
12-31-25 |
9.49 |
0.43• |
0.10 |
0.53 |
0.43 |
— |
— |
0.43 |
— |
9.59 |
5.69 |
0.28 |
0.28 |
0.28 |
4.53 |
263,276 |
196 |
|
12-31-24 |
9.48 |
0.43•
|
0.05 |
0.48 |
0.47 |
— |
— |
0.47 |
— |
9.49 |
5.14 |
0.28 |
0.28 |
0.28 |
4.51 |
235,923 |
298 |
|
12-31-23 |
9.42 |
0.38•
|
0.06 |
0.44 |
0.38 |
— |
— |
0.38 |
— |
9.48 |
4.79 |
0.28 |
0.28 |
0.28 |
3.99 |
273,180 |
281 |
|
12-31-22 |
10.07 |
0.21•
|
(0.68) |
(0.47) |
0.18 |
— |
— |
0.18 |
— |
9.42 |
(4.66) |
0.28 |
0.28 |
0.28 |
2.16 |
301,980 |
306 |
|
12-31-21 |
10.23 |
0.11•
|
(0.10) |
0.01 |
0.17 |
— |
— |
0.17 |
— |
10.07 |
0.08 |
0.28 |
0.28 |
0.28 |
1.06 |
329,913 |
253 |
|
Class S |
|
|
|
|
|
|
|
|
|
|
|
|
|
|
|
|
|
|
12-31-25 |
9.56 |
0.41• |
0.10 |
0.51 |
0.41 |
— |
— |
0.41 |
— |
9.66 |
5.42 |
0.53 |
0.53 |
0.53 |
4.30 |
11,054 |
196 |
|
12-31-24 |
9.55 |
0.41•
|
0.05 |
0.46 |
0.45 |
— |
— |
0.45 |
— |
9.56 |
4.88 |
0.53 |
0.53 |
0.53 |
4.26 |
51,340 |
298 |
|
12-31-23 |
9.49 |
0.36•
|
0.06 |
0.42 |
0.36 |
— |
— |
0.36 |
— |
9.55 |
4.52 |
0.53 |
0.53 |
0.53 |
3.75 |
58,787 |
281 |
|
12-31-22 |
10.15 |
0.18•
|
(0.68) |
(0.50) |
0.16 |
— |
— |
0.16 |
— |
9.49 |
(4.94) |
0.53 |
0.53 |
0.53 |
1.87 |
57,412 |
306 |
|
12-31-21 |
10.31 |
0.08•
|
(0.10) |
(0.02) |
0.14 |
— |
— |
0.14 |
— |
10.15 |
(0.16) |
0.53 |
0.53 |
0.53 |
0.82 |
71,037 |
253 |
|
Voya U.S. Stock Index Portfolio | |||||||||||||||||
|
Class ADV |
|
|
|
|
|
|
|
|
|
|
|
|
|
|
|
|
|
|
12-31-25 |
19.04 |
0.09• |
2.91 |
3.00 |
0.21 |
2.23 |
— |
2.44 |
— |
19.60 |
16.91 |
0.80 |
0.80 |
0.80 |
0.49 |
95,878 |
7 |
|
12-31-24 |
16.82 |
0.11•
|
3.87 |
3.98 |
0.16 |
1.60 |
— |
1.76 |
— |
19.04 |
24.06 |
0.80 |
0.80 |
0.80 |
0.61 |
93,832 |
2 |
|
12-31-23 |
15.01 |
0.14•
|
3.54 |
3.68 |
0.17 |
1.70 |
— |
1.87 |
— |
16.82 |
25.25 |
0.80 |
0.80 |
0.80 |
0.89 |
83,268 |
6 |
|
12-31-22 |
20.92 |
0.14•
|
(4.09) |
(3.95) |
0.14 |
1.82 |
— |
1.96 |
— |
15.01 |
(18.78) |
0.80 |
0.80 |
0.80 |
0.82 |
73,855 |
8 |
|
12-31-21 |
18.21 |
0.12•
|
4.72 |
4.84 |
0.11 |
2.02 |
— |
2.13 |
— |
20.92 |
27.66 |
0.80 |
0.80 |
0.80 |
0.61 |
99,373 |
3 |
|
Class I |
|
|
|
|
|
|
|
|
|
|
|
|
|
|
|
|
|
|
12-31-25 |
20.27 |
0.21• |
3.12 |
3.33 |
0.31 |
2.23 |
— |
2.54 |
— |
21.06 |
17.53 |
0.27 |
0.27 |
0.27 |
1.04 |
2,319,525 |
7 |
|
12-31-24 |
17.80 |
0.22•
|
4.10 |
4.32 |
0.25 |
1.60 |
— |
1.85 |
— |
20.27 |
24.68 |
0.27 |
0.27 |
0.27 |
1.14 |
3,761,609 |
2 |
|
12-31-23 |
15.78 |
0.24•
|
3.74 |
3.98 |
0.26 |
1.70 |
— |
1.96 |
— |
17.80 |
25.93 |
0.27 |
0.27 |
0.27 |
1.42 |
3,746,966 |
6 |
|
12-31-22 |
21.87 |
0.24•
|
(4.28) |
(4.04) |
0.23 |
1.82 |
— |
2.05 |
— |
15.78 |
(18.35) |
0.27 |
0.27 |
0.27 |
1.35 |
3,602,730 |
8 |
|
12-31-21 |
18.94 |
0.23•
|
4.95 |
5.18 |
0.23 |
2.02 |
— |
2.25 |
— |
21.87 |
28.37 |
0.27 |
0.27 |
0.27 |
1.14 |
4,525,779 |
3 |
|
Class S |
|
|
|
|
|
|
|
|
|
|
|
|
|
|
|
|
|
|
12-31-25 |
19.95 |
0.16• |
3.05 |
3.21 |
0.25 |
2.23 |
— |
2.48 |
— |
20.68 |
17.23 |
0.52 |
0.51 |
0.51 |
0.78 |
38,502 |
7 |
|
12-31-24 |
17.54 |
0.17•
|
4.04 |
4.21 |
0.20 |
1.60 |
— |
1.80 |
— |
19.95 |
24.43 |
0.52 |
0.51 |
0.51 |
0.91 |
49,386 |
2 |
|
12-31-23 |
15.57 |
0.20•
|
3.67 |
3.87 |
0.20 |
1.70 |
— |
1.90 |
— |
17.54 |
25.56 |
0.52 |
0.51 |
0.51 |
1.18 |
260,411 |
6 |
|
12-31-22 |
21.60 |
0.20•
|
(4.22) |
(4.02) |
0.19 |
1.82 |
— |
2.01 |
— |
15.57 |
(18.50) |
0.52 |
0.51 |
0.51 |
1.11 |
224,160 |
8 |
|
12-31-21 |
18.74 |
0.18•
|
4.88 |
5.06 |
0.18 |
2.02 |
— |
2.20 |
— |
21.60 |
28.02 |
0.52 |
0.51 |
0.51 |
0.90 |
303,248 |
3 |
See Accompanying Notes to Financial Highlights
138
FINANCIAL HIGHLIGHTS (continued)
Selected data for a share of capital stock outstanding throughout each year or period.
|
|
|
Income (loss)
from
investment
operations |
|
Less distributions |
|
|
|
|
Ratios to average net assets |
Supplemental
data | |||||||
|
|
Net asset value, beginning
of year or period |
Net investment income (loss) |
Net realized and unrealized
gain (loss) |
Total from investment
operations |
From net investment income |
From net realized gains |
From return of capital |
Total distributions |
Payment from affiliate |
Net asset value, end of year or period |
Total Return(1) |
Expenses before
reductions/additions(2)(3)(4) |
Expenses net of fee waivers
and/or recoupments, if any(2)(3)(4) |
Expenses net of all
reductions/additions(2)(3)(4) |
Net investment income
(loss)(2)(3) |
Net assets, end of year or period |
Portfolio turnover rate |
|
Year or Period ended |
($) |
($) |
($) |
($) |
($) |
($) |
($) |
($) |
($) |
($) |
(%) |
(%) |
(%) |
(%) |
(%) |
($000's) |
(%) |
|
Class S2 |
|
|
|
|
|
|
|
|
|
|
|
|
|
|
|
|
|
|
12-31-25 |
19.47 |
0.12• |
2.98 |
3.10 |
0.23 |
2.23 |
— |
2.46 |
— |
20.11 |
17.08 |
0.67 |
0.67 |
0.67 |
0.62 |
197,858 |
7 |
|
12-31-24 |
17.17 |
0.14•
|
3.94 |
4.08 |
0.18 |
1.60 |
— |
1.78 |
— |
19.47 |
24.18 |
0.67 |
0.67 |
0.67 |
0.74 |
196,110 |
2 |
|
12-31-23 |
15.31 |
0.17•
|
3.61 |
3.78 |
0.22 |
1.70 |
— |
1.92 |
— |
17.17 |
25.38 |
0.67 |
0.67 |
0.67 |
1.02 |
173,092 |
6 |
|
12-31-22 |
21.28 |
0.17•
|
(4.16) |
(3.99) |
0.16 |
1.82 |
— |
1.98 |
— |
15.31 |
(18.63) |
0.67 |
0.67 |
0.67 |
0.95 |
142,580 |
8 |
|
12-31-21 |
18.49 |
0.15•
|
4.81 |
4.96 |
0.15 |
2.02 |
— |
2.17 |
— |
21.28 |
27.85 |
0.67 |
0.67 |
0.67 |
0.74 |
181,812 |
3 |
|
VY® CBRE Global Real Estate Portfolio | |||||||||||||||||
|
Class ADV |
|
|
|
|
|
|
|
|
|
|
|
|
|
|
|
|
|
|
12-31-25 |
9.70 |
0.18• |
0.41 |
0.59 |
0.24 |
— |
— |
0.24 |
— |
10.05 |
6.21 |
1.72 |
1.51 |
1.51 |
1.78 |
8,748 |
101 |
|
12-31-24 |
9.98 |
0.23•
|
(0.25) |
(0.02) |
0.26 |
— |
— |
0.26 |
— |
9.70 |
(0.24) |
1.66 |
1.49 |
1.49 |
2.30 |
9,270 |
80 |
|
12-31-23 |
9.13 |
0.19•
|
0.89 |
1.08 |
0.13 |
0.10 |
— |
0.23 |
— |
9.98 |
11.97 |
1.69 |
1.47 |
1.47 |
2.01 |
10,511 |
95 |
|
12-31-22 |
13.38 |
0.17•
|
(3.54) |
(3.37) |
0.29 |
0.59 |
— |
0.88 |
— |
9.13 |
(25.39) |
1.68 |
1.47 |
1.47 |
1.55 |
10,401 |
91 |
|
12-31-21 |
10.26 |
0.17•
|
3.24 |
3.41 |
0.29 |
— |
— |
0.29 |
— |
13.38 |
33.56 |
1.66 |
1.47 |
1.47 |
1.48 |
16,348 |
74 |
|
Class I |
|
|
|
|
|
|
|
|
|
|
|
|
|
|
|
|
|
|
12-31-25 |
10.00 |
0.24• |
0.43 |
0.67 |
0.31 |
— |
— |
0.31 |
— |
10.36 |
6.82 |
1.12 |
0.91 |
0.91 |
2.34 |
75,297 |
101 |
|
12-31-24 |
10.28 |
0.30•
|
(0.26) |
0.04 |
0.32 |
— |
— |
0.32 |
— |
10.00 |
0.38 |
1.06 |
0.89 |
0.89 |
2.91 |
105,217 |
80 |
|
12-31-23 |
9.41 |
0.25•
|
0.92 |
1.17 |
0.20 |
0.10 |
— |
0.30 |
— |
10.28 |
12.59 |
1.09 |
0.87 |
0.87 |
2.65 |
109,276 |
95 |
|
12-31-22 |
13.79 |
0.24•
|
(3.65) |
(3.41) |
0.38 |
0.59 |
— |
0.97 |
— |
9.41 |
(24.95) |
1.08 |
0.87 |
0.87 |
2.19 |
92,596 |
91 |
|
12-31-21 |
10.55 |
0.25•
|
3.35 |
3.60 |
0.36 |
— |
— |
0.36 |
— |
13.79 |
34.47 |
1.06 |
0.87 |
0.87 |
2.09 |
122,954 |
74 |
|
Class S |
|
|
|
|
|
|
|
|
|
|
|
|
|
|
|
|
|
|
12-31-25 |
9.96 |
0.22• |
0.42 |
0.64 |
0.28 |
— |
— |
0.28 |
— |
10.32 |
6.53 |
1.37 |
1.16 |
1.16 |
2.13 |
48,477 |
101 |
|
12-31-24 |
10.24 |
0.27•
|
(0.26) |
0.01 |
0.29 |
— |
— |
0.29 |
— |
9.96 |
0.12 |
1.31 |
1.14 |
1.14 |
2.65 |
53,675 |
80 |
|
12-31-23 |
9.37 |
0.22•
|
0.92 |
1.14 |
0.17 |
0.10 |
— |
0.27 |
— |
10.24 |
12.33 |
1.34 |
1.12 |
1.12 |
2.36 |
61,362 |
95 |
|
12-31-22 |
13.72 |
0.21•
|
(3.63) |
(3.42) |
0.34 |
0.59 |
— |
0.93 |
— |
9.37 |
(25.12) |
1.33 |
1.12 |
1.12 |
1.90 |
61,861 |
91 |
|
12-31-21 |
10.50 |
0.22•
|
3.33 |
3.55 |
0.33 |
— |
— |
0.33 |
— |
13.72 |
34.14 |
1.31 |
1.12 |
1.12 |
1.83 |
94,359 |
74 |
|
Class S2 |
|
|
|
|
|
|
|
|
|
|
|
|
|
|
|
|
|
|
12-31-25 |
10.07 |
0.20• |
0.43 |
0.63 |
0.25 |
— |
— |
0.25 |
— |
10.45 |
6.35 |
1.52 |
1.31 |
1.31 |
1.99 |
413 |
101 |
|
12-31-24 |
10.35 |
0.25•
|
(0.25) |
0.00* |
0.28 |
— |
— |
0.28 |
— |
10.07 |
(0.02) |
1.46 |
1.29 |
1.29 |
2.48 |
415 |
80 |
|
12-31-23 |
9.47 |
0.21•
|
0.92 |
1.13 |
0.15 |
0.10 |
— |
0.25 |
— |
10.35 |
12.11 |
1.49 |
1.27 |
1.27 |
2.21 |
670 |
95 |
|
12-31-22 |
13.86 |
0.20•
|
(3.67) |
(3.47) |
0.33 |
0.59 |
— |
0.92 |
— |
9.47 |
(25.25) |
1.48 |
1.27 |
1.27 |
1.77 |
712 |
91 |
|
12-31-21 |
10.61 |
0.21•
|
3.35 |
3.56 |
0.31 |
— |
— |
0.31 |
— |
13.86 |
33.90 |
1.46 |
1.27 |
1.27 |
1.70 |
1,016 |
74 |
|
VY® Columbia Real Estate Portfolio | |||||||||||||||||
|
Class ADV |
|
|
|
|
|
|
|
|
|
|
|
|
|
|
|
|
|
|
12-31-25 |
26.27 |
0.41• |
(0.51) |
(0.10) |
0.66 |
— |
— |
0.66 |
— |
25.51 |
(0.31) |
1.74 |
1.41 |
1.40 |
1.57 |
29,592 |
97 |
|
12-31-24 |
25.88 |
0.57•
|
0.44 |
1.01 |
0.62 |
— |
— |
0.62 |
— |
26.27 |
3.95 |
1.61 |
1.33 |
1.33 |
2.19 |
34,072 |
82 |
|
12-31-23 |
24.94 |
0.51•
|
2.79 |
3.30 |
0.59 |
1.77 |
— |
2.36 |
— |
25.88 |
13.62 |
1.63 |
1.28 |
1.28 |
2.07 |
38,058 |
73 |
|
12-31-22 |
43.39 |
0.46•
|
(11.98) |
(11.52) |
0.46 |
6.47 |
— |
6.93 |
— |
24.94 |
(27.40) |
1.61 |
1.28 |
1.28 |
1.44 |
38,305 |
62 |
|
12-31-21 |
29.09 |
0.37•
|
14.50 |
14.87 |
0.57 |
— |
— |
0.57 |
— |
43.39 |
51.46 |
1.62 |
1.28 |
1.28 |
1.02 |
63,318 |
67 |
See Accompanying Notes to Financial Highlights
139
FINANCIAL HIGHLIGHTS (continued)
Selected data for a share of capital stock outstanding throughout each year or period.
|
|
|
Income (loss)
from
investment
operations |
|
Less distributions |
|
|
|
|
Ratios to average net assets |
Supplemental
data | |||||||
|
|
Net asset value, beginning
of year or period |
Net investment income (loss) |
Net realized and unrealized
gain (loss) |
Total from investment
operations |
From net investment income |
From net realized gains |
From return of capital |
Total distributions |
Payment from affiliate |
Net asset value, end of year or period |
Total Return(1) |
Expenses before
reductions/additions(2)(3)(4) |
Expenses net of fee waivers
and/or recoupments, if any(2)(3)(4) |
Expenses net of all
reductions/additions(2)(3)(4) |
Net investment income
(loss)(2)(3) |
Net assets, end of year or period |
Portfolio turnover rate |
|
Year or Period ended |
($) |
($) |
($) |
($) |
($) |
($) |
($) |
($) |
($) |
($) |
(%) |
(%) |
(%) |
(%) |
(%) |
($000's) |
(%) |
|
Class I |
|
|
|
|
|
|
|
|
|
|
|
|
|
|
|
|
|
|
12-31-25 |
28.51 |
0.61• |
(0.54) |
0.07 |
0.85 |
— |
— |
0.85 |
— |
27.73 |
0.30 |
1.14 |
0.81 |
0.80 |
2.18 |
2,281 |
97 |
|
12-31-24 |
28.05 |
0.79•
|
0.48 |
1.27 |
0.81 |
— |
— |
0.81 |
— |
28.51 |
4.58 |
1.01 |
0.73 |
0.73 |
2.78 |
2,504 |
82 |
|
12-31-23 |
26.92 |
0.56•
|
3.18 |
3.74 |
0.84 |
1.77 |
— |
2.61 |
— |
28.05 |
14.31 |
1.03 |
0.68 |
0.68 |
2.07 |
3,281 |
73 |
|
12-31-22 |
46.19 |
0.72•
|
(12.81) |
(12.09) |
0.71 |
6.47 |
— |
7.18 |
— |
26.92 |
(26.97) |
1.01 |
0.68 |
0.68 |
2.10 |
8,128 |
62 |
|
12-31-21 |
30.88 |
0.62•
|
15.41 |
16.03 |
0.72 |
— |
— |
0.72 |
— |
46.19 |
52.34 |
1.02 |
0.68 |
0.68 |
1.65 |
11,745 |
67 |
|
Class S |
|
|
|
|
|
|
|
|
|
|
|
|
|
|
|
|
|
|
12-31-25 |
28.56 |
0.54• |
(0.55) |
(0.01) |
0.76 |
— |
— |
0.76 |
— |
27.79 |
0.03 |
1.39 |
1.06 |
1.05 |
1.92 |
105,387 |
97 |
|
12-31-24 |
28.08 |
0.72•
|
0.47 |
1.19 |
0.71 |
— |
— |
0.71 |
— |
28.56 |
4.30 |
1.26 |
0.98 |
0.98 |
2.54 |
124,125 |
82 |
|
12-31-23 |
26.88 |
0.64•
|
3.03 |
3.67 |
0.70 |
1.77 |
— |
2.47 |
— |
28.08 |
14.04 |
1.28 |
0.93 |
0.93 |
2.41 |
139,768 |
73 |
|
12-31-22 |
46.11 |
0.62•
|
(12.77) |
(12.15) |
0.61 |
6.47 |
— |
7.08 |
— |
26.88 |
(27.14) |
1.26 |
0.93 |
0.93 |
1.80 |
143,264 |
62 |
|
12-31-21 |
30.87 |
0.52•
|
15.39 |
15.91 |
0.67 |
— |
— |
0.67 |
— |
46.11 |
51.96 |
1.27 |
0.93 |
0.93 |
1.37 |
227,726 |
67 |
|
Class S2 |
|
|
|
|
|
|
|
|
|
|
|
|
|
|
|
|
|
|
12-31-25 |
28.36 |
0.49• |
(0.53) |
(0.04) |
0.72 |
— |
— |
0.72 |
— |
27.60 |
(0.10) |
1.54 |
1.21 |
1.20 |
1.77 |
5,625 |
97 |
|
12-31-24 |
27.89 |
0.67•
|
0.47 |
1.14 |
0.67 |
— |
— |
0.67 |
— |
28.36 |
4.14 |
1.41 |
1.13 |
1.13 |
2.38 |
6,150 |
82 |
|
12-31-23 |
26.70 |
0.59•
|
3.01 |
3.60 |
0.64 |
1.77 |
— |
2.41 |
— |
27.89 |
13.86 |
1.43 |
1.08 |
1.08 |
2.24 |
7,103 |
73 |
|
12-31-22 |
45.78 |
0.54•
|
(12.65) |
(12.11) |
0.50 |
6.47 |
— |
6.97 |
— |
26.70 |
(27.25) |
1.41 |
1.08 |
1.08 |
1.58 |
7,597 |
62 |
|
12-31-21 |
30.64 |
0.46•
|
15.28 |
15.74 |
0.60 |
— |
— |
0.60 |
— |
45.78 |
51.74 |
1.42 |
1.08 |
1.08 |
1.21 |
13,826 |
67 |
|
VY® Invesco Growth and Income Portfolio | |||||||||||||||||
|
Class ADV |
|
|
|
|
|
|
|
|
|
|
|
|
|
|
|
|
|
|
12-31-25 |
21.77 |
0.16• |
2.67 |
2.83 |
0.66 |
4.24 |
— |
4.90 |
— |
19.70 |
14.93 |
1.25 |
1.24 |
1.24 |
0.79 |
14,509 |
27 |
|
12-31-24 |
21.32 |
0.20•
|
3.02 |
3.22 |
0.24 |
2.53 |
— |
2.77 |
— |
21.77 |
15.74 |
1.24 |
1.21 |
1.21 |
0.90 |
14,585 |
22 |
|
12-31-23 |
20.75 |
0.21•
|
2.16 |
2.37 |
0.31 |
1.49 |
— |
1.80 |
— |
21.32 |
11.93 |
1.24 |
1.21 |
1.21 |
1.04 |
14,598 |
28 |
|
12-31-22 |
26.21 |
0.23•
|
(2.16) |
(1.93) |
0.25 |
3.28 |
— |
3.53 |
— |
20.75 |
(6.16) |
1.24 |
1.21 |
1.21 |
1.00 |
16,239 |
18 |
|
12-31-21 |
20.62 |
0.18•
|
5.67 |
5.85 |
0.26 |
— |
— |
0.26 |
— |
26.21 |
28.50 |
1.24 |
1.21 |
1.21 |
0.75 |
18,354 |
30 |
|
Class I |
|
|
|
|
|
|
|
|
|
|
|
|
|
|
|
|
|
|
12-31-25 |
22.11 |
0.29• |
2.71 |
3.00 |
0.80 |
4.24 |
— |
5.04 |
— |
20.07 |
15.63 |
0.65 |
0.64 |
0.64 |
1.39 |
54,279 |
27 |
|
12-31-24 |
21.62 |
0.34•
|
3.06 |
3.40 |
0.38 |
2.53 |
— |
2.91 |
— |
22.11 |
16.43 |
0.64 |
0.61 |
0.61 |
1.51 |
51,797 |
22 |
|
12-31-23 |
21.04 |
0.34•
|
2.19 |
2.53 |
0.46 |
1.49 |
— |
1.95 |
— |
21.62 |
12.62 |
0.64 |
0.61 |
0.61 |
1.64 |
46,049 |
28 |
|
12-31-22 |
26.54 |
0.37•
|
(2.19) |
(1.82) |
0.40 |
3.28 |
— |
3.68 |
— |
21.04 |
(5.59) |
0.64 |
0.61 |
0.61 |
1.62 |
42,132 |
18 |
|
12-31-21 |
20.86 |
0.33•
|
5.73 |
6.06 |
0.38 |
— |
— |
0.38 |
— |
26.54 |
29.21 |
0.64 |
0.61 |
0.61 |
1.35 |
41,488 |
30 |
|
Class S |
|
|
|
|
|
|
|
|
|
|
|
|
|
|
|
|
|
|
12-31-25 |
22.56 |
0.24• |
2.79 |
3.03 |
0.64 |
4.24 |
— |
4.88 |
— |
20.71 |
15.35 |
0.90 |
0.89 |
0.89 |
1.14 |
90,071 |
27 |
|
12-31-24 |
22.00 |
0.30•
|
3.11 |
3.41 |
0.32 |
2.53 |
— |
2.85 |
— |
22.56 |
16.15 |
0.89 |
0.86 |
0.86 |
1.32 |
85,922 |
22 |
|
12-31-23 |
21.37 |
0.29•
|
2.23 |
2.52 |
0.40 |
1.49 |
— |
1.89 |
— |
22.00 |
12.34 |
0.89 |
0.86 |
0.86 |
1.39 |
301,058 |
28 |
|
12-31-22 |
26.88 |
0.32•
|
(2.22) |
(1.90) |
0.33 |
3.28 |
— |
3.61 |
— |
21.37 |
(5.84) |
0.89 |
0.86 |
0.86 |
1.36 |
319,719 |
18 |
|
12-31-21 |
21.12 |
0.27•
|
5.82 |
6.09 |
0.33 |
— |
— |
0.33 |
— |
26.88 |
28.97 |
0.89 |
0.86 |
0.86 |
1.10 |
367,120 |
30 |
See Accompanying Notes to Financial Highlights
140
FINANCIAL HIGHLIGHTS (continued)
Selected data for a share of capital stock outstanding throughout each year or period.
|
|
|
Income (loss)
from
investment
operations |
|
Less distributions |
|
|
|
|
Ratios to average net assets |
Supplemental
data | |||||||
|
|
Net asset value, beginning
of year or period |
Net investment income (loss) |
Net realized and unrealized
gain (loss) |
Total from investment
operations |
From net investment income |
From net realized gains |
From return of capital |
Total distributions |
Payment from affiliate |
Net asset value, end of year or period |
Total Return(1) |
Expenses before
reductions/additions(2)(3)(4) |
Expenses net of fee waivers
and/or recoupments, if any(2)(3)(4) |
Expenses net of all
reductions/additions(2)(3)(4) |
Net investment income
(loss)(2)(3) |
Net assets, end of year or period |
Portfolio turnover rate |
|
Year or Period ended |
($) |
($) |
($) |
($) |
($) |
($) |
($) |
($) |
($) |
($) |
(%) |
(%) |
(%) |
(%) |
(%) |
($000's) |
(%) |
|
Class S2 |
|
|
|
|
|
|
|
|
|
|
|
|
|
|
|
|
|
|
12-31-25 |
22.20 |
0.21• |
2.78 |
2.99 |
0.12 |
4.24 |
— |
4.36 |
— |
20.83 |
15.18 |
1.05 |
1.04 |
1.04 |
0.98 |
2,118 |
27 |
|
12-31-24 |
21.70 |
0.27•
|
3.05 |
3.32 |
0.29 |
2.53 |
— |
2.82 |
— |
22.20 |
15.95 |
1.04 |
1.01 |
1.01 |
1.19 |
2,216 |
22 |
|
12-31-23 |
21.10 |
0.26•
|
2.19 |
2.45 |
0.36 |
1.49 |
— |
1.85 |
— |
21.70 |
12.17 |
1.04 |
1.01 |
1.01 |
1.24 |
20,396 |
28 |
|
12-31-22 |
26.57 |
0.28•
|
(2.19) |
(1.91) |
0.28 |
3.28 |
— |
3.56 |
— |
21.10 |
(5.99) |
1.04 |
1.01 |
1.01 |
1.20 |
20,482 |
18 |
|
12-31-21 |
20.88 |
0.23•
|
5.76 |
5.99 |
0.30 |
— |
— |
0.30 |
— |
26.57 |
28.78 |
1.04 |
1.01 |
1.01 |
0.95 |
24,924 |
30 |
|
VY® JPMorgan Emerging Markets Equity Portfolio | |||||||||||||||||
|
Class ADV |
|
|
|
|
|
|
|
|
|
|
|
|
|
|
|
|
|
|
12-31-25 |
11.33 |
0.03• |
4.00 |
4.03 |
0.26 |
2.99 |
0.20 |
3.45 |
— |
11.91 |
38.59 |
1.86 |
1.79 |
1.79 |
0.28 |
38,976 |
37 |
|
12-31-24 |
11.20 |
0.06•
|
0.13 |
0.19 |
0.06 |
— |
— |
0.06 |
— |
11.33 |
1.69 |
1.86 |
1.79 |
1.79 |
0.52 |
33,344 |
35 |
|
12-31-23 |
10.72 |
(0.01)•
|
0.66 |
0.65 |
0.17 |
— |
— |
0.17 |
— |
11.20 |
6.02 |
1.85 |
1.81 |
1.81 |
(0.06) |
36,809 |
29 |
|
12-31-22 |
21.50 |
(0.03)•
|
(5.71) |
(5.74) |
— |
5.04 |
— |
5.04 |
— |
10.72 |
(26.35) |
1.86 |
1.86 |
1.86 |
(0.25) |
37,190 |
18 |
|
12-31-21 |
25.92 |
(0.25)•
|
(2.19) |
(2.44) |
— |
1.98 |
— |
1.98 |
— |
21.50 |
(10.30) |
1.86 |
1.86 |
1.86 |
(1.01) |
54,012 |
25 |
|
Class I |
|
|
|
|
|
|
|
|
|
|
|
|
|
|
|
|
|
|
12-31-25 |
12.71 |
0.12• |
4.49 |
4.61 |
0.34 |
2.99 |
0.20 |
3.53 |
— |
13.79 |
39.06 |
1.26 |
1.19 |
1.19 |
0.90 |
63,307 |
37 |
|
12-31-24 |
12.55 |
0.14•
|
0.16 |
0.30 |
0.14 |
— |
— |
0.14 |
— |
12.71 |
2.30 |
1.26 |
1.19 |
1.19 |
1.12 |
59,050 |
35 |
|
12-31-23 |
11.99 |
0.06•
|
0.74 |
0.80 |
0.24 |
— |
— |
0.24 |
— |
12.55 |
6.64 |
1.25 |
1.21 |
1.21 |
0.49 |
62,596 |
29 |
|
12-31-22 |
23.10 |
0.05•
|
(6.12) |
(6.07) |
— |
5.04 |
— |
5.04 |
— |
11.99 |
(25.89) |
1.26 |
1.26 |
1.26 |
0.36 |
60,063 |
18 |
|
12-31-21 |
27.55 |
(0.11)•
|
(2.36) |
(2.47) |
— |
1.98 |
— |
1.98 |
— |
23.10 |
(9.78) |
1.26 |
1.26 |
1.26 |
(0.40) |
80,785 |
25 |
|
Class S |
|
|
|
|
|
|
|
|
|
|
|
|
|
|
|
|
|
|
12-31-25 |
12.48 |
0.09• |
4.40 |
4.49 |
0.30 |
2.99 |
0.20 |
3.49 |
— |
13.48 |
38.77 |
1.51 |
1.44 |
1.44 |
0.64 |
49,530 |
37 |
|
12-31-24 |
12.32 |
0.11•
|
0.15 |
0.26 |
0.10 |
— |
— |
0.10 |
— |
12.48 |
2.08 |
1.51 |
1.44 |
1.44 |
0.87 |
164,116 |
35 |
|
12-31-23 |
11.77 |
0.04•
|
0.72 |
0.76 |
0.21 |
— |
— |
0.21 |
— |
12.32 |
6.38 |
1.50 |
1.46 |
1.46 |
0.31 |
191,201 |
29 |
|
12-31-22 |
22.86 |
0.01•
|
(6.06) |
(6.05) |
— |
5.04 |
— |
5.04 |
— |
11.77 |
(26.11) |
1.51 |
1.51 |
1.51 |
0.10 |
205,544 |
18 |
|
12-31-21 |
27.35 |
(0.17)•
|
(2.34) |
(2.51) |
— |
1.98 |
— |
1.98 |
— |
22.86 |
(10.00) |
1.51 |
1.51 |
1.51 |
(0.64) |
320,977 |
25 |
|
Class S2 |
|
|
|
|
|
|
|
|
|
|
|
|
|
|
|
|
|
|
12-31-25 |
12.18 |
0.06• |
4.32 |
4.38 |
0.28 |
2.99 |
0.20 |
3.47 |
— |
13.09 |
38.84 |
1.66 |
1.59 |
1.59 |
0.46 |
3 |
37 |
|
12-31-24 |
12.02 |
0.09•
|
0.15 |
0.24 |
0.08 |
— |
— |
0.08 |
— |
12.18 |
1.95 |
1.66 |
1.59 |
1.59 |
0.72 |
4,214 |
35 |
|
12-31-23 |
11.48 |
0.03•
|
0.69 |
0.72 |
0.18 |
— |
— |
0.18 |
— |
12.02 |
6.25 |
1.65 |
1.61 |
1.61 |
0.23 |
4,950 |
29 |
|
12-31-22 |
22.50 |
(0.01)•
|
(5.97) |
(5.98) |
— |
5.04 |
— |
5.04 |
— |
11.48 |
(26.23) |
1.66 |
1.66 |
1.66 |
(0.06) |
6,126 |
18 |
|
12-31-21 |
26.98 |
(0.20)•
|
(2.30) |
(2.50) |
— |
1.98 |
— |
1.98 |
— |
22.50 |
(10.11) |
1.66 |
1.66 |
1.66 |
(0.79) |
10,071 |
25 |
|
VY® JPMorgan Small Cap Core Equity Portfolio | |||||||||||||||||
|
Class ADV |
|
|
|
|
|
|
|
|
|
|
|
|
|
|
|
|
|
|
12-31-25 |
14.31 |
(0.04)• |
0.38 |
0.34 |
0.00* |
2.05 |
— |
2.05 |
— |
12.60 |
3.21 |
1.49 |
1.49 |
1.48 |
(0.27) |
97,230 |
81 |
|
12-31-24 |
12.97 |
(0.03)•
|
1.38 |
1.35 |
0.01 |
— |
— |
0.01 |
— |
14.31 |
10.38 |
1.48 |
1.48 |
1.47 |
(0.20) |
106,939 |
55 |
|
12-31-23 |
12.47 |
(0.01)•
|
1.46 |
1.45 |
— |
0.95 |
— |
0.95 |
— |
12.97 |
11.88 |
1.48 |
1.48 |
1.46 |
(0.07) |
109,167 |
46 |
|
12-31-22 |
19.30 |
(0.03)•
|
(3.59) |
(3.62) |
— |
3.21 |
— |
3.21 |
— |
12.47 |
(18.08) |
1.47 |
1.47 |
1.47 |
(0.18) |
105,703 |
46 |
|
12-31-21 |
17.26 |
(0.08)•
|
3.14 |
3.06 |
— |
1.02 |
— |
1.02 |
— |
19.30 |
17.94 |
1.46 |
1.46 |
1.45 |
(0.44) |
140,945 |
52 |
See Accompanying Notes to Financial Highlights
141
FINANCIAL HIGHLIGHTS (continued)
Selected data for a share of capital stock outstanding throughout each year or period.
|
|
|
Income (loss)
from
investment
operations |
|
Less distributions |
|
|
|
|
Ratios to average net assets |
Supplemental
data | |||||||
|
|
Net asset value, beginning
of year or period |
Net investment income (loss) |
Net realized and unrealized
gain (loss) |
Total from investment
operations |
From net investment income |
From net realized gains |
From return of capital |
Total distributions |
Payment from affiliate |
Net asset value, end of year or period |
Total Return(1) |
Expenses before
reductions/additions(2)(3)(4) |
Expenses net of fee waivers
and/or recoupments, if any(2)(3)(4) |
Expenses net of all
reductions/additions(2)(3)(4) |
Net investment income
(loss)(2)(3) |
Net assets, end of year or period |
Portfolio turnover rate |
|
Year or Period ended |
($) |
($) |
($) |
($) |
($) |
($) |
($) |
($) |
($) |
($) |
(%) |
(%) |
(%) |
(%) |
(%) |
($000's) |
(%) |
|
Class I |
|
|
|
|
|
|
|
|
|
|
|
|
|
|
|
|
|
|
12-31-25 |
16.49 |
0.05• |
0.46 |
0.51 |
0.10 |
2.05 |
— |
2.15 |
— |
14.85 |
3.86 |
0.89 |
0.89 |
0.88 |
0.30 |
101,298 |
81 |
|
12-31-24 |
14.92 |
0.06•
|
1.59 |
1.65 |
0.08 |
— |
— |
0.08 |
— |
16.49 |
11.09 |
0.88 |
0.88 |
0.87 |
0.41 |
209,997 |
55 |
|
12-31-23 |
14.19 |
0.07•
|
1.66 |
1.73 |
0.05 |
0.95 |
— |
1.00 |
— |
14.92 |
12.46 |
0.88 |
0.88 |
0.86 |
0.52 |
203,320 |
46 |
|
12-31-22 |
21.28 |
0.07•
|
(3.95) |
(3.88) |
— |
3.21 |
— |
3.21 |
— |
14.19 |
(17.57) |
0.87 |
0.87 |
0.87 |
0.43 |
229,935 |
46 |
|
12-31-21 |
18.89 |
0.04•
|
3.45 |
3.49 |
0.08 |
1.02 |
— |
1.10 |
— |
21.28 |
18.71 |
0.86 |
0.86 |
0.85 |
0.18 |
282,032 |
52 |
|
Class R6 |
|
|
|
|
|
|
|
|
|
|
|
|
|
|
|
|
|
|
12-31-25 |
16.47 |
0.05• |
0.46 |
0.51 |
0.10 |
2.05 |
— |
2.15 |
— |
14.83 |
3.87 |
0.89 |
0.89 |
0.88 |
0.32 |
27,039 |
81 |
|
12-31-24 |
14.90 |
0.06•
|
1.59 |
1.65 |
0.08 |
— |
— |
0.08 |
— |
16.47 |
11.11 |
0.88 |
0.88 |
0.87 |
0.40 |
30,642 |
55 |
|
12-31-23 |
14.17 |
0.08•
|
1.65 |
1.73 |
0.05 |
0.95 |
— |
1.00 |
— |
14.90 |
12.48 |
0.88 |
0.88 |
0.86 |
0.53 |
32,760 |
46 |
|
12-31-22 |
21.25 |
0.05•
|
(3.92) |
(3.87) |
— |
3.21 |
— |
3.21 |
— |
14.17 |
(17.55) |
0.87 |
0.87 |
0.87 |
0.30 |
31,036 |
46 |
|
12-31-21 |
18.87 |
0.03•
|
3.45 |
3.48 |
0.08 |
1.02 |
— |
1.10 |
— |
21.25 |
18.67 |
0.86 |
0.86 |
0.85 |
0.16 |
129,718 |
52 |
|
Class S |
|
|
|
|
|
|
|
|
|
|
|
|
|
|
|
|
|
|
12-31-25 |
16.00 |
0.01• |
0.45 |
0.46 |
0.05 |
2.05 |
— |
2.10 |
— |
14.36 |
3.65 |
1.14 |
1.14 |
1.13 |
0.07 |
63,785 |
81 |
|
12-31-24 |
14.49 |
0.02•
|
1.53 |
1.55 |
0.04 |
— |
— |
0.04 |
— |
16.00 |
10.74 |
1.13 |
1.13 |
1.12 |
0.15 |
77,527 |
55 |
|
12-31-23 |
13.80 |
0.04•
|
1.62 |
1.66 |
0.02 |
0.95 |
— |
0.97 |
— |
14.49 |
12.26 |
1.13 |
1.13 |
1.11 |
0.28 |
86,418 |
46 |
|
12-31-22 |
20.85 |
0.03•
|
(3.87) |
(3.84) |
— |
3.21 |
— |
3.21 |
— |
13.80 |
(17.76) |
1.12 |
1.12 |
1.12 |
0.16 |
86,656 |
46 |
|
12-31-21 |
18.55 |
(0.02)•
|
3.38 |
3.36 |
0.04 |
1.02 |
— |
1.06 |
— |
20.85 |
18.32 |
1.11 |
1.11 |
1.10 |
(0.09) |
124,185 |
52 |
|
Class S2 |
|
|
|
|
|
|
|
|
|
|
|
|
|
|
|
|
|
|
12-31-25 |
15.64 |
(0.01)• |
0.44 |
0.43 |
0.01 |
2.05 |
— |
2.06 |
— |
14.01 |
3.49 |
1.29 |
1.29 |
1.28 |
(0.07) |
1,559 |
81 |
|
12-31-24 |
14.15 |
(0.00)*•
|
1.50 |
1.50 |
0.01 |
— |
— |
0.01 |
— |
15.64 |
10.60 |
1.28 |
1.28 |
1.27 |
(0.03) |
1,791 |
55 |
|
12-31-23 |
13.51 |
0.02•
|
1.57 |
1.59 |
— |
0.95 |
— |
0.95 |
— |
14.15 |
12.00 |
1.28 |
1.28 |
1.26 |
0.13 |
5,862 |
46 |
|
12-31-22 |
20.52 |
0.00* |
(3.80) |
(3.80) |
— |
3.21 |
— |
3.21 |
— |
13.51 |
(17.86) |
1.27 |
1.27 |
1.27 |
0.01 |
6,076 |
46 |
|
12-31-21 |
18.27 |
(0.05)•
|
3.33 |
3.28 |
0.01 |
1.02 |
— |
1.03 |
— |
20.52 |
18.17 |
1.26 |
1.26 |
1.25 |
(0.24) |
8,692 |
52 |
|
VY® Morgan Stanley Global Franchise Portfolio | |||||||||||||||||
|
Class ADV |
|
|
|
|
|
|
|
|
|
|
|
|
|
|
|
|
|
|
12-31-25 |
13.70 |
(0.03)• |
0.23 |
0.20 |
0.00* |
4.69 |
— |
4.69 |
— |
9.21 |
(0.20) |
1.60 |
1.58 |
1.58 |
(0.29) |
76,962 |
32 |
|
12-31-24 |
14.14 |
(0.00)*•
|
1.11 |
1.11 |
0.04 |
1.51 |
— |
1.55 |
— |
13.70 |
8.31 |
1.59 |
1.56 |
1.56 |
(0.02) |
93,354 |
32 |
|
12-31-23 |
13.36 |
0.03•
|
2.01 |
2.04 |
0.03 |
1.23 |
— |
1.26 |
— |
14.14 |
15.52 |
1.58 |
1.56 |
1.56 |
0.20 |
104,981 |
15 |
|
12-31-22 |
18.19 |
0.02•
|
(3.31) |
(3.29) |
0.05 |
1.49 |
— |
1.54 |
— |
13.36 |
(17.90) |
1.58 |
1.55 |
1.55 |
0.16 |
103,692 |
14 |
|
12-31-21 |
16.52 |
0.03•
|
3.34 |
3.37 |
0.09 |
1.61 |
— |
1.70 |
— |
18.19 |
21.26 |
1.57 |
1.54 |
1.54 |
0.18 |
138,475 |
11 |
|
Class R6 |
|
|
|
|
|
|
|
|
|
|
|
|
|
|
|
|
|
|
12-31-25 |
15.52 |
0.04• |
0.24 |
0.28 |
0.10 |
4.69 |
— |
4.79 |
— |
11.01 |
0.33 |
1.00 |
0.98 |
0.98 |
0.32 |
995 |
32 |
|
12-31-24 |
15.83 |
0.09•
|
1.24 |
1.33 |
0.13 |
1.51 |
— |
1.64 |
— |
15.52 |
8.88 |
0.99 |
0.96 |
0.96 |
0.59 |
1,207 |
32 |
|
12-31-23 |
14.81 |
0.12•
|
2.26 |
2.38 |
0.13 |
1.23 |
— |
1.36 |
— |
15.83 |
16.30 |
0.98 |
0.96 |
0.96 |
0.80 |
1,773 |
15 |
|
12-31-22 |
19.98 |
0.12•
|
(3.64) |
(3.52) |
0.16 |
1.49 |
— |
1.65 |
— |
14.81 |
(17.43) |
0.98 |
0.95 |
0.95 |
0.77 |
1,673 |
14 |
|
12-31-21 |
17.97 |
0.15•
|
3.65 |
3.80 |
0.18 |
1.61 |
— |
1.79 |
— |
19.98 |
22.01 |
0.97 |
0.94 |
0.94 |
0.79 |
1,828 |
11 |
See Accompanying Notes to Financial Highlights
142
FINANCIAL HIGHLIGHTS (continued)
Selected data for a share of capital stock outstanding throughout each year or period.
|
|
|
Income (loss)
from
investment
operations |
|
Less distributions |
|
|
|
|
Ratios to average net assets |
Supplemental
data | |||||||
|
|
Net asset value, beginning
of year or period |
Net investment income (loss) |
Net realized and unrealized
gain (loss) |
Total from investment
operations |
From net investment income |
From net realized gains |
From return of capital |
Total distributions |
Payment from affiliate |
Net asset value, end of year or period |
Total Return(1) |
Expenses before
reductions/additions(2)(3)(4) |
Expenses net of fee waivers
and/or recoupments, if any(2)(3)(4) |
Expenses net of all
reductions/additions(2)(3)(4) |
Net investment income
(loss)(2)(3) |
Net assets, end of year or period |
Portfolio turnover rate |
|
Year or Period ended |
($) |
($) |
($) |
($) |
($) |
($) |
($) |
($) |
($) |
($) |
(%) |
(%) |
(%) |
(%) |
(%) |
($000's) |
(%) |
|
Class S |
|
|
|
|
|
|
|
|
|
|
|
|
|
|
|
|
|
|
12-31-25 |
15.60 |
0.02• |
0.23 |
0.25 |
0.06 |
4.69 |
— |
4.75 |
— |
11.10 |
0.10 |
1.25 |
1.22 |
1.22 |
0.15 |
3,279 |
32 |
|
12-31-24 |
15.89 |
0.05•
|
1.26 |
1.31 |
0.09 |
1.51 |
— |
1.60 |
— |
15.60 |
8.67 |
1.24 |
1.21 |
1.21 |
0.33 |
164,470 |
32 |
|
12-31-23 |
14.87 |
0.08•
|
2.25 |
2.33 |
0.08 |
1.23 |
— |
1.31 |
— |
15.89 |
15.91 |
1.23 |
1.21 |
1.21 |
0.55 |
183,705 |
15 |
|
12-31-22 |
20.02 |
0.08•
|
(3.64) |
(3.56) |
0.10 |
1.49 |
— |
1.59 |
— |
14.87 |
(17.58) |
1.23 |
1.20 |
1.20 |
0.51 |
185,295 |
14 |
|
12-31-21 |
18.01 |
0.10•
|
3.65 |
3.75 |
0.13 |
1.61 |
— |
1.74 |
— |
20.02 |
21.66 |
1.22 |
1.19 |
1.19 |
0.52 |
260,008 |
11 |
|
Class S2 |
|
|
|
|
|
|
|
|
|
|
|
|
|
|
|
|
|
|
12-31-25 |
15.35 |
(0.00)*• |
0.23 |
0.23 |
0.03 |
4.69 |
— |
4.72 |
— |
10.86 |
0.02 |
1.40 |
1.37 |
1.37 |
(0.00)* |
969 |
32 |
|
12-31-24 |
15.67 |
0.03•
|
1.23 |
1.26 |
0.07 |
1.51 |
— |
1.58 |
— |
15.35 |
8.43 |
1.39 |
1.36 |
1.36 |
0.18 |
26,623 |
32 |
|
12-31-23 |
14.67 |
0.06•
|
2.22 |
2.28 |
0.05 |
1.23 |
— |
1.28 |
— |
15.67 |
15.80 |
1.38 |
1.36 |
1.36 |
0.39 |
28,173 |
15 |
|
12-31-22 |
19.77 |
0.06•
|
(3.60) |
(3.54) |
0.07 |
1.49 |
— |
1.56 |
— |
14.67 |
(17.72) |
1.38 |
1.35 |
1.35 |
0.36 |
28,024 |
14 |
|
12-31-21 |
17.80 |
0.07•
|
3.61 |
3.68 |
0.10 |
1.61 |
— |
1.71 |
— |
19.77 |
21.53 |
1.37 |
1.34 |
1.34 |
0.37 |
40,135 |
11 |
|
VY® T. Rowe Price Capital Appreciation Portfolio | |||||||||||||||||
|
Class ADV |
|
|
|
|
|
|
|
|
|
|
|
|
|
|
|
|
|
|
12-31-25 |
26.40 |
0.34• |
2.52 |
2.86 |
0.48 |
4.12 |
— |
4.60 |
— |
24.66 |
11.62 |
1.25 |
1.25 |
1.25 |
1.32 |
2,184,582 |
131 |
|
12-31-24 |
24.19 |
0.43•
|
2.49 |
2.92 |
0.37 |
0.34 |
— |
0.71 |
— |
26.40 |
12.11 |
1.24 |
1.24 |
1.24 |
1.69 |
2,029,776 |
84 |
|
12-31-23 |
23.00 |
0.44•
|
3.58 |
4.02 |
0.14 |
2.69 |
— |
2.83 |
— |
24.19 |
18.16 |
1.24 |
1.24 |
1.24 |
1.86 |
1,826,729 |
75 |
|
12-31-22 |
30.88 |
0.25•
|
(4.19) |
(3.94) |
0.26 |
3.68 |
— |
3.94 |
— |
23.00 |
(12.47) |
1.24 |
1.24 |
1.24 |
0.95 |
1,586,695 |
90 |
|
12-31-21 |
29.91 |
0.14•
|
4.98 |
5.12 |
0.16 |
3.99 |
— |
4.15 |
— |
30.88 |
17.97 |
1.24 |
1.24 |
1.24 |
0.47 |
1,891,868 |
58 |
|
Class I |
|
|
|
|
|
|
|
|
|
|
|
|
|
|
|
|
|
|
12-31-25 |
28.23 |
0.53• |
2.73 |
3.26 |
0.62 |
4.12 |
— |
4.74 |
— |
26.75 |
12.32 |
0.65 |
0.65 |
0.65 |
1.92 |
2,000,130 |
131 |
|
12-31-24 |
26.09 |
0.64•
|
2.68 |
3.32 |
0.84 |
0.34 |
— |
1.18 |
— |
28.23 |
12.75 |
0.64 |
0.64 |
0.64 |
2.29 |
1,896,044 |
84 |
|
12-31-23 |
24.83 |
0.63•
|
3.90 |
4.53 |
0.58 |
2.69 |
— |
3.27 |
— |
26.09 |
18.92 |
0.64 |
0.64 |
0.64 |
2.46 |
1,712,529 |
75 |
|
12-31-22 |
32.96 |
0.44•
|
(4.48) |
(4.04) |
0.41 |
3.68 |
— |
4.09 |
— |
24.83 |
(11.96) |
0.64 |
0.64 |
0.64 |
1.57 |
1,447,933 |
90 |
|
12-31-21 |
31.64 |
0.35•
|
5.29 |
5.64 |
0.33 |
3.99 |
— |
4.32 |
— |
32.96 |
18.67 |
0.64 |
0.64 |
0.64 |
1.07 |
1,553,598 |
58 |
|
Class R6 |
|
|
|
|
|
|
|
|
|
|
|
|
|
|
|
|
|
|
12-31-25 |
28.26 |
0.53• |
2.73 |
3.26 |
0.62 |
4.12 |
— |
4.74 |
— |
26.78 |
12.31 |
0.65 |
0.65 |
0.65 |
1.92 |
739,469 |
131 |
|
12-31-24 |
26.11 |
0.64•
|
2.69 |
3.33 |
0.84 |
0.34 |
— |
1.18 |
— |
28.26 |
12.78 |
0.64 |
0.64 |
0.64 |
2.29 |
693,687 |
84 |
|
12-31-23 |
24.85 |
0.63•
|
3.90 |
4.53 |
0.58 |
2.69 |
— |
3.27 |
— |
26.11 |
18.90 |
0.64 |
0.64 |
0.64 |
2.46 |
621,535 |
75 |
|
12-31-22 |
32.98 |
0.44•
|
(4.48) |
(4.04) |
0.41 |
3.68 |
— |
4.09 |
— |
24.85 |
(11.96) |
0.64 |
0.64 |
0.64 |
1.55 |
525,750 |
90 |
|
12-31-21 |
31.66 |
0.35•
|
5.29 |
5.64 |
0.33 |
3.99 |
— |
4.32 |
— |
32.98 |
18.66 |
0.64 |
0.64 |
0.64 |
1.07 |
620,373 |
58 |
|
Class S |
|
|
|
|
|
|
|
|
|
|
|
|
|
|
|
|
|
|
12-31-25 |
28.27 |
0.46• |
2.73 |
3.19 |
0.56 |
4.12 |
— |
4.68 |
— |
26.78 |
12.02 |
0.90 |
0.90 |
0.90 |
1.67 |
2,044,279 |
131 |
|
12-31-24 |
26.08 |
0.57•
|
2.68 |
3.25 |
0.72 |
0.34 |
— |
1.06 |
— |
28.27 |
12.49 |
0.89 |
0.89 |
0.89 |
2.05 |
1,962,100 |
84 |
|
12-31-23 |
24.83 |
0.57•
|
3.89 |
4.46 |
0.52 |
2.69 |
— |
3.21 |
— |
26.08 |
18.60 |
0.89 |
0.89 |
0.89 |
2.20 |
3,912,825 |
75 |
|
12-31-22 |
32.96 |
0.36•
|
(4.47) |
(4.11) |
0.34 |
3.68 |
— |
4.02 |
— |
24.83 |
(12.18) |
0.89 |
0.89 |
0.89 |
1.30 |
3,757,937 |
90 |
|
12-31-21 |
31.64 |
0.27•
|
5.29 |
5.56 |
0.25 |
3.99 |
— |
4.24 |
— |
32.96 |
18.40 |
0.89 |
0.89 |
0.89 |
0.82 |
4,700,019 |
58 |
See Accompanying Notes to Financial Highlights
143
FINANCIAL HIGHLIGHTS (continued)
Selected data for a share of capital stock outstanding throughout each year or period.
|
|
|
Income (loss)
from
investment
operations |
|
Less distributions |
|
|
|
|
Ratios to average net assets |
Supplemental
data | |||||||
|
|
Net asset value, beginning
of year or period |
Net investment income (loss) |
Net realized and unrealized
gain (loss) |
Total from investment
operations |
From net investment income |
From net realized gains |
From return of capital |
Total distributions |
Payment from affiliate |
Net asset value, end of year or period |
Total Return(1) |
Expenses before
reductions/additions(2)(3)(4) |
Expenses net of fee waivers
and/or recoupments, if any(2)(3)(4) |
Expenses net of all
reductions/additions(2)(3)(4) |
Net investment income
(loss)(2)(3) |
Net assets, end of year or period |
Portfolio turnover rate |
|
Year or Period ended |
($) |
($) |
($) |
($) |
($) |
($) |
($) |
($) |
($) |
($) |
(%) |
(%) |
(%) |
(%) |
(%) |
($000's) |
(%) |
|
Class S2 |
|
|
|
|
|
|
|
|
|
|
|
|
|
|
|
|
|
|
12-31-25 |
27.66 |
0.41• |
2.66 |
3.07 |
0.53 |
4.12 |
— |
4.65 |
— |
26.08 |
11.83 |
1.05 |
1.05 |
1.05 |
1.52 |
17,751 |
131 |
|
12-31-24 |
25.64 |
0.51•
|
2.63 |
3.14 |
0.78 |
0.34 |
— |
1.12 |
— |
27.66 |
12.29 |
1.04 |
1.04 |
1.04 |
1.91 |
15,724 |
84 |
|
12-31-23 |
24.55 |
0.52•
|
3.84 |
4.36 |
0.58 |
2.69 |
— |
3.27 |
— |
25.64 |
18.42 |
1.04 |
1.04 |
1.04 |
2.05 |
56,946 |
75 |
|
12-31-22 |
32.63 |
0.32•
|
(4.43) |
(4.11) |
0.29 |
3.68 |
— |
3.97 |
— |
24.55 |
(12.30) |
1.04 |
1.04 |
1.04 |
1.14 |
53,434 |
90 |
|
12-31-21 |
31.37 |
0.22•
|
5.23 |
5.45 |
0.20 |
3.99 |
— |
4.19 |
— |
32.63 |
18.19 |
1.04 |
1.04 |
1.04 |
0.67 |
71,364 |
58 |
See Accompanying Notes to Financial Highlights
144
ACCOMPANYING NOTES TO FINANCIAL HIGHLIGHTS
(1)
Total return is calculated assuming reinvestment of all dividends, capital gain distributions, and return of capital distributions, if any, at net asset value and does not reflect the effect of insurance contract charges. Total return for periods less than one year is not annualized.
(2)
Annualized for periods less than one year.
(3)
Ratios reflect operating expenses of a Portfolio. Expenses before reductions/additions do not reflect amounts reimbursed or recouped by the Investment Adviser and/or the Distributor or reductions from brokerage service arrangements or other expense offset arrangements and do not represent the amount paid by a Portfolio during periods when reimbursements or reductions occur. Expenses net of fee waivers reflect expenses after reimbursement by the Investment Adviser and/or the Distributor or recoupment of previously reimbursed fees by the Investment Adviser, but prior to reductions from brokerage service arrangements or other expense offset arrangements. Expenses net of all reductions/additions represent the net expenses paid by a Portfolio. Net investment income (loss) is net of all such additions or reductions.
(4)
Ratios do not include fees and expenses charged under the variable annuity contract or variable life insurance policy.
*
Amount is less than $0.005 or 0.005% or more than $(0.005) or (0.005)%.
•
Calculated using average number of shares outstanding throughout the year or period.
145
TO OBTAIN MORE INFORMATION
You will find more information about the Portfolios in our:
ANNUAL/SEMI-ANNUAL SHAREHOLDER REPORTS AND FORM N-CSR
In each Portfolio’s annual shareholder report, you will find a discussion of the market conditions and investment strategies that significantly affected the Portfolio’s performance during its last fiscal year. In a Portfolio’s Form N-CSR, you will find the Portfolio’s financial statements.
STATEMENT OF ADDITIONAL INFORMATION
The SAI contains additional information about the Portfolios. The SAI is legally part of this Prospectus (it is incorporated by reference). A copy has been filed with the SEC.
Please write, call, or visit our website for a free copy of the current annual/semi-annual shareholder reports, the SAI, or other Portfolio information.
To make shareholder inquiries contact:
Voya Investment Management
7337 East Doubletree Ranch Road, Suite 100
Scottsdale, Arizona 85258
Scottsdale, Arizona 85258
1-800-366-0066
or visit our website at www.voyainvestments.com
Reports and other information about the Portfolios are available on the EDGAR Database on the SEC's Internet website at https://www.sec.gov, and copies of this information may be obtained, upon payment of a duplicating fee, by electronic request at the following e-mail address: publicinfo@sec.gov.
When contacting the SEC, you will want to refer to the Portfolios’ SEC file number. The file number is as follows:
|
Voya Investors Trust |
811-05629 |
|
Voya Government Liquid Assets Portfolio
Voya High Yield Portfolio
Voya Large Cap Growth Portfolio
Voya Limited Maturity Bond Portfolio
Voya U.S. Stock Index Portfolio
VY® CBRE Global Real Estate Portfolio |
VY® Columbia Real Estate Portfolio
VY® Invesco Growth and Income Portfolio
VY® JPMorgan Emerging Markets Equity Portfolio
VY® JPMorgan Small Cap Core Equity Portfolio
VY® Morgan Stanley Global Franchise Portfolio
VY® T. Rowe Price Capital Appreciation Portfolio |
PRO-5629(0526-050126)