Pay Versus Performance. In accordance with rules adopted by the SEC pursuant to Dodd-Frank, the Company is providing the following disclosure regarding total compensation and “compensation actually paid” (“CAP”) to the Company’s chief executive officer (the “CEO”) and other named executive officers (“NEOs”) for the fiscal years ended December 31, 2025, 2024, and 2023, and the cumulative shareholder return on the Company’s common stock (“TSR”) and net income over the same period. Please review the entire Executive Compensation section for a complete description of how executive compensation relates to Company performance and how the Compensation Committee makes its decisions.
The Pay versus Performance table below summarizes the compensation values both previously reported in the Summary Compensation Table included in this Proxy Statement, as well as the adjusted values required in this section for the 2025, 2024, and 2023 calendar years.
Year |
Summary Compensation Table Total for G. William Beale (1) $ |
Summary Compensation Table Total for Brian K. Plum (2) $ |
Compensation Actually Paid to G. William Beale (1) $ |
Compensation Actually Paid to Brian K. Plum (2) $ |
Average Summary Compensation Table Total for Non-CEO NEOs $ |
Average Compensation Actually Paid to Non-CEO NEOs $ |
Value of Initial Fixed $100 Investment Based on Shareholder Return(5) $ |
Net Income (in millions) $ |
2025 |
4,425,449 |
N/A |
4,116,911 |
N/A |
2,144,589 |
2,043,107 |
36.95 |
10.7 |
2024 |
1,418,683 |
N/A |
1,551,499 |
N/A |
669,314(4) |
713,263(4) |
26.36 |
-15.4 |
2023 |
981,279 |
374,639 |
627,219 |
233,200 |
555,882(3) |
435,183(3) |
24.81 |
-51.8 |
____________
Calculation of Compensation Actually Paid . To calculate the amounts in the “Compensation Actually Paid” columns with respect to the Company’s CEO and Non-CEO NEOs in the table above according to SEC reporting rules, the following adjustments were made to the compensation as reported under the “Total” column for 2025 in the Summary Compensation Table included in this Proxy Statement.
|
2025 |
|
|
G. William Beale |
Average Non-CEO NEOs |
Total Compensation from Summary Compensation Table |
$ 4,425,449 |
$ 2,144,589 |
Adjustments for Equity Awards |
|
|
Fair value of equity awards granted during the fiscal year |
$ (3,398,400) |
$ (1,628,400) |
Fair value of equity awards granted during the fiscal year – value at year-end |
$ 2,892,800 |
$ 1,462,799 |
Change in fair value from end of prior fiscal year to end of current fiscal year for awards made in prior fiscal years that were unvested at end of current fiscal year |
$ 171,544 |
$ 53,503 |
Change in fair value from end of prior fiscal year to vesting date for awards made in prior fiscal years that vested during current fiscal year |
$ 25,518 |
$ 10,616 |
Dividends paid on unvested shares/units/options that are not otherwise included in total compensation for the covered fiscal year |
$ - |
$ - |
Fair value of equity compensation forfeited in current fiscal year determined at end of prior fiscal year |
$ - |
$ - |
Total Adjustments for Equity Awards |
$ (308,538) |
$ (101,482) |
Compensation Actually Paid (as calculated) |
$ 4,116,911 |
$ 2,043,107 |
The CAP as calculated for the Company’s CEO and Non-CEO NEOs during 2025 does not reflect the cancellation or forfeiture of a portion of equity awards subsequent to December 31, 2025 as follows: for Mr. Beale, 800,000 shares, or $3,416,000 in year-end market value; for Ms. Gavant, 160,000 shares, or $683,200 in year-end market value; and for Mr. Brown, 200,000 shares, or $854,000 in year-end market value.
|
2025 |
|
|
G. William Beale |
Average Non-CEO NEOs |
Total Compensation from Summary Compensation Table |
$ 4,425,449 |
$ 2,144,589 |
Adjustments for Equity Awards |
|
|
Fair value of equity awards granted during the fiscal year |
$ (3,398,400) |
$ (1,628,400) |
Fair value of equity awards granted during the fiscal year – value at year-end |
$ 2,892,800 |
$ 1,462,799 |
Change in fair value from end of prior fiscal year to end of current fiscal year for awards made in prior fiscal years that were unvested at end of current fiscal year |
$ 171,544 |
$ 53,503 |
Change in fair value from end of prior fiscal year to vesting date for awards made in prior fiscal years that vested during current fiscal year |
$ 25,518 |
$ 10,616 |
Dividends paid on unvested shares/units/options that are not otherwise included in total compensation for the covered fiscal year |
$ - |
$ - |
Fair value of equity compensation forfeited in current fiscal year determined at end of prior fiscal year |
$ - |
$ - |
Total Adjustments for Equity Awards |
$ (308,538) |
$ (101,482) |
Compensation Actually Paid (as calculated) |
$ 4,116,911 |
$ 2,043,107 |
|
2025 |
|
|
G. William Beale |
Average Non-CEO NEOs |
Total Compensation from Summary Compensation Table |
$ 4,425,449 |
$ 2,144,589 |
Adjustments for Equity Awards |
|
|
Fair value of equity awards granted during the fiscal year |
$ (3,398,400) |
$ (1,628,400) |
Fair value of equity awards granted during the fiscal year – value at year-end |
$ 2,892,800 |
$ 1,462,799 |
Change in fair value from end of prior fiscal year to end of current fiscal year for awards made in prior fiscal years that were unvested at end of current fiscal year |
$ 171,544 |
$ 53,503 |
Change in fair value from end of prior fiscal year to vesting date for awards made in prior fiscal years that vested during current fiscal year |
$ 25,518 |
$ 10,616 |
Dividends paid on unvested shares/units/options that are not otherwise included in total compensation for the covered fiscal year |
$ - |
$ - |
Fair value of equity compensation forfeited in current fiscal year determined at end of prior fiscal year |
$ - |
$ - |
Total Adjustments for Equity Awards |
$ (308,538) |
$ (101,482) |
Compensation Actually Paid (as calculated) |
$ 4,116,911 |
$ 2,043,107 |
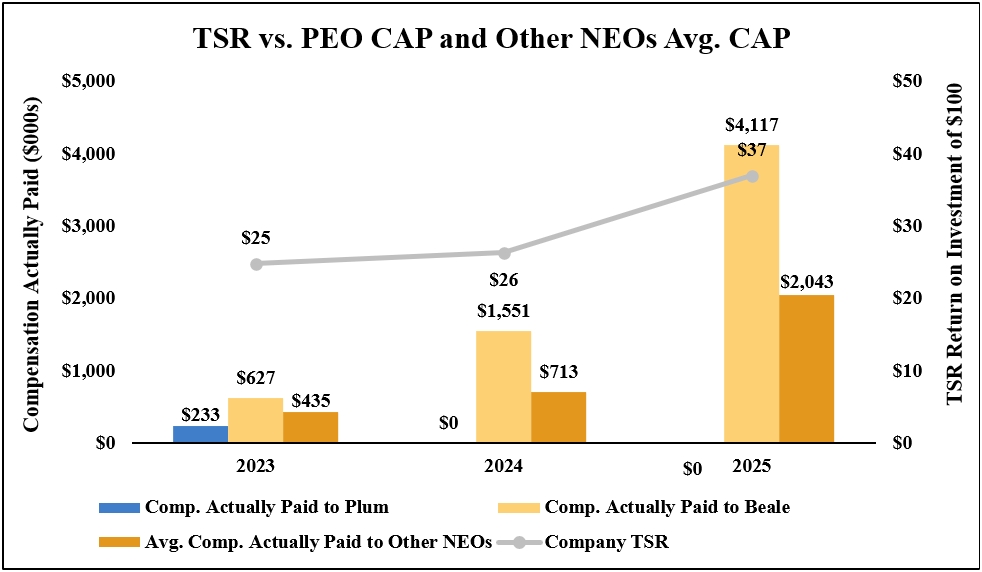
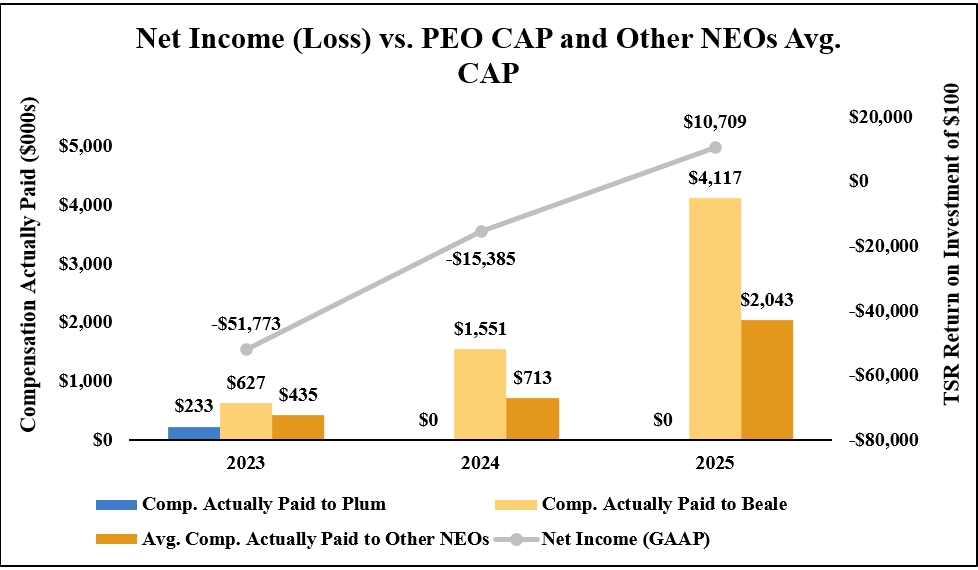
The following graphs show the CEO and Average Non-CEO NEOs compensation on a CAP basis relative to the Company’s cumulative TSR for the fiscal years 2025, 2024, and 2023: