Pay vs Performance Disclosure - USD ($)
Dec. 31, 2025
Dec. 31, 2024
Dec. 31, 2023
Dec. 31, 2022
Dec. 31, 2021
In accordance with the SEC’s disclosure requirements regarding pay versus performance, this section discusses the relationship between executive compensation actually paid to our named executive officers and certain financial performance of the Company for fiscal years listed below.
| PAY VERSUS PERFORMANCE | ||||||||||||||||||||
| (a) | (b) | (c) | (d) | (e) | (f) | (g) | ||||||||||||||
| Year | Summary Compensation Table Total for Principal Executive Officer (“PEO”)(1) | Compensation Actually Paid to PEO(2) | Average Summary Compensation Table For Non- PEO Named Executive Officers (“NEOs”)(3) | Average Compensation Actually Paid To Non- PEO NEOs(4) | Value Of Initial Fixed $100 Investment Based On Total Shareholder Return(5) | Net Income(6) | ||||||||||||||
| 2025 | $1,181,300 | $789,425 | $1,051,364 | $845,664 | $100 | $3,173,000 | ||||||||||||||
| 2024 | $1,197,005 | $1,172,558 | $1,249,352 | $1,226,040 | $134 | $6,385,000 | ||||||||||||||
| 2023 | $482,596 | $607,606 | $1,208,473 | $1,318,783 | $137 | $5,302,000 | ||||||||||||||
| 2022 | $559,706 | $620,316 | $1,108,865 | $1,170,444 | $118 | $4,565,000 | ||||||||||||||
| 2021 | $694,950 | $811,411 | $1,054,051 | $1,156,563 | $127 | $28,215,000 | ||||||||||||||
compensation paid to or earned by our PEO during each fiscal year set forth in the table; rather, they reflect our PEO’s total compensation, as reported in the “Total” column of the SCT, after the following adjustments:
| Adjustments to Determine Compensation “Actually Paid” to PEO | 2025 | 2024 | 2023 | 2022 | 2021 | ||||||||||||
Deduction for amounts reported under the “Stock Awards” column in the SCT | $(381,500) | ($387,500) | ($228,681) | ($300,000) | ($300,000) | ||||||||||||
Increase for fair value of awards granted during year that remain unvested as of year-end(a) | $179,944 | $356,724 | $248,500 | $293,591 | $285,590 | ||||||||||||
Increase for fair value of awards granted during year that vested during year(a) | $31,079 | $18,876 | $15,420 | $23,321 | $31,732 | ||||||||||||
Increase/deduction for change in fair value from prior year-end to current year-end of awards granted prior to year that were outstanding and unvested as of year-end(a) | $(178,258) | $(6,778) | $51,120 | $64,141 | $85,432 | ||||||||||||
Increase/deduction for change in fair value from prior year-end to vesting date of awards granted prior to year that vested during year(a) | $(43,140) | ($5,769) | $38,651 | $(3,855) | $13,708 | ||||||||||||
Deduction of fair value of awards granted prior to year that were forfeited during year(a) | — | $— | — | (16,589) | — | ||||||||||||
| Total Adjustments: | $(391,875) | $(24,447) | $125,010 | $60,609 | $116,462 | ||||||||||||
(a)The yearly change in the market price of the Company’s common stock was used to adjust the fair value of restricted stock grants. The yearly change in the market price of the Company’s common stock and the change in the probable NOI performance was used to adjust the fair value of the restricted stock grants and performance share awards that are subject to the NOI performance condition. The fair values of outstanding stock options were adjusted based on the yearly change in intrinsic value.
each fiscal year set forth in the table; rather, they reflect the average total compensation of our non-PEO NEOs, as reported in the “Total” column of the SCT, after the following adjustments:
| Adjustments to Determine Compensation “Actually Paid” to Non-PEO NEOs | 2025 | 2024 | 2023 | 2022 | 2021 | ||||||||||||
Deduction for amounts reported under the “Stock Awards” column in the SCT | $(388,875) | ($375,000) | ($353,681) | ($300,000) | ($300,000) | ||||||||||||
Increase for fair value of awards granted during year that remain unvested as of year-end(a) | $244,970 | $311,507 | $357,250 | $293,591 | $285,590 | ||||||||||||
Increase for fair value of awards granted during year that vested during year(a) | $46,012 | $55,655 | $20,431 | $23,321 | $31,732 | ||||||||||||
Increase/deduction for change in fair value from prior year-end to current year-end of awards granted prior to year that were outstanding and unvested as of year-end(a) | $(81,993) | $(7,975) | $51,120 | $65,719 | $75,619 | ||||||||||||
Increase/deduction for change in fair value from prior year-end to vesting date of awards granted prior to year that vested during year(a) | $(25,813) | ($7,499) | $35,190 | $(4,464) | $9,571 | ||||||||||||
Deduction of fair value of awards granted prior to year that were forfeited during year(a) | — | $— | — | (16,589) | — | ||||||||||||
| Total Adjustments: | $(205,699) | $(23,312) | $110,310 | $61,578 | $102,512 | ||||||||||||
(b)The yearly change in the market price of the Company’s common stock was used to adjust the fair value of restricted stock grants. The yearly change in the market price of the Company’s common stock and the change in the probable NOI performance was used to adjust the fair value of the restricted stock grants and performance share awards that are subject to the NOI performance condition. The fair values of outstanding stock options were adjusted based on the yearly change in intrinsic value.
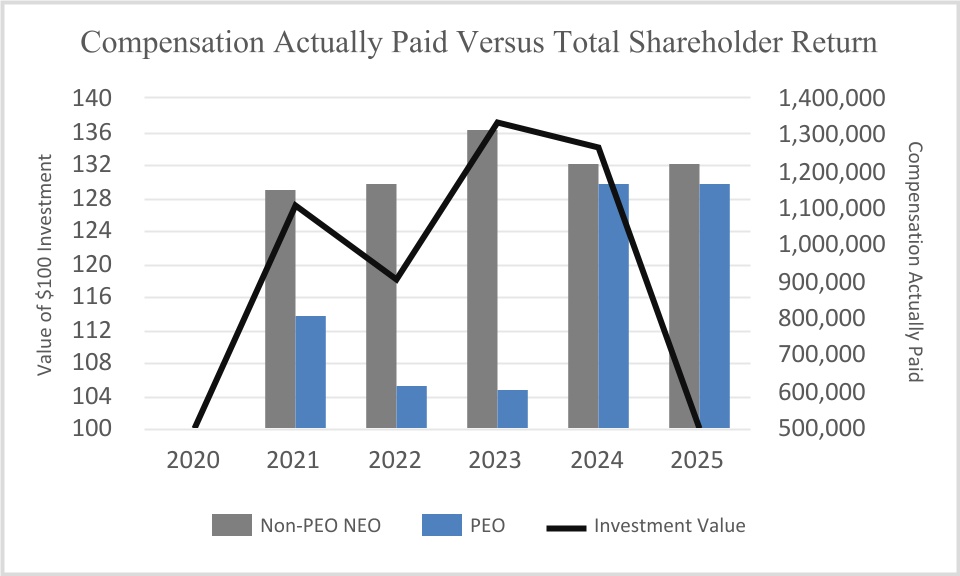
The following chart reflects the relationship between “compensation actually paid” to our PEO and our non-PEO NEOs and the Company’s total shareholder return over the period the fiscal years shown. An integral part of our executive compensation program is equity-based. The Company’s objective in granting equity-based awards is to align our executive
officers’ interests with those of our shareholders by providing a continuing incentive to maximize long-term value for shareholders and encouraging long-term employment.
Analysis of the Information Presented in the Pay Versus Performance Tables
The Company is focused on creating long-term value for shareholders by maximizing the value of its real estate holdings and making strategic investments. Our projects typically take several years to come to fruition, and our net income may vary significantly from year to year based on the status of those projects. Accordingly, we do not tie compensation specifically to net income; rather, the Company’s MIC plan calculates bonuses based on net operating income, leased square feet and the achievement of specified individual goals, and longer-term equity-based awards vest based on the aggregate net operating income of certain joint ventures.