false
0000872625
N-1A
N-CSRS
0000872625
tsr:C000212373Member
2025-09-01
2026-02-28
0000872625
tsr:C000212373Member
2026-02-28
0000872625
tsr:C000212373Member
tsr:bench202409274045_6796Member
2026-02-28
0000872625
tsr:C000212373Member
tsr:bench202409274047_6796Member
2026-02-28
0000872625
tsr:C000212373Member
tsr:bench202409274048_6796Member
2026-02-28
0000872625
tsr:C000212373Member
tsr:bench202409043993_6796Member
2026-02-28
0000872625
tsr:C000212373Member
tsr:bench202409274054_6796Member
2026-02-28
0000872625
tsr:C000212373Member
tsr:bench202409274046_6796Member
2026-02-28
0000872625
tsr:C000212373Member
tsr:bench202409274049_6796Member
2026-02-28
0000872625
tsr:C000212373Member
tsr:bench202503265260_6796Member
2026-02-28
0000872625
2025-09-01
2026-02-28
tsr:Years
iso4217:USD
xbrli:pure
xbrli:shares
iso4217:USD
xbrli:shares
0000872625
tsr:C000212374Member
2025-09-01
2026-02-28
0000872625
tsr:C000212374Member
2026-02-28
0000872625
tsr:C000212374Member
tsr:bench202409043992_6795Member
2026-02-28
0000872625
tsr:C000212374Member
tsr:bench202409043999_6795Member
2026-02-28
0000872625
tsr:C000212374Member
tsr:bench202409043997_6795Member
2026-02-28
0000872625
tsr:C000212374Member
tsr:bench202409043996_6795Member
2026-02-28
0000872625
tsr:C000212374Member
tsr:bench202409043993_6795Member
2026-02-28
0000872625
tsr:C000212374Member
tsr:bench202409043995_6795Member
2026-02-28
0000872625
tsr:C000212374Member
tsr:bench202409044001_6795Member
2026-02-28
0000872625
tsr:C000212374Member
tsr:bench202409043994_6795Member
2026-02-28
0000872625
tsr:C000212374Member
tsr:bench202409044002_6795Member
2026-02-28
0000872625
tsr:C000212374Member
tsr:bench202409043998_6795Member
2026-02-28
0000872625
tsr:C000212374Member
tsr:bench202409044003_6795Member
2026-02-28
0000872625
tsr:C000212375Member
2025-09-01
2026-02-28
0000872625
tsr:C000212375Member
2026-02-28
0000872625
tsr:C000212375Member
tsr:bench202409274045_6793Member
2026-02-28
0000872625
tsr:C000212375Member
tsr:bench202409043993_6793Member
2026-02-28
0000872625
tsr:C000212375Member
tsr:bench202409274047_6793Member
2026-02-28
0000872625
tsr:C000212375Member
tsr:bench202409274046_6793Member
2026-02-28
0000872625
tsr:C000212375Member
tsr:bench202409274048_6793Member
2026-02-28
0000872625
tsr:C000212375Member
tsr:bench202409274049_6793Member
2026-02-28
0000872625
tsr:C000212375Member
tsr:bench202409274050_6793Member
2026-02-28
0000872625
tsr:C000212375Member
tsr:bench202409274053_6793Member
2026-02-28
0000872625
tsr:C000212375Member
tsr:bench202409274052_6793Member
2026-02-28
0000872625
tsr:C000212375Member
tsr:bench202409274054_6793Member
2026-02-28
0000872625
tsr:C000212375Member
tsr:bench202409274051_6793Member
2026-02-28
0000872625
tsr:C000212375Member
tsr:bench202409044002_6793Member
2026-02-28
0000872625
tsr:C000212376Member
2025-09-01
2026-02-28
0000872625
tsr:C000212376Member
2026-02-28
0000872625
tsr:C000212376Member
tsr:bench202409043993_6792Member
2026-02-28
0000872625
tsr:C000212376Member
tsr:bench202409043994_6792Member
2026-02-28
0000872625
tsr:C000212376Member
tsr:bench202409044001_6792Member
2026-02-28
0000872625
tsr:C000212376Member
tsr:bench202409043999_6792Member
2026-02-28
0000872625
tsr:C000212376Member
tsr:bench202409043996_6792Member
2026-02-28
0000872625
tsr:C000212376Member
tsr:bench202409043995_6792Member
2026-02-28
0000872625
tsr:C000212376Member
tsr:bench202409043997_6792Member
2026-02-28
0000872625
tsr:C000212376Member
tsr:bench202409044002_6792Member
2026-02-28
0000872625
tsr:C000212376Member
tsr:bench202409043992_6792Member
2026-02-28
0000872625
tsr:C000212376Member
tsr:bench202409043998_6792Member
2026-02-28
0000872625
tsr:C000212376Member
tsr:bench202409044000_6792Member
2026-02-28
0000872625
tsr:C000212376Member
tsr:bench202409044003_6792Member
2026-02-28
UNITED STATES
SECURITIES AND EXCHANGE COMMISSION
Washington, D.C. 20549
FORM N-CSR
CERTIFIED SHAREHOLDER REPORT OF REGISTERED
MANAGEMENT INVESTMENT COMPANIES
Investment Company Act file number 811-06243
Franklin
Strategic Series
(Exact name of registrant as specified in charter)
One Franklin Parkway, San Mateo, CA 94403-1906
(Address of principal executive offices) (Zip code)
Alison Baur
Franklin Templeton
One Franklin Parkway
San Mateo, CA 94403-1906
(Name and address of agent for service)
Registrant’s telephone number, including area
code: (650) 312-2000
Date of fiscal year end: August 31
Date of reporting period: February
28, 2026
| ITEM 1. |
REPORT TO STOCKHOLDERS |
(a) The Report to Shareholders is filed herewith
|
|
|
|
Franklin
Templeton SMACS: Series CH |
|
|
Semi-Annual
Shareholder Report | February
28, 2026 |
|
|
This
semi-annual
shareholder report
contains important information about Franklin
Templeton SMACS: Series CH for the period September
1, 2025, to February 28, 2026.
You
can find additional information about the Fund at https://www.franklintempleton.com/regulatory-fund-documents.
You can also request this information
by contacting us at (800)
DIAL BEN/342-5236.
|
|
|
|
Fund
Name |
Costs
of a $10,000 investment
|
Costs
paid as a percentage of a $10,000
investment*,†
|
|
Franklin
Templeton SMACS: Series CH1
|
$
|
%
|
| * |
Reflects
fee waivers and/or expense reimbursements, without which expenses would have been higher. |
| 1 |
Does
not reflect the effect of fees and expenses associated with a separately managed account, or a management fee or other operating expenses
of the Fund. |
KEY
FUND STATISTICS (as
of February 28, 2026)
|
|
|
Total
Net Assets |
$35,948,877
|
|
Total
Number of Portfolio Holdings |
86
|
|
Portfolio
Turnover Rate |
7.69%
|
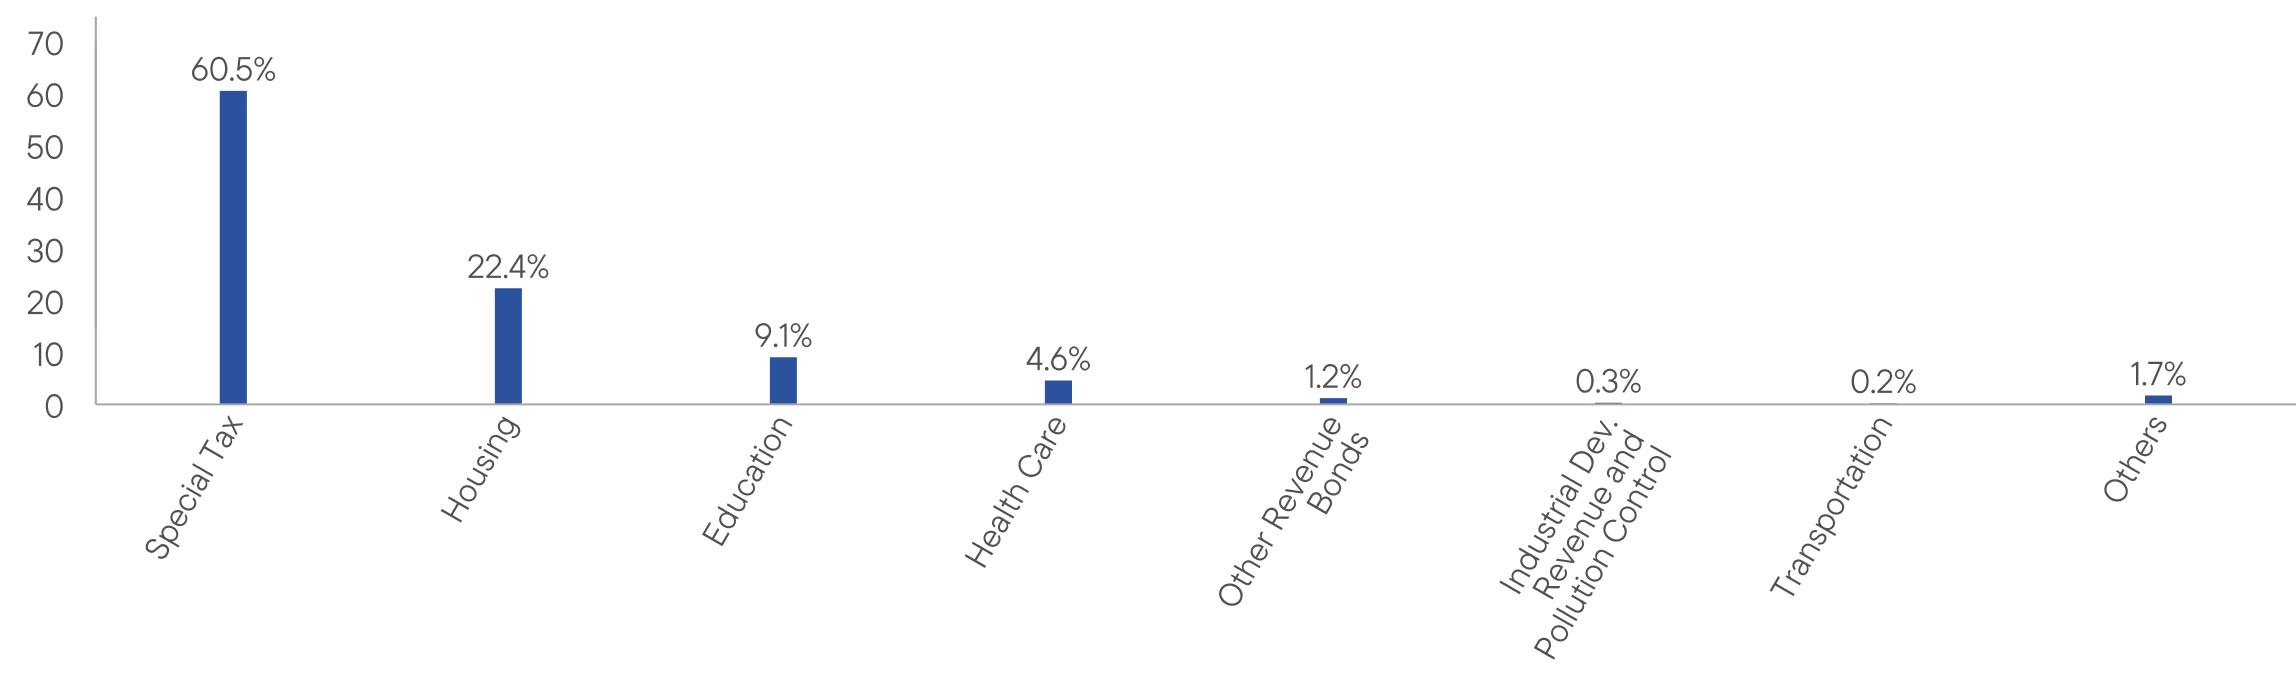
Portfolio Composition*
(% of Total Investments)
| * |
Does
not include derivatives, except purchased options, if any. |
|
|
|
|
WHERE
CAN I FIND ADDITIONAL INFORMATION ABOUT THE FUND? |
|
Additional
information is available on https://www.franklintempleton.com/regulatory-fund-documents,
including its: |
|
•
prospectus • proxy voting information • financial information • holdings • tax information |
| Franklin
Templeton SMACS: Series CH |
PAGE
1 |
3000-STSR-0426 |
true60.522.49.14.61.20.30.21.7
|
|
|
|
Franklin
Templeton SMACS: Series E |
|
|
Semi-Annual
Shareholder Report | February
28, 2026 |
|
|
This
semi-annual
shareholder report
contains important information about Franklin
Templeton SMACS: Series E for the period September
1, 2025, to February
28, 2026.
You
can find additional information about the Fund at https://www.franklintempleton.com/regulatory-fund-documents.
You can also request this information
by contacting us at (800)
DIAL BEN/342-5236.
|
|
|
|
Fund
Name |
Costs
of a $10,000 investment
|
Costs
paid as a percentage of a $10,000
investment*,†
|
|
Franklin
Templeton SMACS: Series E1
|
$
|
%
|
| * |
Reflects
fee waivers and/or expense reimbursements, without which expenses would have been higher. |
| 1 |
Does
not reflect the effect of fees and expenses associated with a separately managed account, or a management fee or other operating expenses
of the Fund. |
KEY
FUND STATISTICS (as
of February 28, 2026)
|
|
|
Total
Net Assets |
$531,218,082
|
|
Total
Number of Portfolio Holdings |
118
|
|
Portfolio
Turnover Rate |
54.54%
|
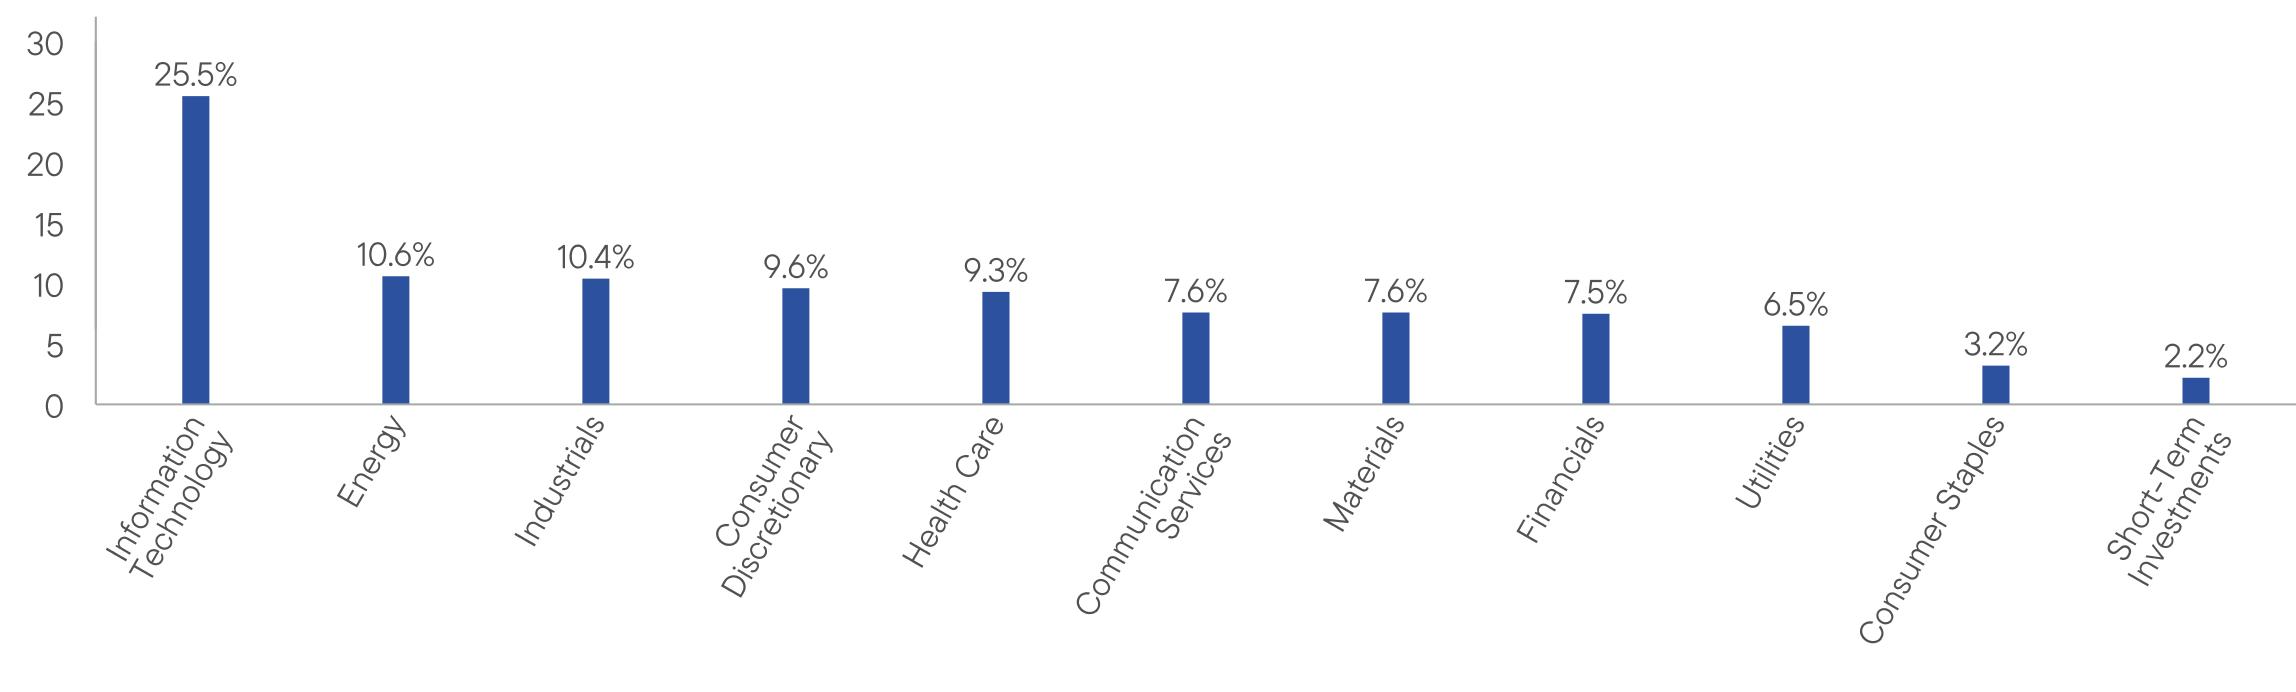
Portfolio Composition*
(% of Total Investments)
| * |
Does
not include derivatives, except purchased options, if any. |
|
|
|
|
WHERE
CAN I FIND ADDITIONAL INFORMATION ABOUT THE FUND? |
|
Additional
information is available on https://www.franklintempleton.com/regulatory-fund-documents,
including its: |
|
•
prospectus • proxy voting information • financial information • holdings • tax information |
| Franklin
Templeton SMACS: Series E |
PAGE
1 |
3001-STSR-0426 |
true25.510.610.49.69.37.67.67.56.53.22.2
|
|
|
|
Franklin
Templeton SMACS: Series H |
|
|
Semi-Annual
Shareholder Report | February
28, 2026 |
|
|
This
semi-annual
shareholder report
contains important information about Franklin
Templeton SMACS: Series H for the period September
1, 2025, to February
28, 2026.
You
can find additional information about the Fund at https://www.franklintempleton.com/regulatory-fund-documents.
You can also request this information
by contacting us at (800)
DIAL BEN/342-5236.
|
|
|
|
Fund
Name |
Costs
of a $10,000 investment
|
Costs
paid as a percentage of a $10,000
investment*,†
|
|
Franklin
Templeton SMACS: Series H1
|
$
|
%
|
| * |
Reflects
fee waivers and/or expense reimbursements, without which expenses would have been higher. |
| 1 |
Does
not reflect the effect of fees and expenses associated with a separately managed account, or a management fee or other operating expenses
of the Fund. |
KEY
FUND STATISTICS (as
of February 28, 2026)
|
|
|
Total
Net Assets |
$41,846,001
|
|
Total
Number of Portfolio Holdings |
223
|
|
Portfolio
Turnover Rate |
9.15%
|
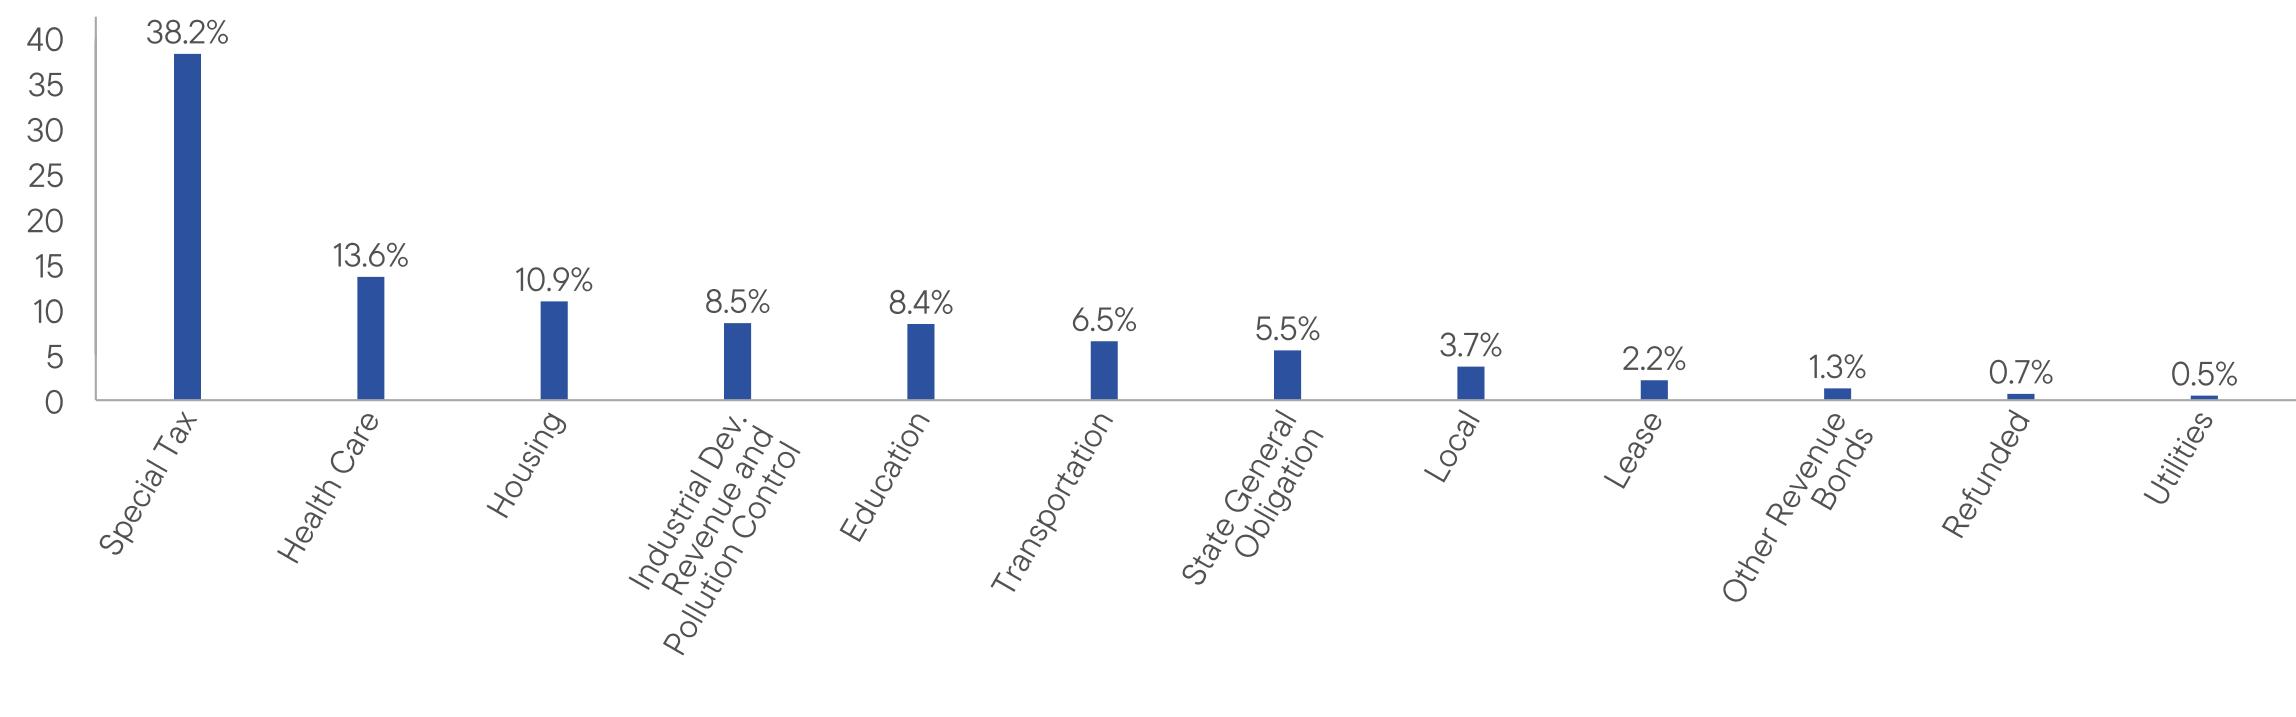
Portfolio Composition*
(% of Total Investments)
| * |
Does
not include derivatives, except purchased options, if any. |
|
|
|
|
WHERE
CAN I FIND ADDITIONAL INFORMATION ABOUT THE FUND? |
|
Additional
information is available on https://www.franklintempleton.com/regulatory-fund-documents,
including its: |
|
•
prospectus • proxy voting information • financial information • holdings • tax information |
| Franklin
Templeton SMACS: Series H |
PAGE
1 |
3002-STSR-0426 |
true38.213.610.98.58.46.55.53.72.21.30.70.5
|
|
|
|
Franklin
Templeton SMACS: Series I |
|
|
Semi-Annual
Shareholder Report | February
28, 2026 |
|
|
This
semi-annual
shareholder report
contains important information about Franklin
Templeton SMACS: Series I for the period September
1, 2025, to February
28, 2026.
You
can find additional information about the Fund at https://www.franklintempleton.com/regulatory-fund-documents.
You can also request this information
by contacting us at (800)
DIAL BEN/342-5236.
|
|
|
|
Fund
Name |
Costs
of a $10,000 investment
|
Costs
paid as a percentage of a $10,000
investment*,†
|
|
Franklin
Templeton SMACS: Series I1
|
$
|
%
|
| * |
Reflects
fee waivers and/or expense reimbursements, without which expenses would have been higher. |
| 1 |
Does
not reflect the effect of fees and expenses associated with a separately managed account, or a management fee or other operating expenses
of the Fund. |
KEY
FUND STATISTICS (as
of February 28, 2026)
|
|
|
Total
Net Assets |
$784,848,097
|
|
Total
Number of Portfolio Holdings |
178
|
|
Portfolio
Turnover Rate |
20.79%
|
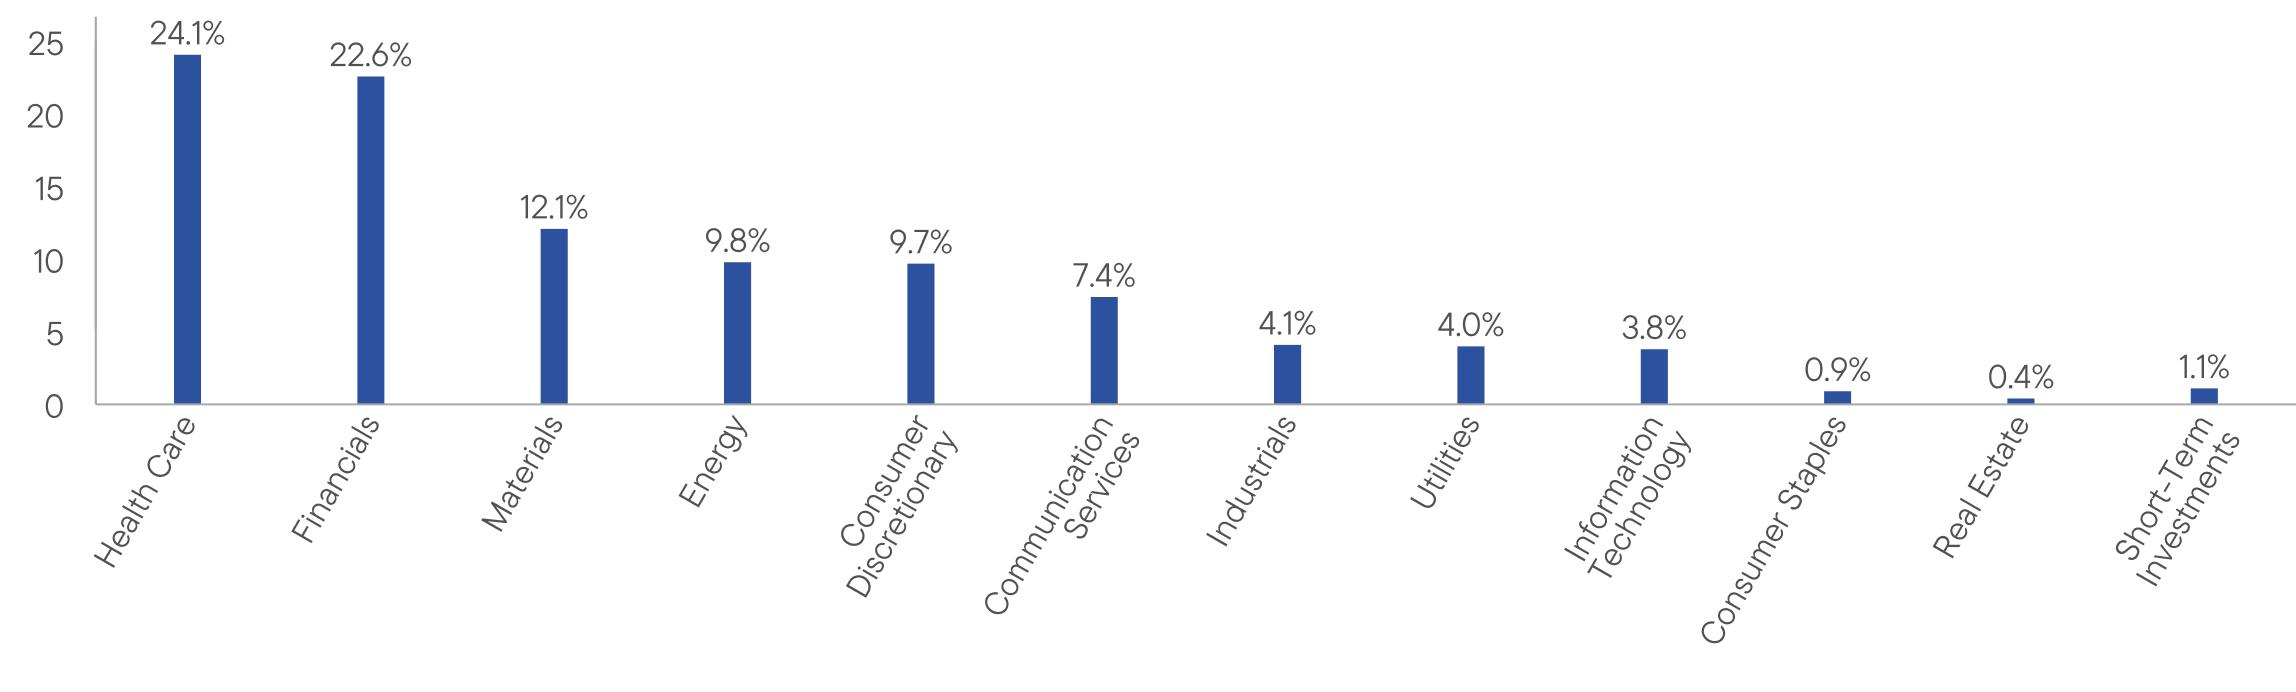
Portfolio Composition* (%
of Total Investments)
| * |
Does
not include derivatives, except purchased options, if any. |
|
|
|
|
WHERE
CAN I FIND ADDITIONAL INFORMATION ABOUT THE FUND? |
|
Additional
information is available on https://www.franklintempleton.com/regulatory-fund-documents,
including its: |
|
•
prospectus • proxy voting information • financial information • holdings • tax information |
| Franklin
Templeton SMACS: Series I |
PAGE
1 |
3003-STSR-0426 |
true24.122.612.19.89.77.44.14.03.80.90.41.1
(b) Not applicable
Not applicable
| ITEM 3. |
AUDIT COMMITTEE FINANCIAL EXPERT. |
Not applicable
|
ITEM 4. |
PRINCIPAL ACCOUNTANT FEES AND SERVICES. |
Not applicable.
| ITEM 5. |
AUDIT COMMITTEE OF LISTED REGISTRANTS. |
Not applicable.
| ITEM 6. |
SCHEDULE OF INVESTMENTS. |
|
(a) |
Please see schedule of investments contained in the Financial Statements and Financial
Highlights included under Item 7 of this Form N-CSR. |
|
ITEM 7. |
FINANCIAL STATEMENTS AND FINANCIAL HIGHLIGHTS FOR OPEN-END MANAGEMENT INVESTMENT COMPANIES. |
Franklin
Strategic
Series
Financial
Statements
and
Other
Important
Information
Semi-Annual
|
February
28,
2026
Franklin
Templeton
SMACS:
Series
CH
Franklin
Templeton
SMACS:
Series
E
Franklin
Templeton
SMACS:
Series
H
Franklin
Templeton
SMACS:
Series
I
If
you
need
assistance
accessing
this
content,
please
reach
out
to
your
sales
representative
or
send
an
email
to
accessibility@franklintempleton.com
.
Financial
Statements
and
Other
Important
Information—Semiannual
Financial
Highlights
and
Schedules
of
Investments
2
Financial
Statements
33
Notes
to
Financial
Statements
37
Changes
In
and
Disagreements
with
Accountants
49
Results
of
Meeting(s)
of
Shareholders
49
Remuneration
Paid
to
Directors,
Officers
and
Others
49
Board
Approval
of
Management
and
Subadvisory
Agreements
49
Franklin
Strategic
Series
Financial
Highlights
Franklin
Templeton
SMACS:
Series
CH
Semiannual
Report
The
accompanying
notes
are
an
integral
part
of
these
financial
statements.
a
Six
Months
Ended
February
28,
2026
(unaudited)
Year
Ended
August
31,
2025
2024
2023
2022
2021
Per
share
operating
performance
(for
a
share
outstanding
throughout
the
period)
Net
asset
value,
beginning
of
period
.....
$8.37
$8.96
$8.52
$8.85
$10.51
$9.82
Income
from
investment
operations
a
:
Net
investment
income
b
.............
0.24
0.48
0.45
0.39
0.36
0.35
Net
realized
and
unrealized
gains
(losses)
0.34
(0.60)
0.43
(0.32)
(1.66)
0.69
Total
from
investment
operations
........
0.58
(0.12)
0.88
0.07
(1.30)
1.04
Less
distributions
from:
Net
investment
income
..............
(0.24)
(0.47)
(0.44)
(0.40)
(0.36)
(0.35)
Net
asset
value,
end
of
period
..........
$8.71
$8.37
$8.96
$8.52
$8.85
$10.51
Total
return
c
.......................
6.93%
(1.39)%
10.75%
0.85%
(12.61)%
10.75%
Ratios
to
average
net
assets
d
Expenses
before
waiver
and
payments
by
affiliates
..........................
0.37%
0.55%
0.50%
2.48%
2.37%
3.11%
Expenses
net
of
waiver
and
payments
by
affiliates
..........................
—%
—%
e
—%
e
—%
e
—%
e
—%
e
Net
investment
income
...............
5.56%
5.49%
5.27%
4.56%
3.71%
3.44%
Supplemental
data
Net
assets,
end
of
period
(000’s)
........
$35,949
$27,407
$22,910
$3,898
$2,957
$3,512
Portfolio
turnover
rate
................
7.69%
28.21%
38.97%
45.25%
5.65%
2.74%
a
The
amount
shown
for
a
share
outstanding
throughout
the
period
may
not
correlate
with
the
Statement
of
Operations
for
the
period
due
to
the
timing
of
sales
and
repurchases
of
the
Fund’s
shares
in
relation
to
income
earned
and/or
fluctuating
fair
value
of
the
investments
of
the
Fund.
b
Based
on
average
daily
shares
outstanding.
c
Total
return
is
not
annualized
for
periods
less
than
one
year.
d
Ratios
are
annualized
for
periods
less
than
one
year.
e
Benefit
of
expense
reduction
rounds
to
less
than
0.01%.
Franklin
Strategic
Series
Schedule
of
Investments
(unaudited),
February
28,
2026
Franklin
Templeton
SMACS:
Series
CH
The
accompanying
notes
are
an
integral
part
of
these
financial
statements.
Semiannual
Report
a
a
Shares
a
Value
a
Common
Stocks
0.0%
Financial
Services
0.0%
a,b
Brightline
Train
Holdings
West
LLC
......................................
1,710
$
—
b
Total
Common
Stocks
(Cost
$
–
)
...............................................
—
Principal
Amount
a
a
a
a
Corporate
Bonds
0.7%
Diversified
Consumer
Services
0.7%
Grand
Canyon
University
,
Secured
Note
,
5.125
%
,
10/01/28
....................
$
250,000
251,396
Total
Corporate
Bonds
(Cost
$
235,360
)
........................................
251,396
Municipal
Bonds
95.1%
Arizona
1.5%
c
Maricopa
County
Industrial
Development
Authority
,
Grand
Canyon
University
Obligated
Group
,
Revenue
,
144A,
2024
,
7.375
%
,
10/01/29
..........................
505,000
545,244
California
93.2%
d
California
Community
Choice
Financing
Authority
,
Revenue
,
2026
A-1
,
Mandatory
Put
,
5
%
,
2/01/36
......................................................
100,000
111,068
c
California
Community
College
Financing
Authority
,
NCCD-Napa
Valley
Properties
LLC
,
Revenue
,
144A,
2022
A
,
5.75
%
,
7/01/60
................................
500,000
346,219
c
California
Community
Housing
Agency
,
Annadel
Apartments
,
Revenue
,
144A,
2019
A
,
5
%
,
4/01/49
..................
1,200,000
974,019
Arbors
Apartments
,
Revenue
,
144A,
2020
A
,
5
%
,
8/01/50
....................
350,000
335,677
Brio
Apartments
&
Next
on
Lex
Apartments
,
Revenue,
Sub.
Lien
,
144A,
2021
A-2
,
4
%
,
8/01/47
....................................................
200,000
161,520
Mira
Vista
Hills
Apartments
,
Revenue
,
144A,
2021
A
,
4
%
,
2/01/56
.............
300,000
147,991
Serenity
at
Larkspur
Apartments
,
Revenue
,
144A,
2020
A
,
5
%
,
2/01/50
.........
1,000,000
765,000
e
Twin
Creek
Apartments
,
Revenue,
Senior
Lien
,
144A,
2022
A-2
,
8.06
%,
8/01/65
...
1,250,000
50,482
California
Educational
Facilities
Authority
,
St.
Mary's
College
of
California
,
Revenue
,
2023
A
,
Refunding
,
5.5
%
,
10/01/53
....................................
1,000,000
997,206
c
California
Enterprise
Development
Authority
,
Real
Journey
Academies
Obligated
Group
,
Revenue
,
144A,
2024
A
,
5
%
,
6/01/54
.............................
500,000
493,380
California
Municipal
Finance
Authority
,
a
8
%
,
12/01/42
.....................................................
600,000
607,131
c,d
Revenue
,
144A,
2025
A-S
,
Mandatory
Put
,
8.125
%
,
8/01/44
..................
200,000
201,865
c
Revenue
,
144A,
2025
B
,
7.375
%
,
8/01/37
...............................
300,000
316,582
Revenue
,
2025
B
,
7.1
%
,
12/01/37
.....................................
250,000
256,732
Special
Tax
,
2024
D
,
5
%
,
9/01/54
......................................
280,000
282,414
Special
Tax
,
2025
C
,
5
%
,
9/01/55
......................................
500,000
501,567
c,d
4252
Crenshaw
Preservation
LLC
,
Revenue
,
144A,
2025
B-2
,
Mandatory
Put
,
9
%
,
6/01/36
........................................................
300,000
301,507
c
Ascent
613
,
Revenue
,
144A,
2025
A
,
5.375
%
,
1/01/55
......................
500,000
500,966
BOLD
Program
,
Special
Tax
,
2022
B
,
Refunding
,
6
%
,
9/01/52
................
150,000
159,046
BOLD
Program
,
Special
Tax
,
2022
C
,
6.25
%
,
9/01/52
.......................
150,000
160,238
BOLD
Program
,
Special
Tax
,
2022
D
,
6.125
%
,
9/01/52
......................
150,000
159,642
BOLD
Program
,
Special
Tax
,
2023
A
,
5.5
%
,
9/01/53
........................
100,000
104,931
BOLD
Program
,
Special
Tax
,
2023
C
,
5.25
%
,
9/01/53
.......................
1,000,000
1,026,053
BOLD
Program
,
Special
Tax
,
2024
A
,
5
%
,
9/01/48
.........................
100,000
102,091
c
CHF-Aptos
LLC
,
Revenue
,
144A,
2025
A
,
5.5
%
,
7/01/57
....................
250,000
252,880
c
CHF-Aptos
LLC
,
Revenue
,
144A,
2025
B
,
7.5
%
,
7/01/57
....................
250,000
252,790
c
Claremont
Graduate
University
,
Revenue
,
144A,
2020
B
,
Refunding
,
5
%
,
10/01/49
.
125,000
118,424
Community
Facilities
District
No.
2021-6
Improvement
Area
No.
2
,
Special
Tax
,
2022
,
6
%
,
9/01/52
....................................................
150,000
159,046
Community
Facilities
District
No.
2022-6
Improvement
Area
No.
2
,
Special
Tax
,
2025
,
5.375
%
,
9/01/55
.................................................
200,000
208,097
Franklin
Strategic
Series
Schedule
of
Investments
(unaudited)
Franklin
Templeton
SMACS:
Series
CH
(continued)
Semiannual
Report
The
accompanying
notes
are
an
integral
part
of
these
financial
statements.
a
a
Principal
Amount
a
Value
a
a
a
a
a
Municipal
Bonds
(continued)
California
(continued)
California
Municipal
Finance
Authority,
(continued)
Community
Facilities
District
No.
2023-11
Improvement
Area
No.
2
,
Special
Tax
,
2025
,
5.25
%
,
9/01/60
.............................................
$
500,000
$
503,699
Community
Facilities
District
No.
2023-5
Area
No.
1
,
Special
Tax
,
2023
,
5.8
%
,
9/01/53
........................................................
1,000,000
1,061,593
c,e
IH
Parkside
Fairfield
LLC
,
Revenue,
Sub.
Lien
,
144A,
2023
B
,
2.617
%,
9/01/43
...
250,000
198,362
LAX
Integrated
Express
Solutions
LLC
,
Revenue,
Senior
Lien
,
2018
A
,
4
%
,
12/31/47
70,000
63,036
Porter
1107
LLC
,
Revenue
,
2025
B
,
7.2
%
,
11/01/37
........................
300,000
311,220
c
St.
Mary
and
All
Angels
Christian
Church
,
Revenue
,
144A,
2024
A
,
5.75
%
,
5/01/54
.
200,000
202,229
c
Westside
Neighborhood
School
,
Revenue
,
144A,
2024
,
5.9
%
,
6/15/44
..........
150,000
160,755
c
Westside
Neighborhood
School
,
Revenue
,
144A,
2024
,
6.375
%
,
6/15/64
........
250,000
264,357
c
California
Public
Finance
Authority
,
Kendal
at
Sonoma
Obligated
Group
,
Revenue
,
144A,
2021
A
,
Refunding
,
5
%
,
11/15/46
.................................
1,250,000
1,188,118
c
California
School
Finance
Authority
,
Orange
County
Educational
Arts
Academy
,
Revenue
,
144A,
2023
A
,
Refunding
,
5.875
%
,
6/01/53
.......................
100,000
100,772
California
Statewide
Communities
Development
Authority
,
Special
Tax
,
2023
A
,
5.25
%
,
9/01/51
...................................
100,000
103,313
Special
Tax
,
2025
B
,
5
%
,
9/02/55
......................................
500,000
512,999
Community
Facilities
District
No.
2021-1
,
Special
Tax
,
2023
,
5
%
,
9/01/53
........
150,000
152,516
Community
Facilities
District
No.
2022-03
,
Special
Tax
,
2023
,
5
%
,
9/01/53
.......
150,000
152,327
Community
Facilities
District
No.
2022-07
Improvement
Area
No.
1
,
Special
Tax
,
2023
,
5
%
,
9/01/53
................................................
150,000
152,800
Community
Facilities
District
No.
2023-08
Improvement
Area
No.
1
,
Special
Tax
,
2025
,
5.25
%
,
9/01/55
.............................................
300,000
307,251
Community
Facilities
District
No.
2024-9
,
Special
Tax
,
2024
,
5
%
,
9/01/54
........
100,000
101,418
Community
Infrastructure
Program
Assessment
District
No.
20-02
,
Special
Assessment
,
2023
,
5.75
%
,
9/02/53
...................................
985,000
1,026,258
d
Foothill
Oak
Park
Apartments
LLC
,
Revenue
,
2025
H-S-A
,
Mandatory
Put
,
7.5
%
,
3/01/36
........................................................
300,000
304,831
c
Loma
Linda
University
Medical
Center
Obligated
Group
,
Revenue
,
144A,
2016
A
,
5.25
%
,
12/01/56
.................................................
250,000
250,137
c
NCCD-Hooper
Street
LLC
,
Revenue
,
144A,
2019
,
5.25
%
,
7/01/49
.............
100,000
100,432
c
NCCD-Hooper
Street
LLC
,
Revenue
,
144A,
2019
,
5.25
%
,
7/01/52
.............
200,000
200,144
Chino
Community
Facilities
District
,
Community
Facilities
District
No.
2021-1
,
Special
Tax
,
2023
,
5.625
%
,
9/01/53
..........................................
1,000,000
1,058,424
c
City
&
County
of
San
Francisco
,
Community
Facilities
District
No.
2016-1
Improvement
Area
No.
2
,
Special
Tax
,
144A,
2023
A
,
5.25
%
,
9/01/48
............................................
965,000
994,140
District
No.
2020-1
Shoreline
Tax
Zone
1
,
Special
Tax
,
144A,
2023
C
,
5.75
%
,
9/01/53
1,500,000
1,579,040
City
of
Dublin
,
Community
Facilities
District
No.
2015-1
Improvement
Area
No.
5
,
Special
Tax
,
2023
,
5.375
%
,
9/01/51
....................................
1,250,000
1,294,634
City
of
Lake
Elsinore
,
Community
Facilities
District
No.
2006-8
,
Special
Tax
,
2023
,
5
%
,
9/01/53
........
150,000
151,978
Community
Facilities
District
No.
2015-4
,
Special
Tax
,
2026
,
5
%
,
9/01/55
........
650,000
659,910
City
of
Rancho
Cordova
,
Arista
Del
Sol
Community
Facilities
District
No.
2022-1
Improvement
Area
No.
1
,
Special
Tax
,
2023
,
5.375
%
,
9/01/53
...................................
200,000
207,013
Preserve
(The)
Community
Facilities
District
No.
2025-1
Improvement
Area
,
Special
Tax
,
2026
,
5
%
,
9/01/55
............................................
650,000
656,944
f
City
of
Rialto
,
Community
Facilities
District
No.
2024-1
,
Special
Tax
,
2026
,
5
%
,
9/01/55
500,000
508,362
c
CSCDA
Community
Improvement
Authority
,
CTR
City
Anaheim
,
Revenue
,
144A,
2020
A
,
5
%
,
1/01/54
....................
400,000
356,902
Dublin
,
Revenue
,
144A,
2021
B
,
4
%
,
2/01/57
.............................
140,000
108,596
Eastern
Municipal
Water
District
,
Community
Facilities
District
No.
2022-97
Improvement
Area
A
,
Special
Tax
,
2026
,
5
%
,
9/01/55
.......................
500,000
505,721
Galt
Community
Facilities
District
,
City
of
Galt
Community
Facilities
District
No.
2020-2
Improvement
Area
No.
1
,
Special
Tax
,
2023
A
,
6
%
,
9/01/53
..................
1,500,000
1,604,494
Franklin
Strategic
Series
Schedule
of
Investments
(unaudited)
Franklin
Templeton
SMACS:
Series
CH
(continued)
The
accompanying
notes
are
an
integral
part
of
these
financial
statements.
Semiannual
Report
a
a
Principal
Amount
a
Value
a
a
a
a
a
Municipal
Bonds
(continued)
California
(continued)
c
Golden
State
Connect
Authority
,
Revenue
,
144A,
2025
,
6.5
%
,
12/01/60
...........
$
300,000
$
303,402
f
Hemet
Unified
School
District
,
Community
Facilities
District
No.
2020-2
Improvement
Area
No.
1
,
Special
Tax
,
2026
,
5
%
,
9/01/56
..............................
500,000
508,659
Lammersville
Joint
Unified
School
District
,
Community
Facilities
District
No.
2024-1
,
Special
Tax
,
2025
,
5.25
%
,
9/01/55
.....................................
250,000
260,082
c
Los
Angeles
Housing
Authority
,
Housing
Pathways,
Inc.
,
Revenue
,
144A,
2024
B
,
6
%
,
12/01/62
........................................................
600,000
584,280
Moreno
Valley
Unified
School
District
,
Community
Facilities
District
No.
2022-1
,
Special
Tax
,
2025
,
5.125
%
,
9/01/55
.....
250,000
253,695
Community
Facilities
District
No.
2023-1
,
Special
Tax
,
2025
,
5
%
,
9/01/55
........
250,000
252,791
Orange
County
Community
Facilities
District
,
Community
Facilities
District
No.
2023-1
,
Special
Tax
,
2023
A
,
5.5
%
,
8/15/53
....................................
1,000,000
1,044,569
River
Islands
Public
Financing
Authority
,
Community
Facilities
District
2023-1
Area
No.
1
,
Special
Tax
,
2023
,
5.625
%
,
9/01/53
1,000,000
1,038,576
Community
Facilities
District
2023-1
Improvement
Area
No.
3
,
Special
Tax
,
2025
,
Refunding
,
5
%
,
9/01/55
............................................
400,000
399,496
Community
Facilities
District
No.
2023-1
Improvement
Area
No.
2
,
Special
Tax
,
2024
,
5
%
,
9/01/54
....................................................
670,000
670,236
Root
Creek
Water
District
,
Community
Facilities
District
No.
2016-1
Improvement
Area
No.
3
,
Special
Tax
,
2025
,
5.25
%
,
9/01/55
................................
225,000
229,820
c,e
Santa
Barbara
Housing
Authority
,
Revenue
,
144A,
2025
A-S
,
7.95
%,
5/01/44
......
1,000,000
249,037
Stockton
Community
Facilities
District
,
Community
Facilities
District
No.
2018-2
Improvement
Area
No.
4
,
Special
Tax
,
2025
,
5
%
,
9/01/55
....................
400,000
403,364
Washington
Township
Health
Care
District
,
Revenue
,
2023
A
,
5.75
%
,
7/01/48
......
150,000
159,984
33,517,280
U.S.
Territories
0.4%
Puerto
Rico
0.4%
GDB
Debt
Recovery
Authority
of
Puerto
Rico
,
7.5
%
,
8/20/40
...................
127,651
125,550
Total
Municipal
Bonds
(Cost
$
33,108,008
)
......................................
34,188,074
Total
Long
Term
Investments
(Cost
$
33,343,368
)
................................
34,439,470
a
a
a
a
a
Short
Term
Investments
5.6%
Municipal
Bonds
5.6%
California
5.6%
g
California
Municipal
Finance
Authority
,
Boone
534
LLC
,
Revenue
,
2026
B
,
Daily
VRDN
and
Put
,
7.1
%
,
2/01/38
..............................................
500,000
504,125
g
University
of
California
,
Revenue
,
2013
AL-1
,
Daily
VRDN
and
Put
,
1.2
%
,
5/15/48
...................
200,000
200,000
Revenue
,
2013
AL-3
,
Refunding
,
Daily
VRDN
and
Put
,
1.25
%
,
5/15/48
..........
300,000
300,000
Revenue
,
2013
AL-4
,
Refunding
,
Daily
VRDN
and
Put
,
1.35
%
,
5/15/48
..........
1,000,000
1,000,000
2,004,125
Total
Municipal
Bonds
(Cost
$
2,000,000
)
.......................................
2,004,125
Total
Short
Term
Investments
(Cost
$
2,000,000
)
.................................
2,004,125
a
Total
Investments
(Cost
$
35,343,368
)
101.4
%
...................................
$36,443,595
Other
Assets,
less
Liabilities
(
1.4
)
%
...........................................
(494,718)
Net
Assets
100.0%
...........................................................
$35,948,877
Franklin
Strategic
Series
Schedule
of
Investments
(unaudited)
Franklin
Templeton
SMACS:
Series
CH
(continued)
Semiannual
Report
The
accompanying
notes
are
an
integral
part
of
these
financial
statements.
See
A
bbreviations
on
page
48
.
a
Fair
valued
using
significant
unobservable
inputs.
See
Note
9
regarding
fair
value
measurements.
b
Non-income
producing.
c
Security
was
purchased
pursuant
to
Rule
144A
or
Regulation
S
under
the
Securities
Act
of
1933.
144A
securities
may
be
sold
in
transactions
exempt
from
registration
only
to
qualified
institutional
buyers
or
in
a
public
offering
registered
under
the
Securities
Act
of
1933.
Regulation
S
securities
cannot
be
sold
in
the
United
States
without
either
an
effective
registration
statement
filed
pursuant
to
the
Securities
Act
of
1933,
or
pursuant
to
an
exemption
from
registration.
At
February
28,
2026,
the
aggregate
value
of
these
securities
was
$12,605,249,
representing
35.1%
of
net
assets.
d
The
maturity
date
shown
represents
the
mandatory
put
date.
e
The
rate
shown
represents
the
yield
at
period
end.
f
Security
purchased
on
a
when-issued
basis.
See
Note
1(c).
g
Variable
rate
demand
notes
(VRDN)
are
obligations
which
contain
a
floating
or
variable
interest
rate
adjustment
formula
and
an
unconditional
right
of
demand
to
receive
pay-
ment
of
the
principal
balance
plus
accrued
interest
at
specified
dates.
Unless
otherwise
noted,
the
coupon
rate
is
determined
based
on
factors
including
supply
and
demand,
underlying
credit,
tax
treatment,
and
current
short
term
rates.
The
coupon
rate
shown
represents
the
rate
at
period
end.
Franklin
Strategic
Series
Financial
Highlights
Franklin
Templeton
SMACS:
Series
E
The
accompanying
notes
are
an
integral
part
of
these
financial
statements.
Semiannual
Report
a
Six
Months
Ended
February
28,
2026
(unaudited)
Year
Ended
August
31,
2025
2024
2023
2022
2021
Per
share
operating
performance
(for
a
share
outstanding
throughout
the
period)
Net
asset
value,
beginning
of
period
.....
$13.48
$12.77
$11.56
$11.29
$12.77
$10.15
Income
from
investment
operations
a
:
Net
investment
income
b
.............
0.20
0.33
0.37
0.42
0.37
0.35
Net
realized
and
unrealized
gains
(losses)
1.27
1.18
1.60
0.75
(0.31)
2.72
Total
from
investment
operations
........
1.47
1.51
1.97
1.17
0.06
3.07
Less
distributions
from:
Net
investment
income
..............
(0.48)
(0.80)
(0.76)
(0.72)
(0.83)
(0.45)
Net
realized
gains
.................
—
—
—
(0.18)
(0.71)
—
Tax
return
of
capital
................
—
—
—
(—)
c
—
—
Total
distributions
...................
(0.48)
(0.80)
(0.76)
(0.90)
(1.54)
(0.45)
Net
asset
value,
end
of
period
..........
$14.47
$13.48
$12.77
$11.56
$11.29
$12.77
Total
return
d
.......................
11.10%
12.34%
17.78%
10.81%
0.38%
30.95%
Ratios
to
average
net
assets
e
Expenses
before
waiver
and
payments
by
affiliates
..........................
0.05%
0.08%
0.10%
0.27%
1.36%
2.19%
Expenses
net
of
waiver
and
payments
by
affiliates
..........................
—%
—%
—%
—%
f
—%
—%
f
Net
investment
income
...............
2.82%
2.62%
3.12%
3.70%
3.11%
3.05%
Supplemental
data
Net
assets,
end
of
period
(000’s)
........
$531,218
$413,849
$217,932
$61,992
$12,863
$5,155
Portfolio
turnover
rate
................
54.54%
103.34%
93.40%
123.80%
117.70%
49.90%
a
The
amount
shown
for
a
share
outstanding
throughout
the
period
may
not
correlate
with
the
Statement
of
Operations
for
the
period
due
to
the
timing
of
sales
and
repurchases
of
the
Fund’s
shares
in
relation
to
income
earned
and/or
fluctuating
fair
value
of
the
investments
of
the
Fund.
b
Based
on
average
daily
shares
outstanding.
c
Amount
rounds
to
less
than
$0.01
per
share.
d
Total
return
is
not
annualized
for
periods
less
than
one
year.
e
Ratios
are
annualized
for
periods
less
than
one
year.
f
Benefit
of
expense
reduction
rounds
to
less
than
0.01%.
Franklin
Strategic
Series
Schedule
of
Investments
(unaudited),
February
28,
2026
Franklin
Templeton
SMACS:
Series
E
Semiannual
Report
The
accompanying
notes
are
an
integral
part
of
these
financial
statements.
a
a
Country
Shares
a
Value
a
a
a
a
a
a
Common
Stocks
33.2%
Aerospace
&
Defense
2.0%
a
Boeing
Co.
(The)
...................................
United
States
15,000
$
3,412,950
Northrop
Grumman
Corp.
.............................
United
States
10,000
7,243,800
10,656,750
Air
Freight
&
Logistics
1.0%
United
Parcel
Service,
Inc.
,
B
..........................
United
States
44,000
5,102,240
Banks
2.7%
Bank
of
America
Corp.
...............................
United
States
26,000
1,295,580
Fifth
Third
Bancorp
..................................
United
States
135,000
6,678,450
Truist
Financial
Corp.
................................
United
States
69,000
3,402,390
US
Bancorp
.......................................
United
States
50,000
2,733,000
14,109,420
Biotechnology
1.1%
AbbVie,
Inc.
.......................................
United
States
25,000
5,802,000
Capital
Markets
0.5%
BlackRock,
Inc.
.....................................
United
States
2,500
2,658,075
Diversified
Telecommunication
Services
1.0%
Comcast
Corp.
,
A
...................................
United
States
175,000
5,418,000
Electric
Utilities
0.6%
Xcel
Energy,
Inc.
....................................
United
States
40,000
3,334,400
Energy
Equipment
&
Services
1.5%
SLB
Ltd.
..........................................
United
States
150,000
7,701,000
Ground
Transportation
0.9%
Norfolk
Southern
Corp.
...............................
United
States
15,000
4,721,100
Health
Care
Equipment
&
Supplies
1.2%
Medtronic
plc
......................................
United
States
65,000
6,347,900
Health
Care
Providers
&
Services
3.0%
UnitedHealth
Group,
Inc.
..............................
United
States
54,279
15,918,402
Hotels,
Restaurants
&
Leisure
1.8%
McDonald's
Corp.
...................................
United
States
20,000
6,821,200
Starbucks
Corp.
....................................
United
States
30,000
2,940,600
9,761,800
IT
Services
1.0%
Accenture
plc
,
A
....................................
United
States
25,000
5,218,000
Machinery
0.8%
Caterpillar,
Inc.
.....................................
United
States
6,000
4,456,980
Metals
&
Mining
0.3%
Freeport-McMoRan,
Inc.
..............................
United
States
19,962
1,359,013
Oil,
Gas
&
Consumable
Fuels
5.1%
Chevron
Corp.
.....................................
United
States
40,000
7,470,400
Shell
plc
..........................................
United
States
225,000
9,423,647
TotalEnergies
SE
...................................
France
130,000
10,444,200
27,338,247
Pharmaceuticals
1.2%
Bristol-Myers
Squibb
Co.
..............................
United
States
36,987
2,306,879
Pfizer,
Inc.
.........................................
United
States
150,000
4,147,500
6,454,379
Franklin
Strategic
Series
Schedule
of
Investments
(unaudited)
Franklin
Templeton
SMACS:
Series
E
(continued)
The
accompanying
notes
are
an
integral
part
of
these
financial
statements.
Semiannual
Report
a
a
Country
Shares
a
Value
a
a
a
a
a
a
Common
Stocks
(continued)
Semiconductors
&
Semiconductor
Equipment
2.8%
Analog
Devices,
Inc.
.................................
United
States
21,200
$
7,542,748
Broadcom,
Inc.
.....................................
United
States
20,000
6,391,000
QUALCOMM,
Inc.
...................................
United
States
7,497
1,067,273
15,001,021
Software
1.3%
Oracle
Corp.
.......................................
United
States
25,000
3,635,000
Salesforce,
Inc.
.....................................
United
States
16,200
3,155,598
6,790,598
Specialty
Retail
0.5%
Home
Depot,
Inc.
(The)
...............................
United
States
6,990
2,661,233
Textiles,
Apparel
&
Luxury
Goods
0.5%
NIKE,
Inc.
,
B
.......................................
United
States
43,000
2,673,740
Tobacco
2.4%
Philip
Morris
International,
Inc.
.........................
United
States
67,500
12,611,025
Total
Common
Stocks
(Cost
$
146,819,253
)
...................................
176,095,323
b
Equity-Linked
Securities
49.6%
Aerospace
&
Defense
0.7%
c
Goldman
Sachs
Bank
USA
into
RTX
Corp.
,
144A,
7.5
%
,
3/31/26
United
States
25,000
3,632,390
Air
Freight
&
Logistics
0.2%
c
Toronto-Dominion
Bank
(The)
into
United
Parcel
Service,
Inc.
,
144A,
10
%
,
8/05/26
................................
United
States
10,000
1,127,159
Banks
0.1%
c
JPMorgan
Chase
Bank
NA
into
Truist
Financial
Corp.
,
144A,
9.5
%
,
3/02/26
....................................
United
States
12,000
592,047
Biotechnology
2.0%
c
Barclays
Bank
plc
into
AbbVie,
Inc.
,
144A,
8.5
%
,
12/11/26
.....
United
States
11,000
2,553,184
c
Mizuho
Markets
Cayman
LP
into
Amgen,
Inc.
,
144A,
10
%
,
6/15/26
.........................................
United
States
10,400
3,316,757
c
Morgan
Stanley
Finance
LLC
into
Amgen,
Inc.
,
144A,
8
%
,
12/16/26
........................................
United
States
12,500
4,549,521
10,419,462
Broadline
Retail
2.6%
c
Barclays
Bank
plc
into
Amazon.com,
Inc.
,
144A,
10
%
,
3/25/26
..
United
States
12,500
2,670,377
c
Toronto-Dominion
Bank
(The)
into
Amazon.com,
Inc.
,
144A,
10
%
,
3/31/26
.........................................
United
States
22,800
4,843,312
c
Toronto-Dominion
Bank
(The)
into
Amazon.com,
Inc.
,
144A,
10
%
,
10/13/26
........................................
United
States
5,500
1,165,803
c
Wells
Fargo
Bank
NA
into
Amazon.com,
Inc.
,
144A,
9
%
,
2/26/27
United
States
25,000
5,109,226
13,788,718
Capital
Markets
0.7%
c
Merrill
Lynch
BV
into
Charles
Schwab
Corp.
(The)
,
144A,
8
%
,
3/03/27
.........................................
United
States
39,000
3,726,111
Chemicals
0.3%
c
BofA
Finance
LLC
into
Albemarle
Corp.
,
144A,
12.5
%
,
8/28/26
.
United
States
5,000
531,956
c
Toronto-Dominion
Bank
(The)
into
Albemarle
Corp.
,
144A,
15
%
,
12/23/26
........................................
United
States
6,884
1,049,931
1,581,887
Franklin
Strategic
Series
Schedule
of
Investments
(unaudited)
Franklin
Templeton
SMACS:
Series
E
(continued)
Semiannual
Report
The
accompanying
notes
are
an
integral
part
of
these
financial
statements.
a
a
Country
Shares
a
Value
a
a
a
a
a
a
b
Equity-Linked
Securities
(continued)
Communications
Equipment
0.4%
c
Royal
Bank
of
Canada
into
Cisco
Systems,
Inc.
,
144A,
7.5
%
,
3/18/26
.........................................
United
States
30,000
$
2,186,406
Consumer
Staples
Distribution
&
Retail
0.8%
c
BNP
Paribas
Issuance
BV
into
Target
Corp.
,
144A,
11
%
,
10/07/26
United
States
16,000
1,646,540
c
Toronto-Dominion
Bank
(The)
into
Target
Corp.
,
144A,
12
%
,
6/30/26
.........................................
United
States
25,000
2,717,969
4,364,509
Diversified
Telecommunication
Services
0.4%
c
Merrill
Lynch
BV
into
Comcast
Corp.
,
144A,
8.5
%
,
6/22/26
.....
United
States
64,923
2,067,871
Electric
Utilities
2.0%
c
BNP
Paribas
Issuance
BV
into
NextEra
Energy,
Inc.
,
144A,
8
%
,
2/10/27
.........................................
United
States
48,000
4,333,574
c
Citigroup
Global
Markets
Holdings,
Inc.
into
NextEra
Energy,
Inc.
,
144A,
9
%
,
10/05/26
................................
United
States
65,000
5,113,006
c
Wells
Fargo
Bank
NA
into
NextEra
Energy,
Inc.
,
144A,
9.5
%
,
10/22/26
........................................
United
States
12,000
1,078,571
10,525,151
Energy
Equipment
&
Services
2.8%
c
Barclays
Bank
plc
into
Halliburton
Co.
,
144A,
10
%
,
5/21/26
....
United
States
186,567
4,703,306
c
Citigroup
Global
Markets
Holdings,
Inc.
into
Halliburton
Co.
,
144A,
10
%
,
1/21/27
................................
United
States
50,000
1,716,953
c
UBS
AG
into
Schlumberger
NV
,
144A,
10
%
,
2/11/27
.........
United
States
55,000
2,776,487
c
Wells
Fargo
Bank
NA
into
Schlumberger
NV
,
144A,
9
%
,
10/02/26
United
States
130,000
5,456,110
14,652,856
Health
Care
Equipment
&
Supplies
0.1%
c
Toronto-Dominion
Bank
(The)
into
Medtronic
plc
,
144A,
8
%
,
4/13/26
.........................................
United
States
8,000
786,434
Health
Care
Providers
&
Services
0.6%
c
Merrill
Lynch
BV
into
UnitedHealth
Group,
Inc.
,
144A,
10
%
,
7/01/26
.........................................
United
States
1,854
560,267
c
Wells
Fargo
Bank
NA
into
CVS
Health
Corp.
,
144A,
10
%
,
4/09/26
United
States
33,000
2,588,382
3,148,649
Hotels,
Restaurants
&
Leisure
1.5%
c
Toronto-Dominion
Bank
(The)
into
Starbucks
Corp.
,
144A,
9
%
,
1/27/27
.........................................
United
States
60,000
5,778,394
c
Wells
Fargo
Bank
NA
into
Starbucks
Corp.
,
144A,
9
%
,
8/10/26
.
United
States
25,500
2,498,375
8,276,769
Interactive
Media
&
Services
6.2%
c
BNP
Paribas
Issuance
BV
into
Meta
Platforms,
Inc.
,
144A,
10
%
,
12/29/26
........................................
United
States
8,000
5,290,994
c
Citigroup
Global
Markets
Holdings,
Inc.
into
Alphabet,
Inc.
,
144A,
9
%
,
12/23/26
.....................................
United
States
16,800
5,346,524
c
Merrill
Lynch
BV
into
Alphabet,
Inc.
,
144A,
9
%
,
12/23/26
......
United
States
17,200
5,483,098
c
Mizuho
Markets
Cayman
LP
into
Meta
Platforms,
Inc.
,
144A,
10
%
,
12/07/26
....................................
United
States
1,500
959,534
c
National
Bank
of
Canada
into
Meta
Platforms,
Inc.
,
144A,
10
%
,
12/29/26
........................................
United
States
8,000
5,301,409
c
UBS
AG
into
Alphabet,
Inc.
,
144A,
9
%
,
4/16/26
.............
United
States
20,000
3,545,707
c
Wells
Fargo
Bank
NA
into
Alphabet,
Inc.
,
144A,
9
%
,
3/31/26
...
United
States
36,000
6,896,136
32,823,402
Franklin
Strategic
Series
Schedule
of
Investments
(unaudited)
Franklin
Templeton
SMACS:
Series
E
(continued)
The
accompanying
notes
are
an
integral
part
of
these
financial
statements.
Semiannual
Report
a
a
Country
Shares
a
Value
a
a
a
a
a
a
b
Equity-Linked
Securities
(continued)
IT
Services
2.5%
c
Citigroup
Global
Markets
Holdings,
Inc.
into
International
Business
Machines
Corp.
,
144A,
8.5
%
,
8/21/26
...........
United
States
13,500
$
3,199,492
c
Morgan
Stanley
Finance
LLC
into
International
Business
Machines
Corp.
,
144A,
8
%
,
4/08/27
....................
United
States
30,000
7,521,141
c
UBS
AG
into
Accenture
plc
,
144A,
8
%
,
7/13/26
.............
United
States
12,400
2,699,569
13,420,202
Metals
&
Mining
4.0%
c
Barclays
Bank
plc
into
Freeport-McMoRan,
Inc.
,
144A,
10
%
,
1/27/27
.........................................
United
States
17,000
999,361
c
BNP
Paribas
Issuance
BV
into
Freeport-McMoRan,
Inc.
,
144A,
10
%
,
8/28/26
.....................................
United
States
19,000
917,120
c
Citigroup
Global
Markets
Holdings,
Inc.
into
Freeport-McMoRan,
Inc.
,
144A,
12
%
,
6/09/26
............................
United
States
149,300
6,967,022
c
J.P.
Morgan
Structured
Products
BV
into
Freeport-McMoRan,
Inc.
,
144A,
10
%
,
5/19/26
............................
United
States
107,000
4,925,802
c
Merrill
Lynch
BV
into
Freeport-McMoRan,
Inc.
,
144A,
10
%
,
5/12/26
.........................................
United
States
22,869
1,045,188
c
Morgan
Stanley
Finance
LLC
into
Freeport-McMoRan,
Inc.
,
144A,
10
%
,
11/18/26
....................................
United
States
142,593
6,412,053
21,266,546
Oil,
Gas
&
Consumable
Fuels
1.2%
c
Mizuho
Markets
Cayman
LP
into
Exxon
Mobil
Corp.
,
144A,
8.5
%
,
4/07/26
.........................................
United
States
20,000
2,559,209
c
Royal
Bank
of
Canada
into
BP
plc
,
144A,
10
%
,
10/07/26
......
United
States
100,000
3,703,886
6,263,095
Pharmaceuticals
0.5%
c
Barclays
Bank
plc
into
Merck
&
Co.,
Inc.
,
144A,
8.5
%
,
10/02/26
.
United
States
29,000
2,850,331
Semiconductors
&
Semiconductor
Equipment
13.0%
c
Bank
of
America
NA
into
Microchip
Technology,
Inc.
,
144A,
11
%
,
9/03/26
.........................................
United
States
19,651
1,396,503
c
Barclays
Bank
plc
into
Microchip
Technology,
Inc.
,
144A,
10
%
,
6/23/26
.........................................
United
States
16,000
1,174,784
c
Barclays
Bank
plc
into
Micron
Technology,
Inc.
,
144A,
10
%
,
9/08/26
.........................................
United
States
32,500
4,941,869
c
BNP
Paribas
Issuance
BV
into
Advanced
Micro
Devices,
Inc.
,
144A,
10
%
,
3/02/26
................................
United
States
27,000
3,872,884
c
BNP
Paribas
Issuance
BV
into
Microchip
Technology,
Inc.
,
144A,
11
%
,
5/18/26
.....................................
United
States
153,820
9,871,586
c
Citigroup
Global
Markets
Holdings,
Inc.
into
Intel
Corp.
,
144A,
10
%
,
3/03/26
.....................................
United
States
19,000
673,934
c
Goldman
Sachs
Bank
USA
into
Applied
Materials,
Inc.
,
144A,
10
%
,
5/05/26
.....................................
United
States
29,000
4,901,909
c
J.P.
Morgan
Structured
Products
BV
into
Taiwan
Semiconductor
Manufacturing
Co.
Ltd.
,
144A,
10
%
,
4/15/26
..............
Taiwan
15,000
3,243,477
c
JPMorgan
Chase
Bank
NA
into
Marvell
Technology,
Inc.
,
144A,
12
%
,
1/07/27
.....................................
United
States
55,000
4,640,266
c
Merrill
Lynch
BV
into
Advanced
Micro
Devices,
Inc.
,
144A,
11
%
,
5/06/26
.........................................
United
States
53,614
5,955,713
c
Mizuho
Markets
Cayman
LP
into
Analog
Devices,
Inc.
,
144A,
8.5
%
,
5/18/26
....................................
United
States
13,000
3,047,299
c
Royal
Bank
of
Canada
into
Microchip
Technology,
Inc.
,
144A,
11
%
,
5/05/26
.....................................
United
States
62,000
3,566,896
c
Royal
Bank
of
Canada
into
Texas
Instruments,
Inc.
,
144A,
8.5
%
,
8/20/26
.........................................
United
States
12,500
2,480,981
Franklin
Strategic
Series
Schedule
of
Investments
(unaudited)
Franklin
Templeton
SMACS:
Series
E
(continued)
Semiannual
Report
The
accompanying
notes
are
an
integral
part
of
these
financial
statements.
a
a
Country
Shares
a
Value
a
a
a
a
a
a
b
Equity-Linked
Securities
(continued)
Semiconductors
&
Semiconductor
Equipment
(continued)
c
Royal
Bank
of
Canada
into
Texas
Instruments,
Inc.
,
144A,
9
%
,
7/21/26
.........................................
United
States
7,000
$
1,497,300
c
Toronto-Dominion
Bank
(The)
into
Intel
Corp.
,
144A,
10.5
%
,
9/01/26
.........................................
United
States
23,000
716,832
c
Toronto-Dominion
Bank
(The)
into
QUALCOMM,
Inc.
,
144A,
10
%
,
11/25/26
........................................
United
States
4,500
677,332
c
UBS
AG
into
Marvell
Technology,
Inc.
,
144A,
12
%
,
5/14/26
....
United
States
67,000
4,935,339
c
UBS
AG
into
Marvell
Technology,
Inc.
,
144A,
12
%
,
12/16/26
...
United
States
78,000
6,829,503
c
UBS
AG
into
Texas
Instruments,
Inc.
,
144A,
10
%
,
2/24/27
.....
United
States
22,500
4,900,162
69,324,569
Software
3.1%
c
Citigroup
Global
Markets
Holdings,
Inc.
into
Workday,
Inc.
,
144A,
10
%
,
2/24/27
.....................................
United
States
9,450
1,313,871
c
J.P.
Morgan
Structured
Products
BV
into
Microsoft
Corp.
,
144A,
7
%
,
10/15/26
.....................................
United
States
8,000
3,321,664
c
Mizuho
Markets
Cayman
LP
into
Microsoft
Corp.
,
144A,
7.25
%
,
1/11/27
.........................................
United
States
8,500
3,550,344
c
Royal
Bank
of
Canada
into
Microsoft
Corp.
,
144A,
7.25
%
,
11/16/26
........................................
United
States
3,200
1,331,193
c
Royal
Bank
of
Canada
into
Oracle
Corp.
,
144A,
10
%
,
5/13/26
..
United
States
31,000
4,322,525
c
Wells
Fargo
Bank
NA
into
Salesforce,
Inc.
,
144A,
9
%
,
6/15/26
..
United
States
12,000
2,462,986
16,302,583
Specialty
Retail
1.4%
c
Goldman
Sachs
Bank
USA
into
Home
Depot,
Inc.
(The)
,
144A,
8
%
,
5/18/27
......................................
United
States
10,000
3,746,890
c
J.P.
Morgan
Structured
Products
BV
into
Home
Depot,
Inc.
(The)
,
144A,
8
%
,
10/20/26
................................
United
States
9,000
3,474,436
7,221,326
Technology
Hardware,
Storage
&
Peripherals
1.3%
c
Merrill
Lynch
BV
into
Dell
Technologies,
Inc.
,
144A,
12
%
,
3/09/26
United
States
7,000
1,031,918
c
Mizuho
Markets
Cayman
LP
into
Dell
Technologies,
Inc.
,
144A,
12
%
,
11/09/26
....................................
United
States
39,000
5,831,126
6,863,044
Textiles,
Apparel
&
Luxury
Goods
1.2%
c
Goldman
Sachs
International
Bank
into
NIKE,
Inc.
,
144A,
9
%
,
3/31/26
.........................................
United
States
50,000
3,176,264
c
Merrill
Lynch
BV
into
NIKE,
Inc.
,
144A,
10
%
,
2/02/27
.........
United
States
50,000
3,151,704
6,327,968
Total
Equity-Linked
Securities
(Cost
$
245,893,779
)
............................
263,539,485
Convertible
Preferred
Stocks
14.8%
Aerospace
&
Defense
4.3%
Boeing
Co.
(The)
,
6
%
................................
United
States
315,000
22,972,950
Capital
Markets
3.6%
Ares
Management
Corp.
,
B
,
6.75
%
......................
United
States
500,000
18,800,000
Chemicals
3.0%
Albemarle
Corp.
,
7.25
%
..............................
United
States
225,000
15,990,750
Electric
Utilities
3.9%
NextEra
Energy,
Inc.
,
7.234
%
..........................
United
States
350,000
18,396,000
Franklin
Strategic
Series
Schedule
of
Investments
(unaudited)
Franklin
Templeton
SMACS:
Series
E
(continued)
The
accompanying
notes
are
an
integral
part
of
these
financial
statements.
Semiannual
Report
a
a
Country
Shares
a
Value
a
a
a
a
a
a
Convertible
Preferred
Stocks
(continued)
Electric
Utilities
(continued)
PPL
Corp.
,
7
%
.....................................
United
States
50,000
$
2,500,500
20,896,500
Total
Convertible
Preferred
Stocks
(Cost
$
66,207,152
)
.........................
78,660,200
Total
Long
Term
Investments
(Cost
$
458,920,184
)
.............................
518,295,008
a
Short
Term
Investments
2.2%
a
a
Country
Shares
a
Value
a
a
a
a
a
a
Money
Market
Funds
2.2%
d,e
Franklin
Institutional
U.S.
Government
Money
Market
Fund
,
3.583
%
.........................................
United
States
11,625,019
11,625,019
Total
Money
Market
Funds
(Cost
$
11,625,019
)
................................
11,625,019
Total
Short
Term
Investments
(Cost
$
11,625,019
)
..............................
11,625,019
a
Total
Investments
(Cost
$
470,545,203
)
99.8
%
.................................
$529,920,027
Other
Assets,
less
Liabilities
0.2
%
...........................................
1,298,055
Net
Assets
100.0%
.........................................................
$531,218,082
a
a
a
See
Abbreviations
on
page
48
.
a
Non-income
producing.
b
See
Note
1(d)
regarding
equity-linked
securities.
c
Security
was
purchased
pursuant
to
Rule
144A
or
Regulation
S
under
the
Securities
Act
of
1933.
144A
securities
may
be
sold
in
transactions
exempt
from
registration
only
to
qualified
institutional
buyers
or
in
a
public
offering
registered
under
the
Securities
Act
of
1933.
Regulation
S
securities
cannot
be
sold
in
the
United
States
without
either
an
effective
registration
statement
filed
pursuant
to
the
Securities
Act
of
1933,
or
pursuant
to
an
exemption
from
registration.
At
February
28,
2026,
the
aggregate
value
of
these
securities
was
$263,539,485,
representing
49.6%
of
net
assets.
d
See
Note
3(d)
regarding
investments
in
affiliated
management
investment
companies.
e
The
rate
shown
is
the
annualized
seven-day
effective
yield
at
period
end.
Franklin
Strategic
Series
Financial
Highlights
Franklin
Templeton
SMACS:
Series
H
Semiannual
Report
The
accompanying
notes
are
an
integral
part
of
these
financial
statements.
a
Six
Months
Ended
February
28,
2026
(unaudited)
Year
Ended
August
31,
2025
2024
2023
2022
2021
Per
share
operating
performance
(for
a
share
outstanding
throughout
the
period)
Net
asset
value,
beginning
of
period
.....
$8.87
$9.41
$8.86
$9.03
$10.57
$9.75
Income
from
investment
operations
a
:
Net
investment
income
b
.............
0.24
0.47
0.48
0.38
0.31
0.32
Net
realized
and
unrealized
gains
(losses)
0.51
(0.54)
0.53
(0.18)
(1.54)
0.82
Total
from
investment
operations
........
0.75
(0.07)
1.01
0.20
(1.23)
1.14
Less
distributions
from:
Net
investment
income
..............
(0.24)
(0.47)
(0.46)
(0.37)
(0.31)
(0.32)
Net
asset
value,
end
of
period
..........
$9.38
$8.87
$9.41
$8.86
$9.03
$10.57
Total
return
c
.......................
8.46%
(0.84)%
11.79%
2.36%
d
(11.82)%
d
11.88%
d
Ratios
to
average
net
assets
e
Expenses
before
waiver
and
payments
by
affiliates
..........................
0.40%
0.85%
0.85%
1.88%
2.51%
3.44%
Expenses
net
of
waiver
and
payments
by
affiliates
..........................
—%
—%
f
—%
f
—%
—%
f
—%
f
Net
investment
income
...............
5.18%
5.20%
5.33%
4.34%
3.14%
3.16%
Supplemental
data
Net
assets,
end
of
period
(000’s)
........
$41,846
$26,831
$12,653
$10,059
$3,019
$3,187
Portfolio
turnover
rate
................
9.15%
7.25%
42.17%
11.82%
6.89%
5.37%
a
The
amount
shown
for
a
share
outstanding
throughout
the
period
may
not
correlate
with
the
Statement
of
Operations
for
the
period
due
to
the
timing
of
sales
and
repurchases
of
the
Fund’s
shares
in
relation
to
income
earned
and/or
fluctuating
fair
value
of
the
investments
of
the
Fund.
b
Based
on
average
daily
shares
outstanding.
c
Total
return
is
not
annualized
for
periods
less
than
one
year.
d
Total
return
excluding
payments
by
Advisers
for
acquired
fund
fees
and
expenses
is
2.25%
for
the
year
ended
August
31,
2023,
(11.90)%
for
the
year
ended
August
31,
2022
and
11.78%
for
the
year
ended
August
31,
2021.
See
Note
3e.
e
Ratios
are
annualized
for
periods
less
than
one
year.
f
Benefit
of
expense
reduction
rounds
to
less
than
0.01%.
Franklin
Strategic
Series
Schedule
of
Investments
(unaudited),
February
28,
2026
Franklin
Templeton
SMACS:
Series
H
The
accompanying
notes
are
an
integral
part
of
these
financial
statements.
Semiannual
Report
a
a
Shares
a
Value
a
Common
Stocks
0.0%
Financial
Services
0.0%
a,b
Brightline
Train
Holdings
West
LLC
......................................
1,290
$
—
b
Total
Common
Stocks
(Cost
$
–
)
...............................................
—
a
Management
Investment
Companies
9.1%
Capital
Markets
9.1%
c
Franklin
Dynamic
Municipal
Bond
ETF
...................................
150,000
3,817,500
Total
Management
Investment
Companies
(Cost
$
3,705,356
)
.....................
3,817,500
Principal
Amount
a
a
a
a
Corporate
Bonds
0.6%
Diversified
Consumer
Services
0.6%
Grand
Canyon
University
,
Secured
Note
,
5.125
%
,
10/01/28
....................
$
250,000
251,396
Total
Corporate
Bonds
(Cost
$
235,360
)
........................................
251,396
Municipal
Bonds
88.9%
Alabama
3.5%
Black
Belt
Energy
Gas
District
,
Revenue
,
2025
G
,
5
%
,
10/01/35
................
100,000
109,350
Homewood
Educational
Building
Authority
,
CHF
-
Horizons
II
LLC
,
Revenue
,
2024
C
,
5
%
,
10/01/56
.....................................................
555,000
540,516
MidCity
Improvement
District
,
Assessment
Area
,
Special
Assessment
,
2022
,
4.5
%
,
11/01/42
................
150,000
141,768
Assessment
Area
,
Special
Assessment
,
2022
,
4.75
%
,
11/01/49
...............
100,000
90,126
Mobile
County
Industrial
Development
Authority
,
AM/NS
Calvert
LLC
,
Revenue
,
2024
B
,
4.75
%
,
12/01/54
................................................
160,000
153,334
Southeast
Energy
Authority
A
Cooperative
District
,
Revenue
,
2024
A
,
5
%
,
11/01/35
..
405,000
435,920
1,471,014
Arizona
3.1%
d
Maricopa
County
Industrial
Development
Authority
,
Grand
Canyon
University
Obligated
Group
,
Revenue
,
144A,
2024
,
7.375
%
,
10/01/29
..........................
405,000
437,275
d
Sierra
Vista
Industrial
Development
Authority
,
American
Leadership
Academy,
Inc.
,
Revenue
,
144A,
2023
,
5.75
%
,
6/15/58
......
150,000
146,532
Georgetown
Community
Development
Authority
,
Revenue
,
144A,
2021
A
,
5.375
%
,
10/01/56
.......................................................
250,000
209,371
Tempe
Industrial
Development
Authority
,
Tempe
Life
Care
Village
Obligated
Group
,
Revenue
,
2019
,
5
%
,
12/01/50
........
250,000
244,700
Tempe
Life
Care
Village
Obligated
Group
,
Revenue
,
2025
A
,
5.625
%
,
12/01/55
...
250,000
257,298
1,295,176
Arkansas
0.7%
Arkansas
Development
Finance
Authority
,
United
States
Steel
Corp.
,
Revenue
,
2023
,
5.7
%
,
5/01/53
....................................................
150,000
153,388
e
Fayetteville
Public
Facilities
Board
,
Butterfield
Trail
Village,
Inc.
,
Revenue
,
2026
,
5.5
%
,
12/01/60
........................................................
115,000
117,222
270,610
California
4.2%
f
California
Community
Choice
Financing
Authority
,
Revenue
,
2023
C
,
Mandatory
Put
,
5.25
%
,
10/01/31
...................................................
130,000
139,779
d
California
Community
Housing
Agency
,
Arbors
Apartments
,
Revenue
,
144A,
2020
A
,
5
%
,
8/01/50
....................
125,000
119,885
Aster
Apartments
,
Revenue,
Junior
Lien
,
144A,
2021
A-2
,
4
%
,
2/01/43
..........
230,000
221,006
Fountains
at
Emerald
Park
,
Revenue,
Junior
Lien
,
144A,
2021
A-2
,
4
%
,
8/01/46
...
195,000
171,088
Franklin
Strategic
Series
Schedule
of
Investments
(unaudited)
Franklin
Templeton
SMACS:
Series
H
(continued)
Semiannual
Report
The
accompanying
notes
are
an
integral
part
of
these
financial
statements.
a
a
Principal
Amount
a
Value
a
a
a
a
a
Municipal
Bonds
(continued)
California
(continued)
d
California
Community
Housing
Agency,
(continued)
Verdant
at
Green
Valley
Apartments
,
Revenue
,
144A,
2019
A
,
5
%
,
8/01/49
.......
$
105,000
$
98,802
d,g
California
Municipal
Finance
Authority
,
IH
Parkside
Fairfield
LLC
,
Revenue,
Sub.
Lien
,
144A,
2023
B
,
2.617
%,
9/01/43
.......................................
150,000
119,017
d
CMFA
Special
Finance
Agency
,
Solana
at
Grand
,
Revenue,
Junior
Lien
,
144A,
2021
A-2
,
4
%
,
8/01/45
..................................................
100,000
91,638
d
CMFA
Special
Finance
Agency
VII
,
Breakwater
Apartments
(The)
,
Revenue
,
144A,
2021
A-2
,
4
%
,
8/01/47
..............................................
195,000
183,835
d
CMFA
Special
Finance
Agency
VIII
,
Elan
Huntington
Beach
,
Revenue,
Junior
Lien
,
144A,
2021
A-2
,
4
%
,
8/01/47
.........................................
125,000
117,843
d
CMFA
Special
Finance
Agency
XII
,
Allure
Apartments
,
Revenue
,
144A,
2022
A-2
,
4.375
%
,
8/01/49
...................................................
100,000
86,479
d
CSCDA
Community
Improvement
Authority
,
Renaissance
at
City
Center
,
Revenue
,
144A,
2020
A
,
5
%
,
7/01/51
.............
110,000
106,309
Waterscape
Apartments
,
Revenue
,
144A,
2021
B
,
4
%
,
9/01/46
................
135,000
115,948
d
Golden
State
Connect
Authority
,
Revenue
,
144A,
2025
,
6.5
%
,
12/01/60
...........
200,000
202,268
1,773,897
Colorado
1.3%
Colorado
Health
Facilities
Authority
,
BSLC
II
Obligated
Group
,
Revenue,
Second
Tier
,
2025
,
5.25
%
,
9/15/45
.........
195,000
200,640
Christian
Living
Neighborhoods
Obligated
Group
,
Revenue
,
2019
,
Refunding
,
4
%
,
1/01/38
........................................................
100,000
98,540
Denver
Health
&
Hospital
Authority
,
Revenue
,
2019
A
,
Refunding
,
4
%
,
12/01/39
....
250,000
243,064
542,244
Connecticut
0.3%
Stamford
Housing
Authority
,
TJH
Senior
Living
LLC
Obligated
Group
,
Revenue
,
2025
A
,
Refunding
,
6.5
%
,
10/01/55
.........................................
100,000
102,934
Florida
24.9%
Angeline
Community
Development
District
,
Assessment
Area
1
,
Special
Assessment
,
2025
,
5.75
%
,
5/01/56
...............................................
130,000
131,617
Avenir
Community
Development
District
,
Parcel
A-18
,
Special
Assessment
,
2024
A
,
6
%
,
5/01/55
......................................................
100,000
101,599
d
Babcock
Ranch
Community
Independent
Special
District
,
Assessment
Area
,
Special
Assessment
,
144A,
2024
,
5.25
%
,
5/01/55
...............................
150,000
151,397
Bella
Tara
Community
Development
District
,
Assessment
Area
1
,
Special
Assessment
,
2025
,
6.125
%
,
5/01/56
..............................................
100,000
103,940
Big
Cypress
Stewardship
District
,
Assessment
Area
1
,
Special
Assessment
,
2026
,
5.75
%
,
5/01/55
...................................................
150,000
151,015
Bridle
Creek
Community
Development
District
,
Special
Assessment
,
2025
,
6.375
%
,
5/01/56
.........................................................
160,000
165,987
e
Brightshore
Community
Development
District
,
Assessments
,
Special
Assessment
,
2026
,
5.7
%
,
5/01/57
................................................
145,000
145,315
Buena
Lago
Community
Development
District
,
Assessment
Area
2
,
Special
Assessment
,
2024
,
5.55
%
,
5/01/54
....................................
75,000
75,418
d
Capital
Projects
Finance
Authority
,
PRG
-
UnionWest
Properties
LLC
,
Revenue,
Senior
Lien
,
144A,
2024
A-1
,
5
%
,
6/01/58
.....................................
250,000
226,998
Caymas
Community
Development
District
,
Assessment
Area
2
,
Special
Assessment
,
2026
,
5.625
%
,
5/01/56
..............................................
160,000
160,656
d
Center
Lake
Ranch
West
Community
Development
District
,
Assessment
Area
2
,
Special
Assessment
,
144A,
2025
,
5.6
%
,
5/01/55
..........................
135,000
136,339
Chaparral
Palm
Bay
Community
Development
District
,
Assessment
Area
2
,
Special
Assessment
,
2024
,
5.5
%
,
5/01/55
.....................................
100,000
100,561
Charlotte
County
Industrial
Development
Authority
,
MSKP
Town
&
Country
Utility
LLC
,
Revenue
,
2025
,
6.125
%
,
10/01/55
.....................................
150,000
156,442
Franklin
Strategic
Series
Schedule
of
Investments
(unaudited)
Franklin
Templeton
SMACS:
Series
H
(continued)
The
accompanying
notes
are
an
integral
part
of
these
financial
statements.
Semiannual
Report
a
a
Principal
Amount
a
Value
a
a
a
a
a
Municipal
Bonds
(continued)
Florida
(continued)
d
County
of
Okaloosa
,
AIR
Force
Enlisted
Village,
Inc.
Obligated
Group
,
Revenue
,
144A,
2025
,
5.75
%
,
5/15/60
...............................................
$
185,000
$
189,624
Creekside
Community
Development
District
,
Assessment
Area
2
-
Parcel
C
and
D
,
Special
Assessment
,
2026
,
5.6
%
,
5/01/56
...............................
120,000
120,724
Cypress
Bluff
Community
Development
District
,
Assessment
Area
1
,
Special
Assessment
,
2025
,
5.55
%
,
5/01/55
....................................
100,000
100,775
Deering
Park
Stewardship
District
,
DPSD
JV1
No.
1
Assessment
Area
,
Special
Assessment
,
2025
,
6
%
,
5/01/45
.......................................
115,000
121,795
Epperson
North
Community
Development
District
,
Assessment
Area
4
,
Special
Assessment
,
2024
,
5.6
%
,
5/01/55
.....................................
110,000
110,587
d
Everlands
Community
Development
District
,
Assessment
Area
2
Phase
2
,
Special
Assessment
,
144A,
2024
,
5.5
%
,
6/15/54
................................
150,000
150,620
Feed
Mill
Community
Development
District
,
Parcel
1
Assessment
Area
1
,
Special
Assessment
,
2025
,
5.875
%
,
5/01/56
...................................
100,000
101,366
Florida
Development
Finance
Corp.
,
d
Mayflower
Retirement
Center,
Inc.
Obligated
Group
,
Revenue
,
144A,
2021
A
,
Refunding
,
4
%
,
6/01/55
............................................
100,000
75,014
Shands
Jacksonville
Medical
Center
Obligated
Group
,
Revenue
,
2022
A
,
Refunding
,
5
%
,
2/01/52
....................................................
85,000
82,246
Fox
Branch
Ranch
Community
Development
District
,
Assessment
Area
1
,
Special
Assessment
,
2025
,
5.4
%
,
5/01/55
.....................................
100,000
100,276
d
Gas
Worx
Community
Development
District
,
Special
Assessment
,
144A,
2025
,
6
%
,
5/01/57
.........................................................
150,000
154,525
GIR
East
Community
Development
District
,
Assessment
Area
1
,
Special
Assessment
,
2025
,
5.5
%
,
5/01/55
................................................
100,000
99,268
Hammock
Oaks
Community
Development
District
,
Assessment
Area
2
,
Special
Assessment
,
2024
,
5.85
%
,
5/01/44
....................................
110,000
114,420
Harvest
Hills
South
Community
Development
District
,
Assessment
Area
1
,
Special
Assessment
,
2025
,
5.75
%
,
5/01/56
....................................
165,000
165,609
Highland
Trails
Community
Development
District
,
Assessment
Area
2
,
Special
Assessment
,
2025
,
5.85
%
,
5/01/56
....................................
100,000
100,749
d
Hillcrest
Preserve
Community
Development
District
,
Special
Assessment
,
144A,
2024
,
5.3
%
,
5/01/54
....................................................
180,000
176,700
Hunt
Club
Grove
Community
Development
District
,
Assessment
Area
1
,
Special
Assessment
,
2024
,
5.625
%
,
6/15/54
...................................
75,000
75,566
d
K-Bar
Ranch
III
Community
Development
District
,
Special
Assessment
,
144A,
2025
,
6.125
%
,
5/01/55
...................................................
110,000
115,255
Kindred
Community
Development
District
II
,
Special
Assessment
,
2021
,
3.125
%
,
5/01/41
.........................................................
100,000
91,928
Kings
Creek
I
Community
Development
District
,
Assessment
Area
1
,
Special
Assessment
,
2025
,
6
%
,
5/01/55
.......................................
100,000
102,717
Kingston
One
Community
Development
District
,
Assessment
Area
1
-
2025
Project
,
Special
Assessment
,
2025
,
6
%
,
5/01/57
.................................
130,000
134,117
Kissimmee
Park
Community
Development
District
,
Assessment
Area
1
,
Special
Assessment
,
2025
,
6.125
%
,
5/01/56
...................................
100,000
103,940
d
Knightsbridge
Community
Development
District
,
Special
Assessment
,
144A,
2024
,
5.5
%
,
6/15/54
....................................................
175,000
178,969
Lake
Flores
Community
Development
District
,
Assessment
Area
,
Special
Assessment
,
2026
,
5.75
%
,
5/01/56
...............................................
100,000
100,984
Lakeside
Preserve
Community
Development
District
,
Special
Assessment
,
2023
,
6.375
%
,
5/01/54
...................................................
95,000
100,226
Langley
South
Community
Development
District
,
Assessment
Area
1
,
Special
Assessment
,
2024
,
5.4
%
,
5/01/55
.....................................
70,000
70,294
Lee
County
Industrial
Development
Authority
,
Shell
Point
Obligated
Group
,
Revenue
,
2024
C
,
5
%
,
11/15/54
...............................................
500,000
490,660
LT
Ranch
Community
Development
District
,
Phase
IIA
Assessment
Area
,
Special
Assessment
,
2022-2
,
5.7
%
,
5/01/53
....................................
100,000
102,738
Franklin
Strategic
Series
Schedule
of
Investments
(unaudited)
Franklin
Templeton
SMACS:
Series
H
(continued)
Semiannual
Report
The
accompanying
notes
are
an
integral
part
of
these
financial
statements.
a
a
Principal
Amount
a
Value
a
a
a
a
a
Municipal
Bonds
(continued)
Florida
(continued)
Marion
Ranch
Community
Development
District
,
Special
Assessment
,
2024
,
5.7
%
,
5/01/44
.........................................................
$
85,000
$
88,552
North
AR-1
Pasco
Community
Development
District
,
Assessment
Area
3
,
Special
Assessment
,
2023
,
6
%
,
5/01/54
.......................................
70,000
72,180
North
Loop
Community
Development
District
,
Special
Assessment
,
2023
,
6.625
%
,
5/01/54
.........................................................
130,000
139,882
Pacific
Ace
Community
Development
District
,
Special
Assessment
,
2024
,
5.5
%
,
5/01/55
.........................................................
125,000
126,692
Palermo
Community
Development
District
,
Special
Assessment
,
2023
,
5
%
,
6/15/43
.................................
100,000
104,008
Assessment
Area
2
,
Special
Assessment
,
2025
,
5.5
%
,
6/15/55
................
100,000
103,056
Palm
Coast
Park
Community
Development
District
,
Special
Assessment
,
2023
,
5.6
%
,
5/01/53
.........................................................
100,000
101,857
Parker
Pointe
Community
Development
District
,
Special
Assessment
,
2024
,
5.5
%
,
5/01/44
.........................................................
100,000
102,923
Parkside
Trails
Community
Development
District
,
2025
Project
Area
,
Special
Assessment
,
2025
,
5.55
%
,
5/01/55
....................................
145,000
145,318
Parrish
Lakes
Community
Development
District
,
Assessment
Area
2
,
Special
Assessment
,
2023
A
,
5.625
%
,
5/01/53
..................................
90,000
91,911
Pasadena
Ridge
Community
Development
District
,
Assessment
Area
1
,
Special
Assessment
,
2024
,
5.375
%
,
5/01/55
...................................
130,000
129,318
Preserve
at
Savannah
Lakes
Community
Development
District
,
Assessment
Area
1
,
Special
Assessment
,
2024
,
5.45
%
,
5/01/44
..............................
140,000
146,005
Prosperity
Lakes
Community
Development
District
,
Assessment
Area
1
,
Special
Assessment
,
2023
,
6.125
%
,
12/15/53
...................................
160,000
171,241
Quail
Roost
Community
Development
District
,
Expansion
Area
,
Special
Assessment
,
2021
,
4
%
,
12/15/51
................................................
70,000
61,353
Reflection
Bay
Community
Development
District
,
Special
Assessment
,
2025
,
5.875
%
,
5/01/55
.........................................................
160,000
163,951
Regal
Village
Community
Development
District
,
Special
Assessment
,
2024
,
5.5
%
,
5/01/54
.........................................................
145,000
146,534
Ridge
at
Apopka
Community
Development
District
,
Parcel
2
,
Special
Assessment
,
2023
,
5.75
%
,
5/01/53
...............................................
100,000
101,609
River
Hall
Community
Development
District
,
Assessment
Area
4
,
Special
Assessment
,
2023
A
,
6.5
%
,
5/01/54
..............................................
105,000
111,770
River
Landing
Community
Development
District
,
Assessments
,
Special
Assessment
,
2025
,
5.45
%
,
5/01/55
...............................................
100,000
100,419
d
Saltmeadows
Community
Development
District
,
Assessment
Area
2
,
Special
Assessment
,
144A,
2025
,
6
%
,
5/01/55
..................................
150,000
155,546
Savanna
Lakes
Community
Development
District
,
Assessment
Area
2
,
Special
Assessment
,
2024
,
5.5
%
,
6/15/54
.....................................
135,000
136,309
Sawgrass
Village
Community
Development
District
,
Assessment
Area
1
,
Special
Assessment
,
2023
,
5.75
%
,
5/01/53
...............
100,000
102,084
Assessment
Area
2
,
Special
Assessment
,
2023
,
6.375
%
,
11/01/53
.............
155,000
163,171
d
Seaton
Creek
Reserve
Community
Development
District
,
Assessment
Area
1
,
Special
Assessment
,
144A,
2023
,
5.5
%
,
6/15/53
................................
100,000
102,550
Seminole
Palms
Community
Development
District
,
Special
Assessment
,
2023
,
5.5
%
,
5/01/43
.........................................................
85,000
89,143
Springs
at
Lake
Alfred
Community
Development
District
,
Assessment
Area
1
,
Special
Assessment
,
2024
,
5.6
%
,
5/01/54
.....................................
145,000
146,432
Stonegate
Preserve
Community
Development
District
,
Special
Assessment
,
2023
,
6.125
%
,
12/15/53
.............................
150,000
160,737
Special
Assessment
,
2025
,
5.875
%
,
6/15/55
.............................
125,000
128,710
d
Sugarloaf
Community
Development
District
,
Assessment
Area
1
,
Special
Assessment
,
144A,
2026
,
5.625
%
,
12/15/55
........................................
100,000
100,588
Terra
Lago
Community
Development
District
,
Assessment
Area
2
,
Special
Assessment
,
2025
,
5.75
%
,
5/01/56
...............................................
100,000
100,411
Franklin
Strategic
Series
Schedule
of
Investments
(unaudited)
Franklin
Templeton
SMACS:
Series
H
(continued)
The
accompanying
notes
are
an
integral
part
of
these
financial
statements.
Semiannual
Report
a
a
Principal
Amount
a
Value
a
a
a
a
a
Municipal
Bonds
(continued)
Florida
(continued)
Tranquility
Community
Development
District
,
Special
Assessment
,
2025
,
5.625
%
,
5/01/55
.........................................................
$
150,000
$
150,355
Twisted
Oaks
Pointe
Community
Development
District
,
Assessment
Area
1
,
Special
Assessment
,
2023
,
5.375
%
,
5/01/43
..............
100,000
104,369
Assessment
Area
2
,
Special
Assessment
,
2023
,
6.125
%
,
5/01/54
..............
75,000
77,930
Two
Rivers
West
Community
Development
District
,
Special
Assessment
,
2024
,
5.875
%
,
5/01/54
...................................................
75,000
77,135
V-Dana
Community
Development
District
,
Assessment
Area
2
,
Special
Assessment
,
2025
,
5.55
%
,
5/01/55
...............................................
95,000
95,804
Waterset
South
Community
Development
District
,
Assessment
Area
,
Special
Assessment
,
2026
,
5.65
%
,
5/01/56
....................................
175,000
177,410
d
Wellness
Ridge
Community
Development
District
,
Assessment
Area
2
,
Special
Assessment
,
144A,
2024
,
5.2
%
,
6/15/55
................................
100,000
98,484
d
West
Port
East
Community
Development
District
,
Assessment
Area
1
,
Special
Assessment
,
144A,
2025
,
6
%
,
5/01/55
..................................
120,000
123,892
d
West
Villages
Improvement
District
,
Special
Assessment
,
144A,
2025
,
5.5
%
,
5/01/55
145,000
144,980
Westwood
of
Pasco
Community
Development
District
,
Assessments
,
Special
Assessment
,
2023
,
5.625
%
,
5/01/53
...................................
130,000
133,384
Winding
Oaks
Community
Development
District
,
Special
Assessment
,
2024
,
5.7
%
,
5/01/55
.........................................................
100,000
100,668
d
Woodland
Preserve
Community
Development
District
,
Assessment
Area
1
,
Special
Assessment
,
144A,
2025
,
5.5
%
,
5/01/55
................................
100,000
100,561
10,418,208
Georgia
0.3%
Georgia
Housing
&
Finance
Authority
,
Revenue
,
2025
C
,
5.125
%
,
12/01/50
........
100,000
102,751
Illinois
8.0%
Chicago
Board
of
Education
,
GO
,
2023
A
,
5.875
%
,
12/01/47
........................................
250,000
258,381
GO
,
2025
B
,
Refunding
,
6
%
,
12/01/44
..................................
315,000
337,549
Dedicated
Capital
Improvement
Tax
,
Revenue
,
2023
,
5.75
%
,
4/01/48
...........
225,000
239,633
City
of
Chicago
,
GO
,
2025
A
,
6
%
,
1/01/50
.................................
350,000
368,521
Illinois
Finance
Authority
,
Westminster
Village,
Inc.
Obligated
Group
,
Revenue
,
2018
A
,
Refunding
,
5
%
,
5/01/48
.............................................
100,000
88,224
Metropolitan
Pier
&
Exposition
Authority
,
State
of
Illinois
McCormick
Place
Expansion
Project
Fund
,
Revenue
,
2024
B
,
Refunding
,
5
%
,
6/15/53
....................
500,000
500,110
State
of
Illinois
,
GO
,
2024
B
,
5.25
%
,
5/01/47
...............................
1,500,000
1,574,202
3,366,620
Indiana
0.5%
d
City
of
Goshen
,
Green
Oaks
of
Goshen
LLC
,
Revenue
,
144A,
2021
A
,
5
%
,
8/01/41
..
100,000
90,303
Indianapolis
Local
Public
Improvement
Bond
Bank
,
Revenue,
Senior
Lien
,
2023
E
,
6.125
%
,
3/01/57
...................................................
110,000
115,901
206,204
Iowa
1.5%
Iowa
Finance
Authority
,
Iowa
Fertilizer
Co.
LLC
,
Revenue
,
2022
,
Pre-Refunded
,
5
%
,
12/01/50
..........
235,000
274,379
Lifespace
Communities,
Inc.
Obligated
Group
,
Revenue
,
2016
A
,
5
%
,
5/15/36
....
100,000
100,222
Presbyterian
Homes
Mill
Pond
Apartment,
Inc.
,
Revenue
,
2025
,
5.875
%
,
10/01/65
.
125,000
127,904
Iowa
Higher
Education
Loan
Authority
,
University
of
Dubuque
,
Revenue
,
2025
,
6
%
,
10/01/55
........................................................
130,000
137,079
639,584
Louisiana
2.5%
Calcasieu
Parish
Memorial
Hospital
Service
District
,
Southwest
Louisiana
Healthcare
System
Obligated
Group
,
Revenue
,
2019
,
Refunding
,
5
%
,
12/01/39
............
100,000
100,065
Franklin
Strategic
Series
Schedule
of
Investments
(unaudited)
Franklin
Templeton
SMACS:
Series
H
(continued)
Semiannual
Report
The
accompanying
notes
are
an
integral
part
of
these
financial
statements.
a
a
Principal
Amount
a
Value
a
a
a
a
a
Municipal
Bonds
(continued)
Louisiana
(continued)
Lakeshore
Villages
Master
Community
Development
District
,
Special
Assessment
,
2025
,
6
%
,
6/01/54
.................................................
$
170,000
$
176,350
d
Louisiana
Local
Government
Environmental
Facilities
&
Community
Development
Authority
,
Parish
of
St.
Martin
,
Revenue
,
144A,
2019
,
4.4
%
,
11/01/44
...........
135,000
135,308
Louisiana
Public
Facilities
Authority
,
d
Acadiana
Renaissance
Charter
Academy
,
Revenue
,
144A,
2025
,
6
%
,
6/15/59
....
100,000
101,287
Calcasieu
Bridge
Partners
LLC
,
Revenue,
Senior
Lien
,
2024
,
5.5
%
,
9/01/59
......
195,000
200,453
Calcasieu
Bridge
Partners
LLC
,
Revenue,
Senior
Lien
,
2024
,
5.75
%
,
9/01/64
.....
330,000
343,707
1,057,170
Maryland
1.0%
Maryland
Economic
Development
Corp.
,
Morgan
View
&
Thurgood
Marshall
Student
Housing
,
Revenue
,
2020
,
4.25
%
,
7/01/50
170,000
150,939
Morgan
View
&
Thurgood
Marshall
Student
Housing
,
Revenue
,
2022
A
,
6
%
,
7/01/58
75,000
79,561
d
Town
of
La
Plata
,
Heritage
Green
Special
Taxing
District
,
Special
Tax
,
144A,
2023
A
,
6.5
%
,
2/15/53
....................................................
190,000
193,037
423,537
Michigan
1.2%
City
of
Detroit
,
GO
,
2023
C
,
6
%
,
5/01/43
..................................
100,000
113,010
Grand
Rapids
Economic
Development
Corp.
,
Michigan
Christian
Home
Obligated
Group
,
Revenue
,
2025
A
,
Refunding
,
6
%
,
11/01/50
........................
100,000
100,872
Michigan
Finance
Authority
,
Provident
Group
-
HFH
Energy
LLC
,
Revenue
,
2024
,
4.375
%
,
2/28/54
...................................................
150,000
142,118
Michigan
State
Housing
Development
Authority
,
Revenue
,
2025
C
,
5.05
%
,
6/01/51
..
150,000
152,219
508,219
Minnesota
0.3%
City
of
Apple
Valley
,
PHS
Apple
Valley
Senior
Housing,
Inc.
,
Revenue
,
2021
,
4
%
,
9/01/36
.........................................................
105,000
105,388
Nevada
0.6%
City
of
Las
Vegas
,
Special
Improvement
District
No.
819
,
Special
Assessment
,
2025
,
5.5
%
,
6/01/55
....................................................
150,000
153,242
Henderson
Local
Improvement
Districts
,
Local
Improvement
District
No.
T-22
,
Special
Assessment
,
2023
,
5.25
%
,
3/01/53
....................................
100,000
100,512
253,754
New
Hampshire
2.1%
New
Hampshire
Business
Finance
Authority
,
Adventist
Health
System/West
Obligated
Group
,
Revenue
,
2024
C
,
5.25
%
,
7/01/49
355,000
360,248
Greater
Raleigh
Area
Christian
Education,
Inc.
,
Revenue
,
2025
,
6
%
,
8/01/65
.....
250,000
251,403
Presbyterian
Homes
Obligated
Group
,
Revenue
,
2023
A
,
5.25
%
,
7/01/48
........
250,000
254,547
866,198
New
York
6.1%
Metropolitan
Transportation
Authority
,
Revenue
,
2021
A-2
,
4
%
,
11/15/41
..........
475,000
475,339
New
York
City
Housing
Development
Corp.
,
8
Spruce
NY
Owner
LLC
,
Revenue
,
2024
,
F
,
Refunding
,
5.25
%
,
12/15/31
........................................
250,000
260,253
New
York
Transportation
Development
Corp.
,
Delta
Air
Lines,
Inc.
,
Revenue
,
2020
,
4
%
,
10/01/30
.........................
100,000
102,669
Delta
Air
Lines,
Inc.
,
Revenue
,
2020
,
4.375
%
,
10/01/45
.....................
465,000
448,722
JFK
International
Air
Terminal
LLC
,
Revenue
,
2022
,
5
%
,
12/01/41
.............
185,000
197,144
JFK
NTO
LLC
,
Revenue
,
2023
,
6
%
,
6/30/54
..............................
35,000
36,742
JFK
NTO
LLC
,
Revenue
,
2024
,
5.5
%
,
6/30/60
............................
910,000
930,252
d
Oneida
Indian
Nation
of
New
York
,
Revenue
,
144A,
2024
B
,
6
%
,
9/01/43
..........
100,000
109,330
2,560,451
Franklin
Strategic
Series
Schedule
of
Investments
(unaudited)
Franklin
Templeton
SMACS:
Series
H
(continued)
The
accompanying
notes
are
an
integral
part
of
these
financial
statements.
Semiannual
Report
a
a
Principal
Amount
a
Value
a
a
a
a
a
Municipal
Bonds
(continued)
Ohio
1.0%
Ohio
Higher
Educational
Facility
Commission
,
Cleveland
Institute
of
Art
(The)
,
Revenue
,
5.5
%
,
12/01/53
............................................
$
200,000
$
184,982
Ohio
Housing
Finance
Agency
,
Revenue,
Sub.
Lien
,
2023
C
,
8
%
,
8/01/34
.........
100,000
106,576
Summit
County
Development
Finance
Authority
,
UAkronPark,
Inc.
,
Revenue
,
2023
,
6
%
,
12/01/58
........................................................
125,000
133,677
425,235
Oklahoma
0.4%
Tulsa
Municipal
Airport
Trust
Trustees
,
American
Airlines,
Inc.
,
Revenue
,
2025
,
Refunding
,
6.25
%
,
12/01/40
..........................................
135,000
153,750
Pennsylvania
2.7%
d
Allentown
Commercial
and
Industrial
Development
Authority
,
Executive
Education
Academy
Charter
School
,
Revenue
,
144A,
2024
,
Refunding
,
5
%
,
7/01/59
........
250,000
232,038
Berks
County
Municipal
Authority
(The)
,
Tower
Health
Obligated
Group
,
Revenue
,
2024
A-1
,
8
%
,
6/30/34
..............
18,000
18,766
Tower
Health
Obligated
Group
,
Revenue
,
2024
A-2
,
6
%
,
6/30/34
..............
8,000
8,633
Tower
Health
Obligated
Group
,
Revenue
,
2024
A-3
,
5
%
,
6/30/39
..............
120,000
114,870
g
Tower
Health
Obligated
Group
,
Revenue
,
2024
B-1
,
1.35
%,
6/30/44
............
59,000
43,855
Montgomery
County
Higher
Education
and
Health
Authority
,
Thomas
Jefferson
University
Obligated
Group
,
Revenue
,
2022
B
,
Refunding
,
5
%
,
5/01/57
.........
720,000
725,247
1,143,409
Rhode
Island
0.9%
Rhode
Island
Health
and
Educational
Building
Corp.
,
PRG
-
RI
Properties
LLC
,
Revenue
,
2025
A
,
AG
Insured
,
5
%
,
7/01/55
..........
230,000
231,378
PRG
-
RI
Properties
LLC
,
Revenue
,
2025
B
,
AG
Insured
,
5.625
%
,
7/01/65
.......
150,000
154,425
385,803
Texas
10.3%
d
Arlington
Higher
Education
Finance
Corp.
,
BASIS
Texas
Charter
Schools,
Inc.
,
Revenue
,
144A,
2024
,
4.875
%
,
6/15/59
......
100,000
91,339
BASIS
Texas
Charter
Schools,
Inc.
,
Revenue
,
144A,
2025
,
Refunding
,
5.875
%
,
6/15/65
........................................................
150,000
152,870
d
City
of
Anna
,
Woods
at
Lindsey
Place
(The)
Public
Improvement
District
Area
1
,
Special
Assessment
,
144A,
2023
,
5.875
%
,
9/15/53
.........................
116,000
120,066
d
City
of
Austin
,
Whisper
Valley
Public
Improvement
District
Improvement
Area
No.
2
,
Special
Assessment
,
144A,
2022
,
5.5
%
,
11/01/51
..........................
100,000
101,889
d
City
of
Celina
,
Lakes
at
Mustang
Ranch
Public
Improvement
District
Phases
8-9
,
Special
Assessment
,
144A,
2025
,
5.625
%
,
9/01/55
.............................
150,000
150,246
Pravin
Public
Improvement
District
,
Special
Assessment
,
144A,
2023
,
6.75
%
,
9/01/53
100,000
100,944
d
City
of
Dayton
,
Special
Assessment
,
144A,
2025
,
5.5
%
,
9/01/55
................
102,000
102,034
City
of
Dripping
Springs
,
Special
Assessment
,
2025
,
5.625
%
,
9/01/55
............
125,000
125,306
d
City
of
Ennis
,
Special
Assessment
,
144A,
2025
,
5.5
%
,
9/15/55
.................
100,000
99,780
d
City
of
Fate
,
Williamsburg
Public
Improvement
District
No.
1
Phase
3B
,
Special
Assessment
,
144A,
2023
,
5.375
%
,
8/15/53
...............................
100,000
101,302
City
of
Houston
Airport
System
,
United
Airlines,
Inc.
,
Revenue
,
2024
B
,
5.5
%
,
7/15/39
350,000
383,694
d
City
of
Hutto
,
Emory
Crossing
Public
Improvement
District
Improvement
Area
No.
2
,
Special
Assessment
,
144A,
2023
,
5.625
%
,
9/01/58
.........................
115,000
116,759
d
City
of
Kyle
,
6
Creeks
Public
Improvement
District
Improvement
Area
No.
5
,
Special
Assessment
,
144A,
2025
,
5.375
%
,
9/01/50
...............................
141,000
142,226
City
of
Lavon
,
Elevon
Public
Improvement
District
Improvement
Area
No.
3-5
,
Special
Assessment
,
2025
,
5.75
%
,
9/15/55
....................................
100,000
100,763
e
City
of
Liberty
,
Liberty
Ranch
Public
Improvement
District
,
Special
Assessment
,
2026
,
5.875
%
,
9/01/56
...................................................
128,000
128,840
d
City
of
Manor
,
EntradenGlen
Public
Improvement
District
Improvement
Area
No.
1
,
Special
Assessment
,
144A,
2025
,
7
%
,
9/15/55
............................
100,000
105,728
Franklin
Strategic
Series
Schedule
of
Investments
(unaudited)
Franklin
Templeton
SMACS:
Series
H
(continued)
Semiannual
Report
The
accompanying
notes
are
an
integral
part
of
these
financial
statements.
a
a
Principal
Amount
a
Value
a
a
a
a
a
Municipal
Bonds
(continued)
Texas
(continued)
d
City
of
Mclendon-Chisholm
,
Sonoma
Public
Improvement
District
Improvement
Area
No.
4
,
Special
Assessment
,
144A,
2022
,
5.75
%
,
9/15/52
....................
$
135,000
$
136,562
City
of
Mesquite
,
Solterra
Public
Improvement
District
Improvement
Area
A-2-A-4
,
Special
Assessment
,
2025
,
5.75
%
,
9/01/55
..............................
143,000
143,576
City
of
Princeton
,
d
Southbridge
Public
Improvement
District
Improvement
Area
No.
2
,
Special
Assessment
,
144A,
2024
,
5.5
%
,
9/01/54
...............................
132,000
132,051
Windmore
Public
Improvement
District
Improvement
Area
No.
3
,
Special
Assessment
,
2025
,
5.625
%
,
9/01/55
..................................
195,000
196,427
d
City
of
Tomball
,
Raburn
Reserve
Public
Improvement
District
Area
No.
2
,
Special
Assessment
,
144A,
2023
,
5.75
%
,
9/15/52
...............................
112,000
115,003
d
County
of
Bastrop
,
Double
Eagle
Ranch
Public
Improvement
District
Improvement
Area
No.
2
,
Special
Assessment
,
144A,
2024
,
5.25
%
,
9/01/44
....................
105,000
108,975
d
County
of
Denton
,
Green
Meadows
Public
Improvement
District
Major
Improvement
Area
,
Special
Assessment
,
144A,
2025
,
6.125
%
,
12/31/55
............................
100,000
103,622
Tabor
Ranch
Public
Improvement
District
Improvement
Area
No.
1
,
Special
Assessment,
Senior
Lien
,
144A,
2024
A
,
5.625
%
,
12/31/54
.................
106,000
106,940
d
County
of
Hays
,
La
Cima
Public
Improvement
District
,
Special
Assessment
,
144A,
2020
,
3.25
%
,
9/15/30
...............................................
100,000
95,600
d,e
County
of
Medina
,
Viera
Public
Improvement
District
1
Improvement
Area
No.
1
Project
,
Special
Assessment
,
144A,
2026
,
5.75
%
,
9/01/56
...................
150,000
150,454
County
of
Montgomery
,
Crockett
Meadows
Public
Improvement
District
Improvement
Area
No.
1
,
Special
Assessment
,
2025
,
5.5
%
,
9/15/54
......................
123,000
123,733
d
East
Waller
County
Management
District
,
Sofi
Lakes
Sections
1
&
2
Assessments
,
Special
Assessment
,
144A,
2025
,
6.25
%
,
9/15/55
.........................
131,000
135,026
EP
Cimarron
Ventanas
PFC
,
Revenue
,
2024
,
Refunding
,
4.125
%
,
12/01/39
........
150,000
153,023
Harris
County
Municipal
Utility
District
No.
540
,
GO
,
2022
,
5.5
%
,
9/01/49
..........
100,000
98,282
New
Hope
Cultural
Education
Facilities
Finance
Corp.
,
NCCD-College
Station
Properties
LLC
,
Revenue
,
A
,
5
%
,
7/01/47
..............
90,000
86,902
Quality
Senior
Housing
Foundation
of
East
Texas,
Inc.
,
Revenue
,
2019
A-1
,
5
%
,
12/01/39
.......................................................
85,000
86,251
Quality
Senior
Housing
Foundation
of
East
Texas,
Inc.
,
Revenue,
Second
Tier,
Sub.
Lien
,
2019
B
,
5.5
%
,
12/01/54
.......................................
180,000
170,429
Walden
Pond
Fresh
Water
Supply
District
,
GO
,
2022
,
6.25
%
,
9/01/47
............
45,000
45,808
4,312,450
Washington
0.5%
Washington
State
Housing
Finance
Commission
,
Eastside
Retirement
Association
Obligated
Group
,
Revenue
,
2023
A
,
Refunding
,
5
%
,
7/01/48
........................................................
120,000
120,957
d
Presbyterian
Retirement
Communities
Northwest
Obligated
Group
,
Revenue
,
144A,
2019
A
,
5
%
,
1/01/55
..............................................
100,000
91,510
212,467
Wisconsin
4.0%
Public
Finance
Authority
,
Campus
Real
Estate
Holding
Corp.
LLC
,
Revenue
,
2025
A
,
Refunding
,
5.5
%
,
6/01/55
310,000
315,559
d
Foundation
Academy
Charter
School
A
NJ
Nonprofit
Corp.
,
Revenue
,
144A,
2024
,
5
%
,
7/01/60
....................................................
300,000
273,911
d
Friends
Homes
Obligated
Group
,
Revenue
,
144A,
2019
,
Refunding
,
5
%
,
9/01/49
..
125,000
122,582
KSU
Bixby
Real
Estate
Foundation
LLC
,
Revenue,
Sub.
Lien
,
2025
B
,
5.5
%
,
6/15/55
100,000
101,456
NC
A&T
Real
Estate
Foundation
LLC
,
Revenue
,
2024
A
,
5.25
%
,
6/01/54
........
145,000
146,780
RED
River
Valley
Alliance
LLC
,
Revenue
,
2021
,
4
%
,
9/30/51
.................
345,000
294,161
SR
400
Peach
Partners
LLC
,
Revenue,
Senior
Lien
,
2025
,
6.5
%
,
12/31/65
.......
100,000
111,297
Triad
Math
&
Science
Academy
Co.
,
Revenue
,
2025
,
Refunding
,
5.5
%
,
6/15/55
...
100,000
98,161
Triad
Math
&
Science
Academy
Co.
,
Revenue
,
2025
,
Refunding
,
5.25
%
,
6/15/65
..
100,000
92,810
Franklin
Strategic
Series
Schedule
of
Investments
(unaudited)
Franklin
Templeton
SMACS:
Series
H
(continued)
The
accompanying
notes
are
an
integral
part
of
these
financial
statements.
Semiannual
Report
See
A
bbreviations
on
page
48
.
a
a
Principal
Amount
a
Value
a
a
a
a
a
Municipal
Bonds
(continued)
Wisconsin
(continued)
Wisconsin
Health
&
Educational
Facilities
Authority
,
PHW
Menomonee
Falls,
Inc.
,
Revenue
,
2024
,
6.125
%
,
10/01/59
.....................................
$
100,000
$
104,499
1,661,216
U.S.
Territories
7.0%
District
of
Columbia
0.6%
District
of
Columbia
,
International
School
Obligated
Group
,
Revenue
,
2019
,
5
%
,
7/01/49
............
140,000
139,059
Plenary
Infrastructure
DC
LLC
,
Revenue
,
2022
A
,
5.5
%
,
8/31/33
..............
100,000
116,674
255,733
Puerto
Rico
6.4%
Commonwealth
of
Puerto
Rico
,
GO
,
2022
A-1
,
4
%
,
7/01/41
..........................................
314,382
305,131
GO
,
2022
A-1
,
4
%
,
7/01/46
..........................................
296,826
267,989
GDB
Debt
Recovery
Authority
of
Puerto
Rico
,
7.5
%
,
8/20/40
...................
79,782
78,469
Puerto
Rico
Sales
Tax
Financing
Corp.
,
Sales
Tax
,
Revenue
,
A-1
,
5
%
,
7/01/58
.....
2,051,000
2,013,115
2,664,704
Total
U.S.
Territories
....................................................................
2,920,437
Total
Municipal
Bonds
(Cost
$
36,220,839
)
......................................
37,178,726
Total
Long
Term
Investments
(Cost
$
40,161,555
)
................................
41,247,622
a
a
a
a
a
Short
Term
Investments
1.9%
Municipal
Bonds
1.9%
North
Carolina
1.0%
h
Charlotte-Mecklenburg
Hospital
Authority
(The)
,
Atrium
Health
Obligated
Group
,
Revenue
,
2018
H
,
SPA
JPMorgan
Chase
Bank
NA
,
Daily
VRDN
and
Put
,
1.9
%
,
1/15/48
.........................................................
400,000
400,000
Oregon
0.9%
h
Oregon
State
Facilities
Authority
,
PeaceHealth
Obligated
Group
,
Revenue
,
2018
B
,
Refunding
,
LOC
TD
Bank
NA
,
Daily
VRDN
and
Put
,
1.9
%
,
8/01/34
.............
400,000
400,000
Total
Municipal
Bonds
(Cost
$
800,000
)
.........................................
800,000
Total
Short
Term
Investments
(Cost
$
800,000
)
..................................
800,000
a
Total
Investments
(Cost
$
40,961,555
)
100.5
%
...................................
$42,047,622
Other
Assets,
less
Liabilities
(
0.5
)
%
...........................................
(201,621)
Net
Assets
100.0%
...........................................................
$41,846,001
a
Fair
valued
using
significant
unobservable
inputs.
See
Note
9
regarding
fair
value
measurements.
b
Non-income
producing.
c
See
Note
3(d)
regarding
investments
in
affiliated
management
investment
companies.
d
Security
was
purchased
pursuant
to
Rule
144A
or
Regulation
S
under
the
Securities
Act
of
1933.
144A
securities
may
be
sold
in
transactions
exempt
from
registration
only
to
qualified
institutional
buyers
or
in
a
public
offering
registered
under
the
Securities
Act
of
1933.
Regulation
S
securities
cannot
be
sold
in
the
United
States
without
either
an
effective
registration
statement
filed
pursuant
to
the
Securities
Act
of
1933,
or
pursuant
to
an
exemption
from
registration.
At
February
28,
2026,
the
aggregate
value
of
these
securities
was
$8,628,060,
representing
20.6%
of
net
assets.
e
Security
purchased
on
a
when-issued
basis.
See
Note
1(c).
f
The
maturity
date
shown
represents
the
mandatory
put
date.
Franklin
Strategic
Series
Schedule
of
Investments
(unaudited)
Franklin
Templeton
SMACS:
Series
H
(continued)
Semiannual
Report
The
accompanying
notes
are
an
integral
part
of
these
financial
statements.
g
The
rate
shown
represents
the
yield
at
period
end.
h
Variable
rate
demand
notes
(VRDN)
are
obligations
which
contain
a
floating
or
variable
interest
rate
adjustment
formula
and
an
unconditional
right
of
demand
to
receive
pay-
ment
of
the
principal
balance
plus
accrued
interest
at
specified
dates.
Unless
otherwise
noted,
the
coupon
rate
is
determined
based
on
factors
including
supply
and
demand,
underlying
credit,
tax
treatment,
and
current
short
term
rates.
The
coupon
rate
shown
represents
the
rate
at
period
end.
Franklin
Strategic
Series
Financial
Highlights
Franklin
Templeton
SMACS:
Series
I
The
accompanying
notes
are
an
integral
part
of
these
financial
statements.
Semiannual
Report
a
Six
Months
Ended
February
28,
2026
(unaudited)
Year
Ended
August
31,
2025
2024
2023
2022
2021
Per
share
operating
performance
(for
a
share
outstanding
throughout
the
period)
Net
asset
value,
beginning
of
period
.....
$8.07
$8.11
$7.78
$7.83
$9.73
$8.95
Income
from
investment
operations
a
:
Net
investment
income
b
.............
0.31
0.61
0.61
0.64
0.65
0.66
Net
realized
and
unrealized
gains
(losses)
0.10
(0.03)
0.33
(0.07)
(1.85)
0.78
Total
from
investment
operations
........
0.41
0.58
0.94
0.57
(1.20)
1.44
Less
distributions
from:
Net
investment
income
..............
(0.30)
(0.62)
(0.61)
(0.62)
(0.70)
(0.66)
Tax
return
of
capital
................
—
—
—
(—)
c
(—)
c
—
Total
distributions
...................
(0.30)
(0.62)
(0.61)
(0.62)
(0.70)
(0.66)
Net
asset
value,
end
of
period
..........
$8.18
$8.07
$8.11
$7.78
$7.83
$9.73
Total
return
d
.......................
5.24%
7.57%
12.71%
7.57%
(12.87)%
16.48%
Ratios
to
average
net
assets
e
Expenses
before
waiver
and
payments
by
affiliates
..........................
0.05%
0.06%
0.08%
0.20%
1.27%
3.10%
Expenses
net
of
waiver
and
payments
by
affiliates
..........................
—%
—%
—%
—%
f
—%
—%
f
Net
investment
income
...............
7.63%
7.68%
7.81%
8.24%
7.72%
7.01%
Supplemental
data
Net
assets
,
end
of
period
(000’s)
........
$784,848
$615,016
$373,874
$109,051
$19,910
$3,699
Portfolio
turnover
rate
................
20.79%
52.45%
16.69%
27.73%
30.22%
32.50%
a
The
amount
shown
for
a
share
outstanding
throughout
the
period
may
not
correlate
with
the
Statement
of
Operations
for
the
period
due
to
the
timing
of
sales
and
repurchases
of
the
Fund’s
shares
in
relation
to
income
earned
and/or
fluctuating
fair
value
of
the
investments
of
the
Fund.
b
Based
on
average
daily
shares
outstanding.
c
Amount
rounds
to
less
than
$0.01
per
share.
d
Total
return
is
not
annualized
for
periods
less
than
one
year.
e
Ratios
are
annualized
for
periods
less
than
one
year.
f
Benefit
of
expense
reduction
rounds
to
less
than
0.01%.
Franklin
Strategic
Series
Schedule
of
Investments
(unaudited),
February
28,
2026
Franklin
Templeton
SMACS:
Series
I
Semiannual
Report
The
accompanying
notes
are
an
integral
part
of
these
financial
statements.
a
a
Shares
a
Value
a
Common
Stocks
0.3%
Banks
0.3%
Bank
of
America
Corp.
...............................................
45,000
$
2,242,350
Pharmaceuticals
0.0%
†
a
Keenova
Therapeutics
plc
.............................................
1,196
109,315
a
Total
Common
Stocks
(Cost
$
1,346,417
)
.......................................
2,351,665
a
b
Equity-Linked
Securities
0.0%
†
Energy
Equipment
&
Services
0.0%
†
c
Citigroup
Global
Markets
Holdings,
Inc.
into
Halliburton
Co.
,
144A,
10
%
,
1/21/27
....
6,000
206,034
Total
Equity-Linked
Securities
(Cost
$
196,320
)
..................................
206,034
Principal
Amount
a
a
a
a
Corporate
Bonds
77.1%
Aerospace
&
Defense
2.2%
c
TransDigm,
Inc.
,
Senior
Secured
Note
,
144A,
6.75
%
,
8/15/28
..............................
$
1,500,000
1,528,582
Senior
Secured
Note
,
144A,
6.875
%
,
12/15/30
............................
2,500,000
2,603,370
Senior
Secured
Note
,
144A,
6.625
%
,
3/01/32
.............................
8,000,000
8,297,936
Senior
Sub.
Note
,
144A,
6.75
%
,
1/31/34
.................................
4,250,000
4,414,205
16,844,093
Automobile
Components
0.6%
c
Dornoch
Debt
Merger
Sub,
Inc.
,
Senior
Note
,
144A,
6.625
%
,
10/15/29
...........
5,000,000
4,521,073
Automobiles
0.2%
c
Rivian
Holdings
LLC
/
Rivian
LLC
/
Rivian
Automotive
LLC
,
Senior
Secured
Note
,
144A,
10
%
,
1/15/31
................................................
2,000,000
1,893,453
Banks
2.0%
Bank
of
America
Corp.
,
d
Junior
Sub.
Bond
,
6.25%
to
7/25/30,
FRN
thereafter
,
Perpetual
...............
4,000,000
4,118,209
Sub.
Bond
,
5.425%
to
8/14/34,
FRN
thereafter
,
8/15/35
.....................
50,000
51,243
Barclays
plc
,
d
Junior
Sub.
Bond
,
7.625%
to
9/14/35,
FRN
thereafter
,
Perpetual
...............
2,000,000
2,124,420
Sub.
Bond
,
7.119%
to
6/26/33,
FRN
thereafter
,
6/27/34
.....................
200,000
224,672
d
Citigroup,
Inc.
,
GG
,
Junior
Sub.
Bond
,
6.875%
to
8/14/30,
FRN
thereafter
,
Perpetual
.
5,000,000
5,129,775
Fifth
Third
Bancorp
,
Senior
Note
,
6.339%
to
7/26/28,
FRN
thereafter
,
7/27/29
......
50,000
52,584
Wells
Fargo
&
Co.
,
d
Junior
Sub.
Bond
,
6.85%
to
9/14/29,
FRN
thereafter
,
Perpetual
...............
4,000,000
4,221,612
Senior
Bond
,
6.491%
to
10/22/33,
FRN
thereafter
,
10/23/34
..................
100,000
111,074
16,033,589
Biotechnology
0.5%
c
Genmab
A/S
/
Genmab
Finance
LLC
,
Senior
Note
,
144A,
7.25
%
,
12/15/33
....................................
1,250,000
1,327,138
Senior
Secured
Note
,
144A,
6.25
%
,
12/15/32
.............................
2,750,000
2,855,856
4,182,994
Building
Products
0.7%
c
EMRLD
Borrower
LP
/
Emerald
Co-Issuer,
Inc.
,
Senior
Secured
Note
,
144A,
6.625
%
,
12/15/30
........................................................
2,000,000
2,072,490
c
Quikrete
Holdings,
Inc.
,
Senior
Secured
Note
,
144A,
6.375
%
,
3/01/32
............
3,000,000
3,119,844
5,192,334
Franklin
Strategic
Series
Schedule
of
Investments
(unaudited)
Franklin
Templeton
SMACS:
Series
I
(continued)
The
accompanying
notes
are
an
integral
part
of
these
financial
statements.
Semiannual
Report
a
a
Principal
Amount
a
Value
a
a
a
a
a
Corporate
Bonds
(continued)
Capital
Markets
0.3%
Charles
Schwab
Corp.
(The)
,
Senior
Note
,
5.643%
to
5/18/28,
FRN
thereafter
,
5/19/29
$
50,000
$
51,907
d
Goldman
Sachs
Group,
Inc.
(The)
,
Junior
Sub.
Bond
,
6.85%
to
2/09/30,
FRN
thereafter
,
Perpetual
........................................................
2,000,000
2,095,676
Morgan
Stanley
,
Senior
Bond
,
6.627%
to
10/31/33,
FRN
thereafter
,
11/01/34
..................
100,000
112,377
Sub.
Bond
,
5.948%
to
1/18/33,
FRN
thereafter
,
1/19/38
.....................
50,000
52,727
2,312,687
Chemicals
4.7%
Celanese
US
Holdings
LLC
,
Senior
Bond
,
7.379
%
,
7/15/32
........................................
2,000,000
2,110,224
Senior
Bond
,
7.2
%
,
11/15/33
.........................................
3,500,000
3,762,784
Senior
Note
,
7.05
%
,
11/15/30
.........................................
1,000,000
1,066,989
c
Rain
Carbon,
Inc.
,
Senior
Secured
Note
,
144A,
12.25
%
,
9/01/29
................
3,500,000
3,731,476
c
SCIH
Salt
Holdings,
Inc.
,
Senior
Note
,
144A,
6.625
%
,
5/01/29
..................
6,000,000
5,989,860
c
Tronox,
Inc.
,
Senior
Note
,
144A,
4.625
%
,
3/15/29
....................................
13,000,000
10,062,816
Senior
Secured
Note
,
144A,
9.125
%
,
9/30/30
.............................
10,000,000
9,827,327
36,551,476
Commercial
Services
&
Supplies
0.3%
c
RR
Donnelley
&
Sons
Co.
,
Senior
Secured
Note
,
144A,
9.5
%
,
8/01/29
...........
2,500,000
2,578,497
Consumer
Finance
0.5%
AerCap
Ireland
Capital
DAC
/
AerCap
Global
Aviation
Trust
,
Senior
Bond
,
5.3
%
,
1/19/34
.........................................................
200,000
205,820
Ford
Motor
Credit
Co.
LLC
,
Senior
Note
,
7.2
%
,
6/10/30
.......................
3,000,000
3,240,260
c
Macquarie
Airfinance
Holdings
Ltd.
,
Senior
Note
,
144A,
6.4
%
,
3/26/29
............
50,000
52,740
3,498,820
Containers
&
Packaging
4.7%
c
Ardagh
Group
SA
,
e
Secured
Note
,
144A,
PIK,
12
%
,
12/01/30
................................
6,000,000
5,721,417
Senior
Secured
Note
,
144A,
9.5
%
,
12/01/30
..............................
7,315,000
7,927,464
c
Ardagh
Metal
Packaging
Finance
USA
LLC
/
Ardagh
Metal
Packaging
Finance
plc
,
Senior
Note
,
144A,
4
%
,
9/01/29
.......................................
1,000,000
955,291
c
Clydesdale
Acquisition
Holdings,
Inc.
,
Senior
Secured
Note
,
144A,
6.75
%
,
4/15/32
..
2,500,000
2,520,839
c
Mauser
Packaging
Solutions
Holding
Co.
,
Secured
Note
,
144A,
9.25
%
,
4/15/30
...................................
12,000,000
11,835,223
Senior
Secured
Note
,
144A,
7.875
%
,
4/15/30
.............................
5,500,000
5,633,513
c
Toucan
FinCo
Ltd.
/
Toucan
FinCo
Can,
Inc.
/
Toucan
FinCo
US
LLC
,
Senior
Secured
Note
,
144A,
9.5
%
,
5/15/30
...........................................
2,000,000
1,899,643
36,493,390
Diversified
REITs
0.0%
†
c
VICI
Properties
LP
/
VICI
Note
Co.,
Inc.
,
Senior
Bond
,
144A,
4.625
%
,
12/01/29
.....
50,000
49,968
Diversified
Telecommunication
Services
7.0%
c
APLD
ComputeCo
LLC
,
Senior
Secured
Note
,
144A,
9.25
%
,
12/15/30
............
3,500,000
3,676,337
c
CCO
Holdings
LLC
/
CCO
Holdings
Capital
Corp.
,
Senior
Bond
,
144A,
5.125
%
,
5/01/27
...................................
1,538,000
1,540,109
Senior
Bond
,
144A,
5
%
,
2/01/28
.......................................
7,500,000
7,488,404
Senior
Note
,
144A,
6.375
%
,
9/01/29
....................................
11,000,000
11,153,482
Senior
Note
,
144A,
7
%
,
2/01/33
.......................................
18,000,000
18,417,618
c
Cipher
Compute
LLC
,
Senior
Secured
Note
,
144A,
7.125
%
,
11/15/30
............
3,500,000
3,652,579
c
Connect
Holding
II
LLC
,
Senior
Secured
Note
,
144A,
10.5
%
,
4/03/31
.............
5,500,000
5,324,946
Franklin
Strategic
Series
Schedule
of
Investments
(unaudited)
Franklin
Templeton
SMACS:
Series
I
(continued)
Semiannual
Report
The
accompanying
notes
are
an
integral
part
of
these
financial
statements.
a
a
Principal
Amount
a
Value
a
a
a
a
a
Corporate
Bonds
(continued)
Diversified
Telecommunication
Services
(continued)
c
WULF
Compute
LLC
,
Senior
Secured
Note
,
144A,
7.75
%
,
10/15/30
.............
$
3,500,000
$
3,709,209
54,962,684
Electric
Utilities
2.7%
c
NRG
Energy,
Inc.
,
Senior
Bond
,
144A,
6.25
%
,
11/01/34
...................................
3,000,000
3,104,081
Senior
Bond
,
144A,
6
%
,
1/15/36
.......................................
10,000,000
10,182,820
Senior
Note
,
144A,
6
%
,
2/01/33
.......................................
3,000,000
3,074,171
Senior
Secured
Bond
,
144A,
7
%
,
3/15/33
................................
50,000
55,674
Pacific
Gas
and
Electric
Co.
,
Senior
Bond
,
6.4
%
,
6/15/33
.....................
50,000
54,492
PG&E
Corp.
,
Senior
Secured
Note
,
5
%
,
7/01/28
............................
50,000
49,897
c
Vistra
Operations
Co.
LLC
,
Senior
Note
,
144A,
6.875
%
,
4/15/32
....................................
4,000,000
4,209,960
Senior
Secured
Bond
,
144A,
6.95
%
,
10/15/33
............................
50,000
56,085
20,787,180
Electrical
Equipment
0.0%
†
Regal
Rexnord
Corp.
,
Senior
Note
,
6.05
%
,
4/15/28
..........................
50,000
51,854
Energy
Equipment
&
Services
0.9%
c
Transocean
International
Ltd.
,
Senior
Note
,
144A,
8.5
%
,
5/15/31
................
2,500,000
2,645,301
c
Weatherford
International
Ltd.
,
Senior
Note
,
144A,
8.625
%
,
4/30/30
....................................
2,384,000
2,457,942
Senior
Note
,
144A,
6.75
%
,
10/15/33
....................................
2,000,000
2,092,028
7,195,271
Entertainment
0.0%
†
c
Netflix,
Inc.
,
Senior
Bond
,
144A,
5.375
%
,
11/15/29
..........................
100,000
104,364
Food
Products
0.3%
JBS
NV
/
JBS
USA
Foods
Group
Holdings,
Inc.
/
JBS
USA
Food
Co.
Holdings
,
Senior
Note
,
5.75
%
,
4/01/33
...............................................
50,000
52,612
c
Post
Holdings,
Inc.
,
Senior
Secured
Note
,
144A,
6.25
%
,
2/15/32
................
2,000,000
2,059,894
2,112,506
Ground
Transportation
0.0%
†
c
Ashtead
Capital,
Inc.
,
Senior
Bond
,
144A,
5.95
%
,
10/15/33
....................
200,000
213,501
Health
Care
Equipment
&
Supplies
0.6%
c
Medline
Borrower
LP
,
Senior
Note
,
144A,
5.25
%
,
10/01/29
....................
5,000,000
5,002,853
Health
Care
Providers
&
Services
18.0%
c
CHS/Community
Health
Systems,
Inc.
,
144A,
10.75
%
,
6/15/33
..............................................
17,500,000
18,745,212
Secured
Note
,
144A,
6.875
%
,
4/15/29
..................................
15,000,000
14,504,805
Secured
Note
,
144A,
6.125
%
,
4/01/30
..................................
30,000,000
26,554,219
Senior
Secured
Note
,
144A,
10.875
%
,
1/15/32
............................
12,800,000
13,887,693
Senior
Secured
Note
,
144A,
9.75
%
,
1/15/34
..............................
10,000,000
10,550,690
CVS
Health
Corp.
,
Junior
Sub.
Bond
,
6.75%
to
12/09/34,
FRN
thereafter
,
12/10/54
...............
2,500,000
2,601,875
Junior
Sub.
Bond
,
7%
to
3/09/30,
FRN
thereafter
,
3/10/55
...................
5,000,000
5,262,045
c
DaVita,
Inc.
,
Senior
Bond
,
144A,
3.75
%
,
2/15/31
....................................
6,000,000
5,610,617
Senior
Note
,
144A,
6.875
%
,
9/01/32
....................................
3,000,000
3,119,133
Senior
Note
,
144A,
6.75
%
,
7/15/33
.....................................
500,000
519,496
c
Kedrion
SpA
,
Senior
Secured
Note
,
144A,
6.5
%
,
9/01/29
......................
1,000,000
973,965
Tenet
Healthcare
Corp.
,
Senior
Note
,
6.125
%
,
10/01/28
........................................
12,000,000
12,034,716
Senior
Secured
Note
,
6.125
%
,
6/15/30
..................................
11,000,000
11,233,134
Franklin
Strategic
Series
Schedule
of
Investments
(unaudited)
Franklin
Templeton
SMACS:
Series
I
(continued)
The
accompanying
notes
are
an
integral
part
of
these
financial
statements.
Semiannual
Report
a
a
Principal
Amount
a
Value
a
a
a
a
a
Corporate
Bonds
(continued)
Health
Care
Providers
&
Services
(continued)
Tenet
Healthcare
Corp.,
(continued)
Senior
Secured
Note
,
6.75
%
,
5/15/31
...................................
$
15,000,000
$
15,615,368
141,212,968
Hotels,
Restaurants
&
Leisure
6.0%
c
Caesars
Entertainment,
Inc.
,
Senior
Note
,
144A,
6
%
,
10/15/32
......................................
8,000,000
7,826,931
Senior
Secured
Note
,
144A,
7
%
,
2/15/30
................................
4,500,000
4,615,893
c
Carnival
Corp.
,
Senior
Note
,
144A,
6.125
%
,
2/15/33
.........................
8,500,000
8,804,861
c
Fertitta
Entertainment
LLC
/
Fertitta
Entertainment
Finance
Co.,
Inc.
,
Senior
Note
,
144A,
6.75
%
,
1/15/30
...............................................
12,000,000
11,328,178
c
Mohegan
Tribal
Gaming
Authority
/
MS
Digital
Entertainment
Holdings
LLC
,
Senior
Secured
Note
,
144A,
8.25
%
,
4/15/30
...................................
3,000,000
3,128,349
c
NCL
Corp.
Ltd.
,
Senior
Note
,
144A,
6.75
%
,
2/01/32
..........................
750,000
772,890
c
Wynn
Resorts
Finance
LLC
/
Wynn
Resorts
Capital
Corp.
,
Senior
Note
,
144A,
7.125
%
,
2/15/31
.........................................................
10,000,000
10,804,250
47,281,352
Household
Durables
0.9%
Newell
Brands,
Inc.
,
c
Senior
Note
,
144A,
8.5
%
,
6/01/28
.....................................
5,000,000
5,265,707
Senior
Note
,
6.375
%
,
5/15/30
.........................................
2,000,000
2,007,744
7,273,451
Independent
Power
and
Renewable
Electricity
Producers
1.3%
c
,d
Vistra
Corp.
,
Junior
Sub.
Bond
,
144A,
8%
to
10/14/26,
FRN
thereafter
,
Perpetual
....
10,000,000
10,193,410
Insurance
1.0%
c
Asurion
LLC
and
Asurion
Co-Issuer,
Inc.
,
Senior
Secured
Note
,
144A,
8
%
,
12/31/32
...............................
4,000,000
4,204,672
Senior
Secured
Note
,
144A,
8.375
%
,
2/01/34
.............................
4,000,000
3,983,147
8,187,819
IT
Services
0.9%
c
CoreWeave,
Inc.
,
Senior
Note
,
144A,
9.25
%
,
6/01/30
........................
7,500,000
7,353,674
Media
0.4%
c
Stagwell
Global
LLC
,
Senior
Note
,
144A,
5.625
%
,
8/15/29
.....................
200,000
184,541
c
Univision
Communications,
Inc.
,
Senior
Secured
Note
,
144A,
9.375
%
,
8/01/32
.....
2,500,000
2,647,503
2,832,044
Metals
&
Mining
2.4%
c
Alcoa
Nederland
Holding
BV
,
Senior
Note
,
144A,
4.125
%
,
3/31/29
...............
750,000
738,092
ArcelorMittal
SA
,
Senior
Bond
,
6.8
%
,
11/29/32
..............................
50,000
56,762
c
Cleveland-Cliffs,
Inc.
,
Senior
Note
,
144A,
7.375
%
,
5/01/33
....................................
8,000,000
8,216,537
Senior
Note
,
144A,
7.625
%
,
1/15/34
....................................
2,250,000
2,310,618
c
Fortescue
Treasury
Pty.
Ltd.
,
Senior
Bond
,
144A,
4.375
%
,
4/01/31
...................................
800,000
776,155
Senior
Bond
,
144A,
6.125
%
,
4/15/32
...................................
6,000,000
6,289,454
c
Mineral
Resources
Ltd.
,
Senior
Note
,
144A,
8.5
%
,
5/01/30
....................
550,000
569,532
18,957,150
Oil,
Gas
&
Consumable
Fuels
8.9%
c
Calumet
Specialty
Products
Partners
LP
/
Calumet
Finance
Corp.
,
Senior
Note
,
144A,
9.75
%
,
7/15/28
.....................................
3,000,000
3,132,585
Senior
Note
,
144A,
9.75
%
,
2/15/31
.....................................
4,000,000
4,264,160
Senior
Secured
Note
,
144A,
9.25
%
,
7/15/29
..............................
3,000,000
3,075,000
Franklin
Strategic
Series
Schedule
of
Investments
(unaudited)
Franklin
Templeton
SMACS:
Series
I
(continued)
Semiannual
Report
The
accompanying
notes
are
an
integral
part
of
these
financial
statements.
a
a
Principal
Amount
a
Value
a
a
a
a
a
Corporate
Bonds
(continued)
Oil,
Gas
&
Consumable
Fuels
(continued)
Cheniere
Corpus
Christi
Holdings
LLC
,
Senior
Secured
Note
,
3.7
%
,
11/15/29
......
$
100,000
$
98,655
Energy
Transfer
LP
,
Senior
Bond
,
6.55
%
,
12/01/33
..........................
50,000
55,392
c
Hilcorp
Energy
I
LP
/
Hilcorp
Finance
Co.
,
Senior
Bond
,
144A,
7.25
%
,
2/15/35
....................................
7,000,000
6,937,539
Senior
Note
,
144A,
6
%
,
4/15/30
.......................................
1,000,000
988,031
c
Matador
Resources
Co.
,
Senior
Note
,
144A,
6.5
%
,
4/15/32
....................
4,000,000
4,087,183
Occidental
Petroleum
Corp.
,
Senior
Note
,
8.875
%
,
7/15/30
....................
50,000
58,128
c
Venture
Global
LNG,
Inc.
,
d
Junior
Sub.
Bond
,
144A,
9%
to
9/29/29,
FRN
thereafter
,
Perpetual
.............
16,000,000
14,004,975
Senior
Secured
Note
,
144A,
8.125
%
,
6/01/28
.............................
10,000,000
10,266,150
Senior
Secured
Note
,
144A,
9.875
%
,
2/01/32
.............................
14,000,000
14,842,436
c
Venture
Global
Plaquemines
LNG
LLC
,
Senior
Secured
Bond
,
144A,
7.75
%
,
5/01/35
.............................
2,000,000
2,269,544
Senior
Secured
Note
,
144A,
6.125
%
,
12/15/30
............................
2,000,000
2,078,586
Senior
Secured
Note
,
144A,
6.5
%
,
6/15/34
...............................
3,000,000
3,151,398
Williams
Cos.,
Inc.
(The)
,
Senior
Bond
,
5.65
%
,
3/15/33
.......................
100,000
105,847
69,415,609
Passenger
Airlines
0.6%
American
Airlines,
Inc.
/
AAdvantage
Loyalty
IP
Ltd.
,
c
Senior
Secured
Note
,
144A,
5.5
%
,
4/20/26
...............................
333,333
333,998
c
Delta
Air
Lines,
Inc.
/
SkyMiles
IP
Ltd.
,
Senior
Secured
Note
,
144A,
4.75
%
,
10/20/28
.
45,833
46,245
c
JetBlue
Airways
Corp.
/
JetBlue
Loyalty
LP
,
Senior
Secured
Note
,
144A,
9.875
%
,
9/20/31
.........................................................
4,500,000
4,577,179
4,957,422
Personal
Care
Products
0.4%
c
Opal
Bidco
SAS
,
Senior
Secured
Note
,
144A,
6.5
%
,
3/31/32
...................
3,000,000
3,091,941
Pharmaceuticals
3.5%
c
1261229
BC
Ltd.
,
Senior
Secured
Note
,
144A,
10
%
,
4/15/32
...................
13,000,000
13,455,100
c
Endo
Finance
Holdings
LP
,
Senior
Secured
Note
,
144A,
8.5
%
,
4/15/31
...........
2,000,000
2,126,856
c
Organon
&
Co.
/
Organon
Foreign
Debt
Co-Issuer
BV
,
Senior
Bond
,
144A,
5.125
%
,
4/30/31
...................................
2,500,000
2,223,726
Senior
Note
,
144A,
7.875
%
,
5/15/34
....................................
7,500,000
6,999,092
Senior
Secured
Note
,
144A,
4.125
%
,
4/30/28
.............................
3,000,000
2,946,827
27,751,601
Semiconductors
&
Semiconductor
Equipment
0.4%
Micron
Technology,
Inc.
,
Senior
Bond
,
5.875
%
,
2/09/33
.......................
200,000
215,461
c
Qnity
Electronics,
Inc.
,
Senior
Note
,
144A,
6.25
%
,
8/15/33
.....................................
1,000,000
1,039,549
Senior
Secured
Note
,
144A,
5.75
%
,
8/15/32
..............................
1,500,000
1,536,625
2,791,635
Software
1.8%
c
Cloud
Software
Group,
Inc.
,
Secured
Note
,
144A,
9
%
,
9/30/29
.....................................
6,000,000
5,882,065
Senior
Secured
Note
,
144A,
6.5
%
,
3/31/29
...............................
3,000,000
2,944,641
c
McAfee
Corp.
,
Senior
Note
,
144A,
7.375
%
,
2/15/30
..........................
6,000,000
4,916,367
13,743,073
Specialized
REITs
0.3%
American
Tower
Corp.
,
Senior
Note
,
4.05
%
,
3/15/32
.........................
50,000
49,308
c
Millrose
Properties,
Inc.
,
Senior
Note
,
144A,
6.375
%
,
8/01/30
..................
2,500,000
2,566,250
2,615,558
Franklin
Strategic
Series
Schedule
of
Investments
(unaudited)
Franklin
Templeton
SMACS:
Series
I
(continued)
The
accompanying
notes
are
an
integral
part
of
these
financial
statements.
Semiannual
Report
a
a
Principal
Amount
a
Value
a
a
a
a
a
Corporate
Bonds
(continued)
Specialty
Retail
0.0%
†
Lowe's
Cos.,
Inc.
,
Senior
Bond
,
5
%
,
4/15/33
...............................
$
60,000
$
61,953
Technology
Hardware,
Storage
&
Peripherals
0.0%
†
Hewlett
Packard
Enterprise
Co.
,
Senior
Bond
,
5
%
,
10/15/34
...................
50,000
49,568
HP,
Inc.
,
Senior
Bond
,
5.5
%
,
1/15/33
.....................................
80,000
82,230
131,798
Textiles,
Apparel
&
Luxury
Goods
1.8%
c
,e
Beach
Acquisition
Bidco
LLC
,
Senior
Note
,
144A,
PIK,
10
%
,
7/15/33
.............
13,175,607
14,391,587
Tobacco
0.0%
†
BAT
Capital
Corp.
,
Senior
Bond
,
6.421
%
,
8/02/33
...........................
50,000
55,630
Trading
Companies
&
Distributors
0.3%
c
Herc
Holdings,
Inc.
,
Senior
Note
,
144A,
7
%
,
6/15/30
.........................
2,000,000
2,097,084
c
United
Rentals
North
America,
Inc.
,
Senior
Secured
Note
,
144A,
6
%
,
12/15/29
.....
50,000
51,316
2,148,400
Total
Corporate
Bonds
(Cost
$
581,696,788
)
.....................................
605,030,662
f
Senior
Floating
Rate
Interests
2.7%
Containers
&
Packaging
0.3%
g
Clydesdale
Acquisition
Holdings,
Inc.,
First
Lien,
2025
Incremental
Closing
Date
CME
Term
Loan,
B
,
6.923
%
,
(
1-month
SOFR
+
3.25
%
),
4/01/32
...................
2,480,465
2,458,761
Health
Care
Equipment
&
Supplies
1.3%
g
,h
Hologic,
Inc.,
First
Lien,
CME
Term
Loan
,
5
%
,
(
3-month
SOFR
+
5
%
),
1/14/33
......
7,000,000
6,922,706
g
,h
Hologic,
Inc.,
First
Lien,
CME
Term
Loan,
B
,
5.755
%
,
(
12-month
SOFR
+
2.25
%
),
1/14/33
.........................................................
3,000,000
2,968,125
9,890,831
a
a
a
a
a
Health
Care
Providers
&
Services
0.1%
g
MPH
Acquisition
Holdings
LLC,
First
Lien,
Exchange
First
Out
CME
Term
Loan
,
7.417
%
,
(
3-month
SOFR
+
3.75
%
),
12/31/30
.............................
533,370
527,504
IT
Services
0.8%
g
X
Corp.,
First
Lien,
CME
Term
Loan,
B1
,
10.448
%
,
(
6-month
SOFR
+
6.5
%
),
10/26/29
5,938,776
5,961,670
Personal
Care
Products
0.2%
g
OPAL
US
LLC,
First
Lien,
CME
Term
Loan,
B4
,
6.686
%
,
(
3-month
SOFR
+
3
%
),
4/28/32
.........................................................
1,995,000
1,995,249
Total
Senior
Floating
Rate
Interests
(Cost
$
20,695,825
)
..........................
20,834,015
Mortgage-Backed
Securities
18.4%
Federal
Home
Loan
Mortgage
Corp.
(FHLMC)
Fixed
Rate
6.4%
FHLMC
Pool,
30
Year
,
5
%,
5/01/53
-
11/01/54
..............................
6,073,276
6,115,873
FHLMC
Pool,
30
Year
,
5
%,
12/01/54
.....................................
10,147,784
10,208,970
FHLMC
Pool,
30
Year
,
5.5
%,
12/01/54
....................................
9,361,975
9,523,206
FHLMC
Pool,
30
Year
,
5.5
%,
7/01/53
-
2/01/55
.............................
15,159,603
15,438,413
FHLMC
Pool,
30
Year
,
6
%,
6/01/53
......................................
2,098,774
2,167,645
FHLMC
Pool,
30
Year
,
6
%,
9/01/55
......................................
6,275,009
6,439,125
49,893,232
Federal
National
Mortgage
Association
(FNMA)
Fixed
Rate
3.8%
FNMA,
30
Year
,
5
%,
5/01/53
-
11/01/53
...................................
5,874,274
5,926,803
FNMA,
30
Year
,
5.5
%,
11/01/54
-
1/01/56
.................................
18,032,066
18,340,379
FNMA,
30
Year
,
6
%,
8/01/55
...........................................
5,253,008
5,391,625
29,658,807
Franklin
Strategic
Series
Schedule
of
Investments
(unaudited)
Franklin
Templeton
SMACS:
Series
I
(continued)
Semiannual
Report
The
accompanying
notes
are
an
integral
part
of
these
financial
statements.
a
a
Principal
Amount
a
Value
a
a
a
a
a
Mortgage-Backed
Securities
(continued)
Government
National
Mortgage
Association
(GNMA)
Fixed
Rate
8.2%
GNMA
II,
Single-family,
30
Year
,
5.5
%,
5/20/55
.............................
$
8,090,910
$
8,206,230
GNMA
II,
Single-family,
30
Year
,
5.5
%,
6/20/55
.............................
3,576,425
3,626,562
GNMA
II,
Single-family,
30
Year
,
5.5
%,
8/20/55
.............................
5,901,907
5,985,619
GNMA
II,
Single-family,
30
Year
,
5.5
%,
10/20/55
............................
21,762,878
22,077,940
GNMA
II,
Single-family,
30
Year
,
5.5
%,
12/20/55
............................
10,698,392
10,870,617
GNMA
II,
Single-family,
30
Year
,
6
%,
8/20/55
...............................
7,832,790
7,999,800
GNMA
II,
Single-family,
30
Year
,
6
%,
1/20/56
...............................
5,887,621
6,027,451
64,794,219
Total
Mortgage-Backed
Securities
(Cost
$
142,216,230
)
...........................
144,346,258
Total
Long
Term
Investments
(Cost
$
746,151,580
)
...............................
772,768,634
a
a
a
a
a
Short
Term
Investments
1.1%
Shares
a
Money
Market
Funds
1.1%
i,j
Franklin
Institutional
U.S.
Government
Money
Market
Fund
,
3.583
%
.............
8,674,846
8,674,846
Total
Money
Market
Funds
(Cost
$
8,674,846
)
...................................
8,674,846
Total
Short
Term
Investments
(Cost
$
8,674,846
)
.................................
8,674,846
a
Total
Investments
(Cost
$
754,826,426
)
99.6
%
...................................
$781,443,480
Other
Assets,
less
Liabilities
0.4
%
.............................................
3,404,617
Net
Assets
100.0%
...........................................................
$784,848,097
See
Abbreviations
on
page
48
.
†
Rounds
to
less
than
0.1%
of
net
assets.
a
Non-income
producing.
b
See
Note
1(d)
regarding
equity-linked
securities.
c
Security
was
purchased
pursuant
to
Rule
144A
or
Regulation
S
under
the
Securities
Act
of
1933.
144A
securities
may
be
sold
in
transactions
exempt
from
registration
only
to
qualified
institutional
buyers
or
in
a
public
offering
registered
under
the
Securities
Act
of
1933.
Regulation
S
securities
cannot
be
sold
in
the
United
States
without
either
an
effective
registration
statement
filed
pursuant
to
the
Securities
Act
of
1933,
or
pursuant
to
an
exemption
from
registration.
At
February
28,
2026,
the
aggregate
value
of
these
securities
was
$526,651,672,
representing
67.1%
of
net
assets.
d
Perpetual
security
with
no
stated
maturity
date.
e
Income
may
be
received
in
additional
securities
and/or
cash.
f
See
Note
1(e)
regarding
senior
floating
rate
interests.
g
The
coupon
rate
shown
represents
the
rate
inclusive
of
any
caps
or
floors,
if
applicable,
in
effect
at
period
end.
h
A
portion
or
all
of
the
security
purchased
on
a
delayed
delivery
basis.
See
Note
1(c).
i
See
Note
3(d)
regarding
investments
in
affiliated
management
investment
companies.
j
The
rate
shown
is
the
annualized
seven-day
effective
yield
at
period
end.
Franklin
Strategic
Series
Financial
Statements
Statements
of
Assets
and
Liabilities
February
28,
2026
(unaudited)
The
accompanying
notes
are
an
integral
part
of
these
financial
statements.
Semiannual
Report
Franklin
Templeton
SMACS:
Series
CH
Franklin
Templeton
SMACS:
Series
E
Franklin
Templeton
SMACS:
Series
H
Franklin
Templeton
SMACS:
Series
I
Assets:
Investments
in
securities:
Cost
-
Unaffiliated
issuers
................
$35,343,368
$458,920,184
$37,256,199
$746,151,580
Cost
-
Non-controlled
affiliates
(Note
3
d
)
.....
—
11,625,019
3,705,356
8,674,846
Value
-
Unaffiliated
issuers
...............
$36,443,595
$518,295,008
$38,230,122
$772,768,634
Value
-
Non-controlled
affiliates
(Note
3
d
)
....
—
11,625,019
3,817,500
8,674,846
Cash
.................................
63,627
22,164
20,828
14,179
Receivables:
Capital
shares
sold
.....................
170
605,743
3,963
938,543
Dividends
and
interest
..................
639,283
1,043,567
536,806
12,902,189
Affiliates
.............................
9,084
29,587
11,794
37,467
Total
assets
.......................
37,155,759
531,621,088
42,621,013
795,335,858
Liabilities:
Payables:
Investment
securities
purchased
...........
1,011,265
—
538,834
9,922,500
Capital
shares
redeemed
................
—
376,766
28,369
541,562
Transfer
agent
fees
.....................
149
(198)
(249)
(8,589)
Professional
fees
......................
32,939
23,963
32,048
24,700
Trustees'
fees
and
expenses
..............
224
7
189
10
Distributions
to
shareholders
..............
141,235
—
150,173
—
Accrued
expenses
and
other
liabilities
........
21,070
2,468
25,648
7,578
Total
liabilities
......................
1,206,882
403,006
775,012
10,487,761
Net
assets,
at
value
..............
$35,948,877
$531,218,082
$41,846,001
$784,848,097
Net
assets
consist
of:
Paid-in
capital
..........................
$35,173,530
$458,738,203
$41,059,118
$762,662,831
Total
distributable
earnings
(losses)
..........
775,347
72,479,879
786,883
22,185,266
Net
assets,
at
value
..............
$35,948,877
$531,218,082
$41,846,001
$784,848,097
Shares
outstanding
......................
4,127,195
36,724,046
4,463,087
95,908,345
Net
asset
value
per
share
a
.................
$8.71
$14.47
$9.38
$8.18
a
Net
asset
value
per
share
may
not
recalculate
due
to
rounding.
Franklin
Strategic
Series
Financial
Statements
Statements
of
Operations
for
the
six
months
ended
February
28,
2026
(unaudited)
Semiannual
Report
The
accompanying
notes
are
an
integral
part
of
these
financial
statements.
Franklin
Templeton
SMACS:
Series
CH
Franklin
Templeton
SMACS:
Series
E
Franklin
Templeton
SMACS:
Series
H
Franklin
Templeton
SMACS:
Series
I
Investment
income:
Dividends:
(net
of
foreign
taxes
of
$–,
$72,208,
$–
and
$–,
respectively)
Unaffiliated
issuers
.....................
$—
$6,464,218
$—
$25,424
Non-controlled
affiliates
(Note
3
d
)
..........
—
83,867
41,718
133,700
Interest:
Unaffiliated
issuers
.....................
886,535
2,960
840,463
26,075,065
Other
income
a
..........................
—
7,907
3,717
13,306
Total
investment
income
................
886,535
6,558,952
885,898
26,247,495
Expenses:
Transfer
agent
fees
(Note
3c)
...............
2,920
41,270
2,862
56,925
Custodian
fees
..........................
66
989
41
1,336
Reports
to
shareholders
fees
...............
1,696
4,674
1,937
4,669
Registration
and
filing
fees
.................
6,448
19,197
6,528
25,678
Professional
fees
........................
36,469
44,895
36,208
58,502
Trustees'
fees
and
expenses
...............
307
2,344
282
3,493
Pricing
fees
............................
9,291
1,697
18,397
4,195
Other
.................................
2,599
3,909
2,584
4,978
Total
expenses
......................
59,796
118,975
68,839
159,776
Expenses
waived/paid
by
affiliates
(Note
3
d
and
3
e
)
...........................
(59,796)
(118,975)
(68,839)
(159,776)
Net
expenses
......................
—
—
—
—
Net
investment
income
.............
886,535
6,558,952
885,898
26,247,495
Realized
and
unrealized
gains
(losses):
Net
realized
gain
(loss)
from:
Investments:
Unaffiliated
issuers
...................
(132,510)
27,287,217
(150,990)
(2,868,075)
Non-controlled
affiliates
(Note
3
d
)
........
—
—
3,300
—
Foreign
currency
transactions
.............
—
44,434
—
(5,260)
Net
realized
gain
(loss)
...............
(132,510)
27,331,651
(147,690)
(2,873,335)
Net
change
in
unrealized
appreciation
(depreciation)
on:
Investments:
Unaffiliated
issuers
...................
1,316,454
15,765,959
1,801,119
12,860,799
Non-controlled
affiliates
(Note
3
d
)
........
—
—
101,760
—
Translation
of
other
assets
and
liabilities
denominated
in
foreign
currencies
........
—
2,370
—
—
Net
change
in
unrealized
appreciation
(depreciation)
......................
1,316,454
15,768,329
1,902,879
12,860,799
Net
realized
and
unrealized
gain
(loss)
.........
1,183,944
43,099,980
1,755,189
9,987,464
Net
increase
(decrease)
in
net
assets
resulting
from
operations
...............................
$2,070,479
$49,658,932
$2,641,087
$36,234,959
a
Other
income
includes
payments
by
Advisers
for
acquired
fund
fees
and
expenses
(See
Note
3e).
Franklin
Strategic
Series
Financial
Statements
Statements
of
Changes
in
Net
Assets
The
accompanying
notes
are
an
integral
part
of
these
financial
statements.
Semiannual
Report
Franklin
Templeton
SMACS:
Series
CH
Franklin
Templeton
SMACS:
Series
E
Six
Months
Ended
February
28,
2026
(unaudited)
Year
Ended
August
31,
2025
Six
Months
Ended
February
28,
2026
(unaudited)
Year
Ended
August
31,
2025
Increase
(decrease)
in
net
assets:
Operations:
Net
investment
income
............
$886,535
$1,479,743
$6,558,952
$8,043,888
Net
realized
gain
(loss)
............
(132,510)
(123,303)
27,331,651
8,987,380
Net
change
in
unrealized
appreciation
(depreciation)
.................
1,316,454
(1,774,015)
15,768,329
24,089,546
Net
increase
(decrease)
in
net
assets
resulting
from
operations
.
2,070,479
(417,575)
49,658,932
41,120,814
Distributions
to
shareholders
.........
(881,172)
(1,467,378)
(16,359,370)
(19,727,030)
Capital
share
transactions
(Note
2
)
.....
7,352,719
6,382,300
84,069,087
174,524,065
Net
increase
(decrease)
in
net
assets
.....................
8,542,026
4,497,347
117,368,649
195,917,849
Net
assets:
Beginning
of
period
................
27,406,851
22,909,504
413,849,433
217,931,584
End
of
period
.....................
$35,948,877
$27,406,851
$531,218,082
$413,849,433
Franklin
Strategic
Series
Financial
Statements
Statements
of
Changes
in
Net
Assets
(continued)
Semiannual
Report
The
accompanying
notes
are
an
integral
part
of
these
financial
statements.
Franklin
Templeton
SMACS:
Series
H
Franklin
Templeton
SMACS:
Series
I
Six
Months
Ended
February
28,
2026
(unaudited)
Year
Ended
August
31,
2025
Six
Months
Ended
February
28,
2026
(unaudited)
Year
Ended
August
31,
2025
Increase
(decrease)
in
net
assets:
Operations:
Net
investment
income
............
$885,898
$1,058,965
$26,247,495
$37,222,883
Net
realized
gain
(loss)
............
(147,690)
18,748
(2,873,335)
447,152
Net
change
in
unrealized
appreciation
(depreciation)
.................
1,902,879
(1,384,681)
12,860,799
1,112,773
Net
increase
(decrease)
in
net
assets
resulting
from
operations
.
2,641,087
(306,968)
36,234,959
38,782,808
Distributions
to
shareholders
.........
(879,486)
(1,045,091)
(26,457,952)
(38,285,671)
Capital
share
transactions
(Note
2
)
.....
13,253,330
15,530,069
160,054,926
240,644,721
Net
increase
(decrease)
in
net
assets
.....................
15,014,931
14,178,010
169,831,933
241,141,858
Net
assets:
Beginning
of
period
................
26,831,070
12,653,060
615,016,164
373,874,306
End
of
period
.....................
$41,846,001
$26,831,070
$784,848,097
$615,016,164
Franklin
Strategic
Series
Notes
to
Financial
Statements
(unaudited)
1.
Organization
and
Significant
Accounting
Policies
Franklin
Strategic
Series (Trust)
is
registered
under
the
Investment
Company
Act
of
1940
(1940
Act)
as
an
open-
end
management
investment
company,
consisting
of
twelve
separate
funds, four of
which
are
included
in
this
report
(Funds).
The Funds
follow
the
accounting
and
reporting
guidance
in
Financial
Accounting
Standards
Board
(FASB)
Accounting
Standards
Codification
Topic
946,
Financial
Services
–
Investment
Companies
(ASC
946)
and
apply
the
specialized
accounting
and
reporting
guidance
in
U.S.
Generally
Accepted
Accounting
Principles
(U.S.
GAAP),
including,
but
not
limited
to,
ASC
946.
The
following
summarizes
the Funds'
significant
accounting
policies.
a.
Financial
Instrument
Valuation
The Funds'
investments
in
financial
instruments
are
carried
at
fair
value
daily.
Fair
value
is
the
price
that
would
be
received
to
sell
an
asset
or
paid
to
transfer
a
liability
in
an
orderly
transaction
between
market
participants
on
the
measurement
date.
The Funds calculate the
net
asset
value
(NAV)
per
share
each
business
day
as
of
4
p.m.
Eastern
time
or
the
regularly
scheduled
close
of
the
New
York
Stock
Exchange
(NYSE),
whichever
is
earlier. Under
compliance
policies
and
procedures
approved
by
the
Trust’s
Board
of
Trustees
(the
Board),
the
Board
has
designated
the
Funds’
investment
manager
as
the
valuation
designee
and
has
responsibility
for
oversight
of
valuation.
The
investment
manager
is
assisted
by
the
Funds'
administrator
in
performing
this
responsibility,
including
leading
the
cross-
functional
Valuation
Committee
(VC).
The
Funds
may
utilize
independent
pricing
services,
quotations
from
securities
and
financial
instrument
dealers,
and
other
market
sources
to
determine
fair
value.
Equity
securities
and
exchange
traded
funds listed
on
an
exchange
or
on
the
NASDAQ
National
Market
System
are
valued
at
the
last
quoted
sale
price
or
the
official
closing
price of
the
day,
respectively.
Foreign
equity
securities
are
valued
as
of
the
close
of
trading
on
the
foreign
stock
exchange
on
which
the
security
is
primarily
traded,
or
as
of
4
p.m.
Eastern
time.
The
value
is
then
converted
into
its
U.S.
dollar
equivalent
at
the
foreign
exchange
rate
in
effect
at
4
p.m.
Eastern
time
on
the
day
that
the
value
of
the
security
is
determined.
Over-the-counter
(OTC)
securities
are
valued
within
the
range
of
the
most
recent
quoted
bid
and
ask
prices.
Securities
that
trade
in
multiple
markets
or
on
multiple
exchanges
are
valued
according
to
the
broadest
and
most
representative
market.
Certain
equity
securities
are
valued
based
upon
fundamental
characteristics
or
relationships
to
similar
securities.
Debt
securities
generally
trade
in
the
OTC
market rather
than
on
a
securities
exchange.
The
Funds'
pricing
services
use
multiple
valuation
techniques
to
determine
fair
value.
In
instances
where
sufficient
market
activity
exists,
the
pricing
services
may
utilize
a
market-based
approach
through
which
quotes
from
market
makers
are
used
to
determine
fair
value.
In
instances
where
sufficient
market
activity
may
not
exist
or
is
limited,
the
pricing
services
also
utilize
proprietary
valuation
models
which
may
consider
market
characteristics
such
as
benchmark
yield
curves,
credit
spreads,
estimated
default
rates,
anticipated
market
interest
rate
volatility,
coupon
rates,
anticipated
timing
of
principal
repayments,
underlying
collateral,
and
other
unique
security
features
in
order
to
estimate
the
relevant
cash
flows,
which
are
then
discounted
to
calculate
the
fair
value.
Investments
in open-end mutual
funds
are
valued
at
the
closing
NAV.
The
Funds
have
procedures
to
determine
the
fair
value
of
financial
instruments
for
which
market
prices
are
not
reliable
or
readily
available.
Under
these
procedures,
the
Funds
primarily
employ
a
market-based
approach
which
may
use
related
or
comparable
assets
or
liabilities,
recent
transactions,
market
multiples,
and
other
relevant
information
for
the
investment
to
determine
the
fair
value
of
the
investment.
An
income-based
valuation
approach
may
also
be
used
in
which
the
anticipated
future
cash
flows
of
the
investment
are
discounted
to
calculate
fair
value.
Discounts
may
also
be
applied
due
to
the
nature
or
duration
of
any
restrictions
on
the
disposition
of
the
investments.
Due
to
the
inherent
uncertainty
of
valuations
of
such
investments,
the
fair
values
may
differ
significantly
from
the
values
that
would
have
been
used
had
an
active
market
existed.
Trading
in
securities
on
foreign
securities
stock
exchanges
and
OTC
markets
may
be
completed
before
4
p.m.
Eastern
time.
In
addition,
trading
in
certain
foreign
markets
may
not
take
place
on
every
Funds'
business
day.
Events
can occur
between
the
time
at
which
trading
in
a
foreign
security
is
completed
and
4
p.m.
Eastern
time
that
might
call
into
question
the
reliability
of
the
value
of
a
portfolio
security
held
by
the
Fund.
As
a
result,
differences
may
arise
between
the
value
of
the
Funds'
portfolio
securities
as
determined
at
the
foreign
market
close
and
the
latest
indications
of
value
at
Franklin
Strategic
Series
Notes
to
Financial
Statements
(unaudited)
4
p.m.
Eastern
time.
In
order
to
minimize
the
potential
for
these
differences,
an
independent
pricing
service
may
be
used
to
adjust
the
value
of
the
Funds'
portfolio
securities
to
the
latest
indications
of
fair
value
at
4
p.m.
Eastern
time.
At
February
28,
2026,
certain
securities
may
have
been
fair
valued
using
these
procedures,
in
which
case
the
securities
were
categorized
as
Level
2
within
the
fair
value
hierarchy
(referred
to
as
“market
level
fair
value”).
See
the
Fair
Value
Measurements
note
for
more
information.
When
the
last
day
of
the
reporting
period
is
a
non-business
day,
certain
foreign
markets
may
be
open
on
those
days
that
the
Funds'
NAV
is
not
calculated,
which
could
result
in
differences
between
the
value
of
the
Funds'
portfolio
securities
on
the
last
business
day
and
the
last
calendar
day
of
the
reporting
period.
Any
security
valuation
changes
due
to
an
open
foreign
market
are
adjusted
and
reflected
by
the
Funds
for
financial
reporting
purposes.
b.
Foreign
Currency
Translation
Portfolio
securities
and
other
assets
and
liabilities
denominated
in
foreign
currencies
are
translated
into
U.S.
dollars
based
on
the
exchange
rate
of
such
currencies
against
U.S.
dollars
on
the
date
of
valuation.
The
Funds
may
enter
into
foreign
currency
exchange
contracts
to
facilitate
transactions
denominated
in
a
foreign
currency.
Purchases
and
sales
of
securities,
income
and
expense
items
denominated
in
foreign
currencies
are
translated
into
U.S.
dollars
at
the
exchange
rate
in
effect
on
the
transaction
date.
Portfolio
securities
and
assets
and
liabilities
denominated
in
foreign
currencies
contain
risks
that
those
currencies
will
decline
in
value
relative
to
the
U.S.
dollar.
Occasionally,
events
may
impact
the
availability
or
reliability
of
foreign
exchange
rates
used
to
convert
the
U.S.
dollar
equivalent
value.
If
such
an
event
occurs,
the
foreign
exchange
rate
will
be
valued
at
fair
value
using
procedures
established
and
approved
by
the
Board.
The
Funds
do
not
separately
report
the
effect
of
changes
in
foreign
exchange
rates
from
changes
in
market
prices
on
securities
held.
Such
changes
are
included
in
net
realized
and
unrealized
gain
or
loss
from
investments
in
the
Statements
of
Operations.
Realized
foreign
exchange
gains
or
losses
arise
from
sales
of
foreign
currencies,
currency
gains
or
losses
realized
between
the
trade
and
settlement
dates
on
securities
transactions
and
the
difference
between
the
recorded
amounts
of
dividends,
interest,
and
foreign
withholding
taxes
and
the
U.S.
dollar
equivalent
of
the
amounts
actually
received
or
paid.
Net
unrealized
foreign
exchange
gains
and
losses
arise
from
changes
in
foreign
exchange
rates
on
foreign
denominated
assets
and
liabilities
other
than
investments
in
securities
held
at
the
end
of
the
reporting
period.
c.
Securities
Purchased
on
a
When-Issued,
Forward
Commitment or
Delayed
Delivery
Basis
Certain
or
all
Funds
may
purchase
securities
on
a
when-
issued,
forward
commitment
or
delayed
delivery
basis,
with
payment
and
delivery
scheduled
for
a
future
date.
These
transactions
are
subject
to
market
fluctuations
and
are
subject
to
the
risk
that
the
value
at
delivery
may
be
more
or
less
than
the
trade
date
purchase
price.
Although
the
Funds
will
generally
purchase
these
securities
with
the
intention
of
holding
the
securities, they
may
sell
the
securities
before
the
settlement
date.
d.
Equity-Linked
Securities
Certain
or
all
Funds
invest in
equity-linked
securities.
Equity-linked
securities
are
hybrid
financial
instruments
that
generally
combine
both
debt
and
equity
characteristics
into
a
single
note
form.
Income
received
from
equity-linked
securities
is
recorded
as
realized
gains
in
the
Statements
of
Operations
and
may
be
based
on
the
performance
of
an
underlying
equity
security,
an
equity
index,
or
an
option
position.
The
risks
of
investing
in
equity-linked
securities
include
unfavorable
price
movements
in
the
underlying
security
and
the
credit
risk
of
the
issuing
financial
institution.
There
may
be
no
guarantee
of
a
return
of
principal
with
equity-linked
securities
and
the
appreciation
potential
may
be
limited.
Equity-linked
securities
may
be
more
volatile
and
less
liquid
than
other
investments
held
by
the
Funds.
e.
Senior
Floating
Rate
Interests
Certain
or
all
Funds
invest
in
senior
secured
corporate
loans
that
pay
interest
at
rates
which
are
periodically
reset
by
reference
to
a
base
lending
rate
plus
a
spread.
These
base
lending
rates
are
generally
the
prime
rate
offered
by
a
designated
U.S.
bank
or
the
Secured
Overnight
Financing
Rate
(SOFR).
Senior
secured
corporate
loans
often
require
1.
Organization
and
Significant
Accounting
Policies
(continued)
a.
Financial
Instrument
Valuation
(continued)
Franklin
Strategic
Series
Notes
to
Financial
Statements
(unaudited)
prepayment
of
principal
from
excess
cash
flows
or
at
the
discretion
of
the
borrower.
As
a
result,
actual
maturity
may
be
substantially
less
than
the
stated
maturity.
Senior
secured
corporate
loans
in
which
the
Funds
invest
are
generally
readily
marketable,
but
may
be
subject
to
certain
restrictions
on
resale.
f.
Income
and
Deferred
Taxes
It
is each
Fund's
policy
to
qualify
as
a
regulated
investment
company
under
the
Internal
Revenue
Code. Each
Fund
intends
to
distribute
to
shareholders
substantially
all
of
its
income
and
net
realized
gains
to
relieve
it
from
federal
income
and excise
taxes.
As
a
result,
no
provision
for
U.S.
federal
income
taxes
is
required.
The
Funds
may
be
subject
to
foreign
taxation
related
to
income
received,
capital
gains
on
the
sale
of
securities
and
certain
foreign
currency
transactions
in
the
foreign
jurisdictions
in
which
the
Funds
invest.
Foreign
taxes,
if
any,
are
recorded
based
on
the
tax
regulations
and
rates
that
exist
in
the
foreign
markets
in
which
the
Funds
invest.
In
some
cases,
the
Funds
may
be
entitled
to
reclaim
all
or
a
portion
of
such
taxes,
and
such
reclaim
amounts,
if
any,
are
reflected
as
a
dividend
receivable
in
the
Statements
of
Assets
and
Liabilities
and
dividend
income
in
the
Statements
of
Operations.
In
many
cases,
however,
the
Funds
may
not
receive
such
amounts
for
an
extended
period
of
time,
depending
on
the
country
of
investment.
When
a
capital
gain
tax
is
determined
to
apply,
certain
or
all
Funds
record
an
estimated
deferred
tax
liability
in
an
amount
that
would
be
payable
if
the
securities
were
disposed
of
on
the
valuation
date.
Each
Fund
may
recognize
an
income
tax
liability
related
to
its
uncertain
tax
positions
under
U.S.
GAAP
when
the
uncertain
tax
position
has
a
less
than
50%
probability
that
it
will
be
sustained
upon
examination
by
the
tax
authorities
based
on
its
technical
merits.
As
of
February
28,
2026, each
Fund
has
determined
that
no
tax
liability
is
required
in
its
financial
statements
related
to
uncertain
tax
positions
for
any
open
tax
years
(or
expected
to
be
taken
in
future
tax
years).
The
Funds'
federal
and
state
income
and
federal
excise
tax
returns
for
the
prior
three
fiscal
years
are
subject
to
examination
by
the
Internal
Revenue
Service
and
state
departments
of
revenue.
g.
Security
Transactions,
Investment
Income,
Expenses
and
Distributions
Security
transactions
are
accounted
for
on
trade
date.
Realized
gains
and
losses
on
security
transactions
are
determined
on
a
specific
identification
basis.
Interest
income
(including
interest
income
from
payment-in-kind
securities,
if
any)
and
estimated
expenses
are
accrued
daily.
Amortization
of
premium
and
accretion
of
discount
on
debt
securities
are
included
in
interest
income.
Paydown
gains
and
losses
are
recorded as
an
adjustment
to
interest
income.
Certain
or
all
Funds
may
receive
other
income
from
investments
in
senior
secured
corporate loans
or
unfunded
commitments,
including
amendment
fees,
consent
fees
or
commitment
fees.
These
fees
are
recorded
as
income
when
received
by
the
Funds.
Facility
fees
are
recognized
as
income
over
the
expected
term
of
the
loan.
Dividend
income
is
recorded
on
the
ex-dividend
date
except
for
certain
dividends
from
securities
where
the
dividend
rate
is
not
available.
In
such
cases,
the
dividend
is
recorded
as
soon
as
the
information
is
received
by
the
Funds.
Dividends
from
net
investment
income
are
normally
declared
daily;
these
dividends
may
be
reinvested
or
paid
monthly
to
shareholders
for
Franklin
Templeton
SMACS:
Series
CH
and
Franklin
Templeton
SMACS:
Series
H,
and
recorded
on
ex-dividend
date
for
Franklin
Templeton
SMACS:
Series
E
and
Franklin
Templeton SMACS:
Series
I.
Distributions
from
realized
capital
gains
and
other
distributions,
if
any,
are
recorded
on
the
ex-dividend
date.
Distributable
earnings
are
determined
according
to
income
tax
regulations
(tax
basis)
and
may
differ
from
earnings
recorded
in
accordance
with
U.S.
GAAP.
These
differences
may
be
permanent
or
temporary.
Permanent
differences
are
reclassified
among
capital
accounts
to
reflect
their
tax
character.
These
reclassifications
have
no
impact
on
net
assets
or
the
results
of
operations.
Temporary
differences
are
not
reclassified,
as
they
may
reverse
in
subsequent
periods.
Common
expenses
incurred
by
the
Trust
are
allocated
among
the
Funds
based
on
the
ratio
of
net
assets
of
each
Fund
to
the
combined
net
assets
of
the
Trust
or
based
on
the
ratio
of
number
of
shareholders
of
each
Fund
to
the
combined
number
of
shareholders
of
the
Trust.
Fund
specific
expenses
are
charged
directly
to
the
Fund
that
incurred
the
expense.
1.
Organization
and
Significant
Accounting
Policies
(continued)
e.
Senior
Floating
Rate
Interests
(continued)
Franklin
Strategic
Series
Notes
to
Financial
Statements
(unaudited)
h.
Accounting
Estimates
The
preparation
of
financial
statements
in
accordance
with
U.S.
GAAP
requires
management
to
make
estimates
and
assumptions
that
affect
the
reported
amounts
of
assets
and
liabilities
at
the
date
of
the
financial
statements
and
the
amounts
of
income
and
expenses
during
the
reporting
period.
Actual
results
could
differ
from
those
estimates.
i.
Guarantees
and
Indemnifications
Under
the Trust's
organizational
documents,
its
officers
and trustees
are
indemnified
by
the Trust against
certain
liabilities
arising
out
of
the
performance
of
their
duties
to
the
Trust.
Additionally,
in
the
normal
course
of
business,
the Trust,
on
behalf
of
the
Funds, enters
into
contracts
with
service
providers
that
contain
general
indemnification
clauses.
The Trust's
maximum
exposure
under
these
arrangements
is
unknown
as
this
would
involve
future
claims
that
may
be
made
against
the Trust
that
have
not
yet
occurred.
Currently,
the Trust
expects
the
risk
of
loss
to
be
remote.
2.
Shares
of
Beneficial
Interest
At
February
28,
2026,
there
were
an
unlimited
number
of
shares
authorized
(without
par value).
Transactions
in
the
Funds'
shares
were
as
follows:
Franklin
Templeton
SMACS:
Series
CH
Franklin
Templeton
SMACS:
Series
E
Shares
Amount
Shares
Amount
Single
Class
Six
Months
ended
February
28,
2026
Shares
sold
...................................
1,046,762
$9,016,573
8,668,661
$120,990,266
Shares
issued
in
reinvestment
of
distributions
..........
—
—
7
94
Shares
redeemed
...............................
(192,564)
(1,663,854)
(2,635,597)
(36,921,273)
Net
increase
(decrease)
..........................
854,198
$7,352,719
6,033,071
$84,069,087
Year
ended
August
31,
2025
Shares
sold
...................................
1,560,906
$13,711,654
17,441,028
$222,731,933
Shares
issued
in
reinvestment
of
distributions
..........
53
474
48
602
Shares
redeemed
...............................
(846,140)
(7,329,828)
(3,811,874)
(48,208,470)
Net
increase
(decrease)
..........................
714,819
$6,382,300
13,629,202
$174,524,065
Franklin
Templeton
SMACS:
Series
H
Franklin
Templeton
SMACS:
Series
I
Shares
Amount
Shares
Amount
Single
Class
Six
Months
ended
February
28,
2026
Shares
sold
...................................
1,601,005
$14,760,018
26,280,892
$213,173,439
Shares
issued
in
reinvestment
of
distributions
..........
—
—
34
276
Shares
redeemed
...............................
(162,952)
(1,506,688)
(6,545,493)
(53,118,789)
Net
increase
(decrease)
..........................
1,438,053
$13,253,330
19,735,433
$160,054,926
Year
ended
August
31,
2025
Shares
sold
...................................
2,030,344
$18,797,350
39,769,515
$318,217,572
Shares
issued
in
reinvestment
of
distributions
..........
50
478
193
1,539
Shares
redeemed
...............................
(350,266)
(3,267,759)
(9,715,769)
(77,574,390)
Net
increase
(decrease)
..........................
1,680,128
$15,530,069
30,053,939
$240,644,721
1.
Organization
and
Significant
Accounting
Policies
(continued)
Franklin
Strategic
Series
Notes
to
Financial
Statements
(unaudited)
3.
Transactions
with
Affiliates
Franklin
Resources,
Inc.
is
the
holding
company
for
various
subsidiaries
that
together
are
referred
to
as
Franklin
Templeton.
Certain
officers
and
trustees
of
the Trust are
also
officers
and/or
directors
of
the
following
subsidiaries:
a.
Management
Fees
Advisers provides
investment
management
services
to
the
Funds.
The
Funds
do
not
pay
a
fee
for
these
services.
b.
Administrative
Fees
Under
an
agreement
with
Advisers,
FT
Services
provides
administrative
services
to
the
Funds
and
is
not
paid
by
the
Funds
for
the services.
c.
Transfer
Agent
Fees
The
Funds
pay
transfer
agent
fees,
calculated
monthly
and
paid
monthly, to
Investor
Services
for
its
performance
of
shareholder
servicing
obligations. The
fees
are based
on
a
fixed
margin
earned
by
Investor
Services
and
are allocated
to
the Funds
based
upon
relative
assets
and
relative
transactions. In
addition,
the
Fund reimburses
Investor
Services
for
out
of
pocket
expenses
incurred
and reimburses
shareholder
servicing
fees
paid
to
third
parties.
For
the
period
ended
February
28,
2026,
the Funds
paid
transfer
agent
fees
as
noted
in
the
Statements of
Operations
of
which
the
following
amounts
were
retained
by
Investor
Services:
d.
Investments
in
Affiliated
Management
Investment
Companies
Certain
or
all
Funds
invest
in
one
or
more
affiliated
management
investment
companies.
As
defined
in
the
1940
Act,
an
investment
is
deemed
to
be
a
“Controlled
Affiliate”
of
a
fund
when
a
fund
owns,
either
directly
or
indirectly,
25%
or
more
of
the
affiliated
fund’s
outstanding
shares
or
has
the
power
to
exercise
control
over
management
or
policies
of
such
fund.
The
Funds
do
not
invest
for
purposes
of
exercising
a
controlling
influence
over
the
management
or
policies. Advisers
has
contractually
agreed
to
reimburse
expenses
of
the
Funds
in
an
amount
equal
to
fees
indirectly
borne
by
the
Funds
on
assets
invested
in
the
affiliated
management
investment
companies,
as
noted
in
the
Statements
of
Operations.
During
the period
ended
February
28,
2026,
investments
in
affiliated
management
investment
companies
were
as
follows:
Subsidiary
Affiliation
Franklin
Advisers,
Inc.
(Advisers)
Investment
manager
Franklin
Templeton
Services,
LLC
(FT
Services)
Administrative
manager
Franklin
Distributors,
LLC
(Distributors)
Principal
underwriter
Franklin
Templeton
Investor
Services,
LLC
(Investor
Services)
Transfer
agent
Franklin
Templeton
SMACS:
Series
CH
Franklin
Templeton
SMACS:
Series
E
Franklin
Templeton
SMACS:
Series
H
Franklin
Templeton
SMACS:
Series
I
Transfer
agent
fees
........................
$2,365
$41,270
$2,415
$56,925
Franklin
Strategic
Series
Notes
to
Financial
Statements
(unaudited)
e.
Waiver
and
Expense
Reimbursements
Advisers
has
contractually
agreed
in
advance
to
waive
or
limit
its
fees
and
to
assume
as
its
own
expense
certain
expenses
otherwise
payable
by
the
Funds
so
that
the
operating
expenses
(excluding
certain
non-routine
expenses
or
costs,
including
those
relating
to
litigation,
indemnification,
reorganizations,
and
liquidations)
and
acquired
fund
fees
and
expenses
of
the
Funds do
not
exceed
0.00%
based
on
the
average
net
assets
of
each
class
until
December
31,
2026.
Total
expenses
waived
or
paid
are
not
subject
to
recapture
subsequent
to
the
Funds'
fiscal
year
end.
Acquired
fund
fees
and
expenses
are
indirect
expenses,
and
therefore
Advisers
may
make
payments,
if
necessary,
to
the
Funds
to
offset
these
estimated
indirect
expenses.
Payments
by
Advisers for
the period
ended
February
28,
2026,
are
reflected
as
other
income
in
the
Statements
of
Operations.
f.
Interfund
Transactions
Certain
or
all
Funds
engaged
in
purchases
and
sales
of
investments
with
funds
or
other
accounts
that
have
common
investment
managers
(or
affiliated
investment
managers),
directors,
trustees
or
officers.
These
purchases,
sales
and
the
related
net
realized
gains
(losses),
if
any,
for
the
period
ended
February
28,
2026,
were
as
follows:
aa
Value
at
Beginning
of
Period
Purchases
Sales
Realized
Gain
(Loss)
Net
Change
in
Unrealized
Appreciation
(Depreciation)
Value
at
End
of
Period
Number
of
Shares
Held
at
End
of
Period
Investment
Income
a
a
a
a
a
a
a
a
Franklin
Templeton
SMACS:
Series
E
Non-Controlled
Affiliates
Dividends
Franklin
Institutional
U.S.
Government
Money
Market
Fund,
3.583%
............
$2,925,813
$116,184,555
$(107,485,349)
$—
$—
$11,625,019
11,625,019
$83,867
Total
Affiliated
Securities
...
$2,925,813
$116,184,555
$(107,485,349)
$—
$—
$11,625,019
$83,867
Franklin
Templeton
SMACS:
Series
H
Non-Controlled
Affiliates
Dividends
Franklin
Dynamic
Municipal
Bond
ETF
...................
$531,300
$3,728,500
$(547,360)
$3,300
$101,760
$3,817,500
150,000
$41,718
Total
Affiliated
Securities
...
$531,300
$3,728,500
$(547,360)
$3,300
$101,760
$3,817,500
$41,718
Franklin
Templeton
SMACS:
Series
I
Non-Controlled
Affiliates
Dividends
Franklin
Institutional
U.S.
Government
Money
Market
Fund,
3.583%
............
$2,921,629
$205,047,982
$(199,294,765)
$—
$—
$8,674,846
8,674,846
$133,700
Total
Affiliated
Securities
...
$2,921,629
$205,047,982
$(199,294,765)
$—
$—
$8,674,846
$133,700
3.
Transactions
with
Affiliates
(continued)
d.
Investments
in
Affiliated
Management
Investment
Companies
(continued)
Franklin
Strategic
Series
Notes
to
Financial
Statements
(unaudited)
4.
Income
Taxes
For
tax
purposes,
capital
losses
may
be
carried
over
to
offset
future
capital
gains.
At
August
31,
2025,
the
capital
loss
carryforwards
were
as
follows:
At
February
28,
2026,
the
cost
of
investments
and
net
unrealized
appreciation
(depreciation)
for
income
tax
purposes
were
as
follows:
Differences
between
income
and/or
capital
gains
as
determined
on
a
book
basis
and
a
tax
basis
are
primarily
due
to
differing
treatments
of
wash
sales,
bond
discounts
and
premiums
and
equity-linked
securities.
Franklin
Templeton
SMACS:
Series
CH
Franklin
Templeton
SMACS:
Series
H
Purchases
................................................................
$3,960,000
$5,300,000
Sales
....................................................................
$4,535,000
$8,865,000
Net
Realized
Gains
(Losses)
...................................................
—
—
Franklin
Templeton
SMACS:
Series
CH
Franklin
Templeton
SMACS:
Series
E
Franklin
Templeton
SMACS:
Series
H
Franklin
Templeton
SMACS:
Series
I
1
1
1
1
1
Capital
loss
carryforwards
not
subject
to
expiration:
Short
term
.............................
$
103,150
$
2,428,166
$
35,455
$
842,302
Long
term
.............................
124,544
—
142,795
—
Total
capital
loss
carryforwards
............
$227,694
$2,428,166
$178,250
$842,302
Franklin
Templeton
SMACS:
Series
CH
Franklin
Templeton
SMACS:
Series
E
Franklin
Templeton
SMACS:
Series
H
Franklin
Templeton
SMACS:
Series
I
a
a
a
a
a
Cost
of
investments
.......................
$35,313,791
$473,016,720
$40,928,569
$755,331,659
Unrealized
appreciation
.....................
$1,454,645
$77,101,365
$1,274,843
$29,176,290
Unrealized
depreciation
.....................
(324,841)
(20,198,058)
(155,790)
(3,064,469)
Net
unrealized
appreciation
(depreciation)
.......
$1,129,804
$56,903,307
$1,119,053
$26,111,821
3.
Transactions
with
Affiliates
(continued)
f.
Interfund
Transactions
(continued)
Franklin
Strategic
Series
Notes
to
Financial
Statements
(unaudited)
5.
Investment
Transactions
Purchases
and
sales
of
investments
and
ETFs
(excluding
short
term
securities)
for
the
period
ended
February
28,
2026,
were
as
follows:
6.
Credit
Risk
At
February
28,
2026, certain
or
all
Funds had a
portion of their
portfolio
invested
in
high
yield
or
other
securities
rated
below
investment
grade
as
determined
by
Nationally
Recognized
Statistical
Credit
Ratings
Organizations
and/or
internally,
by
investment
management
and
unrated
securities.
These
securities
may
be
more
sensitive
to
economic
conditions
causing
greater
price
volatility
and
are
potentially
subject
to
a
greater
risk
of
loss
due
to
default
than
higher
rated
securities.
7.
Concentration
of
Risk
Franklin
Templeton
SMACS:
Series
CH
invests
a
large
percentage
of
its total
assets
in
obligations
of
issuers
within California
and
U.S.
territories.
Such
concentration
may
subject
the
Fund
to
risks
associated
with
industrial
or
regional
matters,
and
economic,
political
or
legal
developments
occurring
within California
and
U.S.
territories. Investments
in
these
securities
are
sensitive
to
interest
rate
changes
and
credit
risk
of
the
issuer
and
may
subject
the
Fund
to
increased
market
volatility.
The
market
for
these
investments
may
be
limited,
which
may
make
them
difficult
to
buy
or
sell.
8.
Credit
Facility
The
Funds,
together
with
other
U.S.
registered
and
foreign
investment
funds
(collectively,
Borrowers),
managed
by
Franklin
Templeton,
are
borrowers
in
a
joint
syndicated
senior
unsecured
credit
facility
totaling
$2.995
billion
(Global
Credit
Facility)
which
matures
on
January
29,
2027.
This
Global
Credit
Facility
provides
a
source
of
funds
to
the
Borrowers
for
temporary
and
emergency
purposes,
including
the
ability
to
meet
future
unanticipated
or
unusually
large
redemption
requests.
Under
the
terms
of
the
Global
Credit
Facility,
the
Funds
may,
in
addition
to
interest
charged
on
any
borrowings
made
by
the
Funds
and
other
costs
incurred
by
the
Funds,
pay
their
share
of
fees
and
expenses
incurred
in
connection
with
the
implementation
and
maintenance
of
the
Global
Credit
Facility,
based
upon
their
relative
share
of
the
aggregate
net
assets
of
all
of
the
Borrowers,
including
an
annual
commitment
fee
of
0.15%
based
upon
the
unused
portion
of
the
Global
Credit
Facility.
These
fees
are
reflected
in
other
expenses
in
the
Statements
of
Operations.
During
the
period ended
February
28,
2026,
the
Funds
did
not
use
the
Global
Credit
Facility.
Franklin
Templeton
SMACS:
Series
CH
Franklin
Templeton
SMACS:
Series
E
Franklin
Templeton
SMACS:
Series
H
Franklin
Templeton
SMACS:
Series
I
Purchases
..............................
$9,356,985
$329,998,150
$15,737,878
$302,316,256
Sales
..................................
$2,410,004
$251,897,825
$3,118,918
$142,104,284
Franklin
Templeton
SMACS:
Series
CH
Franklin
Templeton
SMACS:
Series
H
Franklin
Templeton
SMACS:
Series
I
Credit
risk
.....................................................
53.2%
39.1%
74.8%
Franklin
Strategic
Series
Notes
to
Financial
Statements
(unaudited)
9.
Fair
Value
Measurements
The Funds
follow
a
fair
value
hierarchy
that
distinguishes
between
market
data
obtained
from
independent
sources
(observable
inputs)
and
the Funds'
own
market
assumptions
(unobservable
inputs).
These
inputs
are
used
in
determining
the
value
of
the Funds' financial
instruments
and
are
summarized
in
the
following
fair
value
hierarchy:
Level
1
–
quoted
prices
in
active
markets
for
identical
financial
instruments
Level
2
–
other
significant
observable
inputs
(including
quoted
prices
for
similar
financial
instruments,
interest
rates,
prepayment
speed,
credit
risk,
etc.)
Level
3
–
significant
unobservable
inputs
(including
the Funds'
own
assumptions
in
determining
the
fair
value
of
financial
instruments)
The
input
levels
are
not
necessarily
an
indication
of
the
risk
or
liquidity
associated
with
financial
instruments
at
that
level.
A
summary
of
inputs
used
as
of
February
28,
2026,
in
valuing
the
Funds'
assets
carried
at
fair
value,
is
as
follows:
Level
1
Level
2
Level
3
Total
Franklin
Templeton
SMACS:
Series
CH
Assets:
Investments
in
Securities:
a
Common
Stocks
.........................
$
—
$
—
$
—
b
$
—
Corporate
Bonds
........................
—
251,396
—
251,396
Municipal
Bonds
:
Arizona
..............................
—
545,244
—
545,244
California
.............................
—
32,910,149
607,131
33,517,280
U.S.
Territories
..........................
Puerto
Rico
...........................
—
125,550
—
125,550
Short
Term
Investments
...................
—
2,004,125
—
2,004,125
Total
Investments
in
Securities
...........
$—
$35,836,464
$607,131
$36,443,595
Franklin
Templeton
SMACS:
Series
E
Assets:
Investments
in
Securities:
a
Common
Stocks
:
Aerospace
&
Defense
...................
10,656,750
—
—
10,656,750
Air
Freight
&
Logistics
...................
5,102,240
—
—
5,102,240
Banks
...............................
14,109,420
—
—
14,109,420
Biotechnology
.........................
5,802,000
—
—
5,802,000
Capital
Markets
........................
2,658,075
—
—
2,658,075
Diversified
Telecommunication
Services
.....
5,418,000
—
—
5,418,000
Electric
Utilities
........................
3,334,400
—
—
3,334,400
Energy
Equipment
&
Services
.............
7,701,000
—
—
7,701,000
Ground
Transportation
..................
4,721,100
—
—
4,721,100
Health
Care
Equipment
&
Supplies
.........
6,347,900
—
—
6,347,900
Health
Care
Providers
&
Services
..........
15,918,402
—
—
15,918,402
Hotels,
Restaurants
&
Leisure
.............
9,761,800
—
—
9,761,800
IT
Services
...........................
5,218,000
—
—
5,218,000
Machinery
............................
4,456,980
—
—
4,456,980
Metals
&
Mining
.......................
1,359,013
—
—
1,359,013
Oil,
Gas
&
Consumable
Fuels
.............
17,914,600
9,423,647
—
27,338,247
Pharmaceuticals
.......................
6,454,379
—
—
6,454,379
Semiconductors
&
Semiconductor
Equipment
.
15,001,021
—
—
15,001,021
Software
.............................
6,790,598
—
—
6,790,598
Specialty
Retail
........................
2,661,233
—
—
2,661,233
Textiles,
Apparel
&
Luxury
Goods
..........
2,673,740
—
—
2,673,740
Tobacco
.............................
12,611,025
—
—
12,611,025
Franklin
Strategic
Series
Notes
to
Financial
Statements
(unaudited)
A
reconciliation
in
which
Level
3
inputs
are
used
in
determining
fair
value
is
presented
when
there
are
significant
Level
3
assets
and/or
liabilities
at
the
beginning
and/or
end
of
the period.
At
February
28,
2026,
the
reconciliation
is
as
follows:
Level
1
Level
2
Level
3
Total
Franklin
Templeton
SMACS:
Series
E
(continued)
Assets:
(continued)
Investments
in
Securities:
a
(continued)
Equity-Linked
Securities
...................
$
—
$
263,539,485
$
—
$
263,539,485
Convertible
Preferred
Stocks
................
78,660,200
—
—
78,660,200
Short
Term
Investments
...................
11,625,019
—
—
11,625,019
Total
Investments
in
Securities
...........
$256,956,895
$272,963,132
c
$—
$529,920,027
Franklin
Templeton
SMACS:
Series
H
Assets:
Investments
in
Securities:
a
Common
Stocks
.........................
—
—
—
b
—
Management
Investment
Companies
.........
3,817,500
—
—
3,817,500
Corporate
Bonds
........................
—
251,396
—
251,396
Municipal
Bonds
.........................
—
37,178,726
—
37,178,726
Short
Term
Investments
...................
—
800,000
—
800,000
Total
Investments
in
Securities
...........
$3,817,500
$38,230,122
$—
$42,047,622
Franklin
Templeton
SMACS:
Series
I
Assets:
Investments
in
Securities:
a
Common
Stocks
:
Banks
...............................
2,242,350
—
—
2,242,350
Pharmaceuticals
.......................
—
109,315
—
109,315
Equity-Linked
Securities
...................
—
206,034
—
206,034
Corporate
Bonds
........................
—
605,030,662
—
605,030,662
Senior
Floating
Rate
Interests
...............
—
20,834,015
—
20,834,015
Mortgage-Backed
Securities
................
—
144,346,258
—
144,346,258
Short
Term
Investments
...................
8,674,846
—
—
8,674,846
Total
Investments
in
Securities
...........
$10,917,196
$770,526,284
$—
$781,443,480
a
For
detailed
categories,
see
the
accompanying
Schedule
of
Investments.
b
Includes
financial
instruments
determined
to
have
no
value.
c
Includes
foreign
securities
valued
at
$9,423,647,
which
were
categorized
as
Level
2
as
a
result
of
the
application
of
market
level
fair
value
procedures.
See
the
Financial
Instrument
Valuation
note
for
more
information.
Balance
at
Beginning
of
Period
Purchases
a
Sales
Transfer
Into
Level
3
Transfer
Out
of
Level
3
Net
Accretion
(
Amortiza
-
tion
)
Net
Realized
Gain
(Loss)
Net
Unr
ealized
Appreciation
(Depreciation)
Balance
at
End
of
Period
Net
Change
in
Unrealized
Appreciation
(Depreciation)
on
Assets
Held
at
Period
End
a
a
a
a
a
a
a
a
a
a
a
Franklin
Templeton
SMACS
Series
CH
Assets:
Investments
in
Securities:
Common
Stocks
:
United
States
.
$
—
$
—
b
$
—
$
—
$
—
$
—
$
—
$
—
$
—
b
$
—
Municipal
Bonds
:
United
States
.
603,985
—
—
—
—
—
—
3,146
607,131
3,146
Total
Investments
in
Securities
.......
$603,985
$—
$—
$—
$—
$—
$—
$3,146
$607,131
$3,146
9.
Fair
Value
Measurements
(continued)
Franklin
Strategic
Series
Notes
to
Financial
Statements
(unaudited)
Significant
unobservable
valuation
inputs
for
material
Level
3 assets
and/or
liabilities and
impact
to
fair
value
as
a
result
of
changes
in
unobservable
valuation
inputs
as
of
February
28,
2026,
are
as
follows:
10.
Operating
Segments
Each
Fund
operates
as
a
single
operating
segment,
which
is
an
investment
portfolio.
The
portfolio
managers
assigned
to
the
Fund
within the
Funds'
investment
manager
serve
as
the
Chief
Operating
Decision
Maker
(“CODM”)
and are
responsible
for
evaluating each
Fund's
operating
results
and
allocating
resources
in
accordance
with each
Fund’s
investment
strategy.
Internal
reporting
provided
to
the
CODM
aligns
with
the
accounting
policies
and
measurement
principles
used
in
the
financial
statements.
For
information
regarding
segment
assets,
segment
profit
or
loss,
and
significant
expenses,
refer
to
the
Statements
of
Assets
and
Liabilities
and
the
Statements
of
Operations,
along
with
the
related
notes
to
the
financial
statements.
The
Schedules
of
Investments
provides
details
of
the
Funds'
investments
that
generate
returns
such
as
interest,
dividends,
and
realized
and
unrealized
gains
or
losses.
Performance
metrics,
including
portfolio
turnover
and
expense
ratios,
are
disclosed
in
the
Financial
Highlights.
11.
Subsequent
Events
The
Funds
have
evaluated
subsequent
events
through
the
issuance
of
the
financial
statements
and
determined
that
no
events
have
occurred
that
require
disclosure.
a
Purchases
include
all
purchases
of
securities
and
securities
received
in
corporate
actions.
b
Includes
financial
instruments
determined
to
have
no
value.
Description
Fair
Value
at
End
of
Period
Valuation
Technique
Unobservable
Inputs
Amount
Impact
to
Fair
Value
if
Input
Increases
a
Franklin
Templeton
SMACS:
Series
CH
Assets:
Investments
in
Securities:
Municipal
Bonds
California
.....................
$607,131
Discounted
cash
flow
Discount
rate
8.1%
Decrease
All
Other
Investments
.............
—
b
Total
$607,131
a
Represents
the
directional
change
in
the
fair
value
of
the
Level
3
financial
instruments
that
would
result
from
a
significant
and
reasonable
increase
in
the
corresponding
input.
A
significant
and
reasonable
decrease
in
the
input
would
have
the
opposite
effect.
Significant
increases
and
decreases
in
these
inputs
in
isolation
could
result
in
significantly
higher
or
lower
fair
value
measurements.
b
Includes
financial
instruments
determined
to
have
no
value.
9.
Fair
Value
Measurements
(continued)
Franklin
Strategic
Series
Notes
to
Financial
Statements
(unaudited)
Abbreviations
Selected
Portfolio
AG
Assured
Guaranty,
Inc.
CME
Chicago
Mercantile
Exchange
ETF
Exchange-Traded
Fund
FHLMC
Federal
Home
Loan
Mortgage
Corp.
FNMA
Federal
National
Mortgage
Association
FRN
Floating
Rate
Note
GNMA
Government
National
Mortgage
Association
GO
General
Obligation
LOC
Letter
of
Credit
PIK
Payment-In-Kind
REIT
Real
Estate
Investment
Trust
SOFR
Secured
Overnight
Financing
Rate
SPA
Standby
Purchase
Agreement
Franklin
Strategic
Series
Changes
In
and
Disagreements
with
Accountants
For
the
period
covered
by
this
report
Not
applicable.
Results
of
Meeting(s)
of
Shareholders
For
the
period
covered
by
this
report
Not
applicable.
Remuneration
Paid
to
Directors,
Officers
and
Others
For
the
period
covered
by
this
report
Refer
to
the
financial
statements
included
herein.
Remuneration
to
officers
is
paid
by
the
Funds’
investment
manager
according
to
the
terms
of
the
agreement.
Board
Approval
of
Management
and
Subadvisory
Agreements
For
the
period
covered
by
this
report
Not
applicable.
©
2026
Franklin
Templeton.
All
rights
reserved.
|
ITEM 8. |
CHANGES IN AND DISAGREEMENTS WITH ACCOUNTANTS FOR OPEN-END MANAGEMENT INVESTMENT COMPANIES. |
The information is disclosed as part of the Financial Statements
included in Item 7 of this Form N-CSR.
|
ITEM 9. |
PROXY DISCLOSURES FOR OPEN-END MANAGEMENT INVESTMENT COMPANIES. |
The information is disclosed as part of the Financial Statements
included in Item 7 of this Form N-CSR.
|
ITEM 10. |
REMUNERATION PAID TO DIRECTORS, OFFICERS, AND OTHERS OF OPEN-END MANAGEMENT INVESTMENT
COMPANIES. |
The information is disclosed as part of the Financial Statements
included in Item 7 of this Form N-CSR.
|
ITEM 11. |
STATEMENT REGARDING BASIS FOR APPROVAL OF INVESTMENT ADVISORY CONTRACT. |
The information is disclosed as part of the Financial Statements
included in Item 7 of this Form N-CSR, as applicable.
|
ITEM 12. |
DISCLOSURE OF PROXY VOTING POLICIES AND PROCEDURES FOR CLOSED-END MANAGEMENT INVESTMENT
COMPANIES. |
Not applicable.
|
ITEM 13. |
PORTFOLIO MANAGERS OF CLOSED-END MANAGEMENT INVESTMENT COMPANIES. |
Not applicable.
|
ITEM 14. |
PURCHASES OF EQUITY SECURITIES BY CLOSED-END MANAGEMENT INVESTMENT COMPANY AND AFFILIATED
PURCHASERS. |
Not applicable.
|
ITEM 15. |
SUBMISSION OF MATTERS TO A VOTE OF SECURITY HOLDERS. |
There have been no changes to the procedures by which shareholders
may recommend nominees to the Registrant’s Board of Trustees that would require disclosure herein.
|
ITEM 16. |
CONTROLS AND PROCEDURES. |
|
(a) |
The Registrant’s chief executive officer and chief financial officer have
concluded that the Registrant’s disclosure controls and procedures (as defined in Rule 30a- 3(c) under the Investment Company Act
of 1940, as amended (the “1940 Act”)) are effective as of a date within 90 days of the filing date of this report that includes
the disclosure required by this paragraph, based on their evaluation of the disclosure controls and procedures required by Rule 30a-3(b)
under the 1940 Act and 15d-15(b) under the Securities Exchange Act of 1934. |
|
(b) |
There were no changes in the Registrant’s internal control over financial reporting
(as defined in Rule 30a-3(d) under the 1940 Act) that occurred during the period covered by this report that have materially affected
or are likely to materially affect the Registrant’s internal control over financial reporting. |
|
ITEM 17. |
DISCLOSURE OF SECURITIES LENDING ACTIVITIES FOR CLOSED-END MANAGEMENT INVESTMENT COMPANIES. |
Not applicable.
|
ITEM 18. |
RECOVERY OF ERRONEOUSLY AWARDED COMPENSATION. |
(a) (1) Not applicable
Exhibit 99.CODE ETH
(a) (3) Certifications pursuant
to section 302 of the Sarbanes-Oxley Act of 2002 attached hereto.
Exhibit 99.CERT
(b) Certifications pursuant
to Section 906 of the Sarbanes-Oxley Act of 2002 attached hereto.
Exhibit 99.906CERT
SIGNATURES
Pursuant to the requirements of the Securities Exchange
Act of 1934 and the Investment Company Act of 1940, the registrant has duly caused this Report to be signed on its behalf by the undersigned,
there unto duly authorized.
Franklin Strategic Series
| By: |
/s/ Christopher Kings |
|
| |
Christopher Kings |
|
| |
Chief Executive Officer - Finance and Administration |
|
Pursuant to the requirements of the Securities Exchange Act of 1934 and
the Investment Company Act of 1940, this report has been signed below by the following persons on behalf of the registrant and in the
capacities and on the dates indicated.
| By: |
/s/ Christopher Kings |
|
| |
Christopher Kings |
|
| |
Chief Executive Officer - Finance and Administration |
|
| Date: |
April 29, 2026 |
|
| |
|
|
| By: |
/s/ Jeffrey
White |
|
| |
Jeffrey White |
|
| |
Chief Financial Officer, Chief Accounting Officer and Treasurer |
|