Pay vs Performance Disclosure - USD ($)
Dec. 31, 2025
Dec. 31, 2024
Dec. 31, 2023
Pay Versus Performance
In accordance with rules adopted by the Securities and Exchange Commission (“SEC”) pursuant to the Dodd-Frank Wall Street Reform and Consumer Protection Act of 2010, we provide the following disclosure regarding executive “compensation actually paid” (“CAP,” as calculated in accordance with the SEC rules) and certain Company performance measures for the fiscal years listed below. For information regarding the Company’s philosophy and how the Company aligns executive pay with performance, refer to our Compensation Discussion & Analysis (“CD&A”).
pay-for-performance
CEO (1) |
Non-CEO NEOs (2) |
|||||||||||||||||||||||||||||
Summary Compensation Table Total |
Compensation Actually Paid (3)(4) |
Average Summary Compensation Table Total |
Average Compensation Actually Paid (3)(4) |
Year-end value of $100 invested on December 31, 2022 |
Net (Loss) Income (in millions) |
|||||||||||||||||||||||||
| Year |
$ |
$ |
$ |
$ |
$ |
$ |
||||||||||||||||||||||||
| 2025 |
3,038,451 |
1,592,266 |
818,697 |
594,208 |
57 |
(27 |
) | |||||||||||||||||||||||
| 2024 |
3,907,942 |
2,620,419 |
1,440,900 |
1,234,865 |
82 |
(15 |
) | |||||||||||||||||||||||
| 2023 |
2,760,237 |
2,496,749 |
1,358,960 |
1,323,834 |
91 |
(8 |
) | |||||||||||||||||||||||
| (1) | Amounts reported in the CEO columns reflect (i) the total compensation reported in the Summary Compensation Table for Robert Kay, the “CEO,” for each of 2023, 2024 and 2025 and (ii) the CAP for Robert Kay for each of 2023, 2024 and 2025. |
| (2) | Amounts reported in the Non-CEO NEOs columns reflect (i) the average of the total compensation reported in the Summary Compensation Table for Jeffrey Siegel, Daniel Siegel, and Laurence Winoker for 2023; Daniel Siegel and Laurence Winoker for each of 2024 and 2025; and (ii) the average CAP for Jeffrey Siegel, Daniel Siegel, and Laurence Winoker for 2023; Daniel Siegel and Laurence Winoker for each of 2024 and 2025. |
| (3) | To calculate the CAP, adjustments were made to the amounts reported in the Summary Compensation Table for the applicable year. The deductions from, and additions to, total compensation in the Summary Compensation Table by year that were used to calculate CAP include: |
2025 |
2024 |
2023 |
||||||||||||||||||||||||||||||||||
CEO |
Average Non- CEO NEOs |
CEO |
Average Non- CEO NEOs |
CEO |
Average Non- CEO NEOs |
|||||||||||||||||||||||||||||||
| Total Compensation from Summary Compensation Table |
$ |
3,038,451 |
$ |
818,697 |
$ |
3,907,942 |
$ |
1,440,900 |
$ |
2,760,237 |
$ |
1,358,960 |
||||||||||||||||||||||||
| Adjustments for Equity Awards |
||||||||||||||||||||||||||||||||||||
| Adjustment for grant date values in the Summary Compensation Table |
$ |
(2,021,076) |
$ |
(233,415) |
$ |
(1,854,400) |
$ |
(317,200) |
$ |
(888,000) |
$ |
(145,813) |
||||||||||||||||||||||||
| Year-end fair value of unvested awards granted in the current year |
$ |
1,501,763 |
$ |
173,439 |
$ |
1,124,125 |
$ |
192,285 |
$ |
974,241 |
$ |
170,460 |
||||||||||||||||||||||||
| Year-over-year difference of year-end fair values for unvested awards granted in prior years |
$ |
(868,011) |
$ |
(155,339) |
$ |
(135,807) |
$ |
(23,227) |
$ |
(147,788) |
$ |
(13,947) |
||||||||||||||||||||||||
| Difference in fair values between prior year-end fair values and vest date fair values for awards granted in prior years |
$ |
(58,861) |
$ |
(9,174) |
$ |
(421,441) |
$ |
(57,893) |
$ |
(201,941) |
$ |
(45,826) |
||||||||||||||||||||||||
| |
|
|
|
|
|
|
|
|
|
|
|
|||||||||||||||||||||||||
| Total Adjustments for Equity Awards |
$ |
(1,446,185) |
$ |
(224,489) |
$ |
(1,287,523) |
$ |
(206,035) |
$ |
(263,488) |
$ |
(35,126) |
||||||||||||||||||||||||
| Compensation Actually Paid (as calculated)* |
$ |
1,592,266 |
$ |
594,208 |
$ |
2,620,419 |
$ |
1,234,865 |
$ |
2,496,749 |
$ |
1,323,834 |
||||||||||||||||||||||||
| |
|
|
|
|
|
|
|
|
|
|
|
|||||||||||||||||||||||||
*No adjustments made for pension or dividends not otherwise included in total compensation.
| (4) | The equity valuation assumptions used for purposes of calculating CAP are not materially different from the grant date valuation assumptions. |
Non-CEO
NEOs columns reflect (i) the average of the total compensation reported in the Summary Compensation Table for Jeffrey Siegel, Daniel Siegel, and Laurence Winoker for 2023; Daniel Siegel and Laurence Winoker for each of 2024 and 2025; and (ii) the average CAP for Jeffrey Siegel, Daniel Siegel, and Laurence Winoker for 2023; Daniel Siegel and Laurence Winoker for each of 2024 and 2025.
| (3) | To calculate the CAP, adjustments were made to the amounts reported in the Summary Compensation Table for the applicable year. The deductions from, and additions to, total compensation in the Summary Compensation Table by year that were used to calculate CAP include: |
2025 |
2024 |
2023 |
||||||||||||||||||||||||||||||||||
CEO |
Average Non- CEO NEOs |
CEO |
Average Non- CEO NEOs |
CEO |
Average Non- CEO NEOs |
|||||||||||||||||||||||||||||||
| Total Compensation from Summary Compensation Table |
$ |
3,038,451 |
$ |
818,697 |
$ |
3,907,942 |
$ |
1,440,900 |
$ |
2,760,237 |
$ |
1,358,960 |
||||||||||||||||||||||||
| Adjustments for Equity Awards |
||||||||||||||||||||||||||||||||||||
| Adjustment for grant date values in the Summary Compensation Table |
$ |
(2,021,076) |
$ |
(233,415) |
$ |
(1,854,400) |
$ |
(317,200) |
$ |
(888,000) |
$ |
(145,813) |
||||||||||||||||||||||||
| Year-end fair value of unvested awards granted in the current year |
$ |
1,501,763 |
$ |
173,439 |
$ |
1,124,125 |
$ |
192,285 |
$ |
974,241 |
$ |
170,460 |
||||||||||||||||||||||||
| Year-over-year difference of year-end fair values for unvested awards granted in prior years |
$ |
(868,011) |
$ |
(155,339) |
$ |
(135,807) |
$ |
(23,227) |
$ |
(147,788) |
$ |
(13,947) |
||||||||||||||||||||||||
| Difference in fair values between prior year-end fair values and vest date fair values for awards granted in prior years |
$ |
(58,861) |
$ |
(9,174) |
$ |
(421,441) |
$ |
(57,893) |
$ |
(201,941) |
$ |
(45,826) |
||||||||||||||||||||||||
| |
|
|
|
|
|
|
|
|
|
|
|
|||||||||||||||||||||||||
| Total Adjustments for Equity Awards |
$ |
(1,446,185) |
$ |
(224,489) |
$ |
(1,287,523) |
$ |
(206,035) |
$ |
(263,488) |
$ |
(35,126) |
||||||||||||||||||||||||
| Compensation Actually Paid (as calculated)* |
$ |
1,592,266 |
$ |
594,208 |
$ |
2,620,419 |
$ |
1,234,865 |
$ |
2,496,749 |
$ |
1,323,834 |
||||||||||||||||||||||||
| |
|
|
|
|
|
|
|
|
|
|
|
|||||||||||||||||||||||||
*No adjustments made for pension or dividends not otherwise included in total compensation.
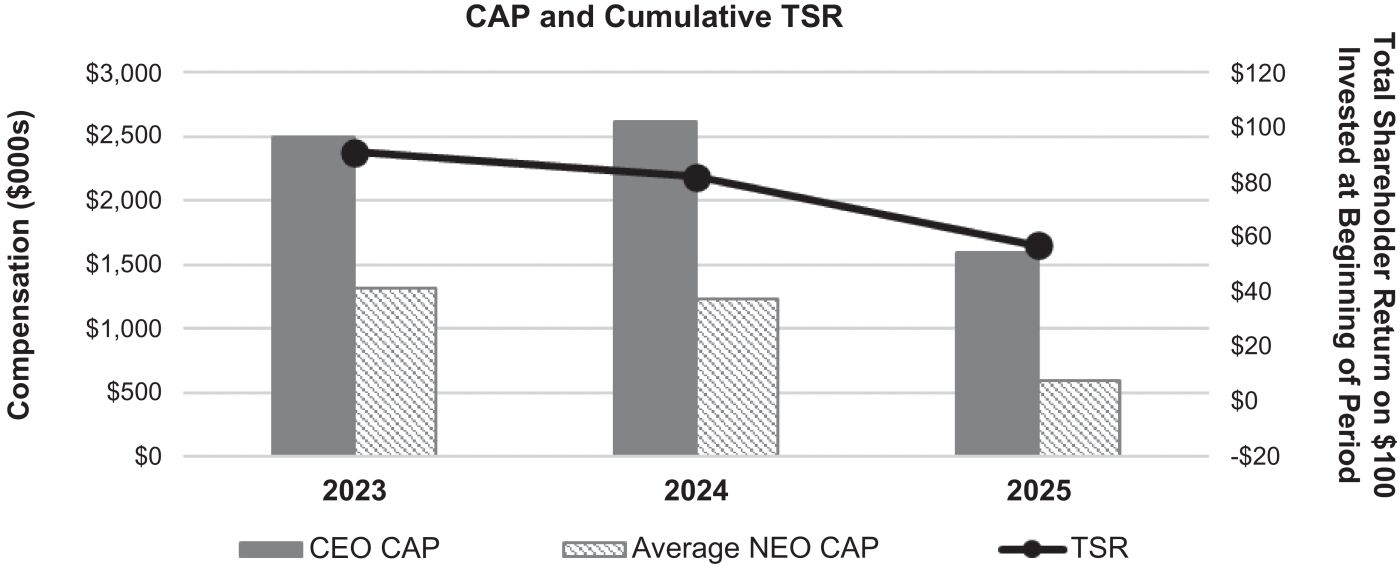
NEO CAP and Lifetime Brands’ Cumulative TSR
The graph below depicts the relationship between CEO and Average NEO’s CAP to the Company’s cumulative TSR. As depicted, CAP is generally aligned with cumulative TSR performance over the preceding three years.
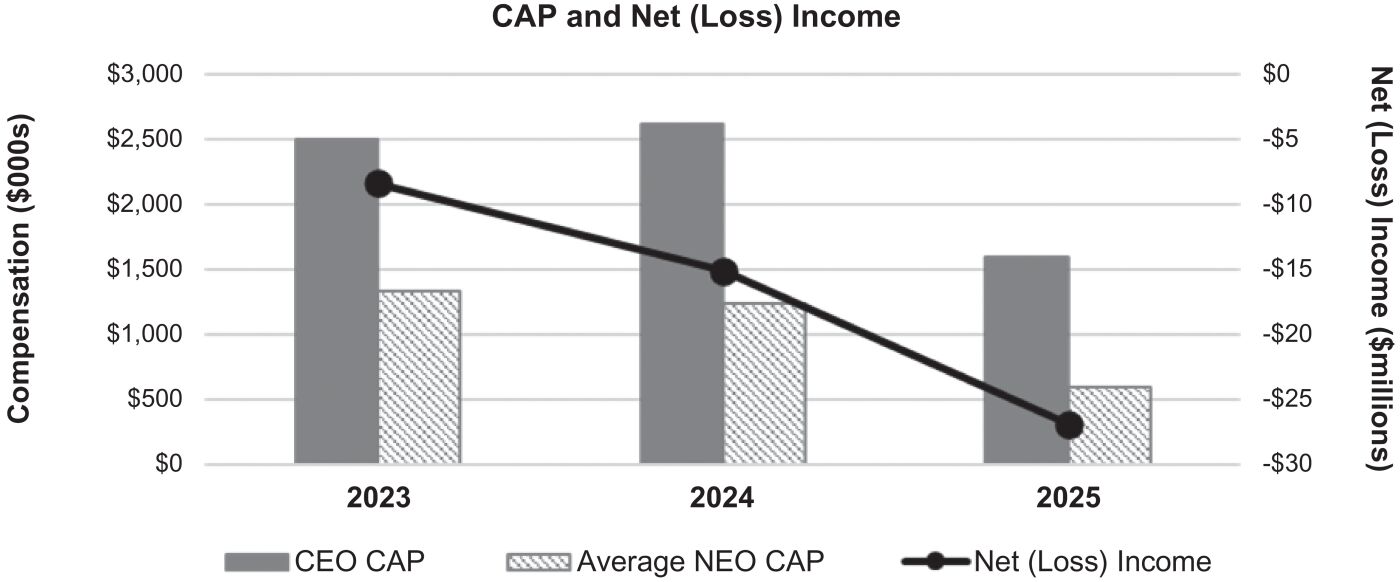
NEO CAP and Lifetime Brands’ Net (Loss) Income
The graph below depicts the relationship between CEO and Average NEO’s CAP to the Company’s net (loss) income. CAP remained relatively stable in 2024 and declined in 2025, while net (loss) income continued to decline over the three years.