Shareholder Report
Feb. 28, 2026
USD ($)
$ / shares
WHAT
WERE THE FUND COSTS FOR THE LAST YEAR? (based
on a hypothetical $10,000 investment)
|
Class
Name |
Costs
of a $10,000 investment
|
Costs
paid as a percentage of a $10,000
investment |
|
Class
A |
$83
|
0.81%
|
HOW
DID THE FUND PERFORM LAST YEAR AND WHAT AFFECTED ITS PERFORMANCE?
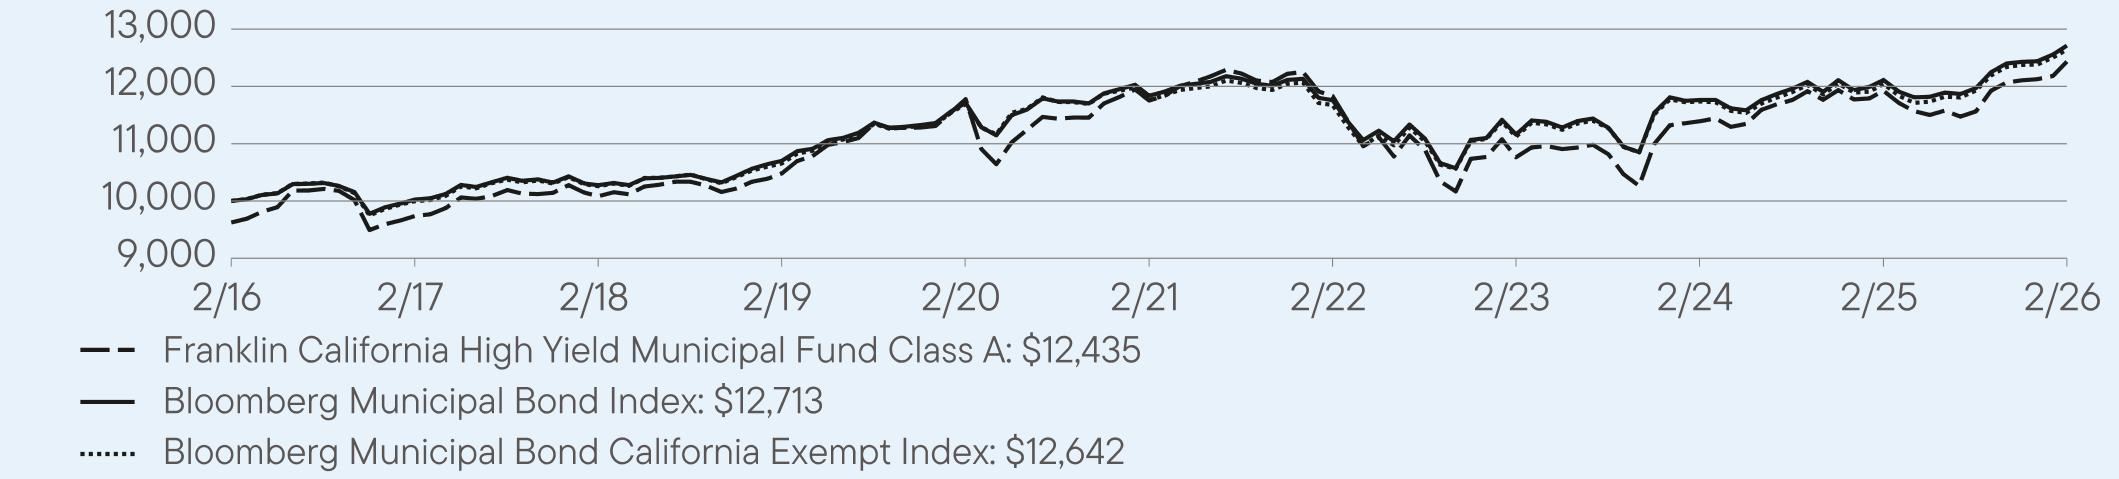
For the twelve months ended February
28, 2026, Class A shares of
Franklin California High Yield Municipal Fund returned 3.74%.
The Fund compares its performance
to the Bloomberg Municipal Bond California Exempt Index, which returned 4.98% for the same period.
PERFORMANCE
HIGHLIGHTS
|
Top
contributors to performance: | |
|
↑
|
Selection
in bonds with no external credit rating |
|
↑
|
Underweight
to bonds with 30 years to maturity |
|
↑
|
Selection
in B rated bonds |
|
Top
detractors from performance: | |
|
↓
|
Overweight
to bonds with no external credit rating |
|
↓
|
Overweight
to bonds with 20 years to maturity |
|
↓
|
Underweight
bonds with 5 years or less to maturity |
AVERAGE
ANNUAL TOTAL RETURNS (%) Period
Ended February 28, 2026
|
|
1
Year |
5
Year |
10
Year |
|
Class
A |
3.74
|
1.03
|
2.60
|
|
Class
A (with sales charge) |
-0.15
|
0.26
|
2.20
|
|
Bloomberg
Municipal Bond Index |
4.96
|
1.44
|
2.43
|
|
Bloomberg
Municipal Bond California Exempt Index |
4.98
|
1.45
|
2.37
|
For current month-end performance,
please call Franklin Templeton at (800)
DIAL BEN/342-5236 or visit
https://www.franklintempleton.com/investments/options/mutual-funds.
https://www.franklintempleton.com/investments/options/mutual-funds.
Important data provider notices
and terms available at www.franklintempletondatasources.com.
KEY
FUND STATISTICS (as
of February 28, 2026)
|
Total
Net Assets |
$3,281,260,262
|
|
Total
Number of Portfolio Holdings |
745
|
|
Total
Management Fee Paid |
$13,902,397
|
|
Portfolio
Turnover Rate |
13.89%
|
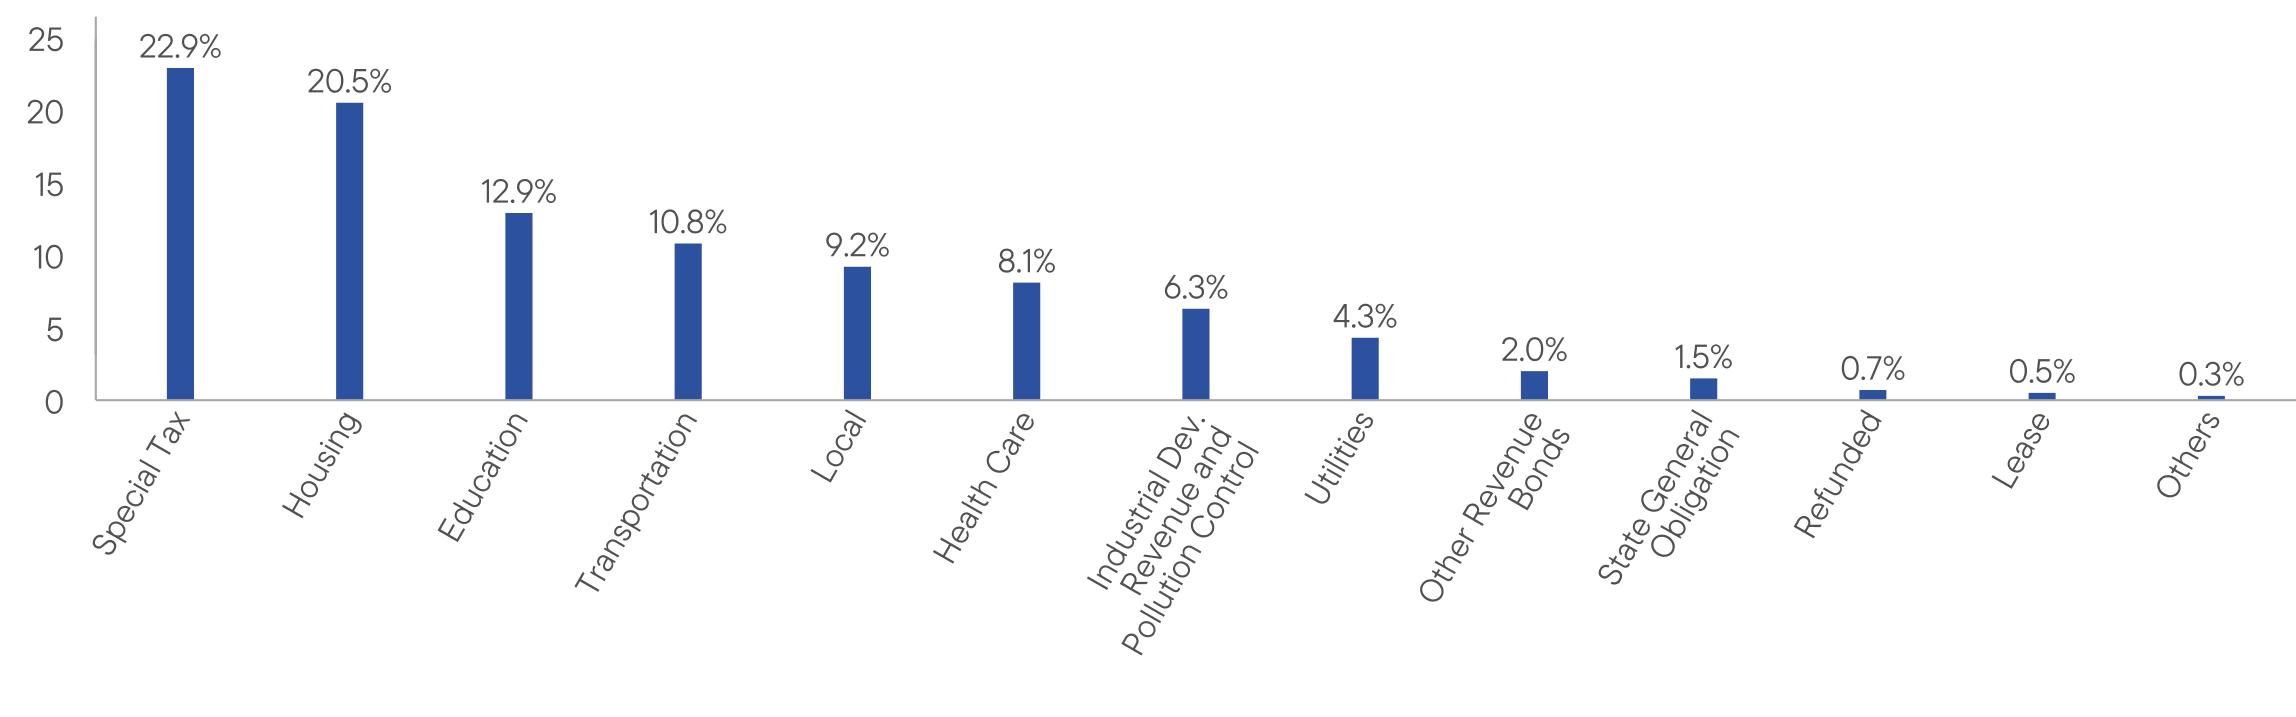
WHAT
DID THE FUND INVEST IN? (as
of February 28, 2026)
Portfolio Composition*
(% of Total Investments)

WHAT
WERE THE FUND COSTS FOR THE LAST YEAR? (based
on a hypothetical $10,000 investment)
|
Class
Name |
Costs
of a $10,000 investment
|
Costs
paid as a percentage of a $10,000
investment |
|
Class
A1 |
$67
|
0.66%
|
HOW
DID THE FUND PERFORM LAST YEAR AND WHAT AFFECTED ITS PERFORMANCE?
For the twelve months ended February
28, 2026, Class A1 shares of
Franklin California High Yield Municipal Fund returned 3.91%.
The Fund compares its performance
to the Bloomberg Municipal Bond California Exempt Index, which returned 4.98% for the same period.
PERFORMANCE
HIGHLIGHTS
|
Top
contributors to performance: | |
|
↑
|
Selection
in bonds with no external credit rating |
|
↑
|
Underweight
to bonds with 30 years to maturity |
|
↑
|
Selection
in B rated bonds |
|
Top
detractors from performance: | |
|
↓
|
Overweight
to bonds with no external credit rating |
|
↓
|
Overweight
to bonds with 20 years to maturity |
|
↓
|
Underweight
bonds with 5 years or less to maturity |

AVERAGE
ANNUAL TOTAL RETURNS (%) Period
Ended February 28, 2026
|
|
1
Year |
5
Year |
10
Year |
|
Class
A1 |
3.91
|
1.18
|
2.70
|
|
Class
A1 (with sales charge) |
-0.04
|
0.41
|
2.31
|
|
Bloomberg
Municipal Bond Index |
4.96
|
1.44
|
2.43
|
|
Bloomberg
Municipal Bond California Exempt Index |
4.98
|
1.45
|
2.37
|
For current month-end performance,
please call Franklin Templeton at (800)
DIAL BEN/342-5236 or visit
https://www.franklintempleton.com/investments/options/mutual-funds.
https://www.franklintempleton.com/investments/options/mutual-funds.
Important data provider notices
and terms available at www.franklintempletondatasources.com.
KEY
FUND STATISTICS (as
of February 28, 2026)
|
Total
Net Assets |
$3,281,260,262
|
|
Total
Number of Portfolio Holdings |
745
|
|
Total
Management Fee Paid |
$13,902,397
|
|
Portfolio
Turnover Rate |
13.89%
|
WHAT
DID THE FUND INVEST IN? (as
of February 28, 2026)
Portfolio Composition*
(% of Total Investments)

WHAT
WERE THE FUND COSTS FOR THE LAST YEAR? (based
on a hypothetical $10,000 investment)
|
Class
Name |
Costs
of a $10,000 investment
|
Costs
paid as a percentage of a $10,000
investment |
|
Class
C |
$122
|
1.20%
|
HOW
DID THE FUND PERFORM LAST YEAR AND WHAT AFFECTED ITS PERFORMANCE?
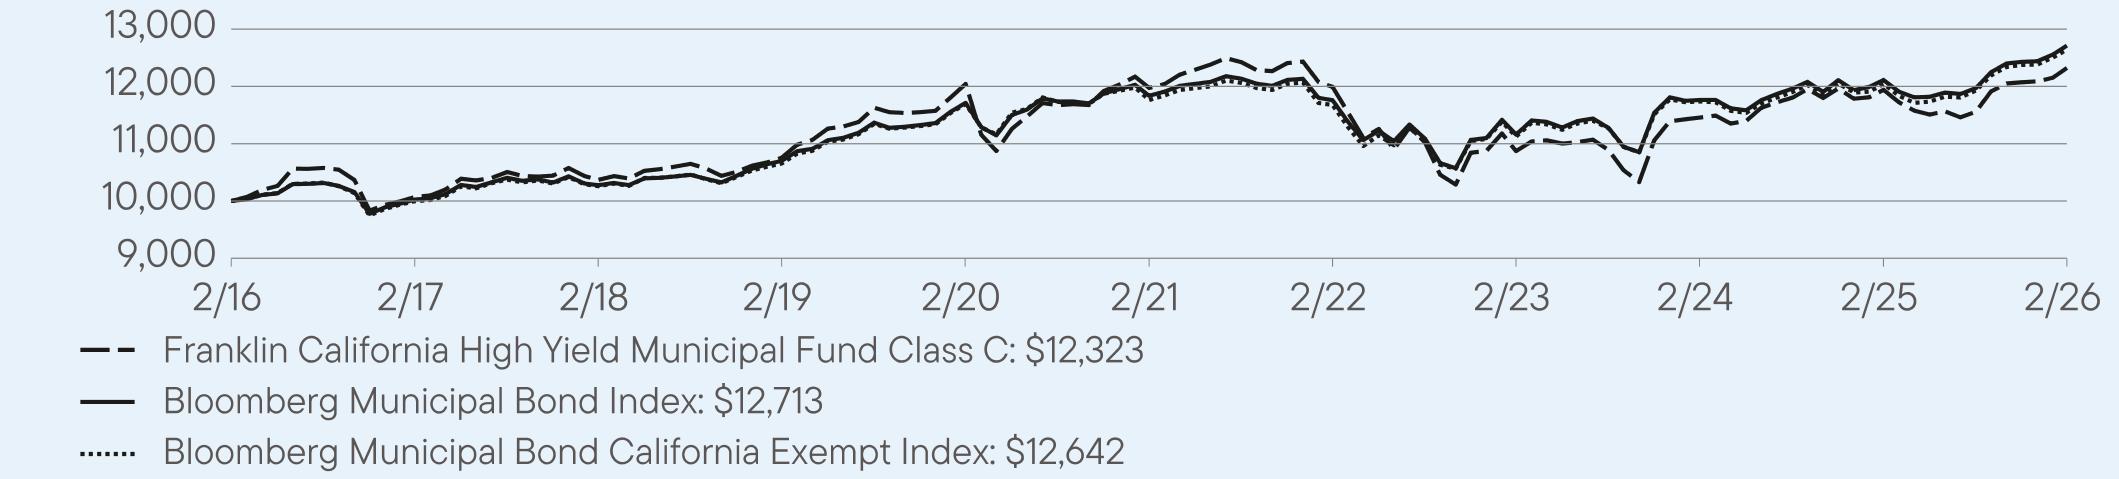
For the twelve months ended February
28, 2026, Class C shares of
Franklin California High Yield Municipal Fund returned 3.20%.
The Fund compares its performance
to the Bloomberg Municipal Bond California Exempt Index, which returned 4.98% for the same period.
PERFORMANCE
HIGHLIGHTS
|
Top
contributors to performance: | |
|
↑
|
Selection
in bonds with no external credit rating |
|
↑
|
Underweight
to bonds with 30 years to maturity |
|
↑
|
Selection
in B rated bonds |
|
Top
detractors from performance: | |
|
↓
|
Overweight
to bonds with no external credit rating |
|
↓
|
Overweight
to bonds with 20 years to maturity |
|
↓
|
Underweight
bonds with 5 years or less to maturity |
AVERAGE
ANNUAL TOTAL RETURNS (%) Period
Ended February 28, 2026
|
|
1
Year |
5
Year |
10
Year |
|
Class
C |
3.20
|
0.58
|
2.11
|
|
Class
C (with sales charge) |
2.21
|
0.58
|
2.11
|
|
Bloomberg
Municipal Bond Index |
4.96
|
1.44
|
2.43
|
|
Bloomberg
Municipal Bond California Exempt Index |
4.98
|
1.45
|
2.37
|
For current month-end performance,
please call Franklin Templeton at (800)
DIAL BEN/342-5236 or visit
https://www.franklintempleton.com/investments/options/mutual-funds.
https://www.franklintempleton.com/investments/options/mutual-funds.
Important data provider notices
and terms available at www.franklintempletondatasources.com.
KEY
FUND STATISTICS (as
of February 28, 2026)
|
Total
Net Assets |
$3,281,260,262
|
|
Total
Number of Portfolio Holdings |
745
|
|
Total
Management Fee Paid |
$13,902,397
|
|
Portfolio
Turnover Rate |
13.89%
|
WHAT
DID THE FUND INVEST IN? (as
of February 28, 2026)
Portfolio Composition*
(% of Total Investments)
WHAT
WERE THE FUND COSTS FOR THE LAST YEAR? (based
on a hypothetical $10,000 investment)
|
Class
Name |
Costs
of a $10,000 investment
|
Costs
paid as a percentage of a $10,000
investment |
|
Class
R6 |
$52
|
0.51%
|
HOW
DID THE FUND PERFORM LAST YEAR AND WHAT AFFECTED ITS PERFORMANCE?
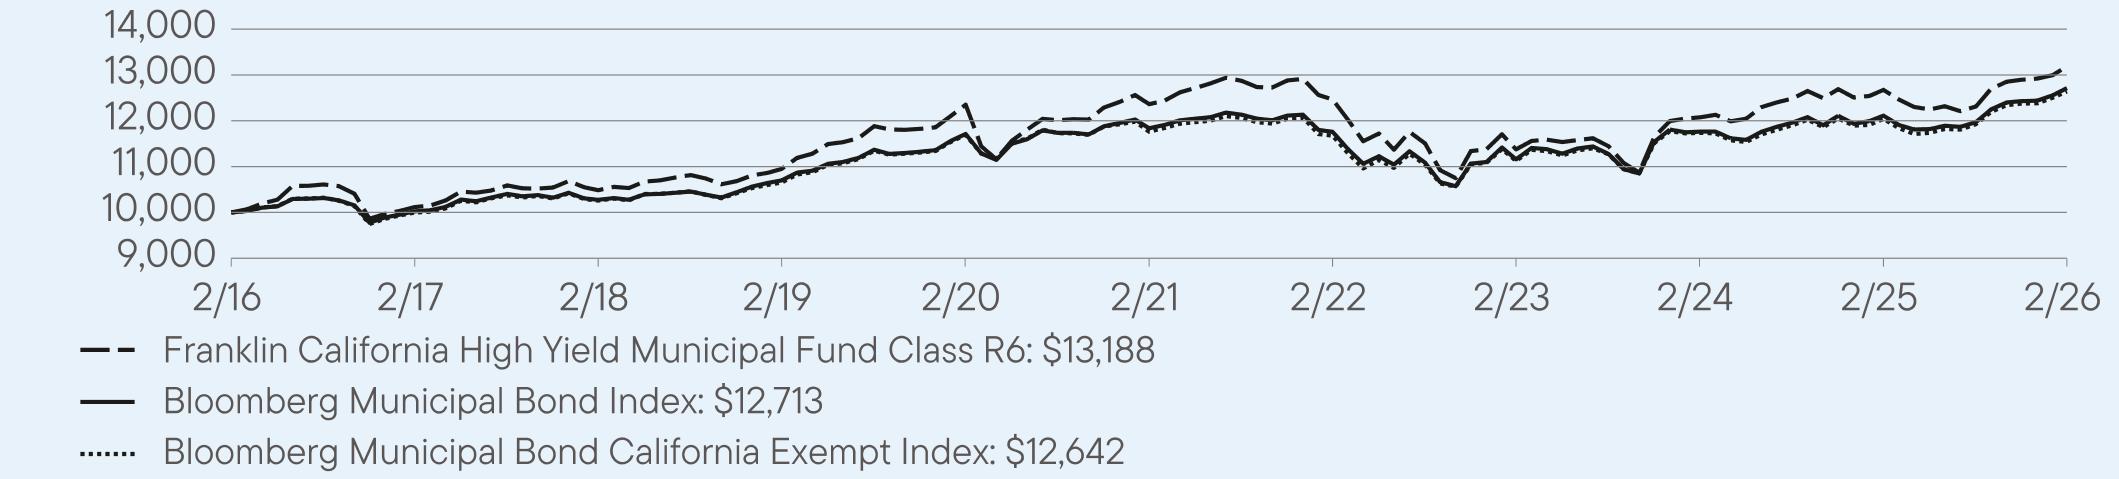
For the twelve months ended February
28, 2026, Class R6 shares of
Franklin California High Yield Municipal Fund returned 4.05%.
The Fund compares its performance
to the Bloomberg Municipal Bond California Exempt Index, which returned 4.98% for the same period.
PERFORMANCE
HIGHLIGHTS
|
Top
contributors to performance: | |
|
↑
|
Selection
in bonds with no external credit rating |
|
↑
|
Underweight
to bonds with 30 years to maturity |
|
↑
|
Selection
in B rated bonds |
|
Top
detractors from performance: | |
|
↓
|
Overweight
to bonds with no external credit rating |
|
↓
|
Overweight
to bonds with 20 years to maturity |
|
↓
|
Underweight
bonds with 5 years or less to maturity |
AVERAGE
ANNUAL TOTAL RETURNS (%) Period
Ended February 28, 2026
|
|
1
Year |
5
Year |
10
Year |
|
Class
R6 |
4.05
|
1.30
|
2.83
|
|
Bloomberg
Municipal Bond Index |
4.96
|
1.44
|
2.43
|
|
Bloomberg
Municipal Bond California Exempt Index |
4.98
|
1.45
|
2.37
|
For current month-end performance,
please call Franklin Templeton at (800)
DIAL BEN/342-5236 or visit
https://www.franklintempleton.com/investments/options/mutual-funds.
https://www.franklintempleton.com/investments/options/mutual-funds.
Important data provider notices
and terms available at www.franklintempletondatasources.com.
KEY
FUND STATISTICS (as
of February 28, 2026)
|
Total
Net Assets |
$3,281,260,262
|
|
Total
Number of Portfolio Holdings |
745
|
|
Total
Management Fee Paid |
$13,902,397
|
|
Portfolio
Turnover Rate |
13.89%
|
WHAT
DID THE FUND INVEST IN? (as
of February 28, 2026)
Portfolio Composition*
(% of Total Investments)

WHAT
WERE THE FUND COSTS FOR THE LAST YEAR? (based
on a hypothetical $10,000 investment)
|
Class
Name |
Costs
of a $10,000 investment
|
Costs
paid as a percentage of a $10,000
investment |
|
Advisor
Class |
$57
|
0.56%
|
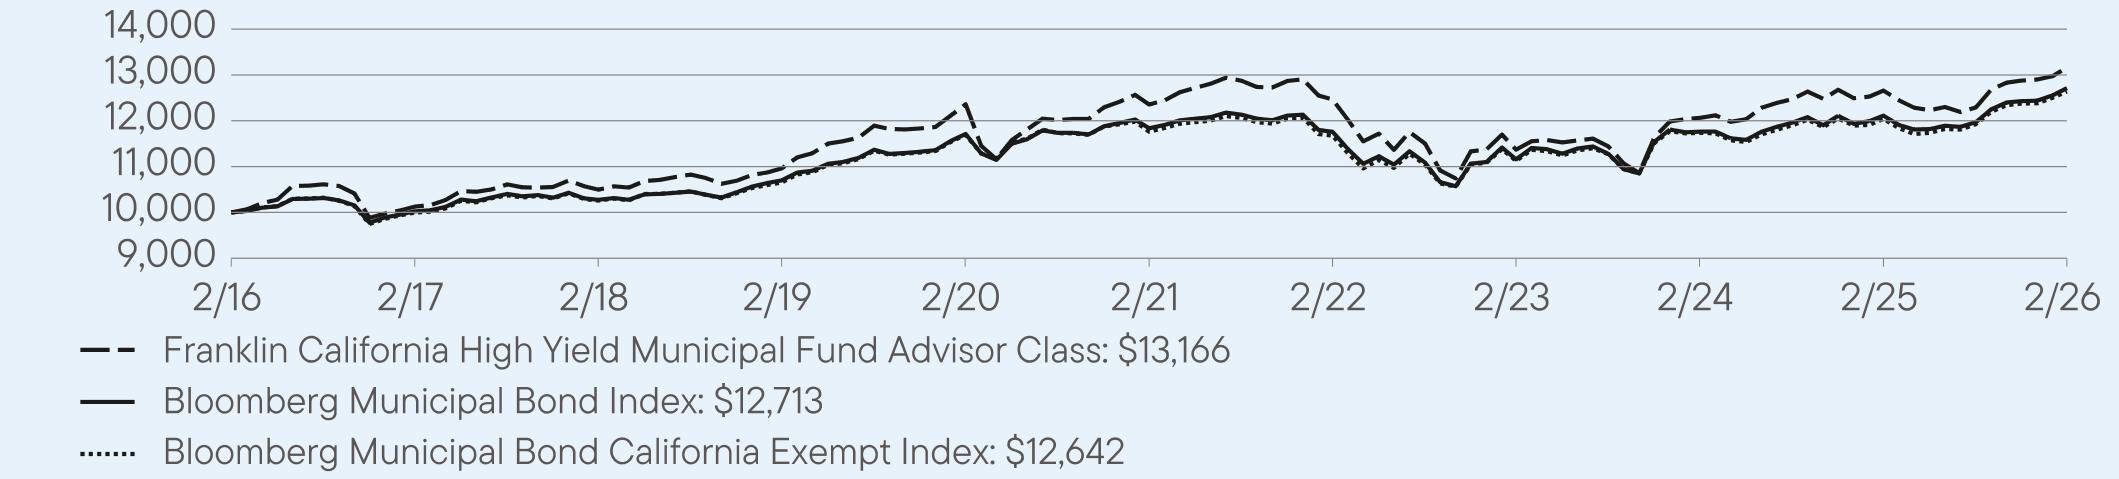
HOW
DID THE FUND PERFORM LAST YEAR AND WHAT AFFECTED ITS PERFORMANCE?
For the twelve months ended February
28, 2026, Advisor Class shares
of Franklin California High Yield Municipal Fund returned 4.00%.
The Fund compares its performance
to the Bloomberg Municipal Bond California Exempt Index, which returned 4.98% for the same period.
PERFORMANCE
HIGHLIGHTS
|
Top
contributors to performance: | |
|
↑
|
Selection
in bonds with no external credit rating |
|
↑
|
Underweight
to bonds with 30 years to maturity |
|
↑
|
Selection
in B rated bonds |
|
Top
detractors from performance: | |
|
↓
|
Overweight
to bonds with no external credit rating |
|
↓
|
Overweight
to bonds with 20 years to maturity |
|
↓
|
Underweight
bonds with 5 years or less to maturity |
AVERAGE
ANNUAL TOTAL RETURNS (%) Period
Ended February 28, 2026
|
|
1
Year |
5
Year |
10
Year |
|
Advisor
Class |
4.00
|
1.28
|
2.79
|
|
Bloomberg
Municipal Bond Index |
4.96
|
1.44
|
2.43
|
|
Bloomberg
Municipal Bond California Exempt Index |
4.98
|
1.45
|
2.37
|
For current month-end performance,
please call Franklin Templeton at (800)
DIAL BEN/342-5236 or visit
https://www.franklintempleton.com/investments/options/mutual-funds.
https://www.franklintempleton.com/investments/options/mutual-funds.
Important data provider notices
and terms available at www.franklintempletondatasources.com.
KEY
FUND STATISTICS (as
of February 28, 2026)
|
Total
Net Assets |
$3,281,260,262
|
|
Total
Number of Portfolio Holdings |
745
|
|
Total
Management Fee Paid |
$13,902,397
|
|
Portfolio
Turnover Rate |
13.89%
|
WHAT
DID THE FUND INVEST IN? (as
of February 28, 2026)
Portfolio Composition*
(% of Total Investments)

| [1] |
|
||
| [2] |
|
||
| [3] |
|
||
| [4] |
|
||
| [5] |
|