false
0000881309
N-1A
N-CSR
0000881309
tsr:C000205976Member
2025-03-01
2026-02-28
0000881309
tsr:C000205976Member
oef:WithoutSalesLoadMember
2025-03-01
2026-02-28
0000881309
tsr:bench202411154454_6674Member
2025-03-01
2026-02-28
0000881309
tsr:benchmarkBM3072_6674Member
2025-03-01
2026-02-28
0000881309
tsr:C000205976Member
2026-02-28
0000881309
tsr:C000205976Member
tsr:bench202409274045_6674Member
2026-02-28
0000881309
tsr:C000205976Member
tsr:bench202409274047_6674Member
2026-02-28
0000881309
tsr:C000205976Member
tsr:bench202409274048_6674Member
2026-02-28
0000881309
tsr:C000205976Member
tsr:bench202409274049_6674Member
2026-02-28
0000881309
tsr:C000205976Member
tsr:bench202409274053_6674Member
2026-02-28
0000881309
tsr:C000205976Member
tsr:bench202409043993_6674Member
2026-02-28
0000881309
tsr:C000205976Member
tsr:bench202409274046_6674Member
2026-02-28
0000881309
tsr:C000205976Member
tsr:bench202409044002_6674Member
2026-02-28
0000881309
tsr:C000205976Member
tsr:bench202409274054_6674Member
2026-02-28
0000881309
tsr:C000205976Member
tsr:bench202409274050_6674Member
2026-02-28
0000881309
tsr:C000205976Member
tsr:bench202409274051_6674Member
2026-02-28
0000881309
tsr:C000205976Member
tsr:bench202409274052_6674Member
2026-02-28
0000881309
tsr:C000205976Member
tsr:bench202503265260_6674Member
2026-02-28
0000881309
tsr:C000205976Member
oef:WithoutSalesLoadMember
2021-03-01
2026-02-28
0000881309
tsr:C000205976Member
2021-03-01
2026-02-28
0000881309
tsr:bench202411154454_6674Member
2021-03-01
2026-02-28
0000881309
tsr:benchmarkBM3072_6674Member
2021-03-01
2026-02-28
0000881309
tsr:C000205976Member
oef:WithoutSalesLoadMember
2016-02-29
2026-02-28
0000881309
tsr:C000205976Member
2016-02-29
2026-02-28
0000881309
tsr:bench202411154454_6674Member
2016-02-29
2026-02-28
0000881309
tsr:benchmarkBM3072_6674Member
2016-02-29
2026-02-28
0000881309
tsr:C000205976Member
2016-02-29
2016-02-29
0000881309
tsr:bench202411154454_6674Member
2016-02-29
2016-02-29
0000881309
tsr:benchmarkBM3072_6674Member
2016-02-29
2016-02-29
0000881309
tsr:C000205976Member
2017-02-28
2017-02-28
0000881309
tsr:bench202411154454_6674Member
2017-02-28
2017-02-28
0000881309
tsr:benchmarkBM3072_6674Member
2017-02-28
2017-02-28
0000881309
tsr:C000205976Member
2018-02-28
2018-02-28
0000881309
tsr:bench202411154454_6674Member
2018-02-28
2018-02-28
0000881309
tsr:benchmarkBM3072_6674Member
2018-02-28
2018-02-28
0000881309
tsr:C000205976Member
2019-02-28
2019-02-28
0000881309
tsr:bench202411154454_6674Member
2019-02-28
2019-02-28
0000881309
tsr:benchmarkBM3072_6674Member
2019-02-28
2019-02-28
0000881309
tsr:C000205976Member
2020-02-29
2020-02-29
0000881309
tsr:bench202411154454_6674Member
2020-02-29
2020-02-29
0000881309
tsr:benchmarkBM3072_6674Member
2020-02-29
2020-02-29
0000881309
tsr:C000205976Member
2021-02-28
2021-02-28
0000881309
tsr:bench202411154454_6674Member
2021-02-28
2021-02-28
0000881309
tsr:benchmarkBM3072_6674Member
2021-02-28
2021-02-28
0000881309
tsr:C000205976Member
2022-02-28
2022-02-28
0000881309
tsr:bench202411154454_6674Member
2022-02-28
2022-02-28
0000881309
tsr:benchmarkBM3072_6674Member
2022-02-28
2022-02-28
0000881309
tsr:C000205976Member
2023-02-28
2023-02-28
0000881309
tsr:bench202411154454_6674Member
2023-02-28
2023-02-28
0000881309
tsr:benchmarkBM3072_6674Member
2023-02-28
2023-02-28
0000881309
tsr:C000205976Member
2024-02-29
2024-02-29
0000881309
tsr:bench202411154454_6674Member
2024-02-29
2024-02-29
0000881309
tsr:benchmarkBM3072_6674Member
2024-02-29
2024-02-29
0000881309
tsr:C000205976Member
2025-02-28
2025-02-28
0000881309
tsr:bench202411154454_6674Member
2025-02-28
2025-02-28
0000881309
tsr:benchmarkBM3072_6674Member
2025-02-28
2025-02-28
0000881309
2025-03-01
2026-02-28
tsr:Years
iso4217:USD
xbrli:pure
xbrli:shares
iso4217:USD
xbrli:shares
0000881309
tsr:C000018537Member
2025-03-01
2026-02-28
0000881309
tsr:C000018537Member
oef:WithoutSalesLoadMember
2025-03-01
2026-02-28
0000881309
tsr:bench202411154454_6673Member
2025-03-01
2026-02-28
0000881309
tsr:benchmarkBM3072_6673Member
2025-03-01
2026-02-28
0000881309
tsr:C000018537Member
2026-02-28
0000881309
tsr:C000018537Member
tsr:bench202409274045_6673Member
2026-02-28
0000881309
tsr:C000018537Member
tsr:bench202409274047_6673Member
2026-02-28
0000881309
tsr:C000018537Member
tsr:bench202409274048_6673Member
2026-02-28
0000881309
tsr:C000018537Member
tsr:bench202409274049_6673Member
2026-02-28
0000881309
tsr:C000018537Member
tsr:bench202409274053_6673Member
2026-02-28
0000881309
tsr:C000018537Member
tsr:bench202409043993_6673Member
2026-02-28
0000881309
tsr:C000018537Member
tsr:bench202409274046_6673Member
2026-02-28
0000881309
tsr:C000018537Member
tsr:bench202409044002_6673Member
2026-02-28
0000881309
tsr:C000018537Member
tsr:bench202409274054_6673Member
2026-02-28
0000881309
tsr:C000018537Member
tsr:bench202409274050_6673Member
2026-02-28
0000881309
tsr:C000018537Member
tsr:bench202409274051_6673Member
2026-02-28
0000881309
tsr:C000018537Member
tsr:bench202409274052_6673Member
2026-02-28
0000881309
tsr:C000018537Member
tsr:bench202503265260_6673Member
2026-02-28
0000881309
tsr:C000018537Member
oef:WithoutSalesLoadMember
2021-03-01
2026-02-28
0000881309
tsr:C000018537Member
2021-03-01
2026-02-28
0000881309
tsr:bench202411154454_6673Member
2021-03-01
2026-02-28
0000881309
tsr:benchmarkBM3072_6673Member
2021-03-01
2026-02-28
0000881309
tsr:C000018537Member
oef:WithoutSalesLoadMember
2016-02-29
2026-02-28
0000881309
tsr:C000018537Member
2016-02-29
2026-02-28
0000881309
tsr:bench202411154454_6673Member
2016-02-29
2026-02-28
0000881309
tsr:benchmarkBM3072_6673Member
2016-02-29
2026-02-28
0000881309
tsr:C000018537Member
2016-02-29
2016-02-29
0000881309
tsr:bench202411154454_6673Member
2016-02-29
2016-02-29
0000881309
tsr:benchmarkBM3072_6673Member
2016-02-29
2016-02-29
0000881309
tsr:C000018537Member
2017-02-28
2017-02-28
0000881309
tsr:bench202411154454_6673Member
2017-02-28
2017-02-28
0000881309
tsr:benchmarkBM3072_6673Member
2017-02-28
2017-02-28
0000881309
tsr:C000018537Member
2018-02-28
2018-02-28
0000881309
tsr:bench202411154454_6673Member
2018-02-28
2018-02-28
0000881309
tsr:benchmarkBM3072_6673Member
2018-02-28
2018-02-28
0000881309
tsr:C000018537Member
2019-02-28
2019-02-28
0000881309
tsr:bench202411154454_6673Member
2019-02-28
2019-02-28
0000881309
tsr:benchmarkBM3072_6673Member
2019-02-28
2019-02-28
0000881309
tsr:C000018537Member
2020-02-29
2020-02-29
0000881309
tsr:bench202411154454_6673Member
2020-02-29
2020-02-29
0000881309
tsr:benchmarkBM3072_6673Member
2020-02-29
2020-02-29
0000881309
tsr:C000018537Member
2021-02-28
2021-02-28
0000881309
tsr:bench202411154454_6673Member
2021-02-28
2021-02-28
0000881309
tsr:benchmarkBM3072_6673Member
2021-02-28
2021-02-28
0000881309
tsr:C000018537Member
2022-02-28
2022-02-28
0000881309
tsr:bench202411154454_6673Member
2022-02-28
2022-02-28
0000881309
tsr:benchmarkBM3072_6673Member
2022-02-28
2022-02-28
0000881309
tsr:C000018537Member
2023-02-28
2023-02-28
0000881309
tsr:bench202411154454_6673Member
2023-02-28
2023-02-28
0000881309
tsr:benchmarkBM3072_6673Member
2023-02-28
2023-02-28
0000881309
tsr:C000018537Member
2024-02-29
2024-02-29
0000881309
tsr:bench202411154454_6673Member
2024-02-29
2024-02-29
0000881309
tsr:benchmarkBM3072_6673Member
2024-02-29
2024-02-29
0000881309
tsr:C000018537Member
2025-02-28
2025-02-28
0000881309
tsr:bench202411154454_6673Member
2025-02-28
2025-02-28
0000881309
tsr:benchmarkBM3072_6673Member
2025-02-28
2025-02-28
0000881309
tsr:C000018539Member
2025-03-01
2026-02-28
0000881309
tsr:C000018539Member
oef:WithoutSalesLoadMember
2025-03-01
2026-02-28
0000881309
tsr:bench202411154454_6675Member
2025-03-01
2026-02-28
0000881309
tsr:benchmarkBM3072_6675Member
2025-03-01
2026-02-28
0000881309
tsr:C000018539Member
2026-02-28
0000881309
tsr:C000018539Member
tsr:bench202409274045_6675Member
2026-02-28
0000881309
tsr:C000018539Member
tsr:bench202409274047_6675Member
2026-02-28
0000881309
tsr:C000018539Member
tsr:bench202409274048_6675Member
2026-02-28
0000881309
tsr:C000018539Member
tsr:bench202409274049_6675Member
2026-02-28
0000881309
tsr:C000018539Member
tsr:bench202409274053_6675Member
2026-02-28
0000881309
tsr:C000018539Member
tsr:bench202409043993_6675Member
2026-02-28
0000881309
tsr:C000018539Member
tsr:bench202409274046_6675Member
2026-02-28
0000881309
tsr:C000018539Member
tsr:bench202409044002_6675Member
2026-02-28
0000881309
tsr:C000018539Member
tsr:bench202409274054_6675Member
2026-02-28
0000881309
tsr:C000018539Member
tsr:bench202409274050_6675Member
2026-02-28
0000881309
tsr:C000018539Member
tsr:bench202409274051_6675Member
2026-02-28
0000881309
tsr:C000018539Member
tsr:bench202409274052_6675Member
2026-02-28
0000881309
tsr:C000018539Member
tsr:bench202503265260_6675Member
2026-02-28
0000881309
tsr:C000018539Member
oef:WithoutSalesLoadMember
2021-03-01
2026-02-28
0000881309
tsr:C000018539Member
2021-03-01
2026-02-28
0000881309
tsr:bench202411154454_6675Member
2021-03-01
2026-02-28
0000881309
tsr:benchmarkBM3072_6675Member
2021-03-01
2026-02-28
0000881309
tsr:C000018539Member
oef:WithoutSalesLoadMember
2016-02-29
2026-02-28
0000881309
tsr:C000018539Member
2016-02-29
2026-02-28
0000881309
tsr:bench202411154454_6675Member
2016-02-29
2026-02-28
0000881309
tsr:benchmarkBM3072_6675Member
2016-02-29
2026-02-28
0000881309
tsr:C000018539Member
2016-02-29
2016-02-29
0000881309
tsr:bench202411154454_6675Member
2016-02-29
2016-02-29
0000881309
tsr:benchmarkBM3072_6675Member
2016-02-29
2016-02-29
0000881309
tsr:C000018539Member
2017-02-28
2017-02-28
0000881309
tsr:bench202411154454_6675Member
2017-02-28
2017-02-28
0000881309
tsr:benchmarkBM3072_6675Member
2017-02-28
2017-02-28
0000881309
tsr:C000018539Member
2018-02-28
2018-02-28
0000881309
tsr:bench202411154454_6675Member
2018-02-28
2018-02-28
0000881309
tsr:benchmarkBM3072_6675Member
2018-02-28
2018-02-28
0000881309
tsr:C000018539Member
2019-02-28
2019-02-28
0000881309
tsr:bench202411154454_6675Member
2019-02-28
2019-02-28
0000881309
tsr:benchmarkBM3072_6675Member
2019-02-28
2019-02-28
0000881309
tsr:C000018539Member
2020-02-29
2020-02-29
0000881309
tsr:bench202411154454_6675Member
2020-02-29
2020-02-29
0000881309
tsr:benchmarkBM3072_6675Member
2020-02-29
2020-02-29
0000881309
tsr:C000018539Member
2021-02-28
2021-02-28
0000881309
tsr:bench202411154454_6675Member
2021-02-28
2021-02-28
0000881309
tsr:benchmarkBM3072_6675Member
2021-02-28
2021-02-28
0000881309
tsr:C000018539Member
2022-02-28
2022-02-28
0000881309
tsr:bench202411154454_6675Member
2022-02-28
2022-02-28
0000881309
tsr:benchmarkBM3072_6675Member
2022-02-28
2022-02-28
0000881309
tsr:C000018539Member
2023-02-28
2023-02-28
0000881309
tsr:bench202411154454_6675Member
2023-02-28
2023-02-28
0000881309
tsr:benchmarkBM3072_6675Member
2023-02-28
2023-02-28
0000881309
tsr:C000018539Member
2024-02-29
2024-02-29
0000881309
tsr:bench202411154454_6675Member
2024-02-29
2024-02-29
0000881309
tsr:benchmarkBM3072_6675Member
2024-02-29
2024-02-29
0000881309
tsr:C000018539Member
2025-02-28
2025-02-28
0000881309
tsr:bench202411154454_6675Member
2025-02-28
2025-02-28
0000881309
tsr:benchmarkBM3072_6675Member
2025-02-28
2025-02-28
0000881309
tsr:C000194351Member
2025-03-01
2026-02-28
0000881309
tsr:bench202411154454_6676Member
2025-03-01
2026-02-28
0000881309
tsr:benchmarkBM3072_6676Member
2025-03-01
2026-02-28
0000881309
tsr:C000194351Member
2026-02-28
0000881309
tsr:C000194351Member
tsr:bench202409274045_6676Member
2026-02-28
0000881309
tsr:C000194351Member
tsr:bench202409274047_6676Member
2026-02-28
0000881309
tsr:C000194351Member
tsr:bench202409274048_6676Member
2026-02-28
0000881309
tsr:C000194351Member
tsr:bench202409274049_6676Member
2026-02-28
0000881309
tsr:C000194351Member
tsr:bench202409274053_6676Member
2026-02-28
0000881309
tsr:C000194351Member
tsr:bench202409043993_6676Member
2026-02-28
0000881309
tsr:C000194351Member
tsr:bench202409274046_6676Member
2026-02-28
0000881309
tsr:C000194351Member
tsr:bench202409044002_6676Member
2026-02-28
0000881309
tsr:C000194351Member
tsr:bench202409274054_6676Member
2026-02-28
0000881309
tsr:C000194351Member
tsr:bench202409274050_6676Member
2026-02-28
0000881309
tsr:C000194351Member
tsr:bench202409274051_6676Member
2026-02-28
0000881309
tsr:C000194351Member
tsr:bench202409274052_6676Member
2026-02-28
0000881309
tsr:C000194351Member
tsr:bench202503265260_6676Member
2026-02-28
0000881309
tsr:C000194351Member
2021-03-01
2026-02-28
0000881309
tsr:bench202411154454_6676Member
2021-03-01
2026-02-28
0000881309
tsr:benchmarkBM3072_6676Member
2021-03-01
2026-02-28
0000881309
tsr:C000194351Member
2016-02-29
2026-02-28
0000881309
tsr:bench202411154454_6676Member
2016-02-29
2026-02-28
0000881309
tsr:benchmarkBM3072_6676Member
2016-02-29
2026-02-28
0000881309
tsr:C000194351Member
2016-02-29
2016-02-29
0000881309
tsr:bench202411154454_6676Member
2016-02-29
2016-02-29
0000881309
tsr:benchmarkBM3072_6676Member
2016-02-29
2016-02-29
0000881309
tsr:C000194351Member
2017-02-28
2017-02-28
0000881309
tsr:bench202411154454_6676Member
2017-02-28
2017-02-28
0000881309
tsr:benchmarkBM3072_6676Member
2017-02-28
2017-02-28
0000881309
tsr:C000194351Member
2018-02-28
2018-02-28
0000881309
tsr:bench202411154454_6676Member
2018-02-28
2018-02-28
0000881309
tsr:benchmarkBM3072_6676Member
2018-02-28
2018-02-28
0000881309
tsr:C000194351Member
2019-02-28
2019-02-28
0000881309
tsr:bench202411154454_6676Member
2019-02-28
2019-02-28
0000881309
tsr:benchmarkBM3072_6676Member
2019-02-28
2019-02-28
0000881309
tsr:C000194351Member
2020-02-29
2020-02-29
0000881309
tsr:bench202411154454_6676Member
2020-02-29
2020-02-29
0000881309
tsr:benchmarkBM3072_6676Member
2020-02-29
2020-02-29
0000881309
tsr:C000194351Member
2021-02-28
2021-02-28
0000881309
tsr:bench202411154454_6676Member
2021-02-28
2021-02-28
0000881309
tsr:benchmarkBM3072_6676Member
2021-02-28
2021-02-28
0000881309
tsr:C000194351Member
2022-02-28
2022-02-28
0000881309
tsr:bench202411154454_6676Member
2022-02-28
2022-02-28
0000881309
tsr:benchmarkBM3072_6676Member
2022-02-28
2022-02-28
0000881309
tsr:C000194351Member
2023-02-28
2023-02-28
0000881309
tsr:bench202411154454_6676Member
2023-02-28
2023-02-28
0000881309
tsr:benchmarkBM3072_6676Member
2023-02-28
2023-02-28
0000881309
tsr:C000194351Member
2024-02-29
2024-02-29
0000881309
tsr:bench202411154454_6676Member
2024-02-29
2024-02-29
0000881309
tsr:benchmarkBM3072_6676Member
2024-02-29
2024-02-29
0000881309
tsr:C000194351Member
2025-02-28
2025-02-28
0000881309
tsr:bench202411154454_6676Member
2025-02-28
2025-02-28
0000881309
tsr:benchmarkBM3072_6676Member
2025-02-28
2025-02-28
0000881309
tsr:C000040036Member
2025-03-01
2026-02-28
0000881309
tsr:bench202411154454_6672Member
2025-03-01
2026-02-28
0000881309
tsr:benchmarkBM3072_6672Member
2025-03-01
2026-02-28
0000881309
tsr:C000040036Member
2026-02-28
0000881309
tsr:C000040036Member
tsr:bench202409274045_6672Member
2026-02-28
0000881309
tsr:C000040036Member
tsr:bench202409274047_6672Member
2026-02-28
0000881309
tsr:C000040036Member
tsr:bench202409274048_6672Member
2026-02-28
0000881309
tsr:C000040036Member
tsr:bench202409274049_6672Member
2026-02-28
0000881309
tsr:C000040036Member
tsr:bench202409274053_6672Member
2026-02-28
0000881309
tsr:C000040036Member
tsr:bench202409043993_6672Member
2026-02-28
0000881309
tsr:C000040036Member
tsr:bench202409274046_6672Member
2026-02-28
0000881309
tsr:C000040036Member
tsr:bench202409044002_6672Member
2026-02-28
0000881309
tsr:C000040036Member
tsr:bench202409274054_6672Member
2026-02-28
0000881309
tsr:C000040036Member
tsr:bench202409274050_6672Member
2026-02-28
0000881309
tsr:C000040036Member
tsr:bench202409274051_6672Member
2026-02-28
0000881309
tsr:C000040036Member
tsr:bench202409274052_6672Member
2026-02-28
0000881309
tsr:C000040036Member
tsr:bench202503265260_6672Member
2026-02-28
0000881309
tsr:C000040036Member
2021-03-01
2026-02-28
0000881309
tsr:bench202411154454_6672Member
2021-03-01
2026-02-28
0000881309
tsr:benchmarkBM3072_6672Member
2021-03-01
2026-02-28
0000881309
tsr:C000040036Member
2016-02-29
2026-02-28
0000881309
tsr:bench202411154454_6672Member
2016-02-29
2026-02-28
0000881309
tsr:benchmarkBM3072_6672Member
2016-02-29
2026-02-28
0000881309
tsr:C000040036Member
2016-02-29
2016-02-29
0000881309
tsr:bench202411154454_6672Member
2016-02-29
2016-02-29
0000881309
tsr:benchmarkBM3072_6672Member
2016-02-29
2016-02-29
0000881309
tsr:C000040036Member
2017-02-28
2017-02-28
0000881309
tsr:bench202411154454_6672Member
2017-02-28
2017-02-28
0000881309
tsr:benchmarkBM3072_6672Member
2017-02-28
2017-02-28
0000881309
tsr:C000040036Member
2018-02-28
2018-02-28
0000881309
tsr:bench202411154454_6672Member
2018-02-28
2018-02-28
0000881309
tsr:benchmarkBM3072_6672Member
2018-02-28
2018-02-28
0000881309
tsr:C000040036Member
2019-02-28
2019-02-28
0000881309
tsr:bench202411154454_6672Member
2019-02-28
2019-02-28
0000881309
tsr:benchmarkBM3072_6672Member
2019-02-28
2019-02-28
0000881309
tsr:C000040036Member
2020-02-29
2020-02-29
0000881309
tsr:bench202411154454_6672Member
2020-02-29
2020-02-29
0000881309
tsr:benchmarkBM3072_6672Member
2020-02-29
2020-02-29
0000881309
tsr:C000040036Member
2021-02-28
2021-02-28
0000881309
tsr:bench202411154454_6672Member
2021-02-28
2021-02-28
0000881309
tsr:benchmarkBM3072_6672Member
2021-02-28
2021-02-28
0000881309
tsr:C000040036Member
2022-02-28
2022-02-28
0000881309
tsr:bench202411154454_6672Member
2022-02-28
2022-02-28
0000881309
tsr:benchmarkBM3072_6672Member
2022-02-28
2022-02-28
0000881309
tsr:C000040036Member
2023-02-28
2023-02-28
0000881309
tsr:bench202411154454_6672Member
2023-02-28
2023-02-28
0000881309
tsr:benchmarkBM3072_6672Member
2023-02-28
2023-02-28
0000881309
tsr:C000040036Member
2024-02-29
2024-02-29
0000881309
tsr:bench202411154454_6672Member
2024-02-29
2024-02-29
0000881309
tsr:benchmarkBM3072_6672Member
2024-02-29
2024-02-29
0000881309
tsr:C000040036Member
2025-02-28
2025-02-28
0000881309
tsr:bench202411154454_6672Member
2025-02-28
2025-02-28
0000881309
tsr:benchmarkBM3072_6672Member
2025-02-28
2025-02-28
UNITED STATES
SECURITIES AND EXCHANGE COMMISSION
Washington, D.C. 20549
FORM N-CSR
CERTIFIED SHAREHOLDER REPORT OF REGISTERED
MANAGEMENT INVESTMENT COMPANIES
Investment Company Act file number 811-06481
Franklin Municipal Securities Trust
(Exact name of registrant as specified in charter)
One Franklin Parkway, San Mateo, CA 94403-1906
(Address of principal executive offices) (Zip code)
Alison Baur
Franklin Templeton
One Franklin Parkway
San Mateo, CA 94403-1906
(Name and address of agent for service)
Registrant’s telephone number, including area
code: (650) 312-2000
Date of fiscal year end: February 28
Date of reporting period: February 28, 2026
| ITEM 1. |
REPORT TO STOCKHOLDERS |
(a) The Report to Shareholders is filed herewith
|
|
|
|
Franklin
California High Yield Municipal Fund |
|
|
Class
A [FCQAX]
|
|
Annual
Shareholder Report | February
28, 2026 |
|
|
This
annual
shareholder report
contains important information about Franklin
California High Yield Municipal Fund for the period March
1, 2025, to February
28, 2026.
You
can find additional information about the Fund at https://www.franklintempleton.com/regulatory-fund-documents.
You can also request this information
by contacting us at (800)
DIAL BEN/342-5236.
|
|
|
|
Class
Name |
Costs
of a $10,000 investment
|
Costs
paid as a percentage of a $10,000
investment |
|
Class
A |
$83
|
%
|
HOW
DID THE FUND PERFORM LAST YEAR AND WHAT AFFECTED ITS PERFORMANCE?
For the twelve months ended February
28, 2026, Class A shares of
Franklin California High Yield Municipal Fund returned 3.74%.
The Fund compares its performance
to the Bloomberg Municipal Bond California Exempt Index, which returned 4.98% for the same period.
|
|
|
Top
contributors to performance: |
|
↑
|
Selection
in bonds with no external credit rating |
|
↑
|
Underweight
to bonds with 30 years to maturity |
|
↑
|
Selection
in B rated bonds |
|
|
|
Top
detractors from performance: |
|
↓
|
Overweight
to bonds with no external credit rating |
|
↓
|
Overweight
to bonds with 20 years to maturity |
|
↓
|
Underweight
bonds with 5 years or less to maturity |
| Franklin
California High Yield Municipal Fund |
PAGE
1 |
1175-ATSR-0426 |
HOW
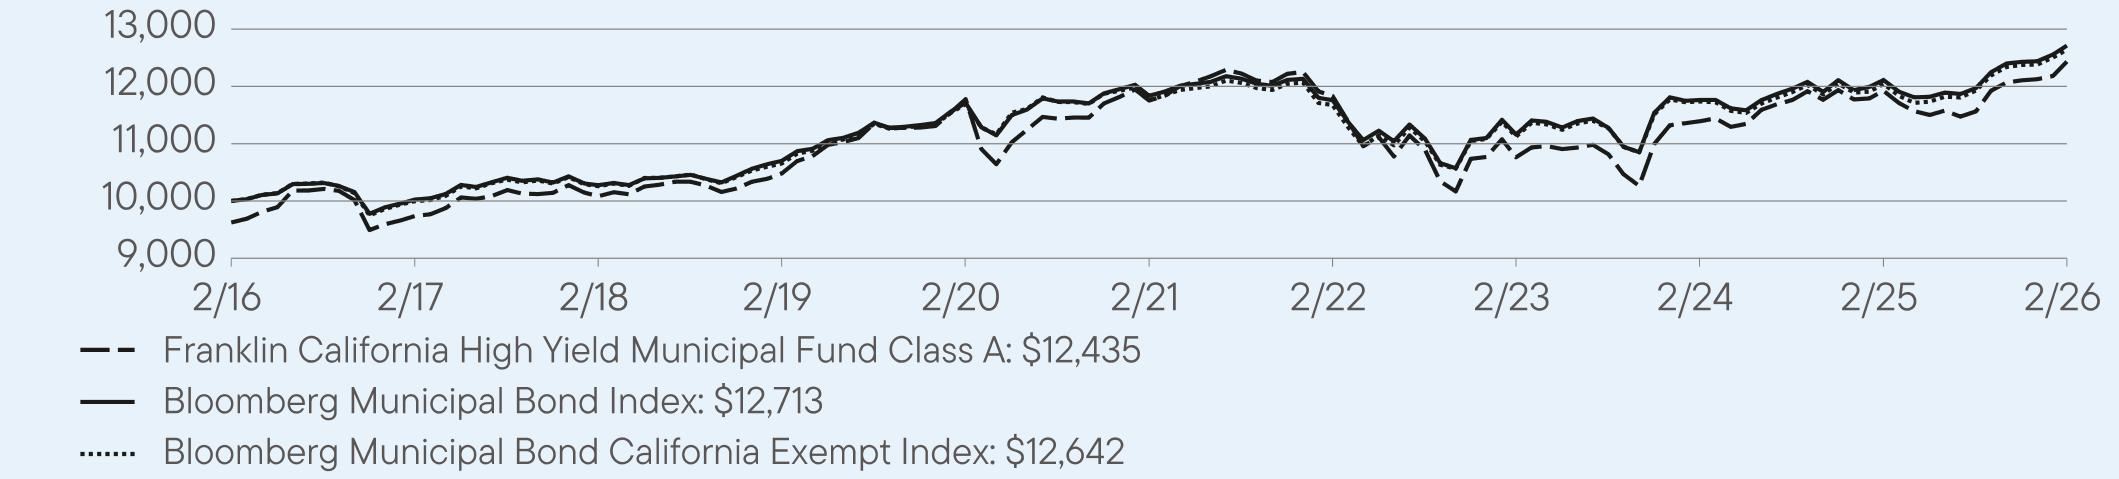
DID THE FUND PERFORM OVER THE LAST 10 YEARS?
The
Fund’s past performance is not necessarily an indication of how the Fund will perform in the future. The
graph and table do not reflect
the deduction of taxes that a shareholder would pay on Fund distributions or redemption of Fund shares.
VALUE
OF A $10,000
INVESTMENT ($9,625
AFTER MAXIMUM APPLICABLE SALES CHARGE) –
Class
A 2/29/2016 —
2/28/2026
AVERAGE
ANNUAL TOTAL RETURNS (%) Period
Ended February 28, 2026
|
|
|
|
|
|
1
Year |
5
Year |
10
Year |
|
Class
A |
3.74
|
1.03
|
2.60
|
|
Class
A (with sales charge) |
-0.15
|
0.26
|
2.20
|
|
Bloomberg
Municipal Bond Index |
4.96
|
1.44
|
2.43
|
|
Bloomberg
Municipal Bond California Exempt Index |
4.98
|
1.45
|
2.37
|
Fund
performance figures may reflect fee waivers and/or expense reimbursements, without which the performance would have been lower.
The
Fund began offering Class A shares on 9/10/2018. Returns for periods before 9/10/2018, are based on the Fund’s Class A1 performance,
which has been adjusted to take into account differences in class-specific operating expenses and maximum sales charges.
For periods after the share class offering, performance for the specific share class is used, reflecting the applicable expenses and
maximum sales charges.
Performance
for periods prior to March 1, 2019, has been restated to reflect the current maximum sales charge, which is lower than the maximum
sales charge prior to that date.
For current month-end performance,
please call Franklin Templeton at (800)
DIAL BEN/342-5236 or visit
https://www.franklintempleton.com/investments/options/mutual-funds.
Important data provider notices
and terms available at www.franklintempletondatasources.com.
KEY
FUND STATISTICS (as
of February 28, 2026)
|
|
|
Total
Net Assets |
$3,281,260,262
|
|
Total
Number of Portfolio Holdings |
745
|
|
Total
Management Fee Paid |
$13,902,397
|
|
Portfolio
Turnover Rate |
13.89%
|
| Franklin
California High Yield Municipal Fund |
PAGE
2 |
1175-ATSR-0426 |
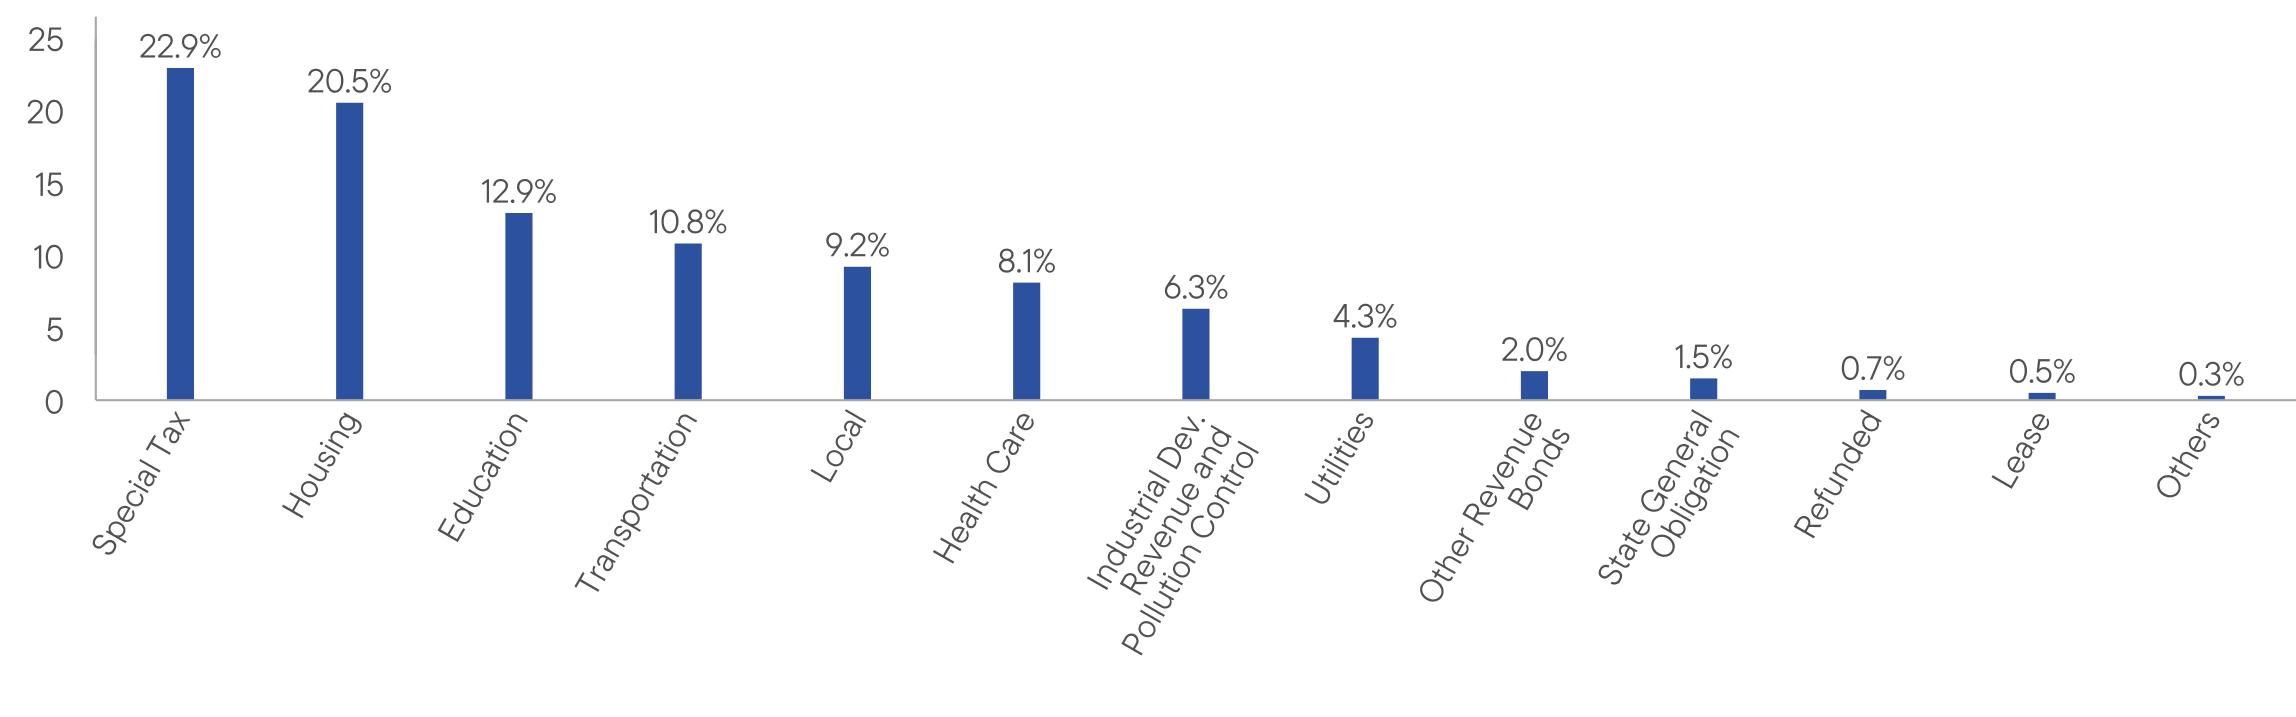
Portfolio Composition*
(% of Total Investments)
| * |
Does
not include derivatives, except purchased options, if any. |
|
|
|
|
WHERE
CAN I FIND ADDITIONAL INFORMATION ABOUT THE FUND? |
|
Additional
information is available on https://www.franklintempleton.com/regulatory-fund-documents,
including its: |
|
•
prospectus • proxy voting information • financial information • holdings • tax information |
HOUSEHOLDING
You
will receive the Fund’s shareholder reports every six months. In addition, you will receive an annual updated summary prospectus
(detail prospectus available
upon request). To reduce Fund expenses, we try to identify related shareholders in a household and send only
one copy of the shareholder reports and summary prospectus. This process, called “householding,” will continue indefinitely
unless you instruct us otherwise.
If you prefer not to have these documents householded, please call us at (800)
DIAL BEN/342-5236. At any time,
you may view current prospectuses/summary prospectuses and shareholder reports on our website. If you choose, you may
receive these documents through electronic delivery.
| Franklin
California High Yield Municipal Fund |
PAGE
3 |
1175-ATSR-0426 |
96259737100841048011778117551183110763113931192512435100001002510276107001171311837117591115911764121121271310000999710259106541169311763116761112411738120421264222.920.512.910.89.28.16.34.32.01.50.70.50.3
|
|
|
|
Franklin
California High Yield Municipal Fund |
|
|
Class
A1 [FCAMX]
|
|
Annual
Shareholder Report | February
28, 2026 |
|
|
This
annual
shareholder report
contains important information about Franklin
California High Yield Municipal Fund for the period March
1, 2025, to February
28, 2026.
You
can find additional information about the Fund at https://www.franklintempleton.com/regulatory-fund-documents.
You can also request this information
by contacting us at (800)
DIAL BEN/342-5236.
|
|
|
|
Class
Name |
Costs
of a $10,000 investment
|
Costs
paid as a percentage of a $10,000
investment |
|
Class
A1 |
$67
|
%
|
HOW
DID THE FUND PERFORM LAST YEAR AND WHAT AFFECTED ITS PERFORMANCE?
For the twelve months ended February
28, 2026, Class A1 shares of
Franklin California High Yield Municipal Fund returned 3.91%.
The Fund compares its performance
to the Bloomberg Municipal Bond California Exempt Index, which returned 4.98% for the same period.
|
|
|
Top
contributors to performance: |
|
↑
|
Selection
in bonds with no external credit rating |
|
↑
|
Underweight
to bonds with 30 years to maturity |
|
↑
|
Selection
in B rated bonds |
|
|
|
Top
detractors from performance: |
|
↓
|
Overweight
to bonds with no external credit rating |
|
↓
|
Overweight
to bonds with 20 years to maturity |
|
↓
|
Underweight
bonds with 5 years or less to maturity |
| Franklin
California High Yield Municipal Fund |
PAGE
1 |
175-ATSR-0426 |
HOW
DID THE FUND PERFORM OVER THE LAST 10 YEARS?
The
Fund’s past performance is not necessarily an indication of how the Fund will perform in the future. The
graph and table do not reflect
the deduction of taxes that a shareholder would pay on Fund distributions or redemption of Fund shares.
VALUE
OF A $10,000
INVESTMENT ($9,625
AFTER MAXIMUM APPLICABLE SALES CHARGE) –
Class
A1 2/29/2016 —
2/28/2026
AVERAGE
ANNUAL TOTAL RETURNS (%) Period
Ended February 28, 2026
|
|
|
|
|
|
1
Year |
5
Year |
10
Year |
|
Class
A1 |
3.91
|
1.18
|
2.70
|
|
Class
A1 (with sales charge) |
-0.04
|
0.41
|
2.31
|
|
Bloomberg
Municipal Bond Index |
4.96
|
1.44
|
2.43
|
|
Bloomberg
Municipal Bond California Exempt Index |
4.98
|
1.45
|
2.37
|
Fund
performance figures may reflect fee waivers and/or expense reimbursements, without which the performance would have been lower.
Effective
9/10/18, Class A shares closed to new investors, were renamed Class A1 shares, and a new Class A share with a different expense
structure became available.
Performance
for periods prior to March 1, 2019, has been restated to reflect the current maximum sales charge, which is lower than the maximum
sales charge prior to that date.
For current month-end performance,
please call Franklin Templeton at (800)
DIAL BEN/342-5236 or visit
https://www.franklintempleton.com/investments/options/mutual-funds.
Important data provider notices
and terms available at www.franklintempletondatasources.com.
KEY
FUND STATISTICS (as
of February 28, 2026)
|
|
|
Total
Net Assets |
$3,281,260,262
|
|
Total
Number of Portfolio Holdings |
745
|
|
Total
Management Fee Paid |
$13,902,397
|
|
Portfolio
Turnover Rate |
13.89%
|
| Franklin
California High Yield Municipal Fund |
PAGE
2 |
175-ATSR-0426 |
Portfolio Composition*
(% of Total Investments)
| * |
Does
not include derivatives, except purchased options, if any. |
|
|
|
|
WHERE
CAN I FIND ADDITIONAL INFORMATION ABOUT THE FUND? |
|
Additional
information is available on https://www.franklintempleton.com/regulatory-fund-documents,
including its: |
|
•
prospectus • proxy voting information • financial information • holdings • tax information |
HOUSEHOLDING
You
will receive the Fund’s shareholder reports every six months. In addition, you will receive an annual updated summary prospectus
(detail prospectus available
upon request). To reduce Fund expenses, we try to identify related shareholders in a household and send only
one copy of the shareholder reports and summary prospectus. This process, called “householding,” will continue indefinitely
unless you instruct us otherwise.
If you prefer not to have these documents householded, please call us at (800)
DIAL BEN/342-5236. At any time,
you may view current prospectuses/summary prospectuses and shareholder reports on our website. If you choose, you may
receive these documents through electronic delivery.
| Franklin
California High Yield Municipal Fund |
PAGE
3 |
175-ATSR-0426 |
96259738100851052211845118401192410872115261208412556100001002510276107001171311837117591115911764121121271310000999710259106541169311763116761112411738120421264222.920.512.910.89.28.16.34.32.01.50.70.50.3
|
|
|
|
Franklin
California High Yield Municipal Fund |
|
|
Class
C [FCAHX]
|
|
Annual
Shareholder Report | February
28, 2026 |
|
|
This
annual
shareholder report
contains important information about Franklin
California High Yield Municipal Fund for the period March
1, 2025, to February
28, 2026.
You
can find additional information about the Fund at https://www.franklintempleton.com/regulatory-fund-documents.
You can also request this information
by contacting us at (800)
DIAL BEN/342-5236.
|
|
|
|
Class
Name |
Costs
of a $10,000 investment
|
Costs
paid as a percentage of a $10,000
investment |
|
Class
C |
$122
|
%
|
HOW
DID THE FUND PERFORM LAST YEAR AND WHAT AFFECTED ITS PERFORMANCE?
For the twelve months ended February
28, 2026, Class C shares of
Franklin California High Yield Municipal Fund returned 3.20%.
The Fund compares its performance
to the Bloomberg Municipal Bond California Exempt Index, which returned 4.98% for the same period.
|
|
|
Top
contributors to performance: |
|
↑
|
Selection
in bonds with no external credit rating |
|
↑
|
Underweight
to bonds with 30 years to maturity |
|
↑
|
Selection
in B rated bonds |
|
|
|
Top
detractors from performance: |
|
↓
|
Overweight
to bonds with no external credit rating |
|
↓
|
Overweight
to bonds with 20 years to maturity |
|
↓
|
Underweight
bonds with 5 years or less to maturity |
| Franklin
California High Yield Municipal Fund |
PAGE
1 |
275-ATSR-0426 |
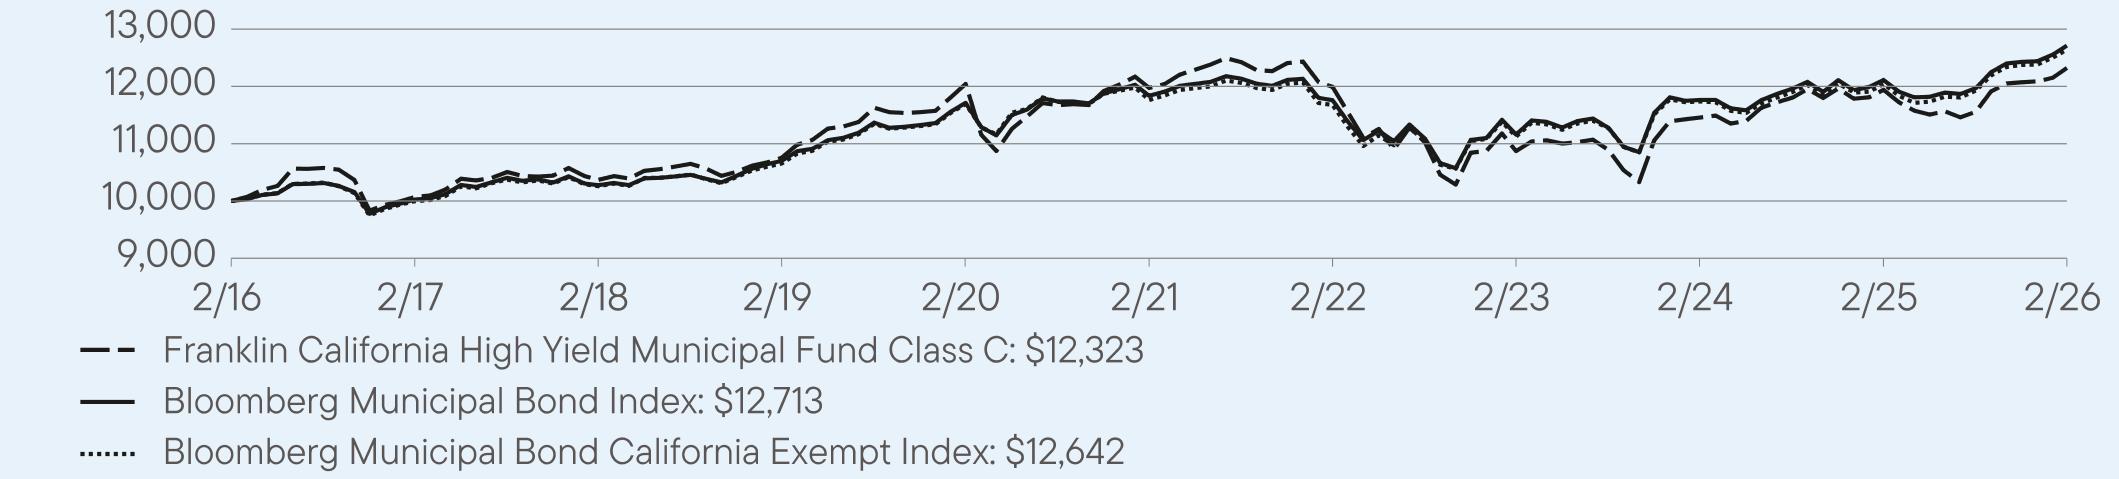
HOW
DID THE FUND PERFORM OVER THE LAST 10 YEARS?
The
Fund’s past performance is not necessarily an indication of how the Fund will perform in the future. The
graph and table do not reflect
the deduction of taxes that a shareholder would pay on Fund distributions or redemption of Fund shares.
VALUE
OF A $10,000
INVESTMENT – Class
C 2/29/2016 —
2/28/2026
AVERAGE
ANNUAL TOTAL RETURNS (%) Period
Ended February 28, 2026
|
|
|
|
|
|
1
Year |
5
Year |
10
Year |
|
Class
C |
3.20
|
0.58
|
2.11
|
|
Class
C (with sales charge) |
2.21
|
0.58
|
2.11
|
|
Bloomberg
Municipal Bond Index |
4.96
|
1.44
|
2.43
|
|
Bloomberg
Municipal Bond California Exempt Index |
4.98
|
1.45
|
2.37
|
Fund
performance figures may reflect fee waivers and/or expense reimbursements, without which the performance would have been lower.
For current month-end performance,
please call Franklin Templeton at (800)
DIAL BEN/342-5236 or visit
https://www.franklintempleton.com/investments/options/mutual-funds.
Important data provider notices
and terms available at www.franklintempletondatasources.com.
KEY
FUND STATISTICS (as
of February 28, 2026)
|
|
|
Total
Net Assets |
$3,281,260,262
|
|
Total
Number of Portfolio Holdings |
745
|
|
Total
Management Fee Paid |
$13,902,397
|
|
Portfolio
Turnover Rate |
13.89%
|
Portfolio Composition*
(% of Total Investments)
| * |
Does
not include derivatives, except purchased options, if any. |
| Franklin
California High Yield Municipal Fund |
PAGE
2 |
275-ATSR-0426 |
|
|
|
|
WHERE
CAN I FIND ADDITIONAL INFORMATION ABOUT THE FUND? |
|
Additional
information is available on https://www.franklintempleton.com/regulatory-fund-documents,
including its: |
|
•
prospectus • proxy voting information • financial information • holdings • tax information |
HOUSEHOLDING
You
will receive the Fund’s shareholder reports every six months. In addition, you will receive an annual updated summary prospectus
(detail prospectus available
upon request). To reduce Fund expenses, we try to identify related shareholders in a household and send only
one copy of the shareholder reports and summary prospectus. This process, called “householding,” will continue indefinitely
unless you instruct us otherwise.
If you prefer not to have these documents householded, please call us at (800)
DIAL BEN/342-5236. At any time,
you may view current prospectuses/summary prospectuses and shareholder reports on our website. If you choose, you may
receive these documents through electronic delivery.
| Franklin
California High Yield Municipal Fund |
PAGE
3 |
275-ATSR-0426 |
1000010069103681075512043119741199210871114571194112323100001002510276107001171311837117591115911764121121271310000999710259106541169311763116761112411738120421264222.920.512.910.89.28.16.34.32.01.50.70.50.3
|
|
|
|
Franklin
California High Yield Municipal Fund |
|
|
Class
R6 [FCAQX]
|
|
Annual
Shareholder Report | February
28, 2026 |
|
|
This
annual
shareholder report
contains important information about Franklin
California High Yield Municipal Fund for the period March
1, 2025, to February
28, 2026.
You
can find additional information about the Fund at https://www.franklintempleton.com/regulatory-fund-documents.
You can also request this information
by contacting us at (800)
DIAL BEN/342-5236.
|
|
|
|
Class
Name |
Costs
of a $10,000 investment
|
Costs
paid as a percentage of a $10,000
investment |
|
Class
R6 |
$52
|
%
|
HOW
DID THE FUND PERFORM LAST YEAR AND WHAT AFFECTED ITS PERFORMANCE?
For the twelve months ended February
28, 2026, Class R6 shares of
Franklin California High Yield Municipal Fund returned 4.05%.
The Fund compares its performance
to the Bloomberg Municipal Bond California Exempt Index, which returned 4.98% for the same period.
|
|
|
Top
contributors to performance: |
|
↑
|
Selection
in bonds with no external credit rating |
|
↑
|
Underweight
to bonds with 30 years to maturity |
|
↑
|
Selection
in B rated bonds |
|
|
|
Top
detractors from performance: |
|
↓
|
Overweight
to bonds with no external credit rating |
|
↓
|
Overweight
to bonds with 20 years to maturity |
|
↓
|
Underweight
bonds with 5 years or less to maturity |
| Franklin
California High Yield Municipal Fund |
PAGE
1 |
8175-ATSR-0426 |
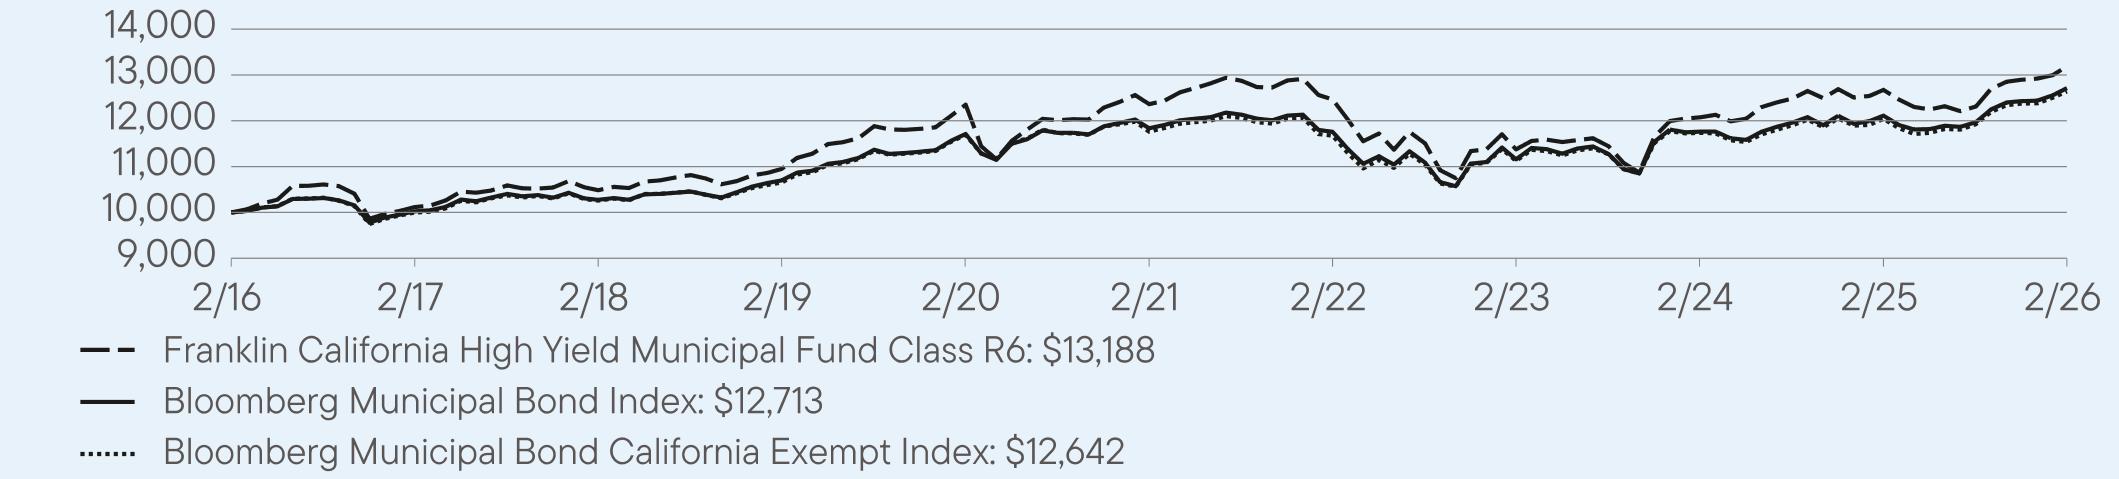
HOW
DID THE FUND PERFORM OVER THE LAST 10 YEARS?
The
Fund’s past performance is not necessarily an indication of how the Fund will perform in the future. The
graph and table do not reflect
the deduction of taxes that a shareholder would pay on Fund distributions or redemption of Fund shares.
VALUE
OF A $10,000
INVESTMENT – Class
R6 2/29/2016 —
2/28/2026
AVERAGE
ANNUAL TOTAL RETURNS (%) Period
Ended February 28, 2026
|
|
|
|
|
|
1
Year |
5
Year |
10
Year |
|
Class
R6 |
4.05
|
1.30
|
2.83
|
|
Bloomberg
Municipal Bond Index |
4.96
|
1.44
|
2.43
|
|
Bloomberg
Municipal Bond California Exempt Index |
4.98
|
1.45
|
2.37
|
Fund
performance figures may reflect fee waivers and/or expense reimbursements, without which the performance would have been lower.
The
Fund began offering Class R6 shares on 8/1/2017. Returns for periods before 8/1/2017, are based on the Fund’s Advisor Class performance,
which has been adjusted to take into account differences in class-specific operating expenses and maximum sales charges.
For periods after the share class offering, performance for the specific share class is used, reflecting the applicable expenses and
maximum sales charges.
For current month-end performance,
please call Franklin Templeton at (800)
DIAL BEN/342-5236 or visit
https://www.franklintempleton.com/investments/options/mutual-funds.
Important data provider notices
and terms available at www.franklintempletondatasources.com.
KEY
FUND STATISTICS (as
of February 28, 2026)
|
|
|
Total
Net Assets |
$3,281,260,262
|
|
Total
Number of Portfolio Holdings |
745
|
|
Total
Management Fee Paid |
$13,902,397
|
|
Portfolio
Turnover Rate |
13.89%
|
| Franklin
California High Yield Municipal Fund |
PAGE
2 |
8175-ATSR-0426 |
Portfolio Composition*
(% of Total Investments)
| * |
Does
not include derivatives, except purchased options, if any. |
|
|
|
|
WHERE
CAN I FIND ADDITIONAL INFORMATION ABOUT THE FUND? |
|
Additional
information is available on https://www.franklintempleton.com/regulatory-fund-documents,
including its: |
|
•
prospectus • proxy voting information • financial information • holdings • tax information |
HOUSEHOLDING
You
will receive the Fund’s shareholder reports every six months. In addition, you will receive an annual updated summary prospectus
(detail prospectus available
upon request). To reduce Fund expenses, we try to identify related shareholders in a household and send only
one copy of the shareholder reports and summary prospectus. This process, called “householding,” will continue indefinitely
unless you instruct us otherwise.
If you prefer not to have these documents householded, please call us at (800)
DIAL BEN/342-5236. At any time,
you may view current prospectuses/summary prospectuses and shareholder reports on our website. If you choose, you may
receive these documents through electronic delivery.
| Franklin
California High Yield Municipal Fund |
PAGE
3 |
8175-ATSR-0426 |
1000010118104861095112351123631246711376120751267513188100001002510276107001171311837117591115911764121121271310000999710259106541169311763116761112411738120421264222.920.512.910.89.28.16.34.32.01.50.70.50.3
|
|
|
|
Franklin
California High Yield Municipal Fund |
|
|
Advisor
Class [FVCAX]
|
|
Annual
Shareholder Report | February
28, 2026 |
|
|
This
annual
shareholder report
contains important information about Franklin
California High Yield Municipal Fund for the period March
1, 2025, to February
28, 2026.
You
can find additional information about the Fund at https://www.franklintempleton.com/regulatory-fund-documents.
You can also request this information
by contacting us at (800)
DIAL BEN/342-5236.
|
|
|
|
Class
Name |
Costs
of a $10,000 investment
|
Costs
paid as a percentage of a $10,000
investment |
|
Advisor
Class |
$57
|
%
|
HOW
DID THE FUND PERFORM LAST YEAR AND WHAT AFFECTED ITS PERFORMANCE?
For the twelve months ended February
28, 2026, Advisor Class shares
of Franklin California High Yield Municipal Fund returned 4.00%.
The Fund compares its performance
to the Bloomberg Municipal Bond California Exempt Index, which returned 4.98% for the same period.
|
|
|
Top
contributors to performance: |
|
↑
|
Selection
in bonds with no external credit rating |
|
↑
|
Underweight
to bonds with 30 years to maturity |
|
↑
|
Selection
in B rated bonds |
|
|
|
Top
detractors from performance: |
|
↓
|
Overweight
to bonds with no external credit rating |
|
↓
|
Overweight
to bonds with 20 years to maturity |
|
↓
|
Underweight
bonds with 5 years or less to maturity |
| Franklin
California High Yield Municipal Fund |
PAGE
1 |
675-ATSR-0426 |
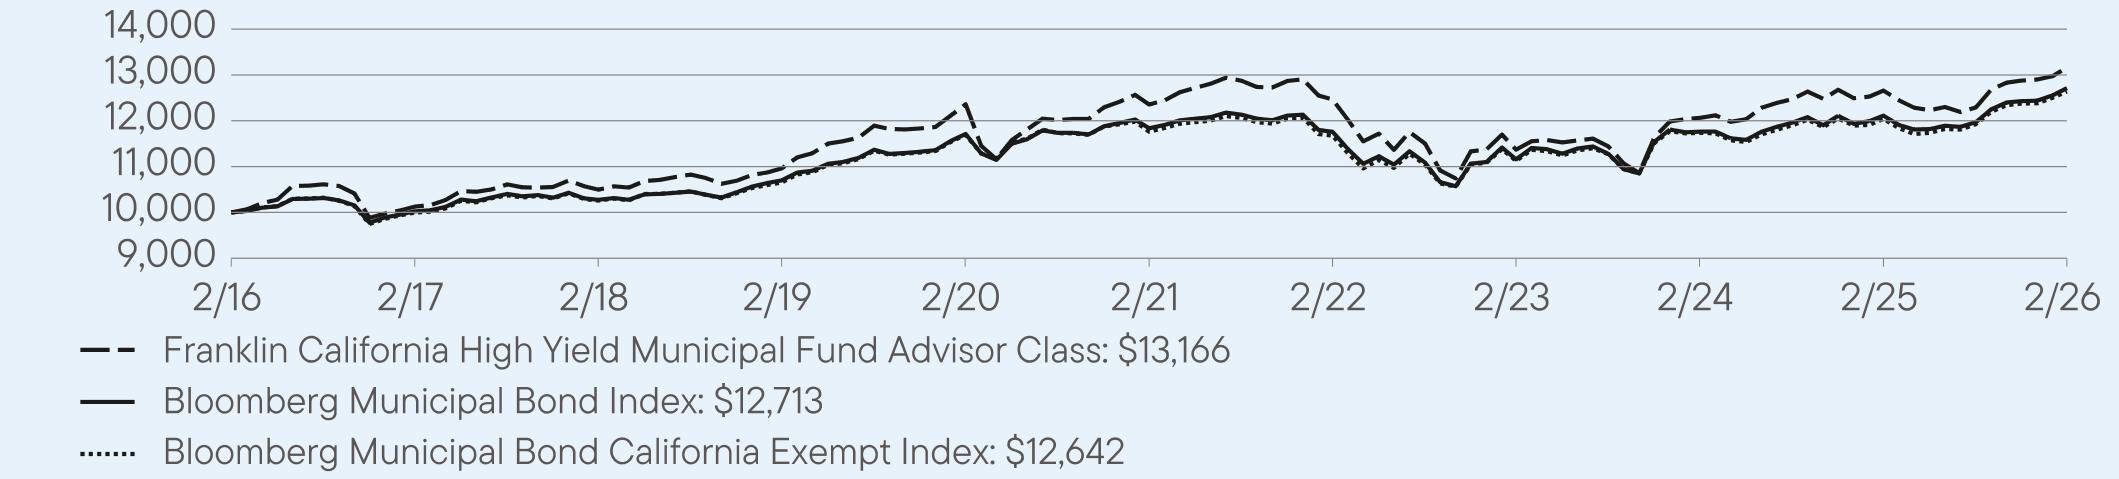
HOW
DID THE FUND PERFORM OVER THE LAST 10 YEARS?
The
Fund’s past performance is not necessarily an indication of how the Fund will perform in the future. The
graph and table do not reflect
the deduction of taxes that a shareholder would pay on Fund distributions or redemption of Fund shares.
VALUE
OF A $10,000
INVESTMENT – Advisor
Class 2/29/2016
— 2/28/2026
AVERAGE
ANNUAL TOTAL RETURNS (%) Period
Ended February 28, 2026
|
|
|
|
|
|
1
Year |
5
Year |
10
Year |
|
Advisor
Class |
4.00
|
1.28
|
2.79
|
|
Bloomberg
Municipal Bond Index |
4.96
|
1.44
|
2.43
|
|
Bloomberg
Municipal Bond California Exempt Index |
4.98
|
1.45
|
2.37
|
Fund
performance figures may reflect fee waivers and/or expense reimbursements, without which the performance would have been lower.
For current month-end performance,
please call Franklin Templeton at (800)
DIAL BEN/342-5236 or visit
https://www.franklintempleton.com/investments/options/mutual-funds.
Important data provider notices
and terms available at www.franklintempletondatasources.com.
KEY
FUND STATISTICS (as
of February 28, 2026)
|
|
|
Total
Net Assets |
$3,281,260,262
|
|
Total
Number of Portfolio Holdings |
745
|
|
Total
Management Fee Paid |
$13,902,397
|
|
Portfolio
Turnover Rate |
13.89%
|
Portfolio Composition*
(% of Total Investments)
| * |
Does
not include derivatives, except purchased options, if any. |
| Franklin
California High Yield Municipal Fund |
PAGE
2 |
675-ATSR-0426 |
|
|
|
|
WHERE
CAN I FIND ADDITIONAL INFORMATION ABOUT THE FUND? |
|
Additional
information is available on https://www.franklintempleton.com/regulatory-fund-documents,
including its: |
|
•
prospectus • proxy voting information • financial information • holdings • tax information |
HOUSEHOLDING
You
will receive the Fund’s shareholder reports every six months. In addition, you will receive an annual updated summary prospectus
(detail prospectus available
upon request). To reduce Fund expenses, we try to identify related shareholders in a household and send only
one copy of the shareholder reports and summary prospectus. This process, called “householding,” will continue indefinitely
unless you instruct us otherwise.
If you prefer not to have these documents householded, please call us at (800)
DIAL BEN/342-5236. At any time,
you may view current prospectuses/summary prospectuses and shareholder reports on our website. If you choose, you may
receive these documents through electronic delivery.
| Franklin
California High Yield Municipal Fund |
PAGE
3 |
675-ATSR-0426 |
1000010127104971096112360123561246711370120641265913166100001002510276107001171311837117591115911764121121271310000999710259106541169311763116761112411738120421264222.920.512.910.89.28.16.34.32.01.50.70.50.3
(b) Not applicable
(a) The Registrant has adopted a code of ethics that applies
to its principal executive officers and principal financial and accounting officer.
(c) N/A
(d) N/A
(f) Pursuant to Item 19(a) (1), the Registrant is attaching as an exhibit a copy of its code of ethics that applies to its principal executive officers and principal financial and accounting officer
| ITEM 3. |
AUDIT COMMITTEE FINANCIAL EXPERT. |
The Board of Trustees of the Registrant
has determined that Mary C. Choksi, possesses the technical attributes identified in Item 3 to Form N-CSR to qualify as an “audit
committee financial expert,” and has designated Mary C. Choksi as the Audit Committee’s financial expert. Mary C. Choksi is
an “independent” Trustee pursuant to paragraph (a)(2) of Item 3 to Form N-CSR.
Under applicable securities laws, a person
determined to be an audit committee financial expert will not be deemed an “expert” for any purpose, including without limitation
for the purposes of Section 11 of the Securities Act of 1933, as a result of being designated or identified as an audit committee financial
expert. The designation or identification of a person as an audit committee financial expert does not impose on such person any duties,
obligations, or liabilities greater than the duties, obligations, and liabilities imposed on such person as a member of the audit committee
and board of directors in the absence of such designation or identification. The designation or identification of a person as an audit
committee financial expert does not affect the duties, obligations, or liability of any other member of the audit committee or board of
directors.
|
ITEM 4. |
PRINCIPAL ACCOUNTANT FEES AND SERVICES. |
a) Audit Fees.
The aggregate fees billed in the last two fiscal years ending February 28, 2025 and February 28, 2026 (the “Reporting Periods”)
for professional services rendered by the Registrant’s principal accountant (the “Auditor”) for the audit of the Registrant’s
annual financial statements, or services that are normally provided by the Auditor in connection with the statutory and regulatory filings
or engagements for the Reporting Periods, were $50,486 in February 28, 2025 and $48,542 in February 28, 2026.
b) Audit-Related
Fees. The aggregate fees billed in the Reporting Periods for assurance and related services by the Auditor that are reasonably
related to the performance of the Registrant’s financial statements were $0 in February 28, 2025 and $0 in February 28, 2026.
(c) Tax Fees.
The aggregate fees billed in the Reporting Periods for professional services rendered by the Auditor for tax compliance, tax advice and
tax planning (“Tax Services”) were $10,000 in February 28, 2025 and $10,000 in February 28, 2026. These services consisted
of (i) review or preparation of U.S. federal, state, local and excise tax returns; (ii) U.S. federal, state and local tax planning, advice
and assistance regarding statutory, regulatory or administrative developments, and (iii) tax advice regarding tax qualification matters
and/or treatment of various financial instruments held or proposed to be acquired or held.
There were no fees billed for tax services by the Registrant’s
investment adviser and any entity controlling, controlled by, or under common control with the investment adviser that provides ongoing
services to the Registrant (“Service Affiliates”) during the Reporting Periods that required pre-approval by the Audit Committee.
(d) All Other Fees.
The aggregate fees billed in the Reporting Periods for products and services provided by the Auditor to the Registrant, other than the
services reported in paragraphs (a) through (c) of this item, were $0 in February 28, 2025 and $0
in February 28, 2026.
There were no other non-audit services rendered by the Auditor
to the Service Affiliates requiring pre-approval by the Audit Committee in the Reporting Periods.
(e) Audit Committee’s pre–approval policies and
procedures described in paragraph (c) (7) of Rule 2-01 of Regulation S-X.
(1) The Registrant’s Audit Committee is directly responsible
for approving the services to be provided by the Auditors, including:
(i) pre-approval of all audit and audit
related services;
(ii) pre-approval of all non-audit related
services to be provided to the Registrant by the Auditors;
(iii) pre-approval of all non-audit related
services to be provided by the Auditors to the Registrant and the Service Affiliates where the non-audit services relate directly to the
operations or financial reporting of the Registrant; and
(iv) establishment by the Audit Committee,
if deemed necessary or appropriate, as an alternative to committee pre-approval of services to be provided by the Auditors, as required
by paragraphs (ii) and (iii) above, of policies and procedures to permit such services to be pre-approved by other means, such as through
establishment of guidelines or by action of a designated member or members of the committee; provided the policies and procedures are
detailed as to the particular service and the committee is informed of each service and such policies and procedures do not include delegation
of Audit Committee responsibilities, as contemplated under the Securities Exchange Act of 1934, to management; subject, in the case of
(ii) through (iv), to any waivers, exceptions or exemptions that may be available under applicable law or rules.
(2) None of the services described in paragraphs (b) through
(d) of this Item were performed in reliance on paragraph (c)(7)(i)(C) of Rule 2-01 of Regulation S-X.
(f) Not applicable.
(g) Non-audit fees billed by the Auditor for services rendered
to the Registrant and the Service Affiliates during the reporting period were $489,326 in February 28, 2025 and $1,690,011 in February
28, 2026.
(h) Yes. The Registrant’s Audit Committee has considered
whether the provision of non-audit services that were rendered to Service Affiliates, which were not pre-approved (not requiring pre-approval),
is compatible with maintaining the Auditor’s independence. All services provided by the Auditor to the Registrant or to the Service
Affiliates, which were required to be pre-approved, were pre-approved as required.
(i) Not applicable.
(j) Not applicable.
| ITEM 5. |
AUDIT COMMITTEE OF LISTED REGISTRANTS. |
Not applicable.
| ITEM 6. |
SCHEDULE OF INVESTMENTS. |
|
(a) |
Please see schedule of investments contained in the Financial Statements and Financial
Highlights included under Item 7 of this Form N-CSR. |
|
ITEM 7. |
FINANCIAL STATEMENTS AND FINANCIAL HIGHLIGHTS FOR OPEN-END MANAGEMENT INVESTMENT COMPANIES. |
Franklin
California
High
Yield
Municipal
Fund
Financial
Statements
and
Other
Important
Information
Annual
|
February
28,
2026
If
you
need
assistance
accessing
this
content,
please
reach
out
to
your
sales
representative
or
send
an
email
to
accessibility@franklintempleton.com
.
Financial
Statements
and
Other
Important
Information—Annual
Financial
Highlights
and
Schedule
of
Investments
2
Financial
Statements
29
Notes
to
Financial
Statements
33
Report
of
Independent
Registered
Public
Accounting
Firm
42
Tax
Information
43
Changes
In
and
Disagreements
with
Accountants
44
Results
of
Meeting(s)
of
Shareholders
44
Remuneration
Paid
to
Directors,
Officers
and
Others
44
Board
Approval
of
Management
and
Subadvisory
Agreements
44
Franklin
Municipal
Securities
Trust
Financial
Highlights
Franklin
California
High
Yield
Municipal
Fund
Annual
Report
The
accompanying
notes
are
an
integral
part
of
these
financial
statements.
a
Year
Ended
February
28,
Year
Ended
February
28,
2022
b
Year
Ended
May
31,
2021
2026
2025
2024
a
2023
Class
A
Per
share
operating
performance
(for
a
share
outstanding
throughout
the
year)
Net
asset
value,
beginning
of
year
.......
$9.91
$9.85
$9.69
$11.02
$11.49
$10.81
Income
from
investment
operations
c
:
Net
investment
income
d
.............
0.41
0.39
0.39
0.36
0.26
0.35
Net
realized
and
unrealized
gains
(losses)
(0.06)
0.06
0.16
(1.35)
(0.49)
0.67
Total
from
investment
operations
........
0.35
0.45
0.55
(0.99)
(0.23)
1.02
Less
distributions
from:
Net
investment
income
..............
(0.40)
(0.39)
(0.39)
(0.34)
(0.24)
(0.34)
Net
asset
value,
end
of
year
...........
$9.86
$9.91
$9.85
$9.69
$11.02
$11.49
Total
return
e
.......................
3.74%
4.67%
5.85%
(9.03)%
(2.09)%
9.57%
Ratios
to
average
net
assets
f
Expenses
.........................
0.81%
0.80%
g
0.84%
g
0.88%
g
0.81%
g
0.79%
g
Net
investment
income
...............
4.21%
3.98%
4.10%
3.63%
2.88%
3.10%
Supplemental
data
Net
assets,
end
of
year
(000’s)
.........
$1,168,018
$981,536
$710,549
$595,614
$714,052
$618,967
Portfolio
turnover
rate
................
13.89%
10.33%
10.93%
18.77%
10.19%
9.20%
a
For
the
year
ended
February
29.
b
For
the
period
June
1,
2021
to
February
28,
2022.
c
The
amount
shown
for
a
share
outstanding
throughout
the
period
may
not
correlate
with
the
Statement
of
Operations
for
the
period
due
to
the
timing
of
sales
and
repurchases
of
the
Fund’s
shares
in
relation
to
income
earned
and/or
fluctuating
fair
value
of
the
investments
of
the
Fund.
d
Based
on
average
daily
shares
outstanding.
e
Total
return
does
not
reflect
sales
commissions
or
contingent
deferred
sales
charges,
if
applicable,
and
is
not
annualized
for
periods
less
than
one
year.
f
Ratios
are
annualized
for
periods
less
than
one
year.
g
Benefit
of
expense
reduction
rounds
to
less
than
0.01%.
Franklin
Municipal
Securities
Trust
Financial
Highlights
Franklin
California
High
Yield
Municipal
Fund
(continued)
The
accompanying
notes
are
an
integral
part
of
these
financial
statements.
Annual
Report
a
Year
Ended
February
28,
Year
Ended
February
28,
2022
b
Year
Ended
May
31,
2021
2026
2025
2024
a
2023
Class
A1
Per
share
operating
performance
(for
a
share
outstanding
throughout
the
year)
Net
asset
value,
beginning
of
year
.......
$9.89
$9.83
$9.67
$10.99
$11.47
$10.79
Income
from
investment
operations
c
:
Net
investment
income
d
.............
0.42
0.41
0.41
0.38
0.26
0.37
Net
realized
and
unrealized
gains
(losses)
(0.05)
0.06
0.15
(1.35)
(0.49)
0.67
Total
from
investment
operations
........
0.37
0.47
0.56
(0.97)
(0.23)
1.04
Less
distributions
from:
Net
investment
income
..............
(0.42)
(0.41)
(0.40)
(0.35)
(0.25)
(0.36)
Net
asset
value,
end
of
year
...........
$9.84
$9.89
$9.83
$9.67
$10.99
$11.47
Total
return
e
.......................
3.91%
4.84%
6.02%
(8.83)%
(2.07)%
9.76%
Ratios
to
average
net
assets
f
Expenses
.........................
0.66%
0.65%
g
0.69%
g
0.72%
g
0.66%
g
0.64%
g
Net
investment
income
...............
4.37%
4.13%
4.25%
3.78%
3.04%
3.27%
Supplemental
data
Net
assets,
end
of
year
(000’s)
.........
$662,265
$712,086
$776,199
$862,312
$1,166,095
$1,254,701
Portfolio
turnover
rate
................
13.89%
10.33%
10.93%
18.77%
10.19%
9.20%
a
For
the
year
ended
February
29.
b
For
the
period
June
1,
2021
to
February
28,
2022.
c
The
amount
shown
for
a
share
outstanding
throughout
the
period
may
not
correlate
with
the
Statement
of
Operations
for
the
period
due
to
the
timing
of
sales
and
repurchases
of
the
Fund’s
shares
in
relation
to
income
earned
and/or
fluctuating
fair
value
of
the
investments
of
the
Fund.
d
Based
on
average
daily
shares
outstanding.
e
Total
return
does
not
reflect
sales
commissions
or
contingent
deferred
sales
charges,
if
applicable,
and
is
not
annualized
for
periods
less
than
one
year.
f
Ratios
are
annualized
for
periods
less
than
one
year.
g
Benefit
of
expense
reduction
rounds
to
less
than
0.01%.
Franklin
Municipal
Securities
Trust
Financial
Highlights
Franklin
California
High
Yield
Municipal
Fund
(continued)
Annual
Report
The
accompanying
notes
are
an
integral
part
of
these
financial
statements.
a
Year
Ended
February
28,
Year
Ended
February
28,
2022
b
Year
Ended
May
31,
2021
2026
2025
2024
a
2023
Class
C
Per
share
operating
performance
(for
a
share
outstanding
throughout
the
year)
Net
asset
value,
beginning
of
year
.......
$9.97
$9.91
$9.75
$11.08
$11.56
$10.87
Income
from
investment
operations
c
:
Net
investment
income
d
.............
0.37
0.35
0.36
0.32
0.21
0.30
Net
realized
and
unrealized
gains
(losses)
(0.07)
0.06
0.15
(1.35)
(0.49)
0.69
Total
from
investment
operations
........
0.30
0.41
0.51
(1.03)
(0.28)
0.99
Less
distributions
from:
Net
investment
income
..............
(0.36)
(0.35)
(0.35)
(0.30)
(0.20)
(0.30)
Net
asset
value,
end
of
year
...........
$9.91
$9.97
$9.91
$9.75
$11.08
$11.56
Total
return
e
.......................
3.20%
4.22%
5.39%
(9.35)%
(2.46)%
9.18%
Ratios
to
average
net
assets
f
Expenses
.........................
1.20%
1.20%
g
1.23%
g
1.27%
g
1.20%
g
1.19%
g
Net
investment
income
...............
3.78%
3.54%
3.66%
3.19%
2.47%
2.69%
Supplemental
data
Net
assets,
end
of
year
(000’s)
.........
$73,036
$85,107
$92,877
$118,149
$180,173
$223,652
Portfolio
turnover
rate
................
13.89%
10.33%
10.93%
18.77%
10.19%
9.20%
a
For
the
year
ended
February
29.
b
For
the
period
June
1,
2021
to
February
28,
2022.
c
The
amount
shown
for
a
share
outstanding
throughout
the
period
may
not
correlate
with
the
Statement
of
Operations
for
the
period
due
to
the
timing
of
sales
and
repurchases
of
the
Fund’s
shares
in
relation
to
income
earned
and/or
fluctuating
fair
value
of
the
investments
of
the
Fund.
d
Based
on
average
daily
shares
outstanding.
e
Total
return
does
not
reflect
sales
commissions
or
contingent
deferred
sales
charges,
if
applicable,
and
is
not
annualized
for
periods
less
than
one
year.
f
Ratios
are
annualized
for
periods
less
than
one
year.
g
Benefit
of
expense
reduction
rounds
to
less
than
0.01%.
Franklin
Municipal
Securities
Trust
Financial
Highlights
Franklin
California
High
Yield
Municipal
Fund
(continued)
The
accompanying
notes
are
an
integral
part
of
these
financial
statements.
Annual
Report
a
Year
Ended
February
28,
Year
Ended
February
28,
2022
b
Year
Ended
May
31,
2021
2026
2025
2024
a
2023
Class
R6
Per
share
operating
performance
(for
a
share
outstanding
throughout
the
year)
Net
asset
value,
beginning
of
year
.......
$9.93
$9.86
$9.70
$11.03
$11.51
$10.82
Income
from
investment
operations
c
:
Net
investment
income
d
.............
0.43
0.42
0.42
0.39
0.27
0.38
Net
realized
and
unrealized
gains
(losses)
(0.06)
0.07
0.16
(1.35)
(0.49)
0.68
Total
from
investment
operations
........
0.37
0.49
0.58
(0.96)
(0.22)
1.06
Less
distributions
from:
Net
investment
income
..............
(0.43)
(0.42)
(0.42)
(0.37)
(0.26)
(0.37)
Net
asset
value,
end
of
year
...........
$9.87
$9.93
$9.86
$9.70
$11.03
$11.51
Total
return
e
.......................
4.05%
4.97%
6.14%
(8.76)%
(1.96)%
9.97%
Ratios
to
average
net
assets
f
Expenses
before
waiver
and
payments
by
affiliates
.........................
0.51%
0.51%
0.55%
0.58%
0.53%
0.52%
Expenses
net
of
waiver
and
payments
by
affiliates
.........................
0.51%
0.51%
g
0.55%
g
0.58%
g,h
0.52%
g
0.51%
g
Net
investment
income
...............
4.50%
4.26%
4.38%
3.91%
3.16%
3.37%
Supplemental
data
Net
assets,
end
of
year
(000’s)
.........
$77,623
$65,877
$50,713
$44,724
$60,366
$45,216
Portfolio
turnover
rate
................
13.89%
10.33%
10.93%
18.77%
10.19%
9.20%
a
For
the
year
ended
February
29.
b
For
the
period
June
1,
2021
to
February
28,
2022.
c
The
amount
shown
for
a
share
outstanding
throughout
the
period
may
not
correlate
with
the
Statement
of
Operations
for
the
period
due
to
the
timing
of
sales
and
repurchases
of
the
Fund’s
shares
in
relation
to
income
earned
and/or
fluctuating
fair
value
of
the
investments
of
the
Fund.
d
Based
on
average
daily
shares
outstanding.
e
Total
return
is
not
annualized
for
periods
less
than
one
year.
f
Ratios
are
annualized
for
periods
less
than
one
year.
g
Benefit
of
expense
reduction
rounds
to
less
than
0.01%.
h
Benefit
of
waiver
and
payments
by
affiliates
rounds
to
less
than
0.01%.
Franklin
Municipal
Securities
Trust
Financial
Highlights
Franklin
California
High
Yield
Municipal
Fund
(continued)
Annual
Report
The
accompanying
notes
are
an
integral
part
of
these
financial
statements.
a
Year
Ended
February
28,
Year
Ended
February
28,
2022
b
Year
Ended
May
31,
2021
2026
2025
2024
a
2023
Advisor
Class
Per
share
operating
performance
(for
a
share
outstanding
throughout
the
year)
Net
asset
value,
beginning
of
year
.......
$9.91
$9.85
$9.69
$11.02
$11.50
$10.82
Income
from
investment
operations
c
:
Net
investment
income
d
.............
0.43
0.42
0.42
0.39
0.27
0.38
Net
realized
and
unrealized
gains
(losses)
(0.05)
0.06
0.15
(1.36)
(0.49)
0.67
Total
from
investment
operations
........
0.38
0.48
0.57
(0.97)
(0.22)
1.05
Less
distributions
from:
Net
investment
income
..............
(0.43)
(0.42)
(0.41)
(0.36)
(0.26)
(0.37)
Net
asset
value,
end
of
year
...........
$9.86
$9.91
$9.85
$9.69
$11.02
$11.50
Total
return
e
.......................
4.00%
4.93%
6.11%
(8.80)%
(1.99)%
9.84%
Ratios
to
average
net
assets
f
Expenses
.........................
0.56%
0.55%
g
0.59%
g
0.62%
g
0.56%
g
0.54%
g
Net
investment
income
...............
4.46%
4.22%
4.34%
3.87%
3.13%
3.35%
Supplemental
data
Net
assets,
end
of
year
(000’s)
.........
$1,300,318
$1,185,778
$914,542
$922,275
$1,186,382
$1,113,278
Portfolio
turnover
rate
................
13.89%
10.33%
10.93%
18.77%
10.19%
9.20%
a
For
the
year
ended
February
29.
b
For
the
period
June
1,
2021
to
February
28,
2022.
c
The
amount
shown
for
a
share
outstanding
throughout
the
period
may
not
correlate
with
the
Statement
of
Operations
for
the
period
due
to
the
timing
of
sales
and
repurchases
of
the
Fund’s
shares
in
relation
to
income
earned
and/or
fluctuating
fair
value
of
the
investments
of
the
Fund.
d
Based
on
average
daily
shares
outstanding.
e
Total
return
is
not
annualized
for
periods
less
than
one
year.
f
Ratios
are
annualized
for
periods
less
than
one
year.
g
Benefit
of
expense
reduction
rounds
to
less
than
0.01%.
Franklin
Municipal
Securities
Trust
Schedule
of
Investments,
February
28,
2026
Franklin
California
High
Yield
Municipal
Fund
The
accompanying
notes
are
an
integral
part
of
these
financial
statements.
Annual
Report
a
a
Shares
a
Value
a
Common
Stocks
0.0%
Financial
Services
0.0%
a,b
Brightline
Train
Holdings
West
LLC
......................................
86,700
$
—
b
Independent
Power
and
Renewable
Electricity
Producers
0.0%
a,b
AES
Guayama
Holdings
BV
...........................................
60,804
—
b
Total
Common
Stocks
(Cost
$
–
)
...............................................
—
Principal
Amount
a
a
a
a
Corporate
Bonds
2.1%
Commercial
Services
&
Supplies
0.5%
a
,c
CalPlant
I
LLC
,
Senior
Secured
Note
,
144A,
15
%
,
2/28/27
...............................
$
4,195,000
4,195,000
d
21
A
,
Senior
Secured
Note
,
144A,
9.5
%
,
9/30/23
..........................
1,370,000
178,100
d
21
B
,
Senior
Secured
Note
,
144A,
9.5
%
,
9/30/23
..........................
5,220,000
678,600
d
22
A
,
Senior
Secured
Note
,
144A,
9.5
%
,
9/30/23
..........................
2,875,000
373,750
d
22
B
,
Senior
Secured
Note
,
144A,
9.5
%
,
9/30/23
..........................
250,000
32,500
d
22
C
,
Senior
Secured
Note
,
144A,
9.5
%
,
8/31/23
..........................
1,885,000
1,885,000
d
22
X
,
Senior
Secured
Note
,
144A,
9.5
%
,
8/31/23
..........................
2,830,000
2,830,000
d
23
A
,
Senior
Secured
Note
,
144A,
9.5
%
,
8/31/23
..........................
1,000,000
1,000,000
d
23
B
,
Senior
Secured
Note
,
144A,
9.5
%
,
8/31/23
..........................
890,000
890,000
d
23
C
,
Senior
Secured
Note
,
144A,
9.5
%
,
8/31/23
..........................
1,415,000
1,415,000
d
23
D
,
Senior
Secured
Note
,
144A,
9.5
%
,
8/31/23
..........................
1,230,000
1,230,000
d
23
E
,
Senior
Secured
Note
,
144A,
9.5
%
,
8/31/23
..........................
1,385,000
1,385,000
16,092,950
Diversified
Consumer
Services
1.3%
Grand
Canyon
University
,
Secured
Note
,
5.125
%
,
10/01/28
....................
41,035,000
41,264,072
Electric
Utilities
0.3%
c
Mission
Rock
Utilities,
Inc.
,
144A,
7
%
,
7/01/27
..............................
9,600,000
9,715,012
Total
Corporate
Bonds
(Cost
$
75,139,634
)
......................................
67,072,034
Municipal
Bonds
95.2%
Arizona
0.4%
c
Maricopa
County
Industrial
Development
Authority
,
Grand
Canyon
University
Obligated
Group
,
Revenue
,
144A,
2024
,
7.375
%
,
10/01/29
..........................
13,640,000
14,726,987
California
88.3%
Alameda
Community
Facilities
District
,
City
of
Alameda
Community
Facilities
District
No.
22-1
,
Special
Tax
,
2023
,
5
%
,
9/01/38
........................................................
850,000
910,010
City
of
Alameda
Community
Facilities
District
No.
22-1
,
Special
Tax
,
2023
,
5
%
,
9/01/43
........................................................
1,000,000
1,042,784
City
of
Alameda
Community
Facilities
District
No.
22-1
,
Special
Tax
,
2023
,
5
%
,
9/01/53
........................................................
1,000,000
1,014,861
Bay
Area
Toll
Authority
,
Revenue
,
2025
F-1
,
Refunding
,
5
%
,
4/01/53
.............
1,785,000
1,905,497
Benicia
Unified
School
District
,
GO
,
2024
B
,
5
%
,
8/01/58
......................
7,000,000
7,431,213
Burbank-Glendale-Pasadena
Airport
Authority
Brick
Campaign
,
Revenue,
Senior
Lien
,
2024
B
,
AG
Insured
,
4.375
%
,
7/01/49
.................
5,000,000
4,903,751
Revenue,
Senior
Lien
,
2024
B
,
AG
Insured
,
4.5
%
,
7/01/54
...................
5,750,000
5,690,731
California
Community
Choice
Financing
Authority
,
e
Revenue
,
2021
B-1
,
Mandatory
Put
,
4
%
,
8/01/31
..........................
10,000,000
10,394,865
e
Revenue
,
2024
B
,
Mandatory
Put
,
5
%
,
12/01/32
...........................
10,000,000
10,574,368
e
Revenue
,
2024
D
,
Mandatory
Put
,
5
%
,
9/01/32
...........................
10,000,000
11,071,076
e
Revenue
,
2024
E
,
Mandatory
Put
,
5
%
,
9/01/32
............................
10,000,000
10,945,378
Franklin
Municipal
Securities
Trust
Schedule
of
Investments
Franklin
California
High
Yield
Municipal
Fund
(continued)
Annual
Report
The
accompanying
notes
are
an
integral
part
of
these
financial
statements.
a
a
Principal
Amount
a
Value
a
a
a
a
a
Municipal
Bonds
(continued)
California
(continued)
California
Community
Choice
Financing
Authority,
(continued)
e
Revenue
,
2025
C
,
Mandatory
Put
,
5
%
,
10/01/33
...........................
$
12,500,000
$
13,571,957
Revenue
,
2026
B
,
5
%
,
3/01/36
........................................
7,800,000
8,508,641
California
Community
College
Financing
Authority
,
c
NCCD-Napa
Valley
Properties
LLC
,
Revenue
,
144A,
2022
A
,
5.75
%
,
7/01/60
.....
30,295,000
20,977,406
c
NCCD-Napa
Valley
Properties
LLC
,
Revenue
,
144A,
2022
B
,
7.75
%
,
7/01/30
.....
2,405,000
2,399,429
c
NCCD-Napa
Valley
Properties
LLC
,
Revenue,
Sub.
Lien
,
144A,
2022
C
,
6.75
%
,
7/01/60
........................................................
7,050,000
5,076,087
NCCD-Orange
Coast
Properties
LLC
,
Revenue
,
2018
,
5.25
%
,
5/01/48
..........
225,000
227,844
NCCD-Orange
Coast
Properties
LLC
,
Revenue
,
2018
,
5.25
%
,
5/01/53
..........
7,785,000
7,860,182
c
California
Community
Housing
Agency
,
Annadel
Apartments
,
Revenue
,
144A,
2019
A
,
5
%
,
4/01/49
..................
27,050,000
21,956,001
Brio
Apartments
&
Next
on
Lex
Apartments
,
Revenue,
Sub.
Lien
,
144A,
2021
A-2
,
4
%
,
8/01/47
....................................................
9,265,000
7,482,411
Exchange
at
Bayfront
Apartments
,
Revenue,
Junior
Lien
,
144A,
2021
A-2
,
4
%
,
8/01/51
........................................................
13,000,000
5,846,025
Mira
Vista
Hills
Apartments
,
Revenue
,
144A,
2021
A
,
4
%
,
2/01/56
.............
18,800,000
9,274,119
Serenity
at
Larkspur
Apartments
,
Revenue
,
144A,
2020
A
,
5
%
,
2/01/50
.........
22,525,000
17,231,625
Summit
at
Sausalito
Apartments
,
Revenue
,
144A,
2021
A-2
,
4
%
,
2/01/50
........
10,000,000
7,557,629
Twin
Creek
Apartments
,
Revenue,
Junior
Lien
,
144A,
2022
B
,
5.5
%
,
2/01/40
.....
7,475,000
6,738,040
Verdant
at
Green
Valley
Apartments
,
Revenue
,
144A,
2019
A
,
5
%
,
8/01/49
.......
15,000,000
14,114,559
California
County
Tobacco
Securitization
Agency
,
Merced
County
Tobacco
Funding
Corp.
,
Revenue
,
2020
B
,
Refunding
,
5
%
,
6/01/50
3,000,000
2,830,607
f
Sonoma
County
Securitization
Corp.
,
Revenue
,
2020
B-2
,
Refunding
,
5.58
%,
6/01/55
10,000,000
2,039,822
California
Educational
Facilities
Authority
,
Art
Center
College
of
Design
,
Revenue
,
2018
A
,
Refunding
,
5
%
,
12/01/37
.......
1,265,000
1,309,543
Art
Center
College
of
Design
,
Revenue
,
2018
A
,
Refunding
,
5
%
,
12/01/38
.......
1,125,000
1,161,406
Art
Center
College
of
Design
,
Revenue
,
2018
A
,
Refunding
,
5
%
,
12/01/44
.......
10,375,000
10,507,088
Leland
Stanford
Junior
University
(The)
,
Revenue
,
T-1
,
5
%
,
3/15/39
............
4,185,000
5,287,221
Leland
Stanford
Junior
University
(The)
,
Revenue
,
U-3
,
5
%
,
6/01/43
............
5,815,000
7,167,866
g
University
of
Southern
California
,
Revenue
,
2025
A
,
5
%
,
10/01/55
.............
15,000,000
15,940,174
California
Enterprise
Development
Authority
,
Castilleja
School
Foundation
,
Revenue
,
2024
,
4
%
,
6/01/54
...................
10,000,000
9,252,132
c
Real
Journey
Academies
Obligated
Group
,
Revenue
,
144A,
2024
A
,
5
%
,
6/01/54
..
2,000,000
1,973,519
c
Rocklin
Academy
Obligated
Group
,
Revenue
,
144A,
2021
A
,
Refunding
,
4
%
,
6/01/36
250,000
251,245
c
Rocklin
Academy
Obligated
Group
,
Revenue
,
144A,
2021
A
,
Refunding
,
4
%
,
6/01/51
630,000
533,752
c
Rocklin
Academy
Obligated
Group
,
Revenue
,
144A,
2021
A
,
Refunding
,
4
%
,
6/01/61
845,000
693,519
c
Rocklin
Academy
Obligated
Group
,
Revenue
,
144A,
2024
,
5
%
,
6/01/54
.........
1,400,000
1,384,255
c
Rocklin
Academy
Obligated
Group
,
Revenue
,
144A,
2024
,
5
%
,
6/01/64
.........
1,350,000
1,309,505
California
Health
Facilities
Financing
Authority
,
Adventist
Health
System/West
Obligated
Group
,
Revenue
,
2016
A
,
Refunding
,
4
%
,
3/01/39
........................................................
8,190,000
8,189,827
Adventist
Health
System/West
Obligated
Group
,
Revenue
,
2024
A
,
5.25
%
,
12/01/43
4,980,000
5,384,354
Adventist
Health
System/West
Obligated
Group
,
Revenue
,
2024
A
,
5.25
%
,
12/01/44
4,720,000
5,041,969
Children's
Hospital
Los
Angeles
Obligated
Group
,
Revenue
,
2017
A
,
Refunding
,
4
%
,
8/15/49
........................................................
3,375,000
2,834,237
CommonSpirit
Health
Obligated
Group
,
Revenue
,
2024
A
,
5.25
%
,
12/01/49
......
10,775,000
11,519,725
CommonSpirit
Health
Obligated
Group
,
Revenue
,
2024
A
,
5
%
,
12/01/54
.........
5,225,000
5,440,476
El
Camino
Hospital
LP
,
Revenue
,
2017
,
4
%
,
2/01/42
.......................
6,500,000
6,535,797
El
Camino
Hospital
LP
,
Revenue
,
2017
,
5
%
,
2/01/42
.......................
5,000,000
5,098,014
Kaiser
Foundation
Hospitals
,
Revenue
,
2017
A-2
,
5
%
,
11/01/47
...............
21,565,000
24,313,151
Kaiser
Foundation
Hospitals
,
Revenue
,
A-2
,
BAM
Insured
,
5
%
,
11/01/47
........
10,000,000
11,573,026
Sutter
Health
Obligated
Group
,
Revenue
,
2018
A
,
5
%
,
11/15/48
...............
12,485,000
12,628,912
California
Housing
Finance
Agency
,
Revenue
,
2019-2
,
A
,
4
%
,
3/20/33
......................................
47,610
49,593
Franklin
Municipal
Securities
Trust
Schedule
of
Investments
Franklin
California
High
Yield
Municipal
Fund
(continued)
The
accompanying
notes
are
an
integral
part
of
these
financial
statements.
Annual
Report
a
a
Principal
Amount
a
Value
a
a
a
a
a
Municipal
Bonds
(continued)
California
(continued)
California
Housing
Finance
Agency,
(continued)
c,e
300
De
Haro
Venture
LP
,
Revenue
,
144A,
2025
P-S
,
Mandatory
Put
,
8
%
,
1/01/44
.
$
16,970,000
$
17,289,739
c
Redwood
Gardens
Renewal
LP
,
Revenue
,
144A,
2021
N-S
,
4
%
,
3/01/37
........
3,165,000
2,875,472
c,e
Shermanair
Apartments
Owner
LP
,
Revenue
,
144A,
2021
Q-S
,
Mandatory
Put
,
4.5
%
,
9/01/36
........................................................
4,000,000
3,690,911
California
Infrastructure
&
Economic
Development
Bank
,
c,e
Desertxpress
Enterprises
LLC
,
Revenue
,
144A,
2025
B
,
Refunding
,
Mandatory
Put
,
12
%
,
11/02/26
...................................................
3,745,000
2,022,300
Equitable
School
Revolving
Fund
LLC
Obligated
Group
,
Revenue
,
2024
B
,
5
%
,
11/01/49
.......................................................
250,000
260,532
Equitable
School
Revolving
Fund
LLC
Obligated
Group
,
Revenue
,
2024
B
,
5
%
,
11/01/54
.......................................................
3,000,000
3,092,372
Equitable
School
Revolving
Fund
LLC
Obligated
Group
,
Revenue
,
2024
B
,
5
%
,
11/01/59
.......................................................
1,000,000
1,026,781
c
Goodwill
Industries
of
Sacramento
Valley
&
Northern
Nevada,
Inc.
,
Revenue
,
144A,
2016
A
,
5
%
,
1/01/47
..............................................
10,360,000
8,143,109
c
La
Scuola
International
School
,
Revenue
,
144A,
2024
,
5
%
,
7/01/44
............
1,375,000
1,374,296
c
La
Scuola
International
School
,
Revenue
,
144A,
2024
,
5.125
%
,
7/01/54
.........
1,630,000
1,540,522
c
La
Scuola
International
School
,
Revenue
,
144A,
2024
,
5.25
%
,
7/01/64
..........
3,075,000
2,905,465
Roseville
Sustainable
Energy
Partner
LLC
,
Revenue
,
2024
A
,
5.25
%
,
7/01/49
....
6,000,000
6,166,592
c
WFCS
Holdings
II
LLC
,
Revenue
,
144A,
2021
A-1
,
5
%
,
1/01/56
...............
1,600,000
1,403,206
c
WFCS
Holdings
LLC
,
Revenue
,
144A,
2020
A-1
,
5
%
,
1/01/55
.................
2,300,000
2,038,878
California
Municipal
Finance
Authority
,
a
8
%
,
12/01/42
.....................................................
8,300,000
8,398,643
c,e
Revenue
,
144A,
2023
B-1
,
Mandatory
Put
,
7
%
,
4/01/33
.....................
20,770,000
20,753,590
c,e
Revenue
,
144A,
2023
B-2
,
Mandatory
Put
,
7
%
,
4/01/33
.....................
13,825,000
13,776,086
c,e
Revenue
,
144A,
2025
A-S
,
Mandatory
Put
,
8.125
%
,
8/01/44
..................
3,300,000
3,330,776
c
Revenue
,
144A,
2025
B
,
7.375
%
,
8/01/37
...............................
7,900,000
8,336,655
Revenue
,
2025
B
,
7.1
%
,
12/01/37
.....................................
3,875,000
3,979,349
c
Revenue
,
144A,
2023
,
II
,
7
%
,
7/01/51
..................................
12,655,000
12,417,685
c,h
Revenue,
Sub.
Lien
,
144A,
FRN
,
2025-1
,
B
,
3.537
%
,
6/20/49
.................
4,500,000
2,879,330
Special
Tax
,
2024
D
,
5
%
,
9/01/54
......................................
1,000,000
1,008,621
Special
Tax
,
2025
B
,
5.125
%
,
9/01/55
..................................
1,825,000
1,853,485
Special
Tax
,
2025
D
,
5
%
,
9/01/45
......................................
950,000
979,190
Special
Tax
,
2025
D
,
5
%
,
9/01/50
......................................
1,455,000
1,468,621
d
1717
University
Associates
LLC
,
Revenue
,
2020
A-S
,
9
%
,
9/01/57
.............
1,175,000
875,313
c,e
4252
Crenshaw
Preservation
LLC
,
Revenue
,
144A,
2025
B-1
,
Mandatory
Put
,
7.5
%
,
6/01/36
........................................................
5,715,000
5,645,698
c,e
4252
Crenshaw
Preservation
LLC
,
Revenue
,
144A,
2025
B-2
,
Mandatory
Put
,
9
%
,
6/01/36
........................................................
1,835,000
1,844,216
e
5435
Balboa
LP
,
Revenue
,
2025
A-S
,
Mandatory
Put
,
8
%
,
3/01/44
.............
4,000,000
4,133,818
ACI
Royal
York,
Inc.
,
Revenue
,
2020
A
,
4
%
,
2/15/55
........................
2,375,000
1,939,288
American
Heritage/Escondido/Heritage
K-8
Charter
School
Obligated
Group
,
Revenue
,
2016
A
,
Refunding
,
5
%
,
6/01/36
.............................
3,000,000
3,009,187
BOLD
Program
,
Special
Tax
,
2022
B
,
Refunding
,
6
%
,
9/01/52
................
2,920,000
3,096,101
BOLD
Program
,
Special
Tax
,
2022
B
,
Refunding
,
6.3
%
,
9/01/52
...............
1,205,000
1,289,162
BOLD
Program
,
Special
Tax
,
2022
C
,
6.25
%
,
9/01/52
.......................
4,030,000
4,305,066
BOLD
Program
,
Special
Tax
,
2022
D
,
6.125
%
,
9/01/52
......................
6,885,000
7,327,580
BOLD
Program
,
Special
Tax
,
2023
A
,
5.5
%
,
9/01/53
........................
3,000,000
3,147,934
BOLD
Program
,
Special
Tax
,
2023
C
,
5.25
%
,
9/01/53
.......................
1,300,000
1,333,868
BOLD
Program
,
Special
Tax
,
2024
A
,
5
%
,
9/01/39
.........................
275,000
293,106
BOLD
Program
,
Special
Tax
,
2024
A
,
5
%
,
9/01/44
.........................
625,000
649,155
BOLD
Program
,
Special
Tax
,
2024
A
,
5
%
,
9/01/48
.........................
300,000
306,273
BOLD
Program
,
Special
Tax
,
2024
A
,
5.125
%
,
9/01/54
......................
1,000,000
1,015,551
BOLD
Program
,
Special
Tax
,
2024
B
,
5
%
,
9/01/44
.........................
940,000
973,594
BOLD
Program
,
Special
Tax
,
2024
B
,
5
%
,
9/01/49
.........................
1,070,000
1,080,411
BOLD
Program
,
Special
Tax
,
2024
B
,
5
%
,
9/01/54
.........................
1,250,000
1,255,595
Franklin
Municipal
Securities
Trust
Schedule
of
Investments
Franklin
California
High
Yield
Municipal
Fund
(continued)
Annual
Report
The
accompanying
notes
are
an
integral
part
of
these
financial
statements.
a
a
Principal
Amount
a
Value
a
a
a
a
a
Municipal
Bonds
(continued)
California
(continued)
California
Municipal
Finance
Authority,
(continued)
BOLD
Program
,
Special
Tax
,
2025
D
,
5
%
,
9/01/55
.........................
$
2,000,000
$
2,003,263
Bowles
Hall
Foundation
,
Revenue
,
2015
A
,
5
%
,
6/01/35
.....................
600,000
600,666
Bowles
Hall
Foundation
,
Revenue
,
2015
A
,
5
%
,
6/01/50
.....................
3,250,000
3,250,183
c
California
Baptist
University
,
Revenue
,
144A,
2015
A
,
5.375
%
,
11/01/40
.........
5,000,000
5,003,575
c
California
Baptist
University
,
Revenue
,
144A,
2015
A
,
5.5
%
,
11/01/45
...........
10,000,000
10,002,220
c
California
Baptist
University
,
Revenue
,
144A,
2016
A
,
5
%
,
11/01/36
............
2,500,000
2,510,340
c
California
Baptist
University
,
Revenue
,
144A,
2025
A
,
Refunding
,
5
%
,
11/01/35
...
2,250,000
2,429,030
c
California
Baptist
University
,
Revenue
,
144A,
2025
A
,
Refunding
,
5.125
%
,
11/01/40
1,350,000
1,442,483
c
California
Baptist
University
,
Revenue
,
144A,
2025
A
,
Refunding
,
5.375
%
,
11/01/45
775,000
804,833
c
California
Baptist
University
,
Revenue
,
144A,
2025
A
,
Refunding
,
5.625
%
,
11/01/54
1,000,000
1,026,885
c
Capital
Christian
Center
,
Revenue
,
144A,
2021
A
,
5
%
,
10/01/51
...............
8,425,000
7,053,379
c
Capital
Christian
Center
,
Revenue
,
144A,
2021
B
,
Refunding
,
4
%
,
10/01/37
......
7,645,000
6,688,238
c
CHF-Aptos
LLC
,
Revenue
,
144A,
2025
A
,
5.375
%
,
7/01/50
..................
10,000,000
10,084,963
c
CHF-Aptos
LLC
,
Revenue
,
144A,
2025
A
,
5.5
%
,
7/01/57
....................
10,000,000
10,115,198
c
CHF-Aptos
LLC
,
Revenue
,
144A,
2025
B
,
7.5
%
,
7/01/57
....................
1,250,000
1,263,949
CHF-Davis
I
LLC
,
Revenue
,
2018
,
5
%
,
5/15/51
...........................
5,000,000
5,013,379
CHF-Davis
II
LLC
,
Revenue
,
2021
,
BAM
Insured
,
3
%
,
5/15/51
................
550,000
418,058
CHF-Riverside
I
LLC
,
Revenue
,
2018
,
5
%
,
5/15/40
.........................
1,500,000
1,538,568
CHF-Riverside
II
LLC
,
Revenue
,
2019
,
5
%
,
5/15/49
........................
9,575,000
9,584,269
City
of
Chula
Vista
Community
Facilities
District
No.
2021-11
,
Special
Tax
,
2022
,
5
%
,
9/01/52
........................................................
2,500,000
2,534,671
City
of
Hesperia
Community
Facilities
District
No.
2023-11
Improvement
Area
No.
1
,
Special
Tax
,
2025
,
5.125
%
,
9/01/55
...................................
1,000,000
1,015,608
c
Claremont
Graduate
University
,
Revenue
,
144A,
2020
B
,
Refunding
,
5
%
,
10/01/39
.
1,120,000
1,137,844
c
Claremont
Graduate
University
,
Revenue
,
144A,
2020
B
,
Refunding
,
5
%
,
10/01/49
.
4,290,000
4,064,309
c
Claremont
Graduate
University
,
Revenue
,
144A,
2020
B
,
Refunding
,
5
%
,
10/01/54
.
1,875,000
1,739,903
Community
Facilities
District
No.
2021-13
,
Special
Tax
,
2022
,
5
%
,
9/01/42
.......
1,000,000
1,052,037
Community
Facilities
District
No.
2021-13
,
Special
Tax
,
2022
,
5
%
,
9/01/52
.......
5,150,000
5,207,077
Community
Facilities
District
No.
2021-6
Improvement
Area
No.
2
,
Special
Tax
,
2022
,
6
%
,
9/01/52
....................................................
4,350,000
4,612,343
Community
Facilities
District
No.
2022-6
Improvement
Area
No.
2
,
Special
Tax
,
2025
,
5.25
%
,
9/01/45
..................................................
600,000
628,933
Community
Facilities
District
No.
2022-6
Improvement
Area
No.
2
,
Special
Tax
,
2025
,
5.375
%
,
9/01/50
.................................................
1,000,000
1,043,006
Community
Facilities
District
No.
2022-6
Improvement
Area
No.
2
,
Special
Tax
,
2025
,
5.375
%
,
9/01/55
.................................................
1,300,000
1,352,633
Community
Facilities
District
No.
2022-8
,
Special
Tax
,
2024
,
5
%
,
9/01/44
........
500,000
520,738
Community
Facilities
District
No.
2022-8
,
Special
Tax
,
2024
,
5
%
,
9/01/49
........
500,000
504,865
Community
Facilities
District
No.
2022-8
,
Special
Tax
,
2024
,
5
%
,
9/01/54
........
1,570,000
1,585,711
Community
Facilities
District
No.
2023-11
Improvement
Area
A
,
Special
Tax
,
2024
,
5
%
,
9/01/44
....................................................
500,000
517,869
Community
Facilities
District
No.
2023-11
Improvement
Area
A
,
Special
Tax
,
2024
,
5
%
,
9/01/49
....................................................
800,000
803,361
Community
Facilities
District
No.
2023-11
Improvement
Area
A
,
Special
Tax
,
2024
,
5
%
,
9/01/54
....................................................
1,125,000
1,119,099
Community
Facilities
District
No.
2023-11
Improvement
Area
A
,
Special
Tax
,
2024
,
5.125
%
,
9/01/59
.................................................
1,550,000
1,548,569
Community
Facilities
District
No.
2023-11
Improvement
Area
No.
2
,
Special
Tax
,
2025
,
5.25
%
,
9/01/60
.............................................
1,000,000
1,007,398
Community
Facilities
District
No.
2023-5
Area
No.
1
,
Special
Tax
,
2023
,
5.5
%
,
9/01/48
........................................................
600,000
635,232
Community
Facilities
District
No.
2023-5
Area
No.
1
,
Special
Tax
,
2023
,
5.625
%
,
9/01/53
........................................................
1,060,000
1,113,729
Community
Facilities
District
No.
2023-5
Area
No.
1
,
Special
Tax
,
2023
,
5.8
%
,
9/01/53
........................................................
3,190,000
3,386,483
Franklin
Municipal
Securities
Trust
Schedule
of
Investments
Franklin
California
High
Yield
Municipal
Fund
(continued)
The
accompanying
notes
are
an
integral
part
of
these
financial
statements.
Annual
Report
a
a
Principal
Amount
a
Value
a
a
a
a
a
Municipal
Bonds
(continued)
California
(continued)
California
Municipal
Finance
Authority,
(continued)
Community
Facilities
District
No.
2023-5
Improvement
Area
No.
2
,
Special
Tax
,
2024
,
5
%
,
9/01/44
....................................................
$
1,210,000
$
1,261,056
Community
Facilities
District
No.
2023-5
Improvement
Area
No.
2
,
Special
Tax
,
2024
,
5
%
,
9/01/49
....................................................
1,835,000
1,865,631
Community
Facilities
District
No.
2023-5
Improvement
Area
No.
2
,
Special
Tax
,
2024
,
5
%
,
9/01/54
....................................................
2,165,000
2,183,664
Community
Facilities
District
No.
2025-9
Improvement
Area
No.
1
,
Special
Tax
,
2025
,
5.25
%
,
9/01/45
..................................................
1,535,000
1,609,021
Community
Facilities
District
No.
2025-9
Improvement
Area
No.
1
,
Special
Tax
,
2025
,
5
%
,
9/01/50
....................................................
2,965,000
2,965,960
Community
Facilities
District
No.
2025-9
Improvement
Area
No.
1
,
Special
Tax
,
2025
,
5
%
,
9/01/55
....................................................
3,245,000
3,230,997
Community
Facilities
District
No.
2025-9
Improvement
Area
No.
1
,
Special
Tax
,
2025
,
5.375
%
,
9/01/55
.................................................
7,000,000
7,283,408
Community
Facilities
District
No.
2025-9
Improvement
Area
No.
1
,
Special
Tax
,
2025
B
,
5
%
,
9/01/50
..................................................
1,415,000
1,415,458
Community
Facilities
District
No.
2025-9
Improvement
Area
No.
1
,
Special
Tax
,
2025
B
,
5
%
,
9/01/55
..................................................
1,500,000
1,484,422
Community
Facilities
District
No.
2025-9
Improvement
Area
No.
1
,
Special
Tax
,
2025
B
,
5.125
%
,
9/01/55
...............................................
355,000
354,291
c
Community
Health
Centers
of
The
Central
Coast,
Inc.
,
Revenue
,
144A,
2021
A
,
4
%
,
12/01/26
.......................................................
200,000
201,234
c
Community
Health
Centers
of
The
Central
Coast,
Inc.
,
Revenue
,
144A,
2021
A
,
5
%
,
12/01/27
.......................................................
100,000
103,050
c
Community
Health
Centers
of
The
Central
Coast,
Inc.
,
Revenue
,
144A,
2021
A
,
5
%
,
12/01/29
.......................................................
50,000
53,623
c
Community
Health
Centers
of
The
Central
Coast,
Inc.
,
Revenue
,
144A,
2021
A
,
5
%
,
12/01/31
.......................................................
130,000
141,000
c
Community
Health
Centers
of
The
Central
Coast,
Inc.
,
Revenue
,
144A,
2021
A
,
5
%
,
12/01/36
.......................................................
350,000
372,199
c
Community
Health
Centers
of
The
Central
Coast,
Inc.
,
Revenue
,
144A,
2021
A
,
5
%
,
12/01/54
.......................................................
2,000,000
2,004,464
Community
Hospitals
of
Central
California
Obligated
Group
,
Revenue
,
2017
A
,
Refunding
,
4
%
,
2/01/42
............................................
10,000,000
9,977,746
Congregational
Homes,
Inc.
Obligated
Group
,
Revenue
,
2019
,
Refunding
,
5
%
,
11/15/39
.......................................................
2,670,000
2,769,455
Congregational
Homes,
Inc.
Obligated
Group
,
Revenue
,
2019
,
Refunding
,
5
%
,
11/15/49
.......................................................
480,000
480,888
c
Creative
Center
of
Los
Altos
(The)
,
Revenue
,
144A,
2016
B
,
4
%
,
11/01/36
.......
1,395,000
1,396,463
c
Creative
Center
of
Los
Altos
(The)
,
Revenue
,
144A,
2016
B
,
4.5
%
,
11/01/46
......
1,600,000
1,522,219
Del
Harbor
Foundation
,
Revenue
,
2015
,
Refunding
,
5
%
,
11/01/32
.............
3,020,000
3,024,869
Del
Harbor
Foundation
,
Revenue
,
2015
,
Refunding
,
5
%
,
11/01/39
.............
6,525,000
6,532,792
Eisenhower
Medical
Center
,
Revenue
,
2017
A
,
Refunding
,
5
%
,
7/01/37
.........
1,625,000
1,653,933
Eisenhower
Medical
Center
,
Revenue
,
2017
B
,
Refunding
,
5
%
,
7/01/47
.........
5,000,000
5,014,594
HumanGood
California
Obligated
Group
,
Revenue
,
2019
A
,
Refunding
,
5
%
,
10/01/44
5,500,000
5,523,232
HumanGood
California
Obligated
Group
,
Revenue
,
2021
,
3
%
,
10/01/49
.........
5,000,000
3,773,230
Ignatian
Corp.
(The)
,
Revenue
,
2024
A
,
5
%
,
9/01/49
.......................
600,000
631,427
Ignatian
Corp.
(The)
,
Revenue
,
2024
A
,
5
%
,
9/01/54
.......................
9,060,000
9,523,992
c,f
IH
Parkside
Fairfield
LLC
,
Revenue,
Sub.
Lien
,
144A,
2023
B
,
2.617
%,
9/01/43
...
20,710,000
16,432,269
Inland
Counties
Regional
Center,
Inc.
,
Revenue
,
2015
,
Refunding
,
5
%
,
6/15/37
...
8,965,000
8,972,802
Integrity
Housing
Obligated
Group
,
Revenue
,
2022
A-1
,
4.25
%
,
12/01/37
........
16,700,000
14,071,894
Integrity
Housing
Obligated
Group
,
Revenue
,
2022
B
,
10
%
,
12/01/62
...........
7,000,000
3,877,359
c
King/Chavez
Facilities
LLC
,
Revenue
,
144A,
2016
A
,
Refunding
,
5
%
,
5/01/36
.....
1,815,000
1,815,159
c
King/Chavez
Facilities
LLC
,
Revenue
,
144A,
2016
A
,
Refunding
,
5
%
,
5/01/46
.....
2,775,000
2,676,279
LAX
Integrated
Express
Solutions
LLC
,
Revenue,
Senior
Lien
,
2018
A
,
5
%
,
12/31/43
13,915,000
14,149,434
LAX
Integrated
Express
Solutions
LLC
,
Revenue,
Senior
Lien
,
2018
A
,
4
%
,
12/31/47
6,085,000
5,479,577
Franklin
Municipal
Securities
Trust
Schedule
of
Investments
Franklin
California
High
Yield
Municipal
Fund
(continued)
Annual
Report
The
accompanying
notes
are
an
integral
part
of
these
financial
statements.
a
a
Principal
Amount
a
Value
a
a
a
a
a
Municipal
Bonds
(continued)
California
(continued)
California
Municipal
Finance
Authority,
(continued)
LAX
Integrated
Express
Solutions
LLC
,
Revenue,
Senior
Lien
,
2018
A
,
5
%
,
12/31/47
$
22,250,000
$
22,371,783
Learning
Choice
Academy
Obligated
Group
(The)
,
Revenue
,
2025
A
,
5.7
%
,
7/01/55
3,000,000
2,992,005
Literacy
First
Charter
School
Issuer
LLC
,
Revenue
,
2019
A
,
5
%
,
12/01/49
.......
4,165,000
4,190,278
Northbay
Healthcare
Corp.
Obligated
Group
,
Revenue
,
2015
,
5
%
,
11/01/35
......
1,100,000
1,100,520
Northbay
Healthcare
Group
Obligated
Group
,
Revenue
,
2015
,
5
%
,
11/01/44
......
1,050,000
1,050,000
Northbay
Healthcare
Group
Obligated
Group
,
Revenue
,
2017
A
,
5.25
%
,
11/01/47
..
3,000,000
3,001,018
c
P3
Claremont
Holdings
LLC
,
Revenue
,
144A,
2020
A
,
5
%
,
7/01/30
.............
520,000
535,979
c
Palmdale
Aerospace
Academy,
Inc.
(The)
,
Revenue
,
144A,
2016
A
,
5
%
,
7/01/36
..
2,750,000
2,755,069
c
Palmdale
Aerospace
Academy,
Inc.
(The)
,
Revenue
,
144A,
2016
A
,
5
%
,
7/01/41
..
1,750,000
1,751,036
c
Palmdale
Aerospace
Academy,
Inc.
(The)
,
Revenue
,
144A,
2018
A
,
3.875
%
,
7/01/28
600,000
597,224
c
Palmdale
Aerospace
Academy,
Inc.
(The)
,
Revenue
,
144A,
2018
A
,
5
%
,
7/01/38
..
1,100,000
1,113,880
c
Palmdale
Aerospace
Academy,
Inc.
(The)
,
Revenue
,
144A,
2018
A
,
5
%
,
7/01/49
..
3,600,000
3,430,646
Porter
1107
LLC
,
Revenue
,
2025
B
,
7.2
%
,
11/01/37
........................
12,950,000
13,434,346
PRS-California
Obligated
Group
,
Revenue
,
2024
A
,
Refunding
,
5
%
,
4/01/44
......
2,830,000
3,002,809
PRS-California
Obligated
Group
,
Revenue
,
2024
A
,
Refunding
,
5
%
,
4/01/49
......
1,500,000
1,542,583
c
Santa
Rosa
Academy
LLC
,
Revenue
,
144A,
2015
,
5.125
%
,
7/01/35
............
450,000
450,228
c
Santa
Rosa
Academy
LLC
,
Revenue
,
144A,
2015
,
5.375
%
,
7/01/45
............
1,400,000
1,384,652
Scripps
College
,
Revenue
,
2025
,
5
%
,
7/01/55
............................
3,320,000
3,463,609
c
Sierra
Ridge
3600
LLC
,
Revenue
,
144A,
2024
B
,
6.75
%
,
11/01/39
.............
11,012,000
11,236,439
c
St.
Mary
and
All
Angels
Christian
Church
,
Revenue
,
144A,
2024
A
,
5
%
,
5/01/34
...
300,000
315,469
c
St.
Mary
and
All
Angels
Christian
Church
,
Revenue
,
144A,
2024
A
,
5.5
%
,
5/01/44
..
510,000
523,134
c
St.
Mary
and
All
Angels
Christian
Church
,
Revenue
,
144A,
2024
A
,
5.75
%
,
5/01/54
.
510,000
515,684
c
St.
Mary
and
All
Angels
Christian
Church
,
Revenue
,
144A,
2024
A
,
5.875
%
,
5/01/59
700,000
710,957
St.
Mary
and
All
Angels
Christian
Church
,
Revenue
,
2024
B
,
4.65
%
,
5/01/30
.....
420,000
435,589
c
STREAM
Charter
School
,
Revenue
,
144A,
2020
A
,
5
%
,
6/15/41
...............
925,000
927,723
c
STREAM
Charter
School
,
Revenue
,
144A,
2020
A
,
5
%
,
6/15/51
...............
2,770,000
2,550,264
c
STREAM
Charter
School
,
Revenue
,
144A,
2020
B
,
6.4
%
,
6/15/32
.............
660,000
661,954
c
Westside
Neighborhood
School
,
Revenue
,
144A,
2024
,
5
%
,
6/15/34
...........
500,000
538,248
c
Westside
Neighborhood
School
,
Revenue
,
144A,
2024
,
5.5
%
,
6/15/39
..........
655,000
706,423
c
Westside
Neighborhood
School
,
Revenue
,
144A,
2024
,
5.9
%
,
6/15/44
..........
1,635,000
1,752,231
c
Westside
Neighborhood
School
,
Revenue
,
144A,
2024
,
6.2
%
,
6/15/54
..........
2,900,000
3,054,234
c
Westside
Neighborhood
School
,
Revenue
,
144A,
2024
,
6.375
%
,
6/15/64
........
3,000,000
3,172,284
c
California
Pollution
Control
Financing
Authority
,
a,d
CalPlant
I
LLC
,
Revenue
,
144A,
2017
,
7
%
,
7/01/22
........................
3,500,000
35
a,d
CalPlant
I
LLC
,
Revenue
,
144A,
2017
,
7.5
%
,
7/01/32
.......................
13,000,000
130
a,d
CalPlant
I
LLC
,
Revenue
,
144A,
2017
,
8
%
,
7/01/39
........................
11,500,000
115
a,d
CalPlant
I
LLC
,
Revenue
,
144A,
2020
,
7.5
%
,
7/01/32
.......................
4,500,000
45
Channelside
Water
Resources
LP
,
Revenue
,
144A,
2012
,
5
%
,
11/21/45
.........
21,685,000
21,713,091
California
Public
Finance
Authority
,
c
Crossroads
Christian
Schools
Obligated
Group
,
Revenue
,
144A,
2020
,
5
%
,
1/01/56
4,015,000
3,572,601
c
Ed
Brokers
Educational
Services
,
Revenue
,
144A,
2025
A
,
5.625
%
,
6/15/55
......
1,200,000
1,214,398
c
Ed
Brokers
Educational
Services
,
Revenue
,
144A,
2025
A
,
6
%
,
6/15/65
.........
5,000,000
5,132,691
Henry
Mayo
Newhall
Hospital
Obligated
Group
,
Revenue
,
2017
,
Refunding
,
5
%
,
10/15/37
.......................................................
1,100,000
1,106,914
c
Kendal
at
Sonoma
Obligated
Group
,
Revenue
,
144A,
2021
A
,
Refunding
,
5
%
,
11/15/36
.......................................................
1,000,000
1,031,552
c
Kendal
at
Sonoma
Obligated
Group
,
Revenue
,
144A,
2021
A
,
Refunding
,
5
%
,
11/15/56
.......................................................
2,135,000
1,913,504
c
California
School
Finance
Authority
,
Revenue
,
144A,
2017
,
5
%
,
6/01/47
....................................
700,000
666,145
Alliance
for
College
Ready
Public
Schools
Obligated
Group
,
Revenue
,
144A,
2016
C
,
5
%
,
7/01/46
....................................................
10,000,000
10,005,128
Alternative
Schools,
Inc.
,
Revenue
,
144A,
2021
A
,
Refunding
,
4
%
,
6/01/41
.......
500,000
417,993
Alternative
Schools,
Inc.
,
Revenue
,
144A,
2021
A
,
Refunding
,
4
%
,
6/01/51
.......
2,835,000
2,022,164
Alternative
Schools,
Inc.
,
Revenue
,
144A,
2021
A
,
Refunding
,
4
%
,
6/01/61
.......
3,675,000
2,446,001
Franklin
Municipal
Securities
Trust
Schedule
of
Investments
Franklin
California
High
Yield
Municipal
Fund
(continued)
The
accompanying
notes
are
an
integral
part
of
these
financial
statements.
Annual
Report
a
a
Principal
Amount
a
Value
a
a
a
a
a
Municipal
Bonds
(continued)
California
(continued)
c
California
School
Finance
Authority,
(continued)
Aspire
Public
Schools
Obligated
Group
,
Revenue
,
144A,
2015
,
Refunding
,
5
%
,
8/01/40
........................................................
$
1,000,000
$
1,000,347
Aspire
Public
Schools
Obligated
Group
,
Revenue
,
144A,
2016
,
5
%
,
8/01/41
......
2,010,000
2,010,609
Citizens
of
the
World
Los
Angeles
Obligated
Group
,
Revenue
,
144A,
2022
A
,
6.25
%
,
4/01/52
........................................................
2,000,000
2,013,392
Citizens
of
the
World
Los
Angeles
Obligated
Group
,
Revenue
,
144A,
2022
A
,
6.375
%
,
4/01/62
.................................................
2,000,000
2,013,711
Classical
Academy
Obligated
Group
,
Revenue
,
144A,
2017
A
,
Refunding
,
5
%
,
10/01/37
.......................................................
1,485,000
1,509,734
Classical
Academy
Obligated
Group
,
Revenue
,
144A,
2017
A
,
Refunding
,
5
%
,
10/01/44
.......................................................
5,610,000
5,640,270
Classical
Academy
Obligated
Group
,
Revenue
,
144A,
2020
A
,
5
%
,
10/01/40
.....
500,000
509,699
Classical
Academy
Obligated
Group
,
Revenue
,
144A,
2020
A
,
5
%
,
10/01/50
.....
3,570,000
3,502,663
Ednovate
Obligated
Group
,
Revenue
,
144A,
2018
,
5
%
,
6/01/48
...............
1,000,000
924,444
Ednovate
Obligated
Group
,
Revenue
,
144A,
2018
,
5
%
,
6/01/56
...............
1,710,000
1,517,929
Envision
Education
Obligated
Group
,
Revenue
,
144A,
2024
A
,
5
%
,
6/01/54
......
900,000
828,731
Fenton
Charter
Public
Schools
,
Revenue
,
144A,
2020
A
,
5
%
,
7/01/40
...........
225,000
225,839
Fenton
Charter
Public
Schools
,
Revenue
,
144A,
2020
A
,
5
%
,
7/01/50
...........
1,275,000
1,171,149
Granada
Hills
Charter
High
School
Obligated
Group
,
Revenue
,
144A,
2019
,
5
%
,
7/01/43
........................................................
1,000,000
1,000,881
Granada
Hills
Charter
High
School
Obligated
Group
,
Revenue
,
144A,
2019
,
5
%
,
7/01/49
........................................................
5,750,000
5,641,793
Green
Dot
Public
Schools
Obligated
Group
,
Revenue
,
144A,
2015
A
,
5
%
,
8/01/35
.
2,525,000
2,527,205
Green
Dot
Public
Schools
Obligated
Group
,
Revenue
,
144A,
2015
A
,
5
%
,
8/01/45
.
3,500,000
3,500,276
Green
Dot
Public
Schools
Obligated
Group
,
Revenue
,
144A,
2018
A
,
5
%
,
8/01/38
.
1,000,000
1,024,244
Green
Dot
Public
Schools
Obligated
Group
,
Revenue
,
144A,
2018
A
,
5
%
,
8/01/48
.
1,750,000
1,753,617
Harbor
Springs
Obligated
Group
,
Revenue
,
144A,
2024
A
,
5.5
%
,
7/01/54
........
2,235,000
2,271,986
iLEAD
Lancaster
,
Revenue
,
144A,
2021
A
,
4
%
,
6/01/31
.....................
250,000
247,989
iLEAD
Lancaster
,
Revenue
,
144A,
2021
A
,
5
%
,
6/01/41
.....................
435,000
432,010
iLEAD
Lancaster
,
Revenue
,
144A,
2021
A
,
5
%
,
6/01/51
.....................
600,000
536,886
iLEAD
Lancaster
,
Revenue
,
144A,
2021
A
,
5
%
,
6/01/61
.....................
1,320,000
1,144,370
Integrity
Charter
School
,
Revenue
,
144A,
2024
,
5
%
,
7/01/39
.................
1,000,000
1,017,614
Integrity
Charter
School
,
Revenue
,
144A,
2024
,
5.25
%
,
7/01/44
...............
800,000
800,634
Integrity
Charter
School
,
Revenue
,
144A,
2024
,
5.5
%
,
7/01/54
................
1,600,000
1,537,896
John
Adams
Academies
Obligated
Group
,
Revenue
,
144A,
2022
A
,
4.5
%
,
7/01/32
.
595,000
618,454
John
Adams
Academies
Obligated
Group
,
Revenue
,
144A,
2022
A
,
5
%
,
7/01/42
...
2,140,000
2,175,240
John
Adams
Academies
Obligated
Group
,
Revenue
,
144A,
2022
A
,
5
%
,
7/01/52
...
3,175,000
2,991,623
John
Adams
Academies
Obligated
Group
,
Revenue
,
144A,
2022
A
,
5.125
%
,
7/01/62
8,125,000
7,562,834
KIPP
SoCal
Public
Schools
Obligated
Group
,
Revenue
,
144A,
2015
A
,
5
%
,
7/01/35
1,200,000
1,201,209
KIPP
SoCal
Public
Schools
Obligated
Group
,
Revenue
,
144A,
2015
A
,
5
%
,
7/01/45
1,675,000
1,675,225
KIPP
SoCal
Public
Schools
Obligated
Group
,
Revenue
,
144A,
2019
A
,
5
%
,
7/01/49
2,150,000
2,155,154
KIPP
SoCal
Public
Schools
Obligated
Group
,
Revenue
,
144A,
2019
A
,
5
%
,
7/01/54
1,150,000
1,140,475
Larchmont
Schools
,
Revenue
,
144A,
2018
A
,
5
%
,
6/01/55
...................
3,050,000
2,807,857
Lifeline
Education
Charter
School,
Inc.
,
Revenue
,
144A,
2020
A
,
3
%
,
7/01/30
.....
285,000
278,166
Lifeline
Education
Charter
School,
Inc.
,
Revenue
,
144A,
2020
A
,
5
%
,
7/01/45
.....
1,200,000
1,197,429
Lifeline
Education
Charter
School,
Inc.
,
Revenue
,
144A,
2020
A
,
5
%
,
7/01/55
.....
1,235,000
1,179,643
Lighthouse
Community
Public
Schools
Obligated
Group
,
Revenue
,
144A,
2022
A
,
6.375
%
,
6/01/52
.................................................
1,250,000
1,291,637
Lighthouse
Community
Public
Schools
Obligated
Group
,
Revenue
,
144A,
2022
A
,
6.5
%
,
6/01/62
...................................................
1,500,000
1,550,165
NCCD-Santa
Rosa
Properties
LLC
,
Revenue
,
144A,
2021
A
,
4
%
,
11/01/31
.......
1,000,000
1,017,501
NCCD-Santa
Rosa
Properties
LLC
,
Revenue
,
144A,
2021
A
,
4
%
,
11/01/36
.......
1,670,000
1,661,031
NCCD-Santa
Rosa
Properties
LLC
,
Revenue
,
144A,
2021
A
,
4
%
,
11/01/51
.......
16,730,000
13,799,259
NCCD-Santa
Rosa
Properties
LLC
,
Revenue
,
144A,
2021
A
,
4
%
,
11/01/55
.......
1,400,000
1,129,900
New
Designs
Charter
School
,
Revenue
,
144A,
2024
A
,
Refunding
,
5
%
,
6/01/54
...
650,000
622,619
New
Designs
Charter
School
,
Revenue
,
144A,
2024
A
,
Refunding
,
5
%
,
6/01/64
...
1,600,000
1,499,115
Franklin
Municipal
Securities
Trust
Schedule
of
Investments
Franklin
California
High
Yield
Municipal
Fund
(continued)
Annual
Report
The
accompanying
notes
are
an
integral
part
of
these
financial
statements.
a
a
Principal
Amount
a
Value
a
a
a
a
a
Municipal
Bonds
(continued)
California
(continued)
c
California
School
Finance
Authority,
(continued)
Orange
County
Educational
Arts
Academy
,
Revenue
,
144A,
2023
A
,
Refunding
,
5
%
,
6/01/33
........................................................
$
650,000
$
674,754
Orange
County
Educational
Arts
Academy
,
Revenue
,
144A,
2023
A
,
Refunding
,
5.625
%
,
6/01/43
.................................................
560,000
571,607
Orange
County
Educational
Arts
Academy
,
Revenue
,
144A,
2023
A
,
Refunding
,
5.875
%
,
6/01/53
.................................................
600,000
604,635
Partnerships
to
Uplift
Communities
Obligated
Group
,
Revenue
,
144A,
2023
,
Refunding
,
5
%
,
8/01/33
............................................
620,000
650,136
Partnerships
to
Uplift
Communities
Obligated
Group
,
Revenue
,
144A,
2023
,
Refunding
,
5.25
%
,
8/01/38
.........................................
500,000
527,586
Partnerships
to
Uplift
Communities
Obligated
Group
,
Revenue
,
144A,
2023
,
Refunding
,
5.5
%
,
8/01/43
..........................................
550,000
574,023
Partnerships
to
Uplift
Communities
Obligated
Group
,
Revenue
,
144A,
2023
,
Refunding
,
5.5
%
,
8/01/47
..........................................
525,000
534,692
Real
Journey
Academies
Obligated
Group
,
Revenue
,
144A,
2019
A
,
5
%
,
6/01/49
..
7,105,000
6,969,380
Rex
&
Margaret
Fortune
School
of
Education
,
Revenue
,
144A,
2024
A
,
5
%
,
6/01/44
2,000,000
1,950,627
Rex
&
Margaret
Fortune
School
of
Education
,
Revenue
,
144A,
2024
A
,
5
%
,
6/01/54
2,350,000
2,139,058
Rex
&
Margaret
Fortune
School
of
Education
,
Revenue
,
144A,
2024
A
,
5.125
%
,
6/01/59
........................................................
1,500,000
1,373,876
River
Springs
Charter
School,
Inc.
,
Revenue
,
144A,
2017
A
,
5
%
,
7/01/30
........
1,000,000
1,022,404
River
Springs
Charter
School,
Inc.
,
Revenue
,
144A,
2017
A
,
5
%
,
7/01/37
........
2,000,000
2,023,563
River
Springs
Charter
School,
Inc.
,
Revenue
,
144A,
2017
A
,
5
%
,
7/01/47
........
1,975,000
1,944,296
River
Springs
Charter
School,
Inc.
,
Revenue
,
144A,
2017
A
,
5
%
,
7/01/52
........
1,340,000
1,280,696
River
Springs
Charter
School,
Inc.
,
Revenue
,
144A,
2023
A
,
5.75
%
,
7/01/42
......
960,000
1,014,146
Rocketship
Education
Obligated
Group
,
Revenue
,
144A,
2017
A
,
5
%
,
6/01/34
....
750,000
751,986
Rocketship
Education
Obligated
Group
,
Revenue
,
144A,
2017
A
,
5.125
%
,
6/01/47
.
845,000
819,483
Rocketship
Education
Obligated
Group
,
Revenue
,
144A,
2017
A
,
5.25
%
,
6/01/52
..
2,440,000
2,331,912
Rocketship
Education
Obligated
Group
,
Revenue
,
144A,
2017
G
,
5
%
,
6/01/30
....
275,000
279,317
Rocketship
Education
Obligated
Group
,
Revenue
,
144A,
2017
G
,
5
%
,
6/01/37
....
360,000
362,278
Santa
Clarita
Valley
International
Charter
School
,
Revenue
,
144A,
2021
A
,
4
%
,
6/01/31
........................................................
260,000
203,110
Santa
Clarita
Valley
International
Charter
School
,
Revenue
,
144A,
2021
A
,
4
%
,
6/01/41
........................................................
600,000
445,533
Santa
Clarita
Valley
International
Charter
School
,
Revenue
,
144A,
2021
A
,
4
%
,
6/01/51
........................................................
800,000
552,852
Santa
Clarita
Valley
International
Charter
School
,
Revenue
,
144A,
2021
A
,
4
%
,
6/01/61
........................................................
1,300,000
840,886
Summit
Public
Schools
Obligated
Group
,
Revenue
,
144A,
2017
,
Pre-Refunded
,
5
%
,
6/01/47
........................................................
800,000
825,773
California
State
Public
Works
Board
,
Revenue
,
2025
A
,
5
%
,
4/01/50
.............
7,500,000
8,039,180
California
Statewide
Communities
Development
Authority
,
Revenue
,
2015
R-1
,
Refunding
,
5
%
,
9/02/40
.............................
2,230,000
2,232,009
Special
Assessment
,
2016
A
,
5
%
,
9/02/36
...............................
1,035,000
1,043,783
Special
Assessment
,
2017
A
,
4
%
,
9/02/27
...............................
525,000
530,387
Special
Assessment
,
2017
A
,
5
%
,
9/02/37
...............................
1,970,000
2,016,227
Special
Assessment
,
2017
A
,
5
%
,
9/02/46
...............................
2,455,000
2,475,387
Special
Assessment
,
2017
B
,
5
%
,
9/02/37
...............................
3,260,000
3,345,159
Special
Assessment
,
2017
B
,
5
%
,
9/02/47
...............................
2,520,000
2,543,326
Special
Assessment
,
2017
C
,
5
%
,
9/02/37
...............................
2,755,000
2,781,433
Special
Assessment
,
2018
A
,
5
%
,
9/02/38
...............................
2,150,000
2,227,906
Special
Assessment
,
2018
A
,
5
%
,
9/02/47
...............................
3,745,000
3,790,945
Special
Assessment
,
2018
B
,
5
%
,
9/02/38
...............................
2,760,000
2,861,350
Special
Assessment
,
2018
B
,
5
%
,
9/02/43
...............................
4,690,000
4,791,602
Special
Assessment
,
2018
B
,
5
%
,
9/02/48
...............................
4,605,000
4,661,452
Special
Assessment
,
2018
C
,
5
%
,
9/02/38
...............................
4,995,000
5,175,995
Special
Assessment
,
2018
C
,
5
%
,
9/02/48
...............................
6,605,000
6,678,187
Franklin
Municipal
Securities
Trust
Schedule
of
Investments
Franklin
California
High
Yield
Municipal
Fund
(continued)
The
accompanying
notes
are
an
integral
part
of
these
financial
statements.
Annual
Report
a
a
Principal
Amount
a
Value
a
a
a
a
a
Municipal
Bonds
(continued)
California
(continued)
California
Statewide
Communities
Development
Authority,
(continued)
Special
Assessment
,
2019
A
,
5
%
,
9/02/39
...............................
$
1,600,000
$
1,673,246
Special
Assessment
,
2019
A
,
5
%
,
9/02/44
...............................
940,000
963,336
Special
Assessment
,
2019
B
,
5
%
,
9/02/44
...............................
1,150,000
1,183,828
Special
Assessment
,
2019
C
,
5
%
,
9/02/39
...............................
850,000
879,576
Special
Assessment
,
2020
A
,
5
%
,
9/02/40
...............................
1,250,000
1,311,579
Special
Assessment
,
2020
A
,
4
%
,
9/02/50
...............................
900,000
776,459
Special
Assessment
,
2020
A
,
5
%
,
9/02/50
...............................
1,000,000
1,012,217
Special
Assessment
,
2020
B
,
4
%
,
9/02/40
...............................
565,000
565,030
Special
Assessment
,
2020
B
,
4
%
,
9/02/50
...............................
695,000
597,125
Special
Assessment
,
2021
A
,
4
%
,
9/02/41
...............................
995,000
977,656
Special
Assessment
,
2021
A
,
4
%
,
9/02/51
...............................
3,175,000
2,761,452
Special
Assessment
,
2021
B
,
4
%
,
9/02/41
...............................
3,280,000
3,241,294
Special
Assessment
,
2021
B
,
4
%
,
9/02/51
...............................
3,145,000
2,735,360
Special
Assessment
,
2021
C-1
,
4
%
,
9/02/41
..............................
2,435,000
2,309,665
Special
Assessment
,
2021
C-1
,
4
%
,
9/02/51
..............................
3,610,000
3,092,844
Special
Assessment
,
2021
C-2
,
5
%
,
9/02/41
..............................
3,030,000
2,653,234
Special
Assessment
,
2021
C-2
,
5.5
%
,
9/02/51
............................
3,575,000
2,790,208
Special
Assessment
,
2022
B
,
5
%
,
9/02/42
...............................
3,000,000
3,149,186
Special
Assessment
,
2022
B
,
5
%
,
9/02/52
...............................
3,000,000
3,029,930
Special
Assessment
,
2022
C
,
5.375
%
,
9/02/52
............................
1,990,000
2,047,722
Special
Assessment
,
2023
D
,
5.5
%
,
9/02/53
..............................
1,000,000
1,026,450
Special
Tax
,
2023
C-1
,
5.25
%
,
9/02/53
..................................
3,000,000
3,064,938
Special
Tax
,
2025
A
,
5
%
,
9/02/50
......................................
5,500,000
5,678,196
Assessment
District
No.
14-01
,
Special
Assessment
,
2015
,
Refunding
,
5
%
,
9/02/35
2,000,000
2,002,863
Assessment
District
No.
14-01
,
Special
Assessment
,
2015
,
5
%
,
9/02/45
.........
3,810,000
3,815,455
c
California
Baptist
University
,
Revenue
,
144A,
2017
A
,
Refunding
,
5
%
,
11/01/32
...
1,135,000
1,159,398
c
California
Baptist
University
,
Revenue
,
144A,
2017
A
,
Refunding
,
5
%
,
11/01/41
...
1,875,000
1,887,969
Cedars-Sinai
Medical
Center
Obligated
Group
,
Revenue
,
2018
,
4
%
,
7/01/48
.....
6,000,000
5,711,953
Community
Facilities
District
2022-7
Improvement
Area
No.
2
,
Special
Tax
,
2024
,
5
%
,
9/01/54
........................................................
1,500,000
1,524,410
Community
Facilities
District
No.
2016-02
,
Special
Tax
,
2016
A
,
5
%
,
9/01/46
......
10,480,000
10,504,854
Community
Facilities
District
No.
2016-02
,
Special
Tax
,
2019
,
5
%
,
9/01/39
.......
1,230,000
1,277,674
Community
Facilities
District
No.
2016-02
,
Special
Tax
,
2019
,
5
%
,
9/01/49
.......
2,000,000
2,016,649
Community
Facilities
District
No.
2016-02
,
Special
Tax
,
2020
,
4
%
,
9/01/40
.......
3,345,000
3,363,054
Community
Facilities
District
No.
2016-02
,
Special
Tax
,
2020
,
4
%
,
9/01/50
.......
2,845,000
2,487,349
Community
Facilities
District
No.
2016-02
,
Special
Tax
,
2022
,
5.5
%
,
9/01/52
......
7,475,000
7,676,244
Community
Facilities
District
No.
2018-01
,
Special
Tax
,
2019
,
5
%
,
9/01/39
.......
1,610,000
1,661,981
Community
Facilities
District
No.
2018-01
,
Special
Tax
,
2019
,
5
%
,
9/01/48
.......
2,000,000
2,021,194
Community
Facilities
District
No.
2022-08
Improvement
Area
,
Special
Tax
,
2024
,
5.25
%
,
9/01/39
..................................................
2,360,000
2,531,060
Community
Facilities
District
No.
2022-08
Improvement
Area
,
Special
Tax
,
2024
,
5.25
%
,
9/01/45
..................................................
2,750,000
2,830,287
Community
Facilities
District
No.
2022-12
Improvement
Area
No.
1
,
Special
Tax
,
2024
,
5
%
,
9/01/44
................................................
2,270,000
2,372,480
Community
Facilities
District
No.
2022-12
Improvement
Area
No.
1
,
Special
Tax
,
2024
,
5
%
,
9/01/54
................................................
1,350,000
1,373,221
Community
Facilities
District
No.
2023-08
Improvement
Area
No.
1
,
Special
Tax
,
2025
,
5.25
%
,
9/01/55
.............................................
1,700,000
1,741,091
Community
Facilities
District
No.
2024-9
,
Special
Tax
,
2024
,
5
%
,
9/01/44
........
400,000
418,321
Community
Facilities
District
No.
2024-9
,
Special
Tax
,
2024
,
5
%
,
9/01/54
........
700,000
709,925
Community
Infrastructure
Program
Assessment
District
No.
20-02
,
Special
Assessment
,
2023
,
5.75
%
,
9/02/53
...................................
1,875,000
1,953,537
e
Foothill
Oak
Park
Apartments
LLC
,
Revenue
,
2025
H-S-A
,
Mandatory
Put
,
7.5
%
,
3/01/36
........................................................
3,430,000
3,485,236
John
Muir
Health
Obligated
Group
,
Revenue
,
2024
A
,
Refunding
,
5.25
%
,
12/01/54
.
10,000,000
10,704,640
c
Lancer
Educational
Housing
LLC
,
Revenue
,
144A,
2016
A
,
Refunding
,
5
%
,
6/01/46
12,735,000
12,627,881
Franklin
Municipal
Securities
Trust
Schedule
of
Investments
Franklin
California
High
Yield
Municipal
Fund
(continued)
Annual
Report
The
accompanying
notes
are
an
integral
part
of
these
financial
statements.
a
a
Principal
Amount
a
Value
a
a
a
a
a
Municipal
Bonds
(continued)
California
(continued)
California
Statewide
Communities
Development
Authority,
(continued)
c
Lancer
Educational
Housing
LLC
,
Revenue
,
144A,
2019
A
,
5
%
,
6/01/39
.........
$
950,000
$
970,591
c
Loma
Linda
University
Medical
Center
Obligated
Group
,
Revenue
,
144A,
2016
A
,
5
%
,
12/01/41
...................................................
1,245,000
1,248,254
c
Loma
Linda
University
Medical
Center
Obligated
Group
,
Revenue
,
144A,
2016
A
,
5.25
%
,
12/01/56
.................................................
45,755,000
45,779,996
c
Loma
Linda
University
Medical
Center
Obligated
Group
,
Revenue
,
144A,
2018
A
,
5.5
%
,
12/01/58
..................................................
6,250,000
6,364,236
Marin
General
Hospital
Obligated
Group
,
Revenue
,
2018
A
,
4
%
,
8/01/45
........
1,500,000
1,391,218
c
NCCD-Hooper
Street
LLC
,
Revenue
,
144A,
2019
,
5.25
%
,
7/01/39
.............
4,325,000
4,453,111
c
NCCD-Hooper
Street
LLC
,
Revenue
,
144A,
2019
,
5.25
%
,
7/01/49
.............
8,000,000
8,034,534
c
NCCD-Hooper
Street
LLC
,
Revenue
,
144A,
2019
,
5.25
%
,
7/01/52
.............
2,635,000
2,636,902
Panorama
II
Preservation
LP
,
Revenue
,
2024
F
,
FNMA
Insured
,
4.25
%
,
12/01/40
..
7,410,000
7,841,146
USC
Obligated
Group
,
Revenue
,
2018
,
Refunding
,
5
%
,
1/01/43
...............
5,000,000
5,143,738
Central
Valley
Energy
Authority
,
Revenue
,
2026
,
5
%
,
8/01/34
..................
2,520,000
2,772,990
Chino
Community
Facilities
District
,
City
of
Chino
Community
Facilities
District
No.
2003-3
Improvement
Area
No.
6
,
Special
Tax
,
2015
,
5
%
,
9/01/45
..............
1,665,000
1,665,737
City
&
County
of
San
Francisco
,
Community
Facilities
District
No.
2016-1
Improvement
Area
No.
1
,
Special
Tax
,
2020
,
4
%
,
9/01/50
....................................................
1,950,000
1,715,003
c
Community
Facilities
District
No.
2016-1
Improvement
Area
No.
2
,
Special
Tax
,
144A,
2022
A
,
4
%
,
9/01/52
..............................................
5,270,000
4,542,820
c
Community
Facilities
District
No.
2016-1
Improvement
Area
No.
2
,
Special
Tax
,
144A,
2023
A
,
5.5
%
,
9/01/53
.............................................
2,045,000
2,128,810
c
Infrastructure
&
Revitalization
Financing
District
No.
1
Facilities
Increment
,
Tax
Allocation
,
144A,
2022
A
,
5
%
,
9/01/37
.................................
385,000
411,793
c
Infrastructure
&
Revitalization
Financing
District
No.
1
Facilities
Increment
,
Tax
Allocation
,
144A,
2022
A
,
5
%
,
9/01/52
.................................
2,000,000
1,957,058
c
Infrastructure
&
Revitalization
Financing
District
No.
1
Housing
Increment
,
Tax
Allocation
,
144A,
2022
B
,
5
%
,
9/01/52
.................................
1,000,000
978,529
c
Special
Tax
District
No.
2020-1
Development
,
Special
Tax
,
144A,
2021
C
,
4
%
,
9/01/51
........................................................
3,900,000
3,376,716
c
City
&
County
San
Francisco
,
Infrastructure
&
Revitalization
Financing
District
No.
1
,
Tax
Allocation
,
144A,
2025
A
,
5
%
,
9/01/46
....................................................
1,625,000
1,637,010
Infrastructure
&
Revitalization
Financing
District
No.
1
,
Tax
Allocation
,
144A,
2025
A
,
5
%
,
9/01/55
....................................................
2,500,000
2,455,259
City
of
Dixon
,
Community
Facilities
District
No.
2013-1
Parklane
,
Special
Tax
,
2019
,
5
%
,
9/01/49
......................................................
2,400,000
2,427,684
City
of
Dublin
,
Community
Facilities
District
No.
2015-1
Improvement
Area
No.
2
,
Special
Tax
,
2019
,
5
%
,
9/01/39
....................................................
2,765,000
2,865,312
Community
Facilities
District
No.
2015-1
Improvement
Area
No.
2
,
Special
Tax
,
2019
,
5
%
,
9/01/44
....................................................
2,925,000
2,999,470
Community
Facilities
District
No.
2015-1
Improvement
Area
No.
2
,
Special
Tax
,
2019
,
5
%
,
9/01/49
....................................................
4,100,000
4,155,214
City
of
El
Paso
Robles
,
Community
Facilities
District
No.
2022-1N
Improvement
Area
No.
1
,
Special
Tax
,
2025
A
,
5
%
,
9/01/51
..............................................
2,000,000
2,004,465
Community
Facilities
District
No.
2022-1N
Improvement
Area
No.
1
,
Special
Tax
,
2025
A
,
5
%
,
9/01/56
..............................................
2,115,000
2,101,725
Community
Facilities
District
No.
2022-1N
Improvement
Area
No.
2
,
Special
Tax
,
2025
A
,
5
%
,
9/01/51
..............................................
1,680,000
1,683,751
Community
Facilities
District
No.
2022-1N
Improvement
Area
No.
2
,
Special
Tax
,
2025
A
,
5
%
,
9/01/56
..............................................
2,125,000
2,111,662
Franklin
Municipal
Securities
Trust
Schedule
of
Investments
Franklin
California
High
Yield
Municipal
Fund
(continued)
The
accompanying
notes
are
an
integral
part
of
these
financial
statements.
Annual
Report
a
a
Principal
Amount
a
Value
a
a
a
a
a
Municipal
Bonds
(continued)
California
(continued)
City
of
Fairfield
,
Community
Facilities
District
No.
2023-1
Improvement
Area
No.
1
,
Special
Tax
,
2024
A
,
5
%
,
9/01/44
..................................................
$
2,000,000
$
2,078,639
Community
Facilities
District
No.
2023-1
Improvement
Area
No.
1
,
Special
Tax
,
2024
A
,
5
%
,
9/01/49
..................................................
2,000,000
2,040,391
City
of
Fillmore
,
Community
Facilities
District
No.
5
,
Special
Tax
,
2015
,
5
%
,
9/01/40
............
1,500,000
1,508,279
Community
Facilities
District
No.
5
,
Special
Tax
,
2015
,
5
%
,
9/01/45
............
2,630,000
2,636,425
City
of
Fremont
,
Community
Facilities
District
No.
1
,
Special
Tax
,
2015
,
Refunding
,
5
%
,
9/01/40
....
4,655,000
4,675,218
Community
Facilities
District
No.
1
,
Special
Tax
,
2015
,
Refunding
,
5
%
,
9/01/45
....
3,255,000
3,261,683
City
of
Galt
,
Community
Facilities
District
No.
2020-2
Improvement
Area
No.
1
,
Special
Tax
,
2025
B
,
5.125
%
,
9/01/45
...............................................
2,050,000
2,143,773
Community
Facilities
District
No.
2020-2
Improvement
Area
No.
1
,
Special
Tax
,
2025
B
,
5.25
%
,
9/01/50
................................................
3,230,000
3,353,386
Community
Facilities
District
No.
2020-2
Improvement
Area
No.
1
,
Special
Tax
,
2025
B
,
5.375
%
,
9/01/55
...............................................
7,180,000
7,504,071
City
of
Irvine
,
Community
Facilities
District
No.
2013-3
Improvement
Area
No.
8
,
Special
Tax
,
2018
,
5
%
,
9/01/43
.......................................
5,000,000
5,098,676
City
of
La
Verne
,
Copacabana
Mobilehome
Park
,
Revenue
,
2014
,
Refunding
,
5
%
,
6/15/49
.........................................................
1,765,000
1,765,500
City
of
Lincoln
,
Community
Facilities
District
No.
2025-1
,
Special
Tax
,
2025
,
5
%
,
9/01/50
........
550,000
555,149
Community
Facilities
District
No.
2025-1
,
Special
Tax
,
2025
,
5
%
,
9/01/55
........
775,000
775,102
Community
Facilities
District
No.
2025-1
,
Special
Tax
,
2025
,
5.05
%
,
9/01/55
......
360,000
360,856
City
of
Los
Angeles
,
Department
of
Airports
,
Revenue,
Sub.
Lien
,
2019
D
,
4
%
,
5/15/44
5,525,000
5,419,969
City
of
Manteca
,
Community
Facilities
District
2023-1
Improvement
Area
No.
1
,
Special
Tax
,
2024
,
5
%
,
9/01/44
........................................................
1,000,000
1,049,426
Community
Facilities
District
2023-1
Improvement
Area
No.
1
,
Special
Tax
,
2024
,
5
%
,
9/01/54
........................................................
1,580,000
1,607,921
Community
Facilities
District
2023-1
Improvement
Area
No.
2
,
Special
Tax
,
2024
,
5
%
,
9/01/44
........................................................
870,000
912,370
Community
Facilities
District
2023-1
Improvement
Area
No.
2
,
Special
Tax
,
2024
,
5
%
,
9/01/49
........................................................
1,320,000
1,352,232
Community
Facilities
District
2023-1
Improvement
Area
No.
2
,
Special
Tax
,
2024
,
5
%
,
9/01/54
........................................................
1,735,000
1,765,660
Community
Facilities
District
2023-1
Improvement
Area
No.
3
,
Special
Tax
,
2025
,
5
%
,
9/01/40
........................................................
165,000
177,666
Community
Facilities
District
2023-1
Improvement
Area
No.
3
,
Special
Tax
,
2025
,
5
%
,
9/01/45
........................................................
430,000
443,907
Community
Facilities
District
2023-1
Improvement
Area
No.
3
,
Special
Tax
,
2025
,
5
%
,
9/01/50
........................................................
750,000
761,115
Community
Facilities
District
2023-1
Improvement
Area
No.
3
,
Special
Tax
,
2025
,
5
%
,
9/01/55
........................................................
1,110,000
1,121,619
City
of
Mountain
House
,
Community
Facilities
District
No.
2024-1
Improvement
Area
No.
6
,
Special
Tax
,
2025
,
5.125
%
,
9/01/45
.................................................
420,000
436,651
Community
Facilities
District
No.
2024-1
Improvement
Area
No.
6
,
Special
Tax
,
2025
,
5.25
%
,
9/01/50
..................................................
765,000
785,799
Community
Facilities
District
No.
2024-1
Improvement
Area
No.
6
,
Special
Tax
,
2025
,
5.25
%
,
9/01/55
..................................................
1,000,000
1,017,258
Community
Facilities
District
No.
2024-1
Improvement
Area
No.
7
,
Special
Tax
,
2025
,
5.125
%
,
9/01/45
.................................................
400,000
416,144
Franklin
Municipal
Securities
Trust
Schedule
of
Investments
Franklin
California
High
Yield
Municipal
Fund
(continued)
Annual
Report
The
accompanying
notes
are
an
integral
part
of
these
financial
statements.
a
a
Principal
Amount
a
Value
a
a
a
a
a
Municipal
Bonds
(continued)
California
(continued)
City
of
Mountain
House,
(continued)
Community
Facilities
District
No.
2024-1
Improvement
Area
No.
7
,
Special
Tax
,
2025
,
5.25
%
,
9/01/50
..................................................
$
580,000
$
594,957
Community
Facilities
District
No.
2024-1
Improvement
Area
No.
7
,
Special
Tax
,
2025
,
5.25
%
,
9/01/55
..................................................
630,000
642,183
City
of
Ontario
,
Community
Facilities
District
No.
28
,
Special
Tax
,
2017
,
5
%
,
9/01/42
...........
1,000,000
1,013,664
Community
Facilities
District
No.
28
,
Special
Tax
,
2017
,
5
%
,
9/01/47
...........
500,000
503,322
City
of
Oroville
,
Oroville
Hospital
,
Revenue
,
2019
,
5.25
%
,
4/01/49
.........................
4,500,000
3,150,000
Oroville
Hospital
,
Revenue
,
2019
,
5.25
%
,
4/01/54
.........................
3,000,000
2,070,000
City
of
Palm
Desert
,
Community
Facilities
District
No.
2021-1
,
Special
Tax
,
2024
,
5
%
,
9/01/49
........
600,000
615,117
Community
Facilities
District
No.
2021-1
,
Special
Tax
,
2024
,
5
%
,
9/01/53
........
525,000
535,134
City
of
Rancho
Cordova
,
Arista
Del
Sol
Community
Facilities
District
No.
2022-1
Improvement
Area
No.
2
,
Special
Tax
,
2026
,
5
%
,
9/01/55
......................................
640,000
637,238
Community
Facilities
District
No.
2014-1
,
Special
Tax
,
2022
,
5
%
,
9/01/51
........
1,200,000
1,217,250
Ranch
Community
Facilities
District
No.
2021-1
Improvement
Area
No.
1
,
Special
Tax
,
2022
,
5.25
%
,
9/01/52
..........................................
2,000,000
2,057,660
Ranch
Community
Facilities
District
No.
2021-1
Improvement
Area
No.
2
,
Special
Tax
,
2025
,
5
%
,
9/01/40
............................................
360,000
383,899
Ranch
Community
Facilities
District
No.
2021-1
Improvement
Area
No.
2
,
Special
Tax
,
2025
,
5
%
,
9/01/45
............................................
565,000
582,067
Ranch
Community
Facilities
District
No.
2021-1
Improvement
Area
No.
2
,
Special
Tax
,
2025
,
5
%
,
9/01/50
............................................
750,000
760,070
Ranch
Community
Facilities
District
No.
2021-1
Improvement
Area
No.
2
,
Special
Tax
,
2025
,
5
%
,
9/01/54
............................................
240,000
242,902
Sunridge
North
Douglas
Community
Facilities
District
No.
2005-1
,
Special
Tax
,
2015
,
5
%
,
9/01/40
....................................................
1,200,000
1,201,053
Sunridge
North
Douglas
Community
Facilities
District
No.
2005-1
,
Special
Tax
,
2015
,
5
%
,
9/01/45
....................................................
1,250,000
1,250,564
City
of
Roseville
,
Amoruso
Ranch
Community
Facilities
District
1
Improvement
Area
No.
1
,
Special
Tax
,
2024
,
5
%
,
9/01/49
............................................
1,125,000
1,142,207
Amoruso
Ranch
Community
Facilities
District
1
Improvement
Area
No.
1
,
Special
Tax
,
2024
,
5
%
,
9/01/54
............................................
1,500,000
1,513,971
Creekview
Community
Facilities
District
No.
1
Improvement
Area
No.
1
,
Special
Tax
,
2020
,
5
%
,
9/01/45
................................................
1,280,000
1,312,231
Creekview
Community
Facilities
District
No.
1
Improvement
Area
No.
2
,
Special
Tax
,
2023
,
5
%
,
9/01/43
................................................
500,000
521,969
Creekview
Community
Facilities
District
No.
1
Improvement
Area
No.
2
,
Special
Tax
,
2023
,
5.25
%
,
9/01/53
.............................................
1,850,000
1,902,063
Creekview
Phase
5
Community
Facilities
District
No.
1
,
Special
Tax
,
2025
,
5
%
,
9/01/55
........................................................
1,375,000
1,378,275
c
Fiddyment
Ranch
Community
Facilities
District
No.
5
,
Special
Tax
,
144A,
2017
,
Refunding
,
5
%
,
9/01/32
............................................
1,265,000
1,300,215
c
Fiddyment
Ranch
Community
Facilities
District
No.
5
,
Special
Tax
,
144A,
2017
,
Refunding
,
5
%
,
9/01/47
............................................
6,500,000
6,541,322
HP
Campus
Oaks
Community
Facilities
District
No.
1
,
Special
Tax
,
2016
,
5
%
,
9/01/36
........................................................
1,950,000
1,964,824
HP
Campus
Oaks
Community
Facilities
District
No.
1
,
Special
Tax
,
2016
,
5.5
%
,
9/01/46
........................................................
6,415,000
6,446,751
SVSP
Westpark-Federico
Community
Facilities
District
No.
1
,
Special
Tax
,
2019
,
5
%
,
9/01/44
........................................................
1,000,000
1,019,595
Franklin
Municipal
Securities
Trust
Schedule
of
Investments
Franklin
California
High
Yield
Municipal
Fund
(continued)
The
accompanying
notes
are
an
integral
part
of
these
financial
statements.
Annual
Report
a
a
Principal
Amount
a
Value
a
a
a
a
a
Municipal
Bonds
(continued)
California
(continued)
City
of
Roseville,
(continued)
Torrente
at
Sierra
Vista
Community
Facilities
District
No.
1
,
Special
Tax
,
2023
,
6
%
,
9/01/53
........................................................
$
1,500,000
$
1,601,340
Villages
at
Sierra
Vista
Community
Facilities
District
No.
1
,
Special
Tax
,
2019
,
5
%
,
9/01/49
........................................................
3,870,000
3,922,117
Westbrook
Community
Facilities
District
No.
1
,
Special
Tax
,
2014
,
5
%
,
9/01/29
....
420,000
420,751
Westbrook
Community
Facilities
District
No.
1
,
Special
Tax
,
2014
,
5
%
,
9/01/34
....
1,100,000
1,101,583
Westbrook
Community
Facilities
District
No.
1
,
Special
Tax
,
2014
,
5
%
,
9/01/39
....
1,885,000
1,886,987
Westbrook
Community
Facilities
District
No.
1
,
Special
Tax
,
2014
,
5
%
,
9/01/44
....
1,650,000
1,650,898
Westbrook
Community
Facilities
District
No.
1
,
Special
Tax
,
2019
,
5
%
,
9/01/40
....
1,670,000
1,728,794
Westbrook
Community
Facilities
District
No.
1
,
Special
Tax
,
2019
,
5
%
,
9/01/49
....
2,130,000
2,156,625
City
of
Sacramento
,
Delta
Shores
Community
Facilities
District
No.
2019-01
Improvement
Area
No.
1
,
Special
Tax
,
2024
,
5
%
,
9/01/54
......................................
2,000,000
2,031,149
Greenbriar
Community
Facilities
District
No.
2018-03
Improvement
Area
No.
2
,
Special
Tax
,
2024
,
5
%
,
9/01/49
......................................
1,000,000
1,020,898
c
Natomas
Meadows
Community
Facilities
District
No.
2007-1
Area
No.
1
,
Special
Tax
,
144A,
2017
,
5
%
,
9/01/32
...........................................
300,000
306,308
c
Natomas
Meadows
Community
Facilities
District
No.
2007-1
Area
No.
1
,
Special
Tax
,
144A,
2017
,
5
%
,
9/01/37
...........................................
710,000
718,551
c
Natomas
Meadows
Community
Facilities
District
No.
2007-1
Area
No.
1
,
Special
Tax
,
144A,
2017
,
5
%
,
9/01/47
...........................................
1,900,000
1,910,713
City
of
San
Diego
,
Tobacco
Settlement
Revenue
Funding
Corp.
,
Revenue,
Sub.
Lien
,
2018
C
,
Refunding
,
4
%
,
6/01/32
.......................................
225,000
227,888
City
of
San
Francisco
,
5.25
%
,
9/01/49
....................................
11,500,000
10,491,057
City
of
South
San
Francisco
,
Community
Facilities
District
No.
2021-01
,
Special
Tax
,
2025
,
5
%
,
9/01/40
.......
375,000
403,221
Community
Facilities
District
No.
2021-01
,
Special
Tax
,
2025
,
5
%
,
9/01/45
.......
600,000
624,058
Community
Facilities
District
No.
2021-01
,
Special
Tax
,
2025
,
5.125
%
,
9/01/50
....
1,000,000
1,031,047
Community
Facilities
District
No.
2021-01
,
Special
Tax
,
2025
,
5.25
%
,
9/01/55
.....
1,500,000
1,552,363
City
of
Stockton
,
Community
Facilities
District
No.
2018-2
Improvement
Area
No.
2
,
Special
Tax
,
2022
,
5.125
%
,
9/01/52
....................................
3,660,000
3,736,078
City
of
Vacaville
,
Community
Facilities
District
No.
13
Improvement
Area
No.
1
,
Special
Tax
,
2025
A
,
5
%
,
9/01/35
....................................................
390,000
420,964
Community
Facilities
District
No.
13
Improvement
Area
No.
1
,
Special
Tax
,
2025
A
,
5
%
,
9/01/40
....................................................
375,000
396,248
Community
Facilities
District
No.
13
Improvement
Area
No.
1
,
Special
Tax
,
2025
A
,
5
%
,
9/01/45
....................................................
810,000
829,875
Community
Facilities
District
No.
13
Improvement
Area
No.
1
,
Special
Tax
,
2025
A
,
5.125
%
,
9/01/50
.................................................
1,225,000
1,240,562
Community
Facilities
District
No.
13
Improvement
Area
No.
1
,
Special
Tax
,
2025
A
,
5.25
%
,
9/01/55
..................................................
1,475,000
1,503,926
City
of
Vernon
,
Electric
System
,
Revenue
,
2020
A
,
Refunding
,
5
%
,
8/01/36
........
1,525,000
1,632,826
City
of
Wildomar
,
Community
Facilities
District
No.
2023-1
,
Special
Tax
,
2026
,
5
%
,
9/01/55
.........................................................
550,000
559,225
f
Clovis
Unified
School
District
,
GO
,
2004
A
,
NATL
Insured
,
ETM,
2.33
%,
8/01/27
..........................
1,205,000
1,166,175
GO
,
2004
A
,
NATL
Insured
,
2.29
%,
8/01/27
..............................
6,295,000
6,095,260
GO
,
2004
A
,
NATL
Insured
,
2.35
%,
8/01/28
..............................
3,000,000
2,835,667
c
CMFA
Special
Finance
Agency
,
Solana
at
Grand
,
Revenue,
Junior
Lien
,
144A,
2021
A-2
,
4
%
,
8/01/45
..................................................
13,845,000
12,687,227
c
CMFA
Special
Finance
Agency
Enclave
,
Revenue,
Junior
Lien
,
144A,
2022
A-2
,
4.5
%
,
8/01/51
.........................................................
39,885,000
28,289,844
c
CMFA
Special
Finance
Agency
I
,
Mix
at
CTR
City
(The)
,
Revenue
,
144A,
2021
A-T
,
5
%
,
4/01/41
.........................................................
7,545,000
7,208,935
Franklin
Municipal
Securities
Trust
Schedule
of
Investments
Franklin
California
High
Yield
Municipal
Fund
(continued)
Annual
Report
The
accompanying
notes
are
an
integral
part
of
these
financial
statements.
a
a
Principal
Amount
a
Value
a
a
a
a
a
Municipal
Bonds
(continued)
California
(continued)
c
CMFA
Special
Finance
Agency
XII
,
Allure
Apartments
,
Revenue
,
144A,
2022
A-2
,
4.375
%
,
8/01/49
...................................................
$
30,280,000
$
26,185,938
f
Coachella
Valley
Unified
School
District
,
GO
,
2012
D
,
AG
Insured
,
3.91
%,
8/01/42
................................
8,500,000
4,526,849
GO
,
2012
D
,
AG
Insured
,
4.03
%,
8/01/43
................................
3,000,000
1,506,283
County
of
Imperial
,
Community
Facilities
District
No.
1998-1
,
Special
Tax
,
1999
,
LOC
BNP
Paribas
SA
,
6.5
%
,
9/01/31
.......................................
3,095,000
3,141,783
County
of
Madera
,
Community
Facilities
District
No.
2021-1
Improvement
Area
No.
1
,
Special
Tax
,
2022
,
5.875
%
,
9/01/53
.................................................
1,100,000
1,150,255
Community
Facilities
District
No.
2021-1
Improvement
Area
No.
2
,
Special
Tax
,
2022
,
5.75
%
,
9/01/53
..................................................
3,080,000
3,222,156
Community
Facilities
District
No.
2021-1
Improvement
Area
No.
2
,
Special
Tax
,
2022
,
5.875
%
,
9/01/53
.................................................
1,100,000
1,150,254
County
of
Sacramento
,
Airport
System
,
Revenue
,
2024
,
5.25
%
,
7/01/49
...........................
3,000,000
3,256,905
Airport
System
,
Revenue
,
2024
,
5
%
,
7/01/54
.............................
7,000,000
7,372,289
Airport
System
,
Revenue
,
2024
,
5.25
%
,
7/01/54
...........................
8,000,000
8,576,227
Airport
System
,
Revenue
,
2025
D
,
AG
Insured
,
5.25
%
,
7/01/55
...............
10,000,000
10,427,656
County
of
San
Bernardino
,
Community
Facilities
District
No.
2006-1
Area
No.
1
,
Special
Tax
,
2015
,
Refunding
,
5
%
,
9/01/40
....................................................
1,000,000
1,000,870
Community
Facilities
District
No.
2006-1
Area
No.
1
,
Special
Tax
,
2015
,
Refunding
,
5
%
,
9/01/45
....................................................
1,000,000
1,000,387
c
CSCDA
Community
Improvement
Authority
,
Crescent
(The)
,
Revenue
,
144A,
2022
B
,
5.5
%
,
7/01/59
.....................
16,000,000
13,089,467
Park
Crossing
Apartments
,
Revenue
,
144A,
2021
B
,
4
%
,
12/01/48
.............
10,000,000
8,078,494
Theo
Apartments
,
Revenue
,
144A,
2021
B
,
4
%
,
5/01/57
.....................
10,000,000
7,226,584
Wood
Creek
Apartments
,
Revenue,
Sub.
Lien
,
144A,
2021
B
,
4
%
,
12/01/59
......
31,800,000
18,596,042
Daly
City
Housing
Development
Finance
Agency
,
Franciscan
Park
LLC
,
Revenue,
Sub.
Lien
,
2007
B
,
Refunding
,
5.85
%
,
12/15/47
...............................
4,120,000
4,124,134
Del
Mar
Race
Track
Authority
,
Revenue
,
2015
,
Refunding
,
5
%
,
10/01/35
..........
2,000,000
2,006,727
f
Duarte
Redevelopment
Agency
,
Tax
Allocation,
Sub.
Lien
,
1999
,
ETM,
4.32
%,
12/01/28
3,665,000
3,261,536
f
El
Rancho
Unified
School
District
,
GO
,
2004
,
NATL
Insured
,
2.6
%,
8/01/29
........
2,400,000
2,198,461
c
Elsinore
Valley
Municipal
Water
District
,
Community
Facilities
District
No.
2020-1
Area
No.
2A
,
Special
Tax
,
144A,
2021
A
,
4
%
,
9/01/51
....................................................
1,245,000
1,084,482
Community
Facilities
District
No.
2020-1
Area
No.
3A
,
Special
Tax
,
144A,
2021
A
,
4.5
%
,
9/01/51
...................................................
2,500,000
2,365,682
Fairfield
Community
Facilities
District
,
c
City
of
Fairfield
Community
Facilities
District
No.
2019-1
Improvement
Area
No.
1
,
Special
Tax
,
144A,
2020
A
,
5
%
,
9/01/35
...............................
1,000,000
1,069,928
c
City
of
Fairfield
Community
Facilities
District
No.
2019-1
Improvement
Area
No.
1
,
Special
Tax
,
144A,
2020
A
,
5
%
,
9/01/50
...............................
5,255,000
5,312,791
Community
Facilities
District
No.
2023-1
Improvement
Area
No.
1
,
Special
Tax
,
2024
A
,
5
%
,
9/01/54
..................................................
9,630,000
9,746,431
h
,i
FHLMC,
Multi-family
ML
Pass-Through
Certificates
,
FRN
,
2019-ML06
,
XCA
,
1.105
%
,
7/25/35
................................
127,820,580
6,762,987
c
Revenue
,
144A,
FRN
,
2020-ML07
,
XCA
,
2.133
%
,
1/25/37
...................
115,915,168
13,824,043
Folsom
Ranch
Financing
Authority
,
City
of
Folsom
Community
Facilities
District
No.
19
,
Special
Tax
,
2017
,
5
%
,
9/01/47
1,000,000
1,007,076
City
of
Folsom
Community
Facilities
District
No.
20
,
Special
Tax
,
2018
,
5
%
,
9/01/33
530,000
546,569
City
of
Folsom
Community
Facilities
District
No.
20
,
Special
Tax
,
2018
,
5
%
,
9/01/48
1,675,000
1,686,072
Foothill-Eastern
Transportation
Corridor
Agency
,
f
Revenue
,
2013
A
,
Refunding
,
3.84
%,
1/15/42
.............................
75,000,000
41,203,785
Franklin
Municipal
Securities
Trust
Schedule
of
Investments
Franklin
California
High
Yield
Municipal
Fund
(continued)
The
accompanying
notes
are
an
integral
part
of
these
financial
statements.
Annual
Report
a
a
Principal
Amount
a
Value
a
a
a
a
a
Municipal
Bonds
(continued)
California
(continued)
Foothill-Eastern
Transportation
Corridor
Agency,
(continued)
Revenue
,
2013
B-1
,
Refunding
,
3.95
%
,
1/15/53
...........................
$
23,000,000
$
21,100,016
Revenue
,
2013
B-2
,
Refunding
,
3.5
%
,
1/15/53
............................
15,500,000
13,050,675
f
Revenue
,
2015
A
,
Refunding
,
2.72
%,
1/15/33
.............................
19,000,000
15,799,070
g
Fremont
Union
High
School
District
,
GO
,
2026
,
4.125
%
,
8/01/50
................
5,500,000
5,440,408
Galt
Community
Facilities
District
,
City
of
Galt
Community
Facilities
District
No.
2020-2
Improvement
Area
No.
1
,
Special
Tax
,
2023
A
,
5.5
%
,
9/01/43
...................................
1,860,000
2,001,271
City
of
Galt
Community
Facilities
District
No.
2020-2
Improvement
Area
No.
1
,
Special
Tax
,
2023
A
,
5.75
%
,
9/01/48
..................................
2,945,000
3,147,421
City
of
Galt
Community
Facilities
District
No.
2020-2
Improvement
Area
No.
1
,
Special
Tax
,
2023
A
,
6
%
,
9/01/53
....................................
2,895,000
3,096,673
c
Golden
State
Connect
Authority
,
Revenue
,
144A,
2025
,
6.5
%
,
12/01/60
...........
22,000,000
22,249,451
f
Hanford
Joint
Union
High
School
District
,
GO
,
B
,
AG
Insured
,
2.62
%,
8/01/32
....................................
3,635,000
3,079,309
GO
,
B
,
AG
Insured
,
2.72
%,
8/01/33
....................................
3,705,000
3,036,281
GO
,
B
,
AG
Insured
,
2.94
%,
8/01/35
....................................
4,120,000
3,136,302
f
Hartnell
Community
College
District
,
GO
,
2009
D
,
4.32
%,
8/01/49
...............
10,000,000
3,713,588
Independent
Cities
Finance
Authority
,
Augusta
Communities
III
LLC
,
Revenue
,
2021
,
Refunding
,
4
%
,
11/15/56
........
8,160,000
6,111,162
Augusta
Communities
IV
LLC
,
Revenue
,
2024
A
,
5
%
,
11/15/45
...............
1,685,000
1,687,265
Augusta
Communities
IV
LLC
,
Revenue
,
2024
A
,
5
%
,
11/15/50
...............
2,160,000
2,088,320
Augusta
Communities
IV
LLC
,
Revenue
,
2024
A
,
5
%
,
11/15/59
...............
5,540,000
5,205,051
COACH
of
San
Diego
LLC
,
Revenue
,
2014
A
,
Refunding
,
5.25
%
,
5/15/44
.......
2,015,000
2,016,608
COACH
of
San
Diego
LLC
,
Revenue
,
2014
A
,
Refunding
,
5.25
%
,
5/15/49
.......
4,800,000
4,802,424
Millennium
Housing
LLC
,
Revenue
,
2015
,
Refunding
,
5
%
,
8/15/45
.............
5,000,000
5,002,808
Millennium
Housing
LLC
,
Revenue
,
2015
,
Refunding
,
5
%
,
8/15/50
.............
4,900,000
4,901,400
Millennium
Housing
LLC
,
Revenue
,
2021
,
Refunding
,
3
%
,
5/15/56
.............
4,000,000
2,832,652
Millennium
Housing
of
California
,
Revenue
,
2019
,
Refunding
,
5
%
,
5/15/48
.......
1,000,000
1,011,830
Inland
Valley
Development
Agency
,
Tax
Allocation
,
2014
A
,
Refunding
,
5.25
%
,
9/01/37
.........................
7,500,000
7,567,910
Tax
Allocation
,
2014
A
,
Refunding
,
5
%
,
9/01/44
...........................
9,000,000
9,079,688
Irvine
Facilities
Financing
Authority
,
City
of
Irvine
Community
Facilities
District
No.
2013-3
,
Special
Tax
,
2023
A
,
BAM
Insured
,
4
%
,
9/01/58
.....................
6,500,000
6,009,915
Irvine
Unified
School
District
,
Community
Facilities
District
No.
09-1
,
Special
Tax
,
2017
B
,
5
%
,
9/01/42
........
995,000
1,006,864
Community
Facilities
District
No.
09-1
,
Special
Tax
,
2017
C
,
5
%
,
9/01/47
........
995,000
996,904
Community
Facilities
District
No.
09-1
,
Special
Tax
,
2018
A
,
Refunding
,
5
%
,
9/01/49
3,975,000
3,998,955
Kaweah
Delta
Health
Care
District
Guild
,
Revenue
,
2015
B
,
5
%
,
6/01/40
..........
1,250,000
1,249,948
Lake
Tahoe
Unified
School
District
,
GO
,
2012
,
5.3
%
,
8/01/40
...................
1,140,000
1,254,901
Lammersville
Joint
Unified
School
District
,
Community
Facilities
District
No.
2014-1
Improvement
Area
No.
1
,
Special
Tax
,
2017
,
5
%
,
9/01/42
....................................................
2,750,000
2,786,777
Community
Facilities
District
No.
2024-1
,
Special
Tax
,
2025
,
5
%
,
9/01/45
........
2,000,000
2,077,056
Community
Facilities
District
No.
2024-1
,
Special
Tax
,
2025
,
5.125
%
,
9/01/50
.....
3,750,000
3,875,128
Community
Facilities
District
No.
2024-1
,
Special
Tax
,
2025
,
5.25
%
,
9/01/55
......
5,250,000
5,461,727
f
Las
Virgenes
Unified
School
District
,
GO
,
2011
C
,
6.678
%,
8/01/33
..............
8,050,000
9,905,891
Lemon
Grove
Community
Development
Agency
Successor
Agency
,
Tax
Allocation
,
2014
,
Refunding
,
AG
Insured
,
4
%
,
8/01/34
...............................
1,000,000
1,039,807
f
Lemon
Grove
School
District
,
GO
,
2010
B
,
AG
Insured
,
6.037
%,
8/01/45
..........
6,500,000
6,792,852
Long
Beach
Bond
Finance
Authority
,
Revenue
,
2007
A
,
5
%
,
11/15/29
............
4,630,000
5,026,167
Long
Beach
Community
College
District
,
GO
,
2025
E
,
5
%
,
8/01/52
..............
2,000,000
2,139,438
Los
Alamitos
Unified
School
District
,
COP
,
2012
,
5.95
%
,
8/01/34
..........................................
1,500,000
1,682,296
COP
,
2012
,
6.05
%
,
8/01/42
..........................................
4,500,000
4,931,329
Franklin
Municipal
Securities
Trust
Schedule
of
Investments
Franklin
California
High
Yield
Municipal
Fund
(continued)
Annual
Report
The
accompanying
notes
are
an
integral
part
of
these
financial
statements.
a
a
Principal
Amount
a
Value
a
a
a
a
a
Municipal
Bonds
(continued)
California
(continued)
Los
Angeles
Department
of
Water
,
Revenue
,
2020
A
,
Refunding
,
5
%
,
7/01/50
......
$
18,805,000
$
19,329,720
Los
Angeles
Department
of
Water
&
Power
,
Power
System
,
Revenue
,
2025
A
,
Refunding
,
5
%
,
7/01/50
...................
10,000,000
10,520,013
g
Power
System
,
Revenue
,
2025
D
,
Refunding
,
5.25
%
,
7/01/56
................
9,175,000
9,780,072
Water
System
,
Revenue
,
2021
B
,
Refunding
,
5
%
,
7/01/46
...................
15,080,000
15,768,180
Water
System
,
Revenue
,
2022
D
,
Refunding
,
5
%
,
7/01/47
...................
12,090,000
12,755,573
g
Water
System
,
Revenue
,
2025
C
,
Refunding
,
5
%
,
7/01/52
...................
10,000,000
10,494,028
c
Los
Angeles
Housing
Authority
,
Housing
Pathways,
Inc.
,
Revenue
,
144A,
2024
B
,
6
%
,
12/01/62
........................................................
33,500,000
32,622,310
Los
Angeles
Unified
School
District
,
GO
,
2024
QRR
,
4
%
,
7/01/49
.........................................
10,000,000
9,896,461
GO
,
2024
QRR
,
5.25
%
,
7/01/49
.......................................
9,945,000
10,893,510
GO
,
2025
A-1
,
5
%
,
7/01/49
..........................................
10,000,000
10,788,915
Mendocino-Lake
Community
College
District
,
GO
,
2011
B
,
AG
Insured
,
6.55
%
,
8/01/36
................................
5,150,000
6,256,879
f
GO
,
2011
B
,
AG
Insured
,
6.775
%,
8/01/40
...............................
7,500,000
9,660,620
Menifee
Union
School
District
,
Community
Facilities
District
No.
2011-1
Improvement
Area
No.
3
,
Special
Tax
,
2018
,
5
%
,
9/01/43
....................................................
1,000,000
1,022,116
Community
Facilities
District
No.
2011-1
Improvement
Area
No.
3
,
Special
Tax
,
2018
,
5
%
,
9/01/48
....................................................
1,500,000
1,518,720
Middle
Fork
Project
Finance
Authority
,
Revenue
,
2020
,
Refunding
,
5
%
,
4/01/34
.................................
1,100,000
1,180,682
Revenue
,
2020
,
Refunding
,
5
%
,
4/01/35
.................................
1,150,000
1,230,118
Moreno
Valley
Unified
School
District
,
Community
Facilities
District
No.
2015-3
,
Special
Tax
,
2019
,
4.125
%
,
9/01/48
..........................................
360,000
328,351
Mountain
House
Community
Facilities
District
,
City
of
Mountain
House
Community
Facilities
District
No.
2024-1
Improvement
Area
No.
1
,
Special
Tax
,
2025
,
5
%
,
9/01/40
.................................
500,000
532,454
City
of
Mountain
House
Community
Facilities
District
No.
2024-1
Improvement
Area
No.
1
,
Special
Tax
,
2025
,
5
%
,
9/01/45
.................................
1,000,000
1,023,135
City
of
Mountain
House
Community
Facilities
District
No.
2024-1
Improvement
Area
No.
1
,
Special
Tax
,
2025
,
5
%
,
9/01/50
.................................
2,125,000
2,144,673
City
of
Mountain
House
Community
Facilities
District
No.
2024-1
Improvement
Area
No.
1
,
Special
Tax
,
2025
,
5
%
,
9/01/55
.................................
3,600,000
3,617,760
M-S-R
Energy
Authority
,
Revenue
,
2009
B
,
6.5
%
,
11/01/39
....................
32,300,000
40,462,068
f
Newman-Crows
Landing
Unified
School
District
,
GO
,
2008
B
,
AG
Insured
,
0.414
%,
8/01/49
.........................................................
2,290,000
2,127,176
Norman
Y
Mineta
San
Jose
International
Airport
SJC
,
Revenue
,
2017
A
,
Refunding
,
BAM
Insured
,
4
%
,
3/01/42
...........................................
5,000,000
5,006,288
Oak
Park
Unified
School
District
,
GO
,
2011
A
,
7.1
%
,
8/01/38
...................
6,600,000
8,148,567
Orange
County
Community
Facilities
District
,
County
of
Orange
Community
Facilities
District
No.
2015-1
,
Special
Tax
,
2015
A
,
5
%
,
8/15/34
........................................................
1,495,000
1,497,299
County
of
Orange
Community
Facilities
District
No.
2015-1
,
Special
Tax
,
2015
A
,
5.25
%
,
8/15/45
..................................................
4,880,000
4,886,613
County
of
Orange
Community
Facilities
District
No.
2017-1
Area
No.
1
,
Special
Tax
,
2018
A
,
5
%
,
8/15/47
..............................................
9,550,000
9,625,126
Palomar
Health
,
Obligated
Group
,
Revenue
,
2016
,
Refunding
,
5
%
,
11/01/39
..................
12,190,000
12,081,081
Palomar
Health
Obligated
Group
,
COP
,
4
%
,
11/01/38
.......................
5,000,000
4,405,907
Palomar
Health
Obligated
Group
,
COP
,
4
%
,
11/01/47
.......................
6,000,000
4,516,125
f
Paso
Robles
Joint
Unified
School
District
,
GO
,
2010
A
,
4.46
%,
9/01/45
...........
15,000,000
6,402,837
Perris
Community
Facilities
District
,
City
of
Perris
Community
Facilities
District
No.
2001-2
,
Special
Tax
,
2014
A
,
Refunding
,
5.25
%
,
9/01/32
....................
4,500,000
4,508,579
Franklin
Municipal
Securities
Trust
Schedule
of
Investments
Franklin
California
High
Yield
Municipal
Fund
(continued)
The
accompanying
notes
are
an
integral
part
of
these
financial
statements.
Annual
Report
a
a
Principal
Amount
a
Value
a
a
a
a
a
Municipal
Bonds
(continued)
California
(continued)
Perris
Joint
Powers
Authority
,
Community
Facilities
District
No.
2001-1
,
Special
Tax
,
2014
E
,
Refunding
,
4.25
%
,
9/01/38
........................................................
$
4,120,000
$
4,119,972
Community
Facilities
District
No.
2014-1
Improvement
Area
No.
2
,
Special
Tax
,
2018
A
,
4
%
,
9/01/48
..................................................
1,530,000
1,371,223
Rancho
Mirage
Community
Facilities
District
,
Community
Facilities
District
No.
5
Improvement
Area
No.
1
,
Special
Tax
,
2024
A
,
5
%
,
9/01/44
....................................................
2,200,000
2,291,246
Community
Facilities
District
No.
5
Improvement
Area
No.
1
,
Special
Tax
,
2024
A
,
5
%
,
9/01/49
....................................................
1,500,000
1,525,039
Community
Facilities
District
No.
5
Improvement
Area
No.
1
,
Special
Tax
,
2024
A
,
5
%
,
9/01/54
....................................................
1,400,000
1,416,927
Redondo
Beach
Unified
School
District
,
GO
,
2011
E
,
6.2
%
,
8/01/31
..............
2,750,000
3,245,151
f
Richland
School
District
,
GO
,
2009
C
,
AG
Insured
,
4.92
%,
8/01/49
..............
22,000,000
7,135,902
Rio
Hondo
Community
College
District
,
GO
,
2010
C
,
6.85
%
,
8/01/42
.............
13,000,000
16,519,290
Rio
Vista
Community
Facilities
District
,
City
of
Rio
Vista
Community
Facilities
District
No.
2018-1
,
Special
Tax
,
2018
,
Refunding
,
5
%
,
9/01/33
............................................
1,625,000
1,675,642
City
of
Rio
Vista
Community
Facilities
District
No.
2018-1
,
Special
Tax
,
2018
,
Refunding
,
5
%
,
9/01/48
............................................
1,190,000
1,200,654
River
Islands
Public
Financing
Authority
,
Community
Facilities
District
2023-1
Area
No.
1
,
Special
Tax
,
2023
,
5
%
,
9/01/38
...
500,000
535,231
Community
Facilities
District
2023-1
Area
No.
1
,
Special
Tax
,
2023
,
5.5
%
,
9/01/43
.
2,000,000
2,140,794
Community
Facilities
District
2023-1
Area
No.
1
,
Special
Tax
,
2023
,
5.5
%
,
9/01/48
.
3,090,000
3,211,790
Community
Facilities
District
2023-1
Area
No.
1
,
Special
Tax
,
2023
,
5.625
%
,
9/01/53
4,830,000
5,016,322
Community
Facilities
District
2023-1
Improvement
Area
No.
3
,
Special
Tax
,
2025
,
Refunding
,
5
%
,
9/01/50
............................................
5,000,000
5,027,920
Community
Facilities
District
2023-1
Improvement
Area
No.
3
,
Special
Tax
,
2025
,
Refunding
,
5
%
,
9/01/55
............................................
14,600,000
14,581,408
Community
Facilities
District
No
2003-1
Improvement
Area
No.
2
,
Special
Tax
,
2022
,
5.75
%
,
9/01/52
..................................................
4,250,000
4,415,570
Community
Facilities
District
No.
2016-1
,
Special
Tax
,
2025
,
AG
Insured
,
5
%
,
9/01/55
2,315,000
2,443,127
Community
Facilities
District
No.
2020-1
Public
Improvements
,
Special
Tax
,
2025
,
AG
Insured
,
5
%
,
9/01/55
..............................................
4,000,000
4,221,386
Community
Facilities
District
No.
2021-1
,
Special
Tax
,
2021
,
2.625
%
,
9/01/34
.....
860,000
780,769
Community
Facilities
District
No.
2021-1
,
Special
Tax
,
2021
,
2.625
%
,
9/01/35
.....
925,000
824,401
Community
Facilities
District
No.
2021-1
,
Special
Tax
,
2021
,
4
%
,
9/01/46
........
1,495,000
1,290,537
Community
Facilities
District
No.
2023-1
Improvement
Area
No.
2
,
Special
Tax
,
2024
,
5
%
,
9/01/48
....................................................
1,650,000
1,665,209
Community
Facilities
District
No.
2023-1
Improvement
Area
No.
2
,
Special
Tax
,
2024
,
5
%
,
9/01/54
....................................................
2,625,000
2,625,923
f
Riverbank
Unified
School
District
,
GO
,
2008
B
,
AG
Insured
,
3.73
%,
8/01/38
................................
6,690,000
4,243,547
GO
,
2008
B
,
AG
Insured
,
4.19
%,
8/01/43
................................
8,750,000
4,277,941
Riverside
County
Community
Facilities
Districts
,
County
of
Riverside
Community
Facilities
District
No.
03-1
,
Special
Tax
,
2014
,
Refunding
,
5
%
,
9/01/30
..........
1,500,000
1,513,434
f
Riverside
County
Transportation
Commission
,
Revenue,
Senior
Lien
,
2013
B
,
4.27
%,
6/01/43
.........................................................
7,500,000
3,643,708
Romoland
School
District
,
Community
Facilities
District
No.
2004-1
,
Special
Tax
,
2015
,
Refunding
,
5
%
,
9/01/35
4,690,000
4,696,216
Community
Facilities
District
No.
2004-1
,
Special
Tax
,
2015
,
Refunding
,
5
%
,
9/01/38
3,000,000
3,003,453
Community
Facilities
District
No.
2004-1
Improvement
Area
No.
3
,
Special
Tax
,
2013
,
5
%
,
9/01/36
....................................................
1,500,000
1,501,892
f
Rowland
Unified
School
District
,
GO
,
2009
B
,
3.39
%,
8/01/34
.........................................
5,000,000
3,774,672
GO
,
2009
B
,
3.76
%,
8/01/39
.........................................
15,000,000
9,144,345
Franklin
Municipal
Securities
Trust
Schedule
of
Investments
Franklin
California
High
Yield
Municipal
Fund
(continued)
Annual
Report
The
accompanying
notes
are
an
integral
part
of
these
financial
statements.
a
a
Principal
Amount
a
Value
a
a
a
a
a
Municipal
Bonds
(continued)
California
(continued)
f
Rowland
Unified
School
District,
(continued)
GO
,
2009
B
,
3.65
%,
8/01/42
.........................................
$
10,750,000
$
5,970,062
f
San
Bernardino
Community
College
District
,
GO
,
2009
B
,
4.24
%,
8/01/44
.........
12,495,000
5,810,861
San
Diego
Unified
School
District
,
f
GO
,
2010
C
,
6.52
%,
7/01/47
.........................................
26,025,000
26,019,186
f
GO
,
2012
E
,
4.856
%,
7/01/42
.........................................
6,940,000
6,147,276
f
GO
,
2012
E
,
5.299
%,
7/01/47
.........................................
13,500,000
11,228,162
GO
,
2025
C-3
,
5
%
,
7/01/50
..........................................
4,910,000
5,278,801
San
Francisco
Bay
Area
Rapid
Transit
District
,
GO
,
2020
C-1
,
4
%
,
8/01/45
........
17,760,000
17,828,713
San
Francisco
City
&
County
Airport
Comm-San
Francisco
International
Airport
,
Revenue
,
2019
A
,
5
%
,
5/01/37
........................................
5,535,000
5,865,660
Revenue
,
2019
A
,
5
%
,
5/01/44
........................................
10,000,000
10,303,056
Revenue
,
2019
A
,
5
%
,
5/01/49
........................................
10,000,000
10,154,495
Revenue,
Second
Series
,
2019
E
,
5
%
,
5/01/50
............................
34,520,000
34,965,090
Revenue,
Second
Series
,
2022
B
,
Refunding
,
5
%
,
5/01/52
...................
5,250,000
5,499,122
Revenue,
Second
Series
,
2024
A
,
Refunding
,
5.25
%
,
5/01/44
.................
8,605,000
9,423,050
Revenue,
Second
Series
,
2024
A
,
Refunding
,
5.25
%
,
5/01/49
.................
350,000
370,719
Revenue,
Second
Series
,
2025
A
,
5.25
%
,
5/01/55
.........................
6,045,000
6,378,198
Revenue,
Second
Series
,
2025
A
,
5.5
%
,
5/01/55
..........................
10,000,000
10,768,271
San
Francisco
City
&
County
Public
Utilities
Commission
,
Wastewater
,
Revenue
,
2024
C
,
5
%
,
10/01/54
...................................................
10,000,000
10,649,023
San
Francisco
City
&
County
Redevelopment
Agency
Successor
Agency
,
Mission
Bay
South
Redevelopment
Area
Tax
Increment
Financing
District
,
Tax
Allocation
,
2014
A
,
5
%
,
8/01/43
......................................................
2,500,000
2,502,215
San
Joaquin
Hills
Transportation
Corridor
Agency
,
f
Revenue
,
1997
A
,
Refunding
,
NATL
Insured
,
3.05
%,
1/15/32
.................
50,225,000
42,084,201
f
Revenue,
Junior
Lien
,
ETM,
1.98
%,
1/01/28
..............................
19,150,000
18,472,326
Revenue,
Junior
Lien
,
2014
B
,
Refunding
,
5.25
%
,
1/15/44
...................
1,125,000
1,125,835
Revenue,
Junior
Lien
,
2014
B
,
Refunding
,
5.25
%
,
1/15/49
...................
13,790,000
13,798,384
e
San
Joaquin
Valley
Clean
Energy
Authority
,
Revenue
,
2025
A
,
Mandatory
Put
,
5.5
%
,
7/01/35
.........................................................
21,250,000
24,224,756
c,f
Santa
Barbara
Housing
Authority
,
Revenue
,
144A,
2025
A-S
,
7.95
%,
5/01/44
......
15,000,000
3,735,561
Santa
Barbara
Unified
School
District
,
GO
,
2011
A
,
7
%
,
8/01/36
................
8,000,000
10,623,770
f
Siskiyou
Union
High
School
District
,
GO
,
2009
B
,
AG
Insured
,
4.93
%,
8/01/49
......
15,015,000
4,865,635
St.
Helena
Unified
School
District
,
GO
,
2011
B
,
6.45
%
,
6/01/36
.................
10,000,000
13,289,936
State
of
California
,
GO
,
Refunding
,
4.125
%
,
3/01/45
......................................
12,000,000
12,288,357
g
GO
,
4.125
%
,
3/01/49
...............................................
5,500,000
5,535,445
g
GO
,
5
%
,
3/01/55
..................................................
8,000,000
8,575,641
State
of
California
Department
of
Water
Resources
,
Water
Supply
,
Revenue
,
2026
A
,
5
%
,
12/01/56
.....................................................
15,000,000
16,111,644
Stockton
Community
Facilities
District
,
Community
Facilities
District
No.
2018-2
Improvement
Area
No.
4
,
Special
Tax
,
2025
,
5
%
,
9/01/45
....................................................
1,000,000
1,031,504
Community
Facilities
District
No.
2018-2
Improvement
Area
No.
4
,
Special
Tax
,
2025
,
5
%
,
9/01/50
....................................................
1,500,000
1,522,019
Community
Facilities
District
No.
2018-2
Improvement
Area
No.
4
,
Special
Tax
,
2025
,
5
%
,
9/01/55
....................................................
1,550,000
1,563,037
Sulphur
Springs
Union
School
District
,
Community
Facilities
District
No.
2006-1
,
Special
Tax
,
2018
,
5
%
,
9/01/43
.......................................
2,820,000
2,857,321
f
Susanville
School
District
,
GO
,
2010
,
AG
Insured
,
4.91
%,
8/01/49
...............
17,505,000
5,695,120
Tejon
Ranch
Public
Facilities
Finance
Authority
,
Tejon
Industrial
Complex
Public
Improvements
–
East
Community
Facilities
District
No.
2008-1
,
Special
Tax
,
2024
A
,
Refunding
,
5
%
,
9/01/54
.............................................
2,250,000
2,266,283
Franklin
Municipal
Securities
Trust
Schedule
of
Investments
Franklin
California
High
Yield
Municipal
Fund
(continued)
The
accompanying
notes
are
an
integral
part
of
these
financial
statements.
Annual
Report
a
a
Principal
Amount
a
Value
a
a
a
a
a
Municipal
Bonds
(continued)
California
(continued)
Temescal
Valley
Water
District
,
Community
Facilities
District
No.
4
Improvement
Area
No.
3
,
Special
Tax
,
2024
,
5
%
,
9/01/44
........................................................
$
600,000
$
631,839
Community
Facilities
District
No.
4
Improvement
Area
No.
3
,
Special
Tax
,
2024
,
5
%
,
9/01/54
........................................................
1,185,000
1,205,941
Three
Rivers
Levee
Improvement
Authority
,
Special
Tax
,
2021
B
,
Refunding
,
4
%
,
9/01/51
.........................................................
2,710,000
2,429,771
Tobacco
Securitization
Authority
of
Southern
California
,
f
San
Diego
County
Tobacco
Asset
Securitization
Corp.
,
Revenue
,
2006
C
,
9.07
%,
6/01/46
........................................................
23,500,000
4,047,116
San
Diego
County
Tobacco
Asset
Securitization
Corp.
,
Revenue
,
2019
B-1
,
2
,
Refunding
,
5
%
,
6/01/48
............................................
5,890,000
5,885,628
f
Torrance
Unified
School
District
,
GO
,
2009
B-1
,
4.63
%,
8/01/34
.................
5,095,000
3,479,396
Tracy
Community
Facilities
District
,
City
of
Tracy
Community
Facilities
District
No.
2016-01
Improvement
Area
No.
1
,
Special
Tax
,
2018
,
5
%
,
9/01/43
......................................
5,500,000
5,596,791
City
of
Tracy
Community
Facilities
District
No.
2016-01
Improvement
Area
No.
1
,
Special
Tax
,
2018
,
5
%
,
9/01/48
......................................
6,490,000
6,542,017
City
of
Tracy
Community
Facilities
District
No.
2016-01
Improvement
Area
No.
1
,
Special
Tax
,
2019
,
5
%
,
9/01/49
......................................
1,960,000
1,971,003
Transbay
Joint
Powers
Authority
,
Transbay
Redevelopment
Project
Tax
Increment
Re-
Development
Project
,
Tax
Allocation
,
2020
B
,
5
%
,
10/01/38
..................
550,000
571,519
Truckee-Donner
Public
Utility
District
,
Community
Facilities
District
No.
04-1
,
Special
Tax
,
2004
,
5.75
%
,
9/01/29
........
1,915,000
1,903,062
Community
Facilities
District
No.
04-1
,
Special
Tax
,
2004
,
5.8
%
,
9/01/35
........
4,470,000
4,358,705
Community
Facilities
District
No.
04-1
,
Special
Tax
,
2005
,
5.25
%
,
9/01/30
........
4,990,000
4,853,920
University
of
California
,
Revenue
,
2025
CC
,
5
%
,
5/15/47
......................................
12,500,000
13,568,217
Revenue
,
2025
CC
,
5
%
,
5/15/53
......................................
20,200,000
21,546,294
g
Revenue
,
2026
CF
,
Refunding
,
5
%
,
11/15/45
.............................
1,250,000
1,392,655
Vallejo
Redevelopment
Agency
,
Tax
Allocation
,
2001
A
,
7
%
,
10/01/31
............
1,560,000
1,564,957
f
Victor
Valley
Community
College
District
,
GO
,
2008
C
,
4.66
%,
6/01/49
...........
11,940,000
4,140,054
Washington
Township
Health
Care
District
,
Revenue
,
2017
B
,
Refunding
,
4
%
,
7/01/35
...............................
2,000,000
1,999,281
Revenue
,
2017
B
,
Refunding
,
4
%
,
7/01/36
...............................
1,900,000
1,883,478
Westside
Union
School
District
,
Community
Facilities
District
No.
2018-1
Area
1
,
Special
Tax
,
2021
,
4
%
,
9/01/46
.......................................
360,000
325,873
2,898,208,599
Florida
0.3%
c,f
Capital
Trust
Authority
,
Gulf
Coast
Portfolio
Obligated
Group
,
Revenue
,
144A,
2024
,
Refunding
,
5.29
%,
3/01/29
...........................................
8,200,000
7,024,182
c
,e
Florida
Development
Finance
Corp.
,
Brightline
Florida
Holdings
LLC
,
Revenue
,
144A,
2025
B
,
Mandatory
Put
,
10
%
,
6/15/26
..................................
3,625,000
2,501,250
9,525,432
Minnesota
0.1%
c
City
of
Fridley
,
Roers
Fridley
Apartments
Owner
II
LLC
,
Revenue
,
144A,
2023
B-2
,
9
%
,
6/01/41
.........................................................
3,250,000
3,343,117
Texas
0.6%
c
City
of
Dallas
Housing
Finance
Corp.
,
DHFC
-
Dylan
Apartments
LLC
(The)
,
Revenue,
Junior
Lien
,
144A,
2022
B
,
6.25
%
,
12/01/54
..............................
10,100,000
8,675,633
c
Texas
Community
Housing
&
Economic
Development
Corp.
,
f
Agape
Helotes,
Inc.
,
Revenue,
Junior
Lien
,
144A,
2025
B
,
7.736
%,
1/01/65
......
163,530,000
8,065,512
Franklin
Municipal
Securities
Trust
Schedule
of
Investments
Franklin
California
High
Yield
Municipal
Fund
(continued)
Annual
Report
The
accompanying
notes
are
an
integral
part
of
these
financial
statements.
a
a
Principal
Amount
a
Value
a
a
a
a
a
Municipal
Bonds
(continued)
Texas
(continued)
c
Texas
Community
Housing
&
Economic
Development
Corp.,
(continued)
Agape
Helotes,
Inc.
,
Revenue,
Senior
Lien
,
144A,
2025
A-2
,
12
%
,
1/01/65
.......
$
1,305,000
$
1,314,155
18,055,300
Virginia
0.2%
c
Virginia
Small
Business
Financing
Authority
,
P3
VB
Holdings
LLC
,
Revenue,
Senior
Lien
,
144A,
2023
A
,
8.5
%
,
12/01/52
....................................
5,250,000
5,119,961
Wisconsin
0.3%
c
Public
Finance
Authority
,
FAH
Tree
House
LLC
,
Revenue
,
144A,
2023
B
,
6.625
%
,
2/01/46
..............
7,000,000
5,907,394
f
Pine
Forest
2022
Obligated
Group
,
Revenue,
Sub.
Lien
,
144A,
2022
,
2.279
%,
12/01/45
.......................................................
6,000,000
4,703,310
10,610,704
U.S.
Territories
5.0%
American
Samoa
0.0%
†
c
American
Samoa
Economic
Development
Authority
,
Revenue
,
144A,
2025
B
,
5.25
%
,
9/01/45
.........................................................
1,125,000
1,142,906
Guam
0.6%
Guam
Government
Waterworks
Authority
,
Revenue
,
2017
,
Refunding
,
5
%
,
7/01/40
..
9,885,000
10,059,830
Guam
Power
Authority
,
Revenue
,
2017
A
,
Refunding
,
5
%
,
10/01/38
..............
4,750,000
4,846,198
Territory
of
Guam
,
Revenue
,
2021
F
,
Refunding
,
4
%
,
1/01/36
...............................
250,000
254,935
Revenue
,
2021
F
,
Refunding
,
4
%
,
1/01/42
...............................
1,125,000
1,120,274
Hotel
Occupancy
Tax
,
Revenue
,
2021
A
,
Refunding
,
5
%
,
11/01/35
.............
3,000,000
3,226,952
19,508,189
Pacific
Islands
0.1%
Northern
Mariana
Island
Ports
Authority
,
Revenue
,
1998
A
,
6.6
%
,
3/15/28
.........
2,125,000
2,162,600
Puerto
Rico
4.0%
Commonwealth
of
Puerto
Rico
,
f,h
GO
,
FRN
,
2.567
%,
11/01/43
..........................................
2,826,453
1,932,587
GO
,
2022
A-1
,
5.625
%
,
7/01/27
.......................................
809,842
828,823
GO
,
2022
A-1
,
5.625
%
,
7/01/29
.......................................
796,704
851,307
GO
,
2022
A-1
,
5.75
%
,
7/01/31
........................................
773,832
859,904
GO
,
2022
A-1
,
4
%
,
7/01/33
..........................................
733,796
751,538
GO
,
2022
A-1
,
4
%
,
7/01/35
..........................................
659,584
670,906
GO
,
2022
A-1
,
4
%
,
7/01/37
..........................................
566,098
567,268
GO
,
2022
A-1
,
4
%
,
7/01/41
..........................................
769,676
747,027
GO
,
2022
A-1
,
4
%
,
7/01/46
..........................................
16,300,453
14,716,836
f
GO
,
2022
A-1
,
4.18
%,
7/01/33
........................................
944,324
699,217
GDB
Debt
Recovery
Authority
of
Puerto
Rico
,
7.5
%
,
8/20/40
...................
13,655,512
13,430,773
HTA
CL
6
Trust
,
Revenue
,
L-2028
,
5.25
%
,
7/01/38
..........................
685,869
686,020
Puerto
Rico
Electric
Power
Authority
,
d
Revenue
,
1
,
10
%
,
1/01/21
...........................................
1,768,493
1,180,469
d
Revenue
,
2
,
10
%
,
7/01/21
...........................................
1,768,493
1,180,469
d
Revenue
,
2013
A
,
10
%
,
7/01/19
.......................................
1,601,766
1,069,179
d
Revenue
,
2013
A
,
7
%
,
7/01/33
........................................
10,290,000
6,868,575
d
Revenue
,
2016
B-1
,
10
%
,
7/01/19
.....................................
1,601,765
1,069,178
d
Revenue
,
3
,
10
%
,
1/01/22
...........................................
600,000
400,500
d
Revenue
,
4
,
10
%
,
7/01/22
...........................................
600,000
400,500
Revenue
,
VV
,
Refunding
,
NATL
Insured
,
5.25
%
,
7/01/32
....................
1,800,000
1,847,313
Franklin
Municipal
Securities
Trust
Schedule
of
Investments
Franklin
California
High
Yield
Municipal
Fund
(continued)
The
accompanying
notes
are
an
integral
part
of
these
financial
statements.
Annual
Report
a
a
Principal
Amount
a
Value
a
a
a
a
a
Municipal
Bonds
(continued)
U.S.
Territories
(continued)
Puerto
Rico
(continued)
Puerto
Rico
Industrial
Tourist
Educational
Medical
&
Environmental
Control
Facilities
Financing
Authority
,
Revenue
,
2000
A
,
6.625
%
,
1/01/27
....................................
$
362,482
$
362,399
Revenue
,
2000
A
,
6.625
%
,
1/01/28
....................................
2,764,591
2,769,661
Puerto
Rico
Sales
Tax
Financing
Corp.
,
Sales
Tax
,
Revenue
,
A-1
,
4.55
%
,
7/01/40
................................
100,000
100,670
Sales
Tax
,
Revenue
,
A-1
,
4.75
%
,
7/01/53
................................
18,244,000
17,790,141
Sales
Tax
,
Revenue
,
A-1
,
5
%
,
7/01/58
..................................
8,695,000
8,534,390
f
Sales
Tax
,
Revenue
,
A-1
,
5.16
%,
7/01/46
................................
20,000,000
7,194,212
f
Sales
Tax
,
Revenue
,
A-1
,
5.41
%,
7/01/51
................................
47,945,000
12,614,684
Sales
Tax
,
Revenue
,
A-2
,
4.329
%
,
7/01/40
...............................
4,419,000
4,428,140
Sales
Tax
,
Revenue
,
A-2
,
4.784
%
,
7/01/58
...............................
28,616,000
27,726,395
132,279,081
Virgin
Islands
0.3%
Matching
Fund
Special
Purpose
Securitization
Corp.
,
United
States
Virgin
Islands
Federal
Excise
Tax
,
Revenue
,
2022
A
,
Refunding
,
5
%
,
10/01/39
...............
9,660,000
10,242,856
Total
U.S.
Territories
....................................................................
165,335,632
Total
Municipal
Bonds
(Cost
$
3,119,881,581
)
...................................
3,124,925,732
Total
Long
Term
Investments
(Cost
$
3,195,021,215
)
.............................
3,191,997,766
a
a
a
a
a
Short
Term
Investments
1.6%
Municipal
Bonds
1.6%
California
1.6%
j
Anaheim
Housing
&
Public
Improvements
Authority
,
City
of
Anaheim
Water
System
,
Revenue,
Second
Lien
,
2024
A
,
LOC
Bank
of
America
NA
,
Daily
VRDN
and
Put
,
1.1
%
,
10/01/54
...................................................
14,500,000
14,500,000
j
California
Municipal
Finance
Authority
,
Boone
534
LLC
,
Revenue
,
2026
B
,
Daily
VRDN
and
Put
,
7.1
%
,
2/01/38
..............................................
8,050,000
8,116,406
j
Eastern
Municipal
Water
District
,
Revenue
,
2018
A
,
Refunding
,
SPA
Bank
of
America
NA
,
Daily
VRDN
and
Put
,
1.1
%
,
7/01/46
.................................
1,100,000
1,100,000
j
Irvine
Ranch
Water
District
,
Special
Assessment
,
2009
B
,
LOC
Bank
of
America
NA
,
Daily
VRDN
and
Put
,
1.1
%
,
10/01/41
...................................
16,300,000
16,300,000
j
Regents
of
the
University
of
California
,
Medical
Center
,
Revenue
,
2007
B-1
,
Refunding
,
Daily
VRDN
and
Put
,
1.4
%
,
5/15/32
....................................
12,720,000
12,720,000
52,736,406
Total
Municipal
Bonds
(Cost
$
52,670,000
)
......................................
52,736,406
Total
Short
Term
Investments
(Cost
$
52,670,000
)
................................
52,736,406
a
Total
Investments
(Cost
$
3,247,691,215
)
98.9
%
..................................
$3,244,734,172
Other
Assets,
less
Liabilities
1.1
%
.............................................
36,526,090
Net
Assets
100.0%
...........................................................
$3,281,260,262
Franklin
Municipal
Securities
Trust
Schedule
of
Investments
Franklin
California
High
Yield
Municipal
Fund
(continued)
Annual
Report
The
accompanying
notes
are
an
integral
part
of
these
financial
statements.
See
Abbreviations
on
page
41
.
†
Rounds
to
less
than
0.1%
of
net
assets.
a
Fair
valued
using
significant
unobservable
inputs.
See
Note
9
regarding
fair
value
measurements.
b
Non-income
producing.
c
Security
was
purchased
pursuant
to
Rule
144A
or
Regulation
S
under
the
Securities
Act
of
1933.
144A
securities
may
be
sold
in
transactions
exempt
from
registration
only
to
qualified
institutional
buyers
or
in
a
public
offering
registered
under
the
Securities
Act
of
1933.
Regulation
S
securities
cannot
be
sold
in
the
United
States
without
either
an
effective
registration
statement
filed
pursuant
to
the
Securities
Act
of
1933,
or
pursuant
to
an
exemption
from
registration.
At
February
28,
2026,
the
aggregate
value
of
these
securities
was
$948,487,706,
representing
28.9%
of
net
assets.
d
Defaulted
security
or
security
for
which
income
has
been
deemed
uncollectible.
See
Note
6.
e
The
maturity
date
shown
represents
the
mandatory
put
date.
f
The
rate
shown
represents
the
yield
at
period
end.
g
Security
purchased
on
a
when-issued
basis.
See
Note
1(b).
h
The
coupon
rate
shown
represents
the
rate
at
period
end.
i
Investment
in
an
interest-only
security
entitles
holders
to
receive
only
the
interest
payment
on
the
underlying
instruments.
The
principal
amount
shown
is
the
notional
amount
of
the
underlying
instruments.
j
Variable
rate
demand
notes
(VRDN)
are
obligations
which
contain
a
floating
or
variable
interest
rate
adjustment
formula
and
an
unconditional
right
of
demand
to
receive
pay-
ment
of
the
principal
balance
plus
accrued
interest
at
specified
dates.
Unless
otherwise
noted,
the
coupon
rate
is
determined
based
on
factors
including
supply
and
demand,
underlying
credit,
tax
treatment,
and
current
short
term
rates.
The
coupon
rate
shown
represents
the
rate
at
period
end.
Franklin
Municipal
Securities
Trust
Financial
Statements
Statement
of
Assets
and
Liabilities
February
28,
2026
The
accompanying
notes
are
an
integral
part
of
these
financial
statements.
Annual
Report
Franklin
California
High
Yield
Municipal
Fund
Assets:
Investments
in
securities:
Cost
-
Unaffiliated
issuers
...................................................................
$3,247,691,215
Value
-
Unaffiliated
issuers
..................................................................
$3,244,734,172
Cash
....................................................................................
462,657
Receivables:
Capital
shares
sold
........................................................................
3,109,359
Interest
.................................................................................
43,296,580
Total
assets
..........................................................................
3,291,602,768
Liabilities:
Payables:
Investment
securities
purchased
..............................................................
1,388,950
Capital
shares
redeemed
...................................................................
5,559,609
Management
fees
.........................................................................
1,139,522
Distribution
fees
..........................................................................
305,793
Transfer
agent
fees
........................................................................
588,805
Trustees'
fees
and
expenses
.................................................................
60
Distributions
to
shareholders
.................................................................
1,089,876
Accrued
expenses
and
other
liabilities
...........................................................
269,891
Total
liabilities
.........................................................................
10,342,506
Net
assets,
at
value
.................................................................
$3,281,260,262
Net
assets
consist
of:
Paid-in
capital
.............................................................................
$3,486,776,774
Total
distributable
earnings
(losses)
.............................................................
(205,516,512)
Net
assets,
at
value
.................................................................
$3,281,260,262
Franklin
Municipal
Securities
Trust
Financial
Statements
Statement
of
Assets
and
Liabilities
(continued)
February
28,
2026
Annual
Report
The
accompanying
notes
are
an
integral
part
of
these
financial
statements.
Franklin
California
High
Yield
Municipal
Fund
Class
A:
Net
assets,
at
value
.......................................................................
$1,168,018,463
Shares
outstanding
........................................................................
118,501,682
Net
asset
value
per
share
a
,b
..................................................................
$9.86
Maximum
offering
price
per
share
(net
asset
value
per
share
÷
96
.25
%
)
b
................................
$10.24
Class
A1:
Net
assets,
at
value
.......................................................................
$662,264,939
Shares
outstanding
........................................................................
67,322,286
Net
asset
value
per
share
a
,b
..................................................................
$9.84
Maximum
offering
price
per
share
(net
asset
value
per
share
÷
96
.25
%
)
b
................................
$10.22
Class
C:
Net
assets,
at
value
.......................................................................
$73,036,172
Shares
outstanding
........................................................................
7,367,556
Net
asset
value
and
maximum
offering
price
per
share
a
,b
............................................
$9.91
Class
R6:
Net
assets,
at
value
.......................................................................
$77,623,155
Shares
outstanding
........................................................................
7,864,552
Net
asset
value
and
maximum
offering
price
per
share
b
.............................................
$9.87
Advisor
Class:
Net
assets,
at
value
.......................................................................
$1,300,317,533
Shares
outstanding
........................................................................
131,887,313
Net
asset
value
and
maximum
offering
price
per
share
b
.............................................
$9.86
a
Redemption
price
is
equal
to
net
asset
value
less
contingent
deferred
sales
charges,
if
applicable.
b
Net
asset
value
per
share
may
not
recalculate
due
to
rounding.
Franklin
Municipal
Securities
Trust
Financial
Statements
Statement
of
Operations
for
the
year
ended
February
28,
2026
The
accompanying
notes
are
an
integral
part
of
these
financial
statements.
Annual
Report
Franklin
California
High
Yield
Municipal
Fund
Investment
income:
Interest:
Unaffiliated
issuers
........................................................................
$152,290,554
Expenses:
Management
fees
(Note
3
a
)
...................................................................
13,902,397
Distribution
fees:
(Note
3c
)
Class
A
................................................................................
2,555,300
Class
A1
...............................................................................
668,087
Class
C
................................................................................
491,070
Transfer
agent
fees:
(Note
3e
)
Class
A
................................................................................
772,451
Class
A1
...............................................................................
502,246
Class
C
................................................................................
56,637
Class
R6
...............................................................................
17,827
Advisor
Class
............................................................................
906,765
Custodian
fees
.............................................................................
15,962
Reports
to
shareholders
fees
..................................................................
55,911
Registration
and
filing
fees
....................................................................
41,774
Professional
fees
...........................................................................
219,369
Trustees'
fees
and
expenses
..................................................................
31,520
Other
....................................................................................
355,711
Total
expenses
.........................................................................
20,593,027
Net
investment
income
................................................................
131,697,527
Realized
and
unrealized
gains
(losses):
Net
realized
gain
(loss)
from:
Investments:
Unaffiliated
issuers
......................................................................
(22,899,997)
Net
change
in
unrealized
appreciation
(depreciation)
on:
Investments:
Unaffiliated
issuers
......................................................................
12,011,010
Unfunded
commitments
....................................................................
(1,620,918)
Net
change
in
unrealized
appreciation
(depreciation)
............................................
10,390,092
Net
realized
and
unrealized
gain
(loss)
............................................................
(12,509,905)
Net
increase
(decrease)
in
net
assets
resulting
from
operations
..........................................
$119,187,622
Franklin
Municipal
Securities
Trust
Financial
Statements
Statements
of
Changes
in
Net
Assets
Annual
Report
The
accompanying
notes
are
an
integral
part
of
these
financial
statements.
Franklin
California
High
Yield
Municipal
Fund
Year
Ended
February
28,
2026
Year
Ended
February
28,
2025
Increase
(decrease)
in
net
assets:
Operations:
Net
investment
income
.................................................
$131,697,527
$113,522,234
Net
realized
gain
(loss)
.................................................
(22,899,997)
(23,658,994)
Net
change
in
unrealized
appreciation
(depreciation)
...........................
10,390,092
38,149,884
Net
increase
(decrease)
in
net
assets
resulting
from
operations
................
119,187,622
128,013,124
Distributions
to
shareholders:
Class
A
.............................................................
(42,934,054)
(33,286,444)
Class
A1
............................................................
(29,103,317)
(30,414,871)
Class
C
.............................................................
(2,847,729)
(3,156,190)
Class
R6
............................................................
(2,966,424)
(2,427,473)
Advisor
Class
........................................................
(53,477,488)
(43,462,594)
Total
distributions
to
shareholders
..........................................
(131,329,012)
(112,747,572)
Capital
share
transactions:
(Note
2
)
Class
A
.............................................................
187,910,278
266,877,961
Class
A1
............................................................
(44,741,509)
(68,763,477)
Class
C
.............................................................
(11,177,350)
(8,310,519)
Class
R6
............................................................
11,943,438
14,864,697
Advisor
Class
........................................................
119,081,951
265,571,571
Total
capital
share
transactions
............................................
263,016,808
470,240,233
Net
increase
(decrease)
in
net
assets
...................................
250,875,418
485,505,785
Net
assets:
Beginning
of
year
.......................................................
3,030,384,844
2,544,879,059
End
of
year
...........................................................
$3,281,260,262
$3,030,384,844
Franklin
Municipal
Securities
Trust
Notes
to
Financial
Statements
Franklin
California
High
Yield
Municipal
Fund
1.
Organization
and
Significant
Accounting
Policies
Franklin
Municipal
Securities
Trust (Trust)
is
registered
under
the
Investment
Company
Act
of
1940
(1940
Act)
as
an
open-end
management
investment
company,
consisting
of one fund,
Franklin
California
High
Yield
Municipal
Fund (Fund).
The Fund
follows
the
accounting
and
reporting
guidance
in
Financial
Accounting
Standards
Board
(FASB)
Accounting
Standards
Codification
Topic
946,
Financial
Services
–
Investment
Companies
(ASC
946)
and applies
the
specialized
accounting
and
reporting
guidance
in
U.S.
Generally
Accepted
Accounting
Principles
(U.S.
GAAP),
including,
but
not
limited
to,
ASC
946.
The
Fund
offers five
classes
of
shares:
Class
A,
Class
A1,
Class
C,
Class
R6
and
Advisor
Class. Class
C
shares
automatically
convert
to
Class
A
shares
on
a
monthly
basis,
after
they
have
been
held
for
8
years.
Each
class
of
shares
may
differ
by
its
initial
sales
load,
contingent
deferred
sales
charges,
voting
rights
on
matters
affecting
a
single
class,
its
exchange
privilege
and
fees
due
to
differing
arrangements
for
distribution
and
transfer
agent
fees.
The
following
summarizes
the Fund's
significant
accounting
policies.
a.
Financial
Instrument
Valuation
The
Fund's
investments
in
financial
instruments
are
carried
at
fair
value
daily.
Fair
value
is
the
price
that
would
be
received
to
sell
an
asset
or
paid
to
transfer
a
liability
in
an
orderly
transaction
between
market
participants
on
the
measurement
date.
The
Fund
calculates
the
net
asset
value
(NAV)
per
share
each business
day as
of
4
p.m.
Eastern
time
or
the
regularly
scheduled
close
of
the
New
York
Stock
Exchange
(NYSE),
whichever
is
earlier.
Under
compliance
policies
and
procedures
approved
by
the Trust's
Board
of
Trustees
(the
Board),
the
Board
has
designated
the
Fund’s
investment
manager
as
the
valuation
designee
and
has
responsibility
for
oversight
of
valuation.
The
investment
manager
is
assisted
by
the
Fund’s
administrator
in
performing
this
responsibility,
including
leading
the
cross-
functional
Valuation
Committee
(VC).
The
Fund
may
utilize
independent
pricing
services,
quotations
from
securities
and
financial
instrument
dealers,
and
other
market
sources
to
determine
fair
value.
Equity
securities
listed
on
an
exchange
or
on
the
NASDAQ
National
Market
System
are
valued
at
the
last
quoted
sale
price
or
the
official
closing
price of
the
day,
respectively.
Over-the-counter
(OTC)
securities
are
valued
within
the
range
of
the
most
recent
quoted
bid
and
ask
prices.
Securities
that
trade
in
multiple
markets
or
on
multiple
exchanges
are
valued
according
to
the
broadest
and
most
representative
market.
Certain
equity
securities
are
valued
based
upon
fundamental
characteristics
or
relationships
to
similar
securities.
Debt
securities
generally
trade
in
the OTC
market
rather
than
on
a
securities
exchange.
The
Fund's
pricing
services
use
multiple
valuation
techniques
to
determine
fair
value.
In
instances
where
sufficient
market
activity
exists,
the
pricing
services
may
utilize
a
market-based
approach
through
which
quotes
from
market
makers
are
used
to
determine
fair
value.
In
instances
where
sufficient
market
activity
may
not
exist
or
is
limited,
the
pricing
services
also
utilize
proprietary
valuation
models
which
may
consider
market
characteristics
such
as
benchmark
yield
curves,
credit
spreads,
estimated
default
rates,
anticipated
market
interest
rate
volatility,
coupon
rates,
anticipated
timing
of
principal
repayments,
underlying
collateral,
and
other
unique
security
features
in
order
to
estimate
the
relevant
cash
flows,
which
are
then
discounted
to
calculate
the
fair
value.
The
Fund
has
procedures
to
determine
the
fair
value
of
financial
instruments
for
which
market
prices
are
not
reliable
or
readily
available.
Under
these
procedures,
the Fund
primarily
employs
a
market-based
approach
which
may
use
related
or
comparable
assets
or
liabilities,
recent
transactions,
market
multiples,
and
other
relevant
information
for
the
investment
to
determine
the
fair
value
of
the
investment.
An
income-based
valuation
approach
may
also
be
used
in
which
the
anticipated
future
cash
flows
of
the
investment
are
discounted
to
calculate
fair
value.
Discounts
may
also
be
applied
due
to
the
nature
or
duration
of
any
restrictions
on
the
disposition
of
the
investments.
Due
to
the
inherent
uncertainty
of
valuations
of
such
investments,
the
fair
values
may
differ
significantly
from
the
values
that
would
have
been
used
had
an
active
market
existed.
b.
Securities
Purchased
on
a
When-Issued,
Forward
Commitment or
Delayed
Delivery
Basis
The
Fund
may
purchase
securities
on
a when-issued,
forward
commitment
or
delayed
delivery basis,
with
payment
and
delivery
scheduled
for
a
future
date.
These
transactions
are
subject
to
market
fluctuations
and
are
subject
to
the
risk
that
the
value
at
delivery
may
be
more
or
less
than
the
trade
date
purchase
price.
Although
the
Fund
will
generally
Franklin
Municipal
Securities
Trust
Notes
to
Financial
Statements
Franklin
California
High
Yield
Municipal
Fund
(continued)
purchase
these
securities
with
the
intention
of
holding
the
securities, it
may
sell
the
securities
before
the
settlement
date.
c.
Income
Taxes
It
is the Fund's
policy
to
qualify
as
a
regulated
investment
company
under
the
Internal
Revenue
Code. The Fund
intends
to
distribute
to
shareholders
substantially
all
of
its income
and
net
realized
gains
to
relieve
it
from
federal
income
and
excise
taxes.
As
a
result,
no
provision
for
U.S.
federal
income
taxes
is
required.
The Fund
may
recognize
an
income
tax
liability
related
to
its
uncertain
tax
positions
under
U.S.
GAAP
when
the
uncertain
tax
position
has
a
less
than
50%
probability
that
it
will
be
sustained
upon
examination
by
the
tax
authorities
based
on
its
technical
merits.
As
of
February
28,
2026, the Fund
has
determined
that
no
tax
liability
is
required
in
its
financial
statements
related
to
uncertain
tax
positions
for
any
open
tax
years
(or
expected
to
be
taken
in
future
tax
years).
The
Fund’s
federal
and
state
income
and
federal
excise
tax
returns
for
the
prior
three
fiscal
years
are
subject
to
examination
by
the
Internal
Revenue
Service
and
state
departments
of
revenue.
d.
Security
Transactions,
Investment
Income,
Expenses
and
Distributions
Security
transactions
are
accounted
for
on
trade
date.
Realized
gains
and
losses
on
security
transactions
are
determined
on
a
specific
identification
basis.
Interest
income
(including
interest
income
from
payment-in-kind
securities,
if
any)
and
estimated
expenses
are
accrued
daily.
Amortization
of
premium
and
accretion
of
discount
on
debt
securities
are
included
in
interest
income.
Paydown
gains
and
losses
are
recorded
as
an
adjustment
to
interest
income. The
Fund
may
receive
other
income
from
investments
in
senior
secured
corporate
loans
or
unfunded
commitments,
including
amendment
fees,
consent
fees
or
commitment
fees.
These
fees
are
recorded
as
income
when
received
by
the
Fund.
Facility
fees
are
recognized
as
income
over
the
expected
term
of
the
loan.
Dividends
from
net
investment
income
are
normally
declared
daily;
these
dividends
may
be
reinvested
or
paid
monthly
to
shareholders.
Distributions
from
realized
capital
gains
and
other
distributions,
if
any,
are
recorded
on
ex-dividend
date.
Distributable
earnings
are
determined
according
to
income
tax
regulations
(tax
basis)
and
may
differ
from
earnings
recorded
in
accordance
with
U.S.
GAAP.
These
differences
may
be
permanent
or
temporary.
Permanent
differences
are
reclassified
among
capital
accounts
to
reflect
their
tax
character.
These
reclassifications
have
no
impact
on
net
assets
or
the
results
of
operations.
Temporary
differences
are
not
reclassified,
as
they
may
reverse
in
subsequent
periods.
Realized
and
unrealized
gains
and
losses
and
net
investment
income,
excluding
class
specific
expenses,
are
allocated
daily
to
each
class
of
shares
based
upon
the
relative
proportion
of
net
assets
of
each
class.
Differences
in
per
share
distributions
by
class
are
generally
due
to
differences
in
class
specific
expenses.
e.
Insurance
The
scheduled
payments
of
interest
and
principal
for
each
insured
municipal
security
in
the
Trust
are
insured
by
either
a
new
issue
insurance
policy
or
a
secondary
insurance
policy.
Depending
on
the
type
of
coverage,
premiums
for
insurance
are
either
added
to
the
cost
basis
of
the
security
or
paid
by
a
third
party.
Insurance
companies
typically
insure
municipal
bonds
that
tend
to
be
of
very
high
quality,
with
the
majority
of
underlying
municipal
bonds
rated
A
or
better.
However,
an
event
involving
an
insurer
could
have
an
adverse
effect
on
the
value
of
the
securities
insured
by
that
insurance
company.
There
can
be
no
assurance
the
insurer
will
be
able
to
fulfill
its
obligations
under
the
terms
of
the
policy.
f.
Accounting
Estimates
The
preparation
of
financial
statements
in
accordance
with
U.S.
GAAP
requires
management
to
make
estimates
and
assumptions
that
affect
the
reported
amounts
of
assets
and
liabilities
at
the
date
of
the
financial
statements
and
the
amounts
of
income
and
expenses
during
the
reporting
period.
Actual
results
could
differ
from
those
estimates.
g.
Guarantees
and
Indemnifications
Under
the Trust's
organizational
documents,
its
officers
and trustees
are
indemnified
by
the Trust against
certain
liabilities
arising
out
of
the
performance
of
their
duties
to
the
Trust.
Additionally,
in
the
normal
course
of
business,
the Trust,
on
behalf
of
the
Fund, enters
into
contracts
with
1.
Organization
and
Significant
Accounting
Policies
(continued)
b.
Securities
Purchased
on
a
When-Issued,
Forward
Commitment or
Delayed
Delivery
Basis
(continued)
Franklin
Municipal
Securities
Trust
Notes
to
Financial
Statements
Franklin
California
High
Yield
Municipal
Fund
(continued)
service
providers
that
contain
general
indemnification
clauses.
The Trust's
maximum
exposure
under
these
arrangements
is
unknown
as
this
would
involve
future
claims
that
may
be
made
against
the Trust
that
have
not
yet
occurred.
Currently,
the Trust
expects
the
risk
of
loss
to
be
remote.
2.
Shares
of
Beneficial
Interest
At
February
28,
2026,
there
were
an
unlimited
number
of
shares
authorized
(without
par
value).
Transactions
in
the
Fund's
shares
were
as
follows:
Year
Ended
February
28,
2026
Year
Ended
February
28,
2025
Shares
Amount
Shares
Amount
Class
A
Shares:
Shares
sold
a
...................................
41,732,767
$401,695,487
39,430,549
$390,770,256
Shares
issued
in
reinvestment
of
distributions
..........
3,947,930
37,995,370
3,006,832
29,733,559
Shares
redeemed
...............................
(26,211,259)
(251,780,579)
(15,541,705)
(153,625,854)
Net
increase
(decrease)
..........................
19,469,438
$187,910,278
26,895,676
$266,877,961
Class
A1
Shares:
Shares
sold
...................................
3,630,181
$34,981,543
3,133,435
$31,022,853
Shares
issued
in
reinvestment
of
distributions
..........
2,564,612
24,614,926
2,620,130
25,845,061
Shares
redeemed
...............................
(10,858,779)
(104,337,978)
(12,723,467)
(125,631,391)
Net
increase
(decrease)
..........................
(4,663,986)
$(44,741,509)
(6,969,902)
$(68,763,477)
Class
C
Shares:
Shares
sold
...................................
1,889,121
$18,341,101
2,231,242
$22,232,038
Shares
issued
in
reinvestment
of
distributions
..........
281,809
2,724,875
303,493
3,017,044
Shares
redeemed
a
..............................
(3,340,904)
(32,243,326)
(3,372,293)
(33,559,601)
Net
increase
(decrease)
..........................
(1,169,974)
$(11,177,350)
(837,558)
$(8,310,519)
Class
R6
Shares:
Shares
sold
...................................
4,029,244
$38,839,226
2,645,569
$26,237,351
Shares
issued
in
reinvestment
of
distributions
..........
296,749
2,859,932
229,503
2,272,221
Shares
redeemed
...............................
(3,098,892)
(29,755,720)
(1,378,938)
(13,644,875)
Net
increase
(decrease)
..........................
1,227,101
$11,943,438
1,496,134
$14,864,697
Advisor
Class
Shares:
Shares
sold
...................................
51,742,281
$496,706,665
48,258,465
$478,078,553
Shares
issued
in
reinvestment
of
distributions
..........
4,573,865
44,017,698
3,661,004
36,211,650
Shares
redeemed
...............................
(44,031,982)
(421,642,412)
(25,136,507)
(248,718,632)
Net
increase
(decrease)
..........................
12,284,164
$119,081,951
26,782,962
$265,571,571
a
May
include
a
portion
of
Class
C
shares
that
were
automatically
converted
to
Class
A.
1.
Organization
and
Significant
Accounting
Policies
(continued)
g.
Guarantees
and
Indemnifications
(continued)
Franklin
Municipal
Securities
Trust
Notes
to
Financial
Statements
Franklin
California
High
Yield
Municipal
Fund
(continued)
3.
Transactions
with
Affiliates
Franklin
Resources,
Inc.
is
the
holding
company
for
various
subsidiaries
that
together
are
referred
to
as
Franklin
Templeton.
Certain
officers
and trustees
of
the Fund are
also
officers
and/or directors
of
the
following
subsidiaries:
a.
Management
Fees
The
Fund
pays
an
investment
management fee,
calculated daily and
paid
monthly,
to
Advisers based
on the
average
daily net
assets
of
the
Fund
as
follows:
For
the
year
ended
February
28,
2026,
the
gross
effective
investment
management
fee
rate
was 0.458%
of
the
Fund’s
average daily
net
assets.
b.
Administrative
Fees
Under
an
agreement
with
Advisers,
FT
Services
provides
administrative
services
to
the
Fund.
The
fee
is
paid
by Advisers
based
on
the Fund's
average
daily
net
assets,
and
is
not
an
additional
expense
of
the
Fund.
c.
Distribution
Fees
The
Board
has
adopted
distribution
plans
for
each
share
class,
with
the
exception
of
Class
R6
and
Advisor
Class
shares,
pursuant
to
Rule
12b-1
under
the
1940
Act.
Under
the
Fund's
Class
A
and
A1
reimbursement
distribution
plans,
the
Fund
reimburses
Distributors
for
costs
incurred
in
connection
with
the
servicing,
sale
and
distribution
of the
Fund's
shares
up
to
the
maximum
annual
plan
rate
for
each
class.
Under
the
Class
A
and
A1
reimbursement
distribution
plans,
costs
exceeding
the
maximum
for
the
current
plan
year
cannot
be
reimbursed
in
subsequent
periods.
In
addition,
under
the
Fund's
Class
C
compensation
distribution
plan,
the
Fund
pays
Distributors
for
costs
incurred
in
connection
with
the
servicing,
sale
and
distribution
of
the
Fund's
shares
up
to
the
maximum
annual
plan
rate.
The
plan
year,
for
purposes
of
monitoring
compliance
with
the
maximum
annual
plan
rates,
is
February
1
through
January
31.
The
maximum
annual
plan
rates,
based
on
the
average
daily
net
assets,
for
each
class,
are
as
follows:
Subsidiary
Affiliation
Franklin
Advisers,
Inc.
(Advisers)
Investment
manager
Franklin
Templeton
Services,
LLC
(FT
Services)
Administrative
manager
Franklin
Distributors,
LLC
(Distributors)
Principal
underwriter
Franklin
Templeton
Investor
Services,
LLC
(Investor
Services)
Transfer
agent
Annualized
Fee
Rate
Net
Assets
0.625%
Up
to
and
including
$100
million
0.500%
Over
$100
million,
up
to
and
including
$250
million
0.450%
Over
$250
million,
up
to
and
including
$7.5
billion
0.440%
Over
$7.5
billion,
up
to
and
including
$10
billion
0.430%
Over
$10
billion,
up
to
and
including
$12.5
billion
0.420%
Over
$12.5
billion,
up
to
and
including
$15
billion
0.400%
Over
$15
billion,
up
to
and
including
$17.5
billion
0.380%
Over
$17.5
billion,
up
to
and
including
$20
billion
0.360%
In
excess
of
$20
billion
Franklin
Municipal
Securities
Trust
Notes
to
Financial
Statements
Franklin
California
High
Yield
Municipal
Fund
(continued)
Distributors
has
agreed
to
limit
the
current
rate
to
0.10%
per
year
for
Class
A1.
d.
Sales
Charges/Underwriting
Agreements
Front-end
sales
charges
and
contingent
deferred
sales
charges
(CDSC)
do
not
represent
expenses
of
the
Fund.
These
charges
are
deducted
from
the
proceeds
of
sales
of
fund
shares
prior
to
investment
or
from
redemption
proceeds
prior
to
remittance,
as
applicable.
Distributors
has
advised
the
Fund
of
the
following
commission
transactions
related
to
the
sales
and
redemptions
of
the
Fund's
shares
for
the
year:
e.
Transfer
Agent
Fees
Each
class
of
shares
pays
transfer
agent
fees,
calculated
monthly
and
paid
monthly, to
Investor
Services
for
its
performance
of
shareholder
servicing
obligations. The
fees
are based
on
a
fixed
margin
earned
by
Investor
Services
and
are allocated
to
the Fund
based
upon
relative
assets
and
relative
transactions. In
addition,
each
class reimburses
Investor
Services
for
out
of
pocket
expenses
incurred
and,
except
for
Class
R6, reimburses
shareholder
servicing
fees
paid
to
third
parties.
These
fees
paid
to
third
parties
are
accrued
and
allocated
daily
based
upon
their
relative
proportion
of
such
classes'
aggregate
net
assets.
Class
R6
pays
Investor
Services
transfer
agent
fees
allocated
specifically
to
that
class
based
upon
its
relative
assets
and
relative
transactions.
For
the
year
ended
February
28,
2026,
the Fund
paid
transfer
agent
fees
as
noted
in
the
Statement of
Operations,
of
which
$519,029
was
retained
by
Investor
Services.
f.
Waiver
and
Expense
Reimbursements
Advisers
has contractually
agreed
in
advance
to
waive
or
limit
its fees
and
to
assume
as
its
own
expense
certain
expenses
otherwise
payable
by
the
Fund
so
that
the
operating expenses
(excluding
interest
expense,
distribution
fees,
acquired
fund
fees
and
expenses
and
certain
non-routine
expenses
or
costs,
including
those
relating
to
litigation,
indemnification,
reorganizations,
and
liquidations)
for
each
class
of
the
Fund
do
not
exceed 0.65%
based
on
the
average
net
assets
of
each
class
until
June
30,
2026.
Total
expenses
waived
or
paid
are
not
subject
to
recapture
subsequent
to
the
Fund's
fiscal
year
end.
Transfer
agent
fees
on
Class
R6
shares
of
the
Fund have
been
capped
so
that
transfer
agent
fees
for
that
class
do
not
exceed
0.03%
based
on
the
average
net
assets
of
the
class
until
June
30,
2026.
g.
Interfund
Transactions
The
Fund
engaged
in
purchases
and
sales
of
investments
with
funds
or
other
accounts
that
have
common
investment
managers
(or
affiliated
investment
managers),
directors,
trustees
or
officers.
During
the
year
ended
February
28,
2026,
these
purchase
and
sale
transactions
aggregated
$136,545,000
and
$193,610,000,
respectively.
Class
A
....................................................................................
0.25%
Class
A1
...................................................................................
0.15%
Class
C
....................................................................................
0.65%
Sales
charges
retained
net
of
commissions
paid
to
unaffiliated
brokers/dealers
..............................
$14,848
CDSC
retained
..............................................................................
$243,132
3.
Transactions
with
Affiliates
(continued)
c.
Distribution
Fees
(continued)
Franklin
Municipal
Securities
Trust
Notes
to
Financial
Statements
Franklin
California
High
Yield
Municipal
Fund
(continued)
4.
Income
Taxes
For
tax
purposes,
capital
losses
may
be
carried
over
to
offset
future
capital
gains.
At
February
28,
2026,
the
capital
loss
carryforwards
were
as
follows:
The
tax
character
of
distributions
paid
during
the
years
ended
February
28,
2026
and
2025,
was
as
follows:
At
February
28,
2026,
the
cost
of
investments,
net
unrealized
appreciation
(depreciation)
and
undistributed
tax
exempt
income
for
income
tax
purposes
were
as
follows:
Differences
between
income
and/or
capital
gains
as
determined
on
a
book
basis
and
a
tax
basis
are
primarily
due
to
differing
treatments
of
defaulted
securities,
wash
sales
and
bond
discounts
and
premiums.
5.
Investment
Transactions
Purchases
and
sales
of
investments (excluding
short
term
securities) for
the
year
ended
February
28,
2026,
aggregated
$653,291,524 and
$416,635,564,
respectively.
6.
Credit
Risk
and
Defaulted
Securities
At
February
28,
2026,
the
Fund
had 34.8%
of
its
portfolio
invested
in
high
yield
securities,
senior
secured
floating
rate
loans,
or
other
securities
rated
below
investment
grade as
determined
by
Nationally
Recognized
Statistical
Credit
Ratings
Organizations
and/or
internally,
by
investment
management
and
unrated
securities.
These
securities
may
be
more
sensitive
to
economic
conditions
causing
greater
price
volatility
and
are
potentially
subject
to
a
greater
risk
of
loss
due
to
default
than
higher
rated
securities.
The
Fund held
defaulted
securities
and/or
other
securities
for
which
the
income
has
been
deemed
uncollectible.
At
February
28,
2026,
the
aggregate
value
of
these
securities
was $24,942,458
representing 0.8%
of
the
Fund's
net
assets.
The
Fund
discontinues
accruing
income
on
securities
for
which
income
has
been
deemed
uncollectible
and
provides
an
estimate
for
losses
on
interest
receivable.
The
securities
have
been
identified
in
the
accompanying Schedule
of
Investments.
Capital
loss
carryforwards
not
subject
to
expiration:
Short
term
................................................................................
$
108,517,455
Long
term
................................................................................
98,154,154
Total
capital
loss
carryforwards
...............................................................
$206,671,609
2026
2025
Distributions
paid
from:
Ordinary
income
..........................................................
$7,412,135
$7,256,025
Tax
exempt
income
........................................................
123,916,877
105,491,547
$131,329,012
$112,747,572
Cost
of
investments
..........................................................................
$3,252,243,823
Unrealized
appreciation
........................................................................
$150,747,081
Unrealized
depreciation
........................................................................
(158,256,732)
Net
unrealized
appreciation
(depreciation)
..........................................................
$(7,509,651)
Distributable
earnings:
Undistributed
tax
exempt
income
.................................................................
$9,754,620
Franklin
Municipal
Securities
Trust
Notes
to
Financial
Statements
Franklin
California
High
Yield
Municipal
Fund
(continued)
7.
Concentration
of
Risk
The
Fund
invests
a
large
percentage
of
its total
assets
in
obligations
of
issuers
within California
and
U.S.
territories.
Such
concentration
may
subject
the
Fund
to
risks
associated
with
industrial
or
regional
matters,
and
economic,
political
or
legal
developments
occurring
within California
and
U.S.
territories. Investments
in
these
securities
are
sensitive
to
interest
rate
changes
and
credit
risk
of
the
issuer
and
may
subject
the
Fund
to
increased
market
volatility.
The
market
for
these
investments
may
be
limited,
which
may
make
them
difficult
to
buy
or
sell.
8.
Credit
Facility
The
Fund,
together
with
other
U.S.
registered
and
foreign
investment
funds
(collectively,
Borrowers),
managed
by
Franklin
Templeton,
are
borrowers
in
a
joint
syndicated
senior
unsecured
credit
facility
totaling
$2.995
billion
(Global
Credit
Facility)
which
matures
on
January
29,
2027.
This
Global
Credit
Facility
provides
a
source
of
funds
to
the
Borrowers
for
temporary
and
emergency
purposes,
including
the
ability
to
meet
future
unanticipated
or
unusually
large
redemption
requests.
Under
the
terms
of
the
Global
Credit
Facility,
the
Fund
may,
in
addition
to
interest
charged
on
any
borrowings
made
by
the
Fund
and
other
costs
incurred
by
the
Fund,
pay
its
share
of
fees
and
expenses
incurred
in
connection
with
the
implementation
and
maintenance
of
the
Global
Credit
Facility,
based
upon
its
relative
share
of
the
aggregate
net
assets
of
all
of
the
Borrowers,
including
an
annual
commitment
fee
of
0.15%
based
upon
the
unused
portion
of
the
Global
Credit
Facility.
These
fees
are
reflected
in
other
expenses
in
the
Statement
of
Operations.
During
the
year
ended
February
28,
2026,
the Fund
did
not
use
the
Global
Credit
Facility.
9.
Fair
Value
Measurements
The
Fund
follows
a
fair
value
hierarchy
that
distinguishes
between
market
data
obtained
from
independent
sources
(observable
inputs)
and
the Fund's
own
market
assumptions
(unobservable
inputs).
These
inputs
are
used
in
determining
the
value
of
the
Fund's financial
instruments
and
are
summarized
in
the
following
fair
value
hierarchy:
Level
1
–
quoted
prices
in
active
markets
for
identical
financial
instruments
Level
2
–
other
significant
observable
inputs
(including
quoted
prices
for
similar
financial
instruments,
interest
rates,
prepayment
speed,
credit
risk,
etc.)
Level
3
–
significant
unobservable
inputs
(including
the
Fund's
own
assumptions
in
determining
the
fair
value
of
financial
instruments)
The
input
levels
are
not
necessarily
an
indication
of
the
risk
or
liquidity
associated
with
financial
instruments
at
that
level.
A
summary
of
inputs
used
as
of February
28,
2026,
in
valuing
the
Fund's
assets
carried
at
fair
value,
is
as
follows:
Level
1
Level
2
Level
3
Total
Franklin
California
High
Yield
Municipal
Fund
Assets:
Investments
in
Securities:
a
Common
Stocks
.........................
$
—
$
—
$
—
b
$
—
Corporate
Bonds
:
Commercial
Services
&
Supplies
...........
—
—
16,092,950
16,092,950
Diversified
Consumer
Services
............
—
41,264,072
—
41,264,072
Electric
Utilities
........................
—
9,715,012
—
9,715,012
Municipal
Bonds
:
Arizona
..............................
—
14,726,987
—
14,726,987
California
.............................
—
2,889,809,631
8,398,968
2,898,208,599
Florida
...............................
—
9,525,432
—
9,525,432
Franklin
Municipal
Securities
Trust
Notes
to
Financial
Statements
Franklin
California
High
Yield
Municipal
Fund
(continued)
A
reconciliation
in
which
Level
3
inputs
are
used
in
determining
fair
value
is
presented
when
there
are
significant
Level
3
assets
and/or
liabilities
at
the
beginning
and/or
end
of
the year.
10.
Operating
Segments
The Fund operates
as
a
single
operating
segment,
which
is
an
investment
portfolio.
The
portfolio
managers
assigned
to
the
Fund
within
the
Fund’s
investment
manager serve
as
the
Chief
Operating
Decision
Maker
(“CODM”)
and
are
responsible
for
evaluating
the
Fund's
operating
results
and
allocating
resources
in
accordance
with
the
Fund’s
investment
strategy.
Internal
reporting
provided
to
the
CODM
aligns
with
the
accounting
policies
and
measurement
principles
used
in
the financial
statements.
For
information
regarding
segment
assets,
segment
profit
or
loss,
and
significant
expenses,
refer
to
the Statement
of
Assets
and
Liabilities
and
the Statement
of
Operations,
along
with
the
related
notes
to
the financial
statements.
The Schedule
of
Investments
provides
details
of
the Fund's investments
that
generate
returns
such
as
interest,
dividends,
and
realized
and
unrealized
gains
or
losses.
Performance
metrics,
including
portfolio
turnover
and
expense
ratios,
are
disclosed
in
the Financial
Highlights.
11.
Subsequent
Events
The
Fund
has
evaluated
subsequent
events
through
the
issuance
of
the
financial
statements
and
determined
that
no
events
have
occurred
that
require
disclosure.
Level
1
Level
2
Level
3
Total
Franklin
California
High
Yield
Municipal
Fund
(continued)
Assets:
(continued)
Investments
in
Securities:
a
(continued)
Municipal
Bonds:
(continued)
Minnesota
............................
$
—
$
3,343,117
$
—
$
3,343,117
Texas
...............................
—
18,055,300
—
18,055,300
Virginia
..............................
—
5,119,961
—
5,119,961
Wisconsin
............................
—
10,610,704
—
10,610,704
U.S.
Territories
..........................
American
Samoa
.......................
—
1,142,906
—
1,142,906
Guam
...............................
—
19,508,189
—
19,508,189
Pacific
Islands
.........................
—
2,162,600
—
2,162,600
Puerto
Rico
...........................
—
132,279,081
—
132,279,081
Virgin
Islands
..........................
—
10,242,856
—
10,242,856
Short
Term
Investments
...................
—
52,736,406
—
52,736,406
Total
Investments
in
Securities
...........
$—
$3,220,242,254
$24,491,918
$3,244,734,172
a
For
detailed
categories,
see
the
accompanying
Schedule
of
Investments.
b
Includes
financial
instruments
determined
to
have
no
value.
9.
Fair
Value
Measurements
(continued)
Franklin
Municipal
Securities
Trust
Notes
to
Financial
Statements
Franklin
California
High
Yield
Municipal
Fund
(continued)
Abbreviations
Selected
Portfolio
AG
Assured
Guaranty,
Inc.
BAM
Build
America
Mutual
Assurance
Co.
COP
Certificate
of
Participation
ETM
Escrowed
to
Maturity
FHLMC
Federal
Home
Loan
Mortgage
Corp.
FNMA
Federal
National
Mortgage
Association
FRN
Floating
Rate
Note
GO
General
Obligation
LOC
Letter
of
Credit
NATL
National
Reinsurance
Corp.
SPA
Standby
Purchase
Agreement
Franklin
Municipal
Securities
Trust
Report
of
Independent
Registered
Public
Accounting
Firm
To
the
Board
of
Trustees
of
Franklin
Municipal
Securities
Trust
and
Shareholders
of
Franklin
California
High
Yield
Municipal
Fund
Opinion
on
the
Financial
Statements
We
have
audited
the
accompanying
statement
of
assets
and
liabilities,
including
the
schedule
of
investments,
of
Franklin
California
High
Yield
Municipal
Fund
(the
“Fund”)
as
of
February
28,
2026,
the
related
statement
of
operations
for
the
year
ended
February
28,
2026,
the
statements
of
changes
in
net
assets
for
each
of
the
two
years
in
the
period
ended
February
28,
2026,
including
the
related
notes,
and
the
financial
highlights
for
each
of
the
four
years
in
the
period
ended
February
28,
2026,
the
period
June
1,
2021
to
February
28,
2022
and
the
year
ended
May
31,
2021
(collectively
referred
to
as
the
“financial
statements”).
In
our
opinion,
the
financial
statements
present
fairly,
in
all
material
respects,
the
financial
position
of
the
Fund
as
of
February
28,
2026,
the
results
of
its
operations
for
the
year
then
ended,
the
changes
in
its
net
assets
for
each
of
the
two
years
in
the
period
ended
February
28,
2026
and
the
financial
highlights
for
each
of
the
four
years
in
the
period
ended
February
28,
2026,
the
period
June
1,
2021
to
February
28,
2022
and
the
year
ended
May
31,
2021
in
conformity
with
accounting
principles
generally
accepted
in
the
United
States
of
America.
Basis
for
Opinion
These
financial
statements
are
the
responsibility
of
the
Fund’s
management.
Our
responsibility
is
to
express
an
opinion
on
the
Fund’s
financial
statements
based
on
our
audits.
We
are
a
public
accounting
firm
registered
with
the
Public
Company
Accounting
Oversight
Board
(United
States)
(PCAOB)
and
are
required
to
be
independent
with
respect
to
the
Fund
in
accordance
with
the
U.S.
federal
securities
laws
and
the
applicable
rules
and
regulations
of
the
Securities
and
Exchange
Commission
and
the
PCAOB.
We
conducted
our
audits
of
these
financial
statements
in
accordance
with
the
standards
of
the
PCAOB.
Those
standards
require
that
we
plan
and
perform
the
audit
to
obtain
reasonable
assurance
about
whether
the
financial
statements
are
free
of
material
misstatement,
whether
due
to
error
or
fraud.
Our
audits
included
performing
procedures
to
assess
the
risks
of
material
misstatement
of
the
financial
statements,
whether
due
to
error
or
fraud,
and
performing
procedures
that
respond
to
those
risks.
Such
procedures
included
examining,
on
a
test
basis,
evidence
regarding
the
amounts
and
disclosures
in
the
financial
statements.
Our
audits
also
included
evaluating
the
accounting
principles
used
and
significant
estimates
made
by
management,
as
well
as
evaluating
the
overall
presentation
of
the
financial
statements.
Our
procedures
included
confirmation
of
securities
owned
as
of
February
28,
2026
by
correspondence
with
the
custodian,
private
placement
agents
and
broker;
when
replies
were
not
received
from
private
placement
agents
or
broker,
we
performed
other
audit
procedures.
We
believe
that
our
audits
provide
a
reasonable
basis
for
our
opinion.
/s/PricewaterhouseCoopers
LLP
San
Francisco,
California
April
17,
2026
We
have
served
as
the
auditor
of
one
or
more
investment
companies
in
the
Franklin
Templeton
Group
of
Funds
since
1948.
Franklin
Municipal
Securities
Trust
Tax
Information
(unaudited)
Franklin
California
High
Yield
Municipal
Fund
By
mid-February,
tax
information
related
to
a
shareholder's
proportionate
share
of
distributions
paid
during
the
preceding
calendar
year
will
be
received,
if
applicable.
Please
also
refer
to
www.franklintempleton.com
for
per
share
tax
information
related
to
any
distributions
paid
during
the
preceding
calendar
year.
Shareholders
are
advised
to
consult
with
their
tax
advisors
for
further
information
on
the
treatment
of
these
amounts
on
their
tax
returns.
The
following
tax
information
for
the
Fund
is
required
to
be
furnished
to
shareholders
with
respect
to
income
earned
and
distributions
paid
during
its
fiscal
year.
The
Fund
hereby
reports
the
following
amounts,
or
if
subsequently
determined
to
be
different,
the
maximum
allowable
amounts,
for
the
fiscal
year
ended
February
28,
2026:
Pursuant
to:
Amount
Reported
Exempt-Interest
Dividends
Distributed
§852(b)(5)(A)
$123,916,877
Section
163(j)
Interest
Earned
§163(j)
$7,412,135
Franklin
Municipal
Securities
Trust
Changes
In
and
Disagreements
with
Accountants
For
the
period
covered
by
this
report
Not
applicable.
Results
of
Meeting(s)
of
Shareholders
For
the
period
covered
by
this
report
Not
applicable.
Remuneration
Paid
to
Directors,
Officers
and
Others
For
the
period
covered
by
this
report
Refer
to
the
financial
statements
included
herein.
Remuneration
to
officers
is
paid
by
the
Fund’s
investment
manager
according
to
the
terms
of
the
agreement.
Board
Approval
of
Management
and
Subadvisory
Agreements
For
the
period
covered
by
this
report
Not
applicable.
©
2026
Franklin
Templeton.
All
rights
reserved.
|
ITEM 8. |
CHANGES IN AND DISAGREEMENTS WITH ACCOUNTANTS FOR OPEN-END MANAGEMENT INVESTMENT COMPANIES. |
The information is disclosed as part of the Financial Statements
included in Item 7 of this Form N-CSR.
|
ITEM 9. |
PROXY DISCLOSURES FOR OPEN-END MANAGEMENT INVESTMENT COMPANIES. |
The information is disclosed as part of the Financial Statements
included in Item 7 of this Form N-CSR.
|
ITEM 10. |
REMUNERATION PAID TO DIRECTORS, OFFICERS, AND OTHERS OF OPEN-END MANAGEMENT INVESTMENT
COMPANIES. |
The information is disclosed as part of the Financial Statements
included in Item 7 of this Form N-CSR.
|
ITEM 11. |
STATEMENT REGARDING BASIS FOR APPROVAL OF INVESTMENT ADVISORY CONTRACT. |
The information is disclosed as part of the Financial Statements
included in Item 7 of this Form N-CSR, as applicable.
|
ITEM 12. |
DISCLOSURE OF PROXY VOTING POLICIES AND PROCEDURES FOR CLOSED-END MANAGEMENT INVESTMENT
COMPANIES. |
Not applicable.
|
ITEM 13. |
PORTFOLIO MANAGERS OF CLOSED-END MANAGEMENT INVESTMENT COMPANIES. |
Not applicable.
|
ITEM 14. |
PURCHASES OF EQUITY SECURITIES BY CLOSED-END MANAGEMENT INVESTMENT COMPANY AND AFFILIATED
PURCHASERS. |
Not applicable.
|
ITEM 15. |
SUBMISSION OF MATTERS TO A VOTE OF SECURITY HOLDERS. |
There have been no changes to the procedures by which shareholders
may recommend nominees to the Registrant’s Board of Trustees that would require disclosure herein.
|
ITEM 16. |
CONTROLS AND PROCEDURES. |
|
(a) |
The Registrant’s chief executive officer and chief financial officer have concluded
that the Registrant’s disclosure controls and procedures (as defined in Rule 30a- 3(c) under the Investment Company Act of 1940,
as amended (the “1940 Act”)) are effective as of a date within 90 days of the filing date of this report that includes the
disclosure required by this paragraph, based on their evaluation of the disclosure controls and procedures required by Rule 30a-3(b) under
the 1940 Act and 15d-15(b) under the Securities Exchange Act of 1934. |
|
(b) |
There were no changes in the Registrant’s internal control over financial reporting
(as defined in Rule 30a-3(d) under the 1940 Act) that occurred during the period covered by this report that have materially affected
or are likely to materially affect the Registrant’s internal control over financial reporting. |
|
ITEM 17. |
DISCLOSURE OF SECURITIES LENDING ACTIVITIES FOR CLOSED-END MANAGEMENT INVESTMENT COMPANIES. |
Not applicable.
|
ITEM 18. |
RECOVERY OF ERRONEOUSLY AWARDED COMPENSATION. |
(a) (1) Code of Ethics attached hereto.
Exhibit 99.CODE ETH
(a) (3) Certifications pursuant to section 302 of the Sarbanes-Oxley Act of 2002 attached hereto.
Exhibit 99.CERT
(b) Certifications pursuant to Section 906 of the Sarbanes-Oxley Act of 2002 attached hereto.
Exhibit 99.906CERT
SIGNATURES
Pursuant to the requirements of the Securities Exchange
Act of 1934 and the Investment Company Act of 1940, the registrant has duly caused this Report to be signed on its behalf by the undersigned,
there unto duly authorized.
Franklin Municipal Securities Trust
| By: |
/s/ Christopher Kings |
|
| |
Christopher Kings |
|
| |
Chief Executive Officer - Finance and Administration |
|
Pursuant to the requirements of the Securities Exchange Act of 1934 and
the Investment Company Act of 1940, this report has been signed below by the following persons on behalf of the registrant and in the
capacities and on the dates indicated.
| By: |
/s/ Christopher Kings |
|
| |
Christopher Kings |
|
| |
Chief Executive Officer - Finance and Administration |
|
| Date: |
April 30, 2026 |
|
| |
|
|
| By: |
/s/ Jeffrey
White |
|
| |
Jeffrey White |
|
| |
Chief Financial Officer, Chief Accounting Officer and Treasurer |
|