Dec. 31, 2025
The Fund seeks both capital growth and income. In the current market environment,
income is expected to be low.
This table describes the fees and expenses that you may pay if you buy, hold, and sell shares of the Fund. You may pay other fees, such as brokerage commissions and other fees to financial intermediaries, which are not reflected in the tables and examples below.
| Shareholder Fees (fees paid directly from your investment) | Class S shares | Class D shares |
| Maximum Sales Charge (Load) Imposed on Purchases (as a percentage of offering price) | None | None |
| Maximum Deferred Sales Charge (Load) (as a percentage of the lesser of the net asset value of the shares redeemed or the total cost of such shares) | None | None |
| Redemption Fee (as a percentage of total redemption proceeds) | None | None |
| Annual Fund Operating Expenses (expenses that you pay each year as a percentage of the value of your investment) | Class S shares | Class D shares |
| Management Fees | 0.55% | 0.55% |
| Distribution and/or Service (12b-1) Fees | 0.25% | 0.00% |
| Other Expenses | 0.17% | 0.10% |
| Total Annual Fund Operating Expenses | 0.97% | 0.65% |
This Example is intended to help you compare the cost of investing in the Fund with the cost of investing in other mutual funds. The Example assumes that you invest $10,000 in the Fund for the time periods indicated and then redeem all of your shares at the end of those periods. The Example also assumes that your investment has a 5% return each year and that the Fund’s operating expenses remain the same. Although your actual costs may be higher or lower, based on these assumptions, your costs would be:
|
|
1 Year
|
3 Years
|
5 Years
|
10 Years
|
|
Class S shares
|
$99 |
$309 |
$536 |
$1,190 |
|
Class D shares
|
$66 |
$208 |
$362 |
$810 |
The Fund pays transaction costs, such as commissions, when it buys and sells securities (or “turns over” its portfolio). A higher portfolio turnover rate may indicate higher transaction costs and may result in higher taxes when Fund shares are held in a taxable account. These costs, which are not reflected in annual fund operating expenses or in the example, affect the Fund’s performance. During the most recent fiscal year, the Fund’s portfolio turnover rate was 15% of the average value of its portfolio.
Davis Selected Advisers, L.P. (“Davis Advisors” or the “Adviser”), the Fund’s investment adviser, uses the Davis Investment Discipline to invest at least 80% of the Fund’s net assets, plus any borrowing for investment purposes, in securities issued by American companies. The Fund invests principally in common stocks (including indirect
holdings of common stock through Depositary Receipts (as defined below)) issued by large companies with market capitalizations
of at least $10 billion. Historically, the Fund has invested a significant portion of its assets in financial
services companies and in foreign companies, and may also invest in mid- and small-capitalization companies.
Davis Investment Discipline. Davis Advisors manages equity funds using the Davis Investment Discipline. Davis
Advisors conducts extensive research to try to identify businesses that possess characteristics
that Davis Advisors believes foster the creation of long-term value, such as proven management, a durable franchise and business
model, and sustainable competitive advantages. Davis Advisors aims to invest in such businesses when they are trading
at discounts to their intrinsic worth. Davis Advisors emphasizes individual stock selection and believes that the ability to evaluate
management is critical. Davis Advisors routinely visits managers at their places of business in order to gain insight into
the relative value of different businesses. Such research, however rigorous, involves predictions and forecasts that are inherently
uncertain. After determining which companies Davis Advisors believes the Fund should own, Davis Advisors then turns its
analysis to determining the intrinsic value of those companies’ equity securities. Davis Advisors seeks companies whose equity securities can be purchased at a discount from Davis Advisors’ estimate of the company’s intrinsic value based upon fundamental analysis of cash flows, assets and liabilities, and other criteria that Davis Advisors deems to be material on a company-by-company basis. Davis Advisors’ goal is to invest in companies for the long term (ideally, five years or longer, although
this goal may not be met). Davis Advisors considers selling a company’s equity securities if the securities’ market price exceeds Davis Advisors’ estimates of
intrinsic value, if the ratio of the risks and rewards of continuing to own the company’s equity securities is no longer attractive, to raise cash to purchase a more attractive investment opportunity, to satisfy net
redemptions, or for other purposes.
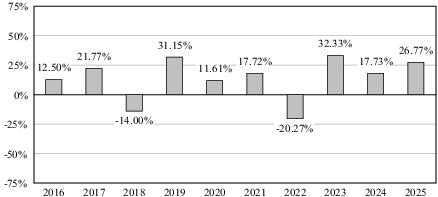
The bar chart below provides some indication of the risks of investing in the Fund by showing how the Fund’s investment results have varied from year to year. The following table shows how the Fund’s average annual total returns, for the periods indicated, compare with the S&P 500 Index, a broad-based securities market index. The Fund’s past performance (before and after taxes) is not necessarily an indication of how the Fund will perform in the future. Updated information on the Fund’s results can be obtained by visiting www.selectedfund.com or by calling 1-800-243-1575.
After-tax returns are calculated using the historical highest individual federal marginal income tax rates and do not reflect the impact of state and local taxes. Actual after-tax returns depend on an investor’s tax situation and may differ from those shown, and after-tax returns shown are not relevant to investors who hold their Fund shares through tax-deferred arrangements, such as 401(k) plans or individual retirement accounts. After-tax returns are shown only for Class S shares; after-tax returns for Class D shares will vary.
| | Returns | Period Ending |
| Highest Quarter | 19.29% | June 30, 2020 |
| Lowest Quarter | -25.90% | March 31, 2020 |
| Year-to-Date | -0.05% | March 31, 2026 |
| Average Annual Total Returns (For the periods ended December 31, 2025) | Past 1 Year | Past 5 Years | Past 10 Years |
| Class S shares return before taxes | 26.77% | 13.13% | 12.31% |
| Class S shares return after taxes on distributions | 23.24% | 10.11% | 9.64% |
| Class S shares return after taxes on distributions and sale of Fund shares | 17.87% | 9.80% | 9.33% |
| Class D shares return before taxes | 27.16% | 13.49% | 12.67% |
| S&P 500 Index reflects no deduction for fees, expenses or taxes | 17.88% | 14.42% | 14.81% |