Performance Management - Selected American Shares - Selected American Shares
Dec. 31, 2025
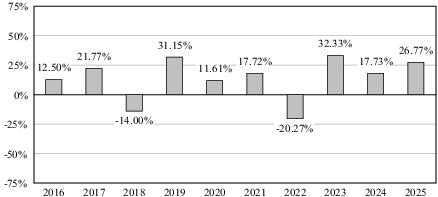
The bar chart below provides some indication of the risks of investing in the Fund by showing how the Fund’s investment results have varied from year to year. The following table shows how the Fund’s average annual total returns, for the periods indicated, compare with the S&P 500 Index, a broad-based securities market index. The Fund’s past performance (before and after taxes) is not necessarily an indication of how the Fund will perform in the future. Updated information on the Fund’s results can be obtained by visiting www.selectedfund.com or by calling 1-800-243-1575.
After-tax returns are calculated using the historical highest individual federal marginal income tax rates and do not reflect the impact of state and local taxes. Actual after-tax returns depend on an investor’s tax situation and may differ from those shown, and after-tax returns shown are not relevant to investors who hold their Fund shares through tax-deferred arrangements, such as 401(k) plans or individual retirement accounts. After-tax returns are shown only for Class S shares; after-tax returns for Class D shares will vary.
| | Returns | Period Ending |
| Highest Quarter | 19.29% | June 30, 2020 |
| Lowest Quarter | -25.90% | March 31, 2020 |
| Year-to-Date | -0.05% | March 31, 2026 |
| Average Annual Total Returns (For the periods ended December 31, 2025) | Past 1 Year | Past 5 Years | Past 10 Years |
| Class S shares return before taxes | 26.77% | 13.13% | 12.31% |
| Class S shares return after taxes on distributions | 23.24% | 10.11% | 9.64% |
| Class S shares return after taxes on distributions and sale of Fund shares | 17.87% | 9.80% | 9.33% |
| Class D shares return before taxes | 27.16% | 13.49% | 12.67% |
| S&P 500 Index reflects no deduction for fees, expenses or taxes | 17.88% | 14.42% | 14.81% |