false
0000914209
N-1A
N-CSRS
0000914209
tsr:C000236750Member
2025-09-01
2026-02-28
0000914209
tsr:C000236750Member
2026-02-28
0000914209
tsr:C000236750Member
tsr:bench202409043987_6630Member
2026-02-28
0000914209
tsr:C000236750Member
tsr:bench202409043989_6630Member
2026-02-28
0000914209
tsr:C000236750Member
tsr:bench202411054313_6630Member
2026-02-28
0000914209
tsr:C000236750Member
tsr:bench202412044922_6630Member
2026-02-28
0000914209
tsr:C000236750Member
tsr:bench202411074342_6630Member
2026-02-28
0000914209
tsr:C000236750Member
tsr:bench202411054316_6630Member
2026-02-28
0000914209
tsr:C000236750Member
tsr:bench202411054315_6630Member
2026-02-28
0000914209
tsr:C000236750Member
tsr:bench202411054314_6630Member
2026-02-28
0000914209
tsr:C000236750Member
tsr:bench202409043986_6630Member
2026-02-28
0000914209
tsr:C000236750Member
tsr:bench202411074345_6630Member
2026-02-28
0000914209
tsr:C000236750Member
tsr:bench202409043988_6630Member
2026-02-28
0000914209
tsr:C000236750Member
tsr:bench202411054317_6630Member
2026-02-28
0000914209
tsr:C000236750Member
tsr:bench202412044924_6630Member
2026-02-28
0000914209
tsr:C000236750Member
tsr:bench202411074344_6630Member
2026-02-28
0000914209
tsr:C000236750Member
tsr:bench202412044926_6630Member
2026-02-28
0000914209
tsr:C000236750Member
tsr:bench202510076710_6630Member
2026-02-28
0000914209
tsr:C000236750Member
tsr:bench202409043991_6630Member
2026-02-28
0000914209
2025-09-01
2026-02-28
tsr:Years
iso4217:USD
xbrli:pure
xbrli:shares
iso4217:USD
xbrli:shares
0000914209
tsr:C000236752Member
2025-09-01
2026-02-28
0000914209
tsr:C000236752Member
2026-02-28
0000914209
tsr:C000236752Member
tsr:bench202409043987_6631Member
2026-02-28
0000914209
tsr:C000236752Member
tsr:bench202409043989_6631Member
2026-02-28
0000914209
tsr:C000236752Member
tsr:bench202411054313_6631Member
2026-02-28
0000914209
tsr:C000236752Member
tsr:bench202412044922_6631Member
2026-02-28
0000914209
tsr:C000236752Member
tsr:bench202411074342_6631Member
2026-02-28
0000914209
tsr:C000236752Member
tsr:bench202411054316_6631Member
2026-02-28
0000914209
tsr:C000236752Member
tsr:bench202411054315_6631Member
2026-02-28
0000914209
tsr:C000236752Member
tsr:bench202411054314_6631Member
2026-02-28
0000914209
tsr:C000236752Member
tsr:bench202409043986_6631Member
2026-02-28
0000914209
tsr:C000236752Member
tsr:bench202411074345_6631Member
2026-02-28
0000914209
tsr:C000236752Member
tsr:bench202409043988_6631Member
2026-02-28
0000914209
tsr:C000236752Member
tsr:bench202411054317_6631Member
2026-02-28
0000914209
tsr:C000236752Member
tsr:bench202412044924_6631Member
2026-02-28
0000914209
tsr:C000236752Member
tsr:bench202411074344_6631Member
2026-02-28
0000914209
tsr:C000236752Member
tsr:bench202412044926_6631Member
2026-02-28
0000914209
tsr:C000236752Member
tsr:bench202510076710_6631Member
2026-02-28
0000914209
tsr:C000236752Member
tsr:bench202409043991_6631Member
2026-02-28
0000914209
tsr:C000217944Member
2025-09-01
2026-02-28
0000914209
tsr:C000217944Member
2026-02-28
0000914209
tsr:C000217944Member
tsr:bench202409043987_6632Member
2026-02-28
0000914209
tsr:C000217944Member
tsr:bench202409043989_6632Member
2026-02-28
0000914209
tsr:C000217944Member
tsr:bench202411054313_6632Member
2026-02-28
0000914209
tsr:C000217944Member
tsr:bench202412044922_6632Member
2026-02-28
0000914209
tsr:C000217944Member
tsr:bench202411074342_6632Member
2026-02-28
0000914209
tsr:C000217944Member
tsr:bench202408053229_6632Member
2026-02-28
0000914209
tsr:C000217944Member
tsr:bench202411054315_6632Member
2026-02-28
0000914209
tsr:C000217944Member
tsr:bench202411054314_6632Member
2026-02-28
0000914209
tsr:C000217944Member
tsr:bench202409043986_6632Member
2026-02-28
0000914209
tsr:C000217944Member
tsr:bench202411074345_6632Member
2026-02-28
0000914209
tsr:C000217944Member
tsr:bench202409043988_6632Member
2026-02-28
0000914209
tsr:C000217944Member
tsr:bench202411054317_6632Member
2026-02-28
0000914209
tsr:C000217944Member
tsr:bench202412044924_6632Member
2026-02-28
0000914209
tsr:C000217944Member
tsr:bench202411074344_6632Member
2026-02-28
0000914209
tsr:C000217944Member
tsr:bench202412044926_6632Member
2026-02-28
0000914209
tsr:C000217944Member
tsr:bench202510076710_6632Member
2026-02-28
0000914209
tsr:C000217944Member
tsr:bench202409043991_6632Member
2026-02-28
0000914209
tsr:C000236751Member
2025-09-01
2026-02-28
0000914209
tsr:C000236751Member
2026-02-28
0000914209
tsr:C000236751Member
tsr:bench202409043987_6633Member
2026-02-28
0000914209
tsr:C000236751Member
tsr:bench202409043989_6633Member
2026-02-28
0000914209
tsr:C000236751Member
tsr:bench202411054313_6633Member
2026-02-28
0000914209
tsr:C000236751Member
tsr:bench202412044922_6633Member
2026-02-28
0000914209
tsr:C000236751Member
tsr:bench202411074342_6633Member
2026-02-28
0000914209
tsr:C000236751Member
tsr:bench202411054316_6633Member
2026-02-28
0000914209
tsr:C000236751Member
tsr:bench202411054315_6633Member
2026-02-28
0000914209
tsr:C000236751Member
tsr:bench202411054314_6633Member
2026-02-28
0000914209
tsr:C000236751Member
tsr:bench202409043986_6633Member
2026-02-28
0000914209
tsr:C000236751Member
tsr:bench202411074345_6633Member
2026-02-28
0000914209
tsr:C000236751Member
tsr:bench202409043988_6633Member
2026-02-28
0000914209
tsr:C000236751Member
tsr:bench202411054317_6633Member
2026-02-28
0000914209
tsr:C000236751Member
tsr:bench202412044924_6633Member
2026-02-28
0000914209
tsr:C000236751Member
tsr:bench202411074344_6633Member
2026-02-28
0000914209
tsr:C000236751Member
tsr:bench202412044926_6633Member
2026-02-28
0000914209
tsr:C000236751Member
tsr:bench202510076710_6633Member
2026-02-28
0000914209
tsr:C000236751Member
tsr:bench202409043991_6633Member
2026-02-28
0000914209
tsr:C000236753Member
2025-09-01
2026-02-28
0000914209
tsr:C000236753Member
2026-02-28
0000914209
tsr:C000236753Member
tsr:bench202408023220_6634Member
2026-02-28
0000914209
tsr:C000236753Member
tsr:bench202409043989_6634Member
2026-02-28
0000914209
tsr:C000236753Member
tsr:bench202411054313_6634Member
2026-02-28
0000914209
tsr:C000236753Member
tsr:bench202412044922_6634Member
2026-02-28
0000914209
tsr:C000236753Member
tsr:bench202411074342_6634Member
2026-02-28
0000914209
tsr:C000236753Member
tsr:bench202411054316_6634Member
2026-02-28
0000914209
tsr:C000236753Member
tsr:bench202411054315_6634Member
2026-02-28
0000914209
tsr:C000236753Member
tsr:bench202411054314_6634Member
2026-02-28
0000914209
tsr:C000236753Member
tsr:bench202409043986_6634Member
2026-02-28
0000914209
tsr:C000236753Member
tsr:bench202411074345_6634Member
2026-02-28
0000914209
tsr:C000236753Member
tsr:bench202409043988_6634Member
2026-02-28
0000914209
tsr:C000236753Member
tsr:bench202411054317_6634Member
2026-02-28
0000914209
tsr:C000236753Member
tsr:bench202412044924_6634Member
2026-02-28
0000914209
tsr:C000236753Member
tsr:bench202411074344_6634Member
2026-02-28
0000914209
tsr:C000236753Member
tsr:bench202412044926_6634Member
2026-02-28
0000914209
tsr:C000236753Member
tsr:bench202510076710_6634Member
2026-02-28
0000914209
tsr:C000236753Member
tsr:bench202409043991_6634Member
2026-02-28
0000914209
tsr:C000236749Member
2025-09-01
2026-02-28
0000914209
tsr:C000236749Member
2026-02-28
0000914209
tsr:C000236749Member
tsr:bench202408023220_6635Member
2026-02-28
0000914209
tsr:C000236749Member
tsr:bench202409043989_6635Member
2026-02-28
0000914209
tsr:C000236749Member
tsr:bench202411054313_6635Member
2026-02-28
0000914209
tsr:C000236749Member
tsr:bench202412044922_6635Member
2026-02-28
0000914209
tsr:C000236749Member
tsr:bench202411074342_6635Member
2026-02-28
0000914209
tsr:C000236749Member
tsr:bench202411054316_6635Member
2026-02-28
0000914209
tsr:C000236749Member
tsr:bench202411054315_6635Member
2026-02-28
0000914209
tsr:C000236749Member
tsr:bench202411054314_6635Member
2026-02-28
0000914209
tsr:C000236749Member
tsr:bench202409043986_6635Member
2026-02-28
0000914209
tsr:C000236749Member
tsr:bench202411074345_6635Member
2026-02-28
0000914209
tsr:C000236749Member
tsr:bench202409043988_6635Member
2026-02-28
0000914209
tsr:C000236749Member
tsr:bench202411054317_6635Member
2026-02-28
0000914209
tsr:C000236749Member
tsr:bench202412044924_6635Member
2026-02-28
0000914209
tsr:C000236749Member
tsr:bench202411074344_6635Member
2026-02-28
0000914209
tsr:C000236749Member
tsr:bench202412044926_6635Member
2026-02-28
0000914209
tsr:C000236749Member
tsr:bench202510076710_6635Member
2026-02-28
0000914209
tsr:C000236749Member
tsr:bench202409043991_6635Member
2026-02-28
0000914209
tsr:C000236748Member
2025-09-01
2026-02-28
0000914209
tsr:C000236748Member
2026-02-28
0000914209
tsr:C000236748Member
tsr:bench202409043987_6636Member
2026-02-28
0000914209
tsr:C000236748Member
tsr:bench202409043989_6636Member
2026-02-28
0000914209
tsr:C000236748Member
tsr:bench202411054313_6636Member
2026-02-28
0000914209
tsr:C000236748Member
tsr:bench202412044922_6636Member
2026-02-28
0000914209
tsr:C000236748Member
tsr:bench202411074342_6636Member
2026-02-28
0000914209
tsr:C000236748Member
tsr:bench202411054316_6636Member
2026-02-28
0000914209
tsr:C000236748Member
tsr:bench202411054315_6636Member
2026-02-28
0000914209
tsr:C000236748Member
tsr:bench202411054314_6636Member
2026-02-28
0000914209
tsr:C000236748Member
tsr:bench202409043986_6636Member
2026-02-28
0000914209
tsr:C000236748Member
tsr:bench202411074345_6636Member
2026-02-28
0000914209
tsr:C000236748Member
tsr:bench202409043988_6636Member
2026-02-28
0000914209
tsr:C000236748Member
tsr:bench202411054317_6636Member
2026-02-28
0000914209
tsr:C000236748Member
tsr:bench202412044924_6636Member
2026-02-28
0000914209
tsr:C000236748Member
tsr:bench202411074344_6636Member
2026-02-28
0000914209
tsr:C000236748Member
tsr:bench202412044926_6636Member
2026-02-28
0000914209
tsr:C000236748Member
tsr:bench202510076710_6636Member
2026-02-28
0000914209
tsr:C000236748Member
tsr:bench202409043991_6636Member
2026-02-28
UNITED STATES
SECURITIES AND EXCHANGE COMMISSION
Washington, D.C. 20549
FORM N-CSR
CERTIFIED SHAREHOLDER REPORT OF REGISTERED
MANAGEMENT
INVESTMENT COMPANIES
Investment Company Act file number 811-07121
Putnam
Asset Allocation Funds
(Exact name of registrant as specified in charter)
100 Federal Street, Boston, Massachusetts 02110
(Address of principal executive offices) (Zip code)
Stephen Tate, Vice President
100 Federal Street
Boston, Massachusetts 02110
Copy to:
Bryan Chegwidden, Esq.
Ropes & Gray LLP
1211 Avenue of the Americas
New York, New York 10036
James E. Thomas, Esq.
Ropes & Gray LLP
800 Boylston Street
Boston, Massachusetts 02199
(Name and address of agent for service)
Registrant’s telephone number, including area
code: (617) 292-1000
Date of fiscal year end: August 31
Date of reporting period: February
28, 2026
| ITEM 1. |
REPORT TO STOCKHOLDERS. |
(a) The Report to Shareholders is filed herewith
|
|
|
|
Putnam
Multi-Asset Income Fund |
|
|
Class
A [PMIAX]
|
|
Semi-Annual
Shareholder Report | February
28, 2026 |
|
|
This
semi-annual
shareholder report
contains important information about Putnam
Multi-Asset Income Fund for the period September
1, 2025, to February
28, 2026.
You
can find additional information about the Fund at https://www.franklintempleton.com/regulatory-fund-documents.
You can also request this information
by contacting us at (800)
225-1581.
|
|
|
|
Class
Name |
Costs
of a $10,000 investment
|
Costs
paid as a percentage of a $10,000
investment*,†
|
|
Class
A |
$41
|
%
|
| * |
Reflects
fee waivers and/or expense reimbursements, without which expenses would have been higher. |
KEY
FUND STATISTICS (as
of February 28, 2026)
|
|
|
Total
Net Assets |
$861,093,537
|
|
Total
Number of Portfolio Holdings (excludes derivatives, except purchased options, if any) |
1,862
|
|
Portfolio
Turnover Rate |
53%
|
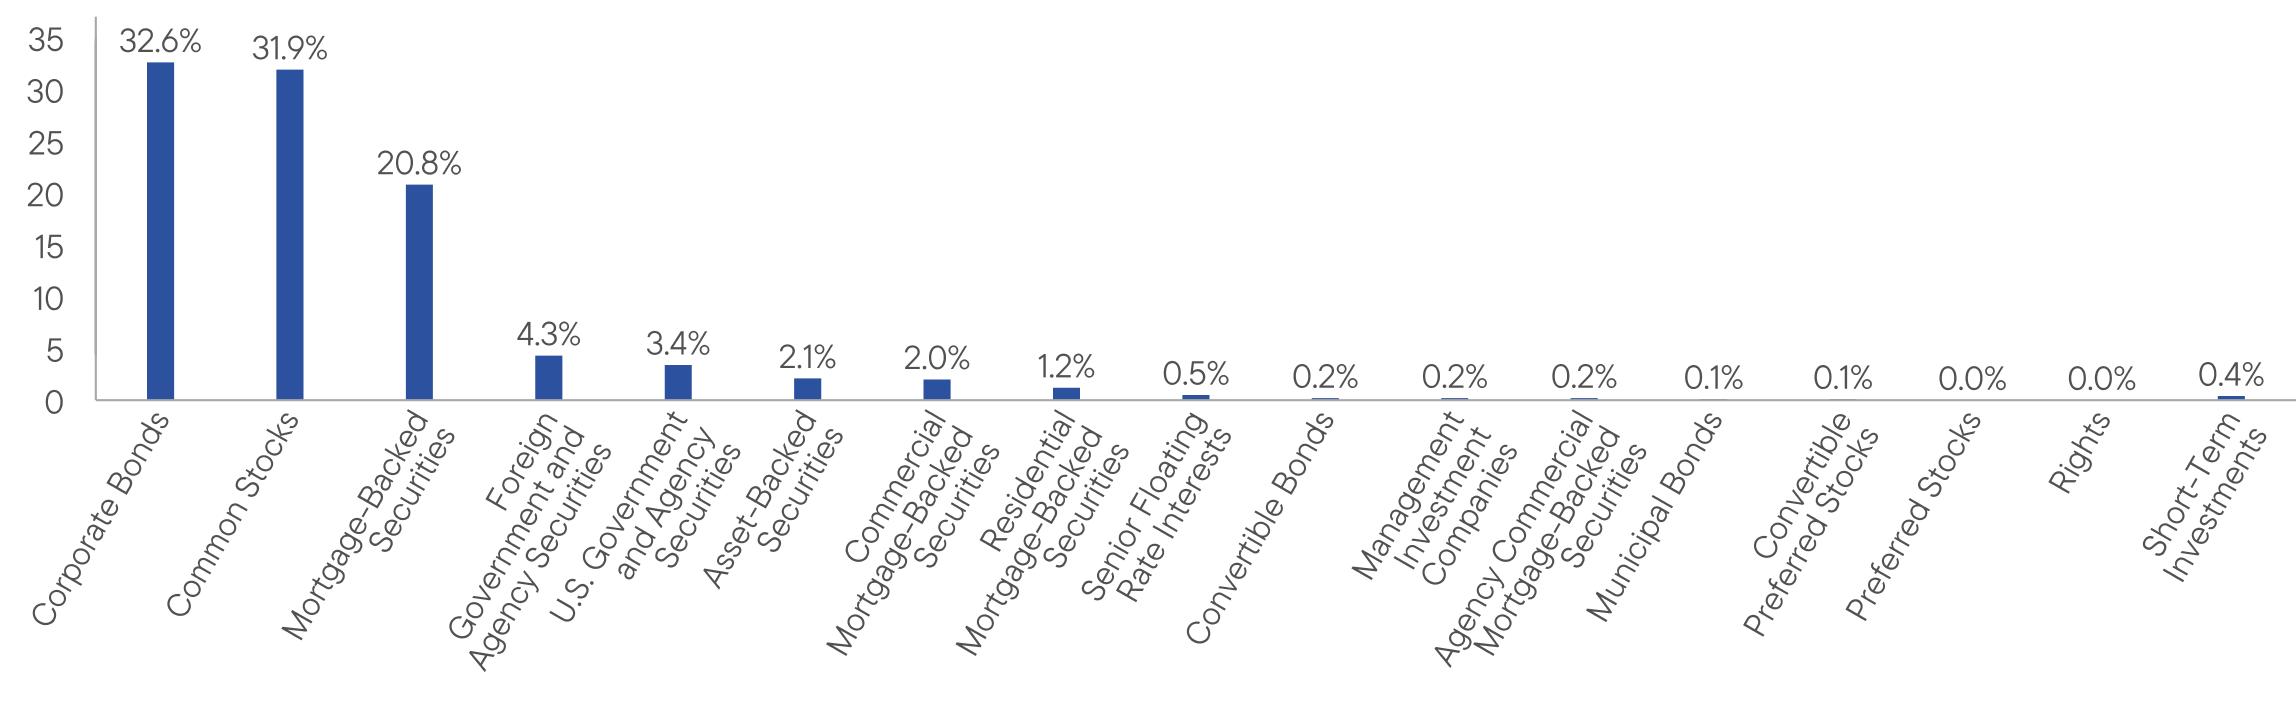
Portfolio Composition†
(% of Total Net Assets)
| U.S.
Money Markets, if any, represent the market value weights of cash, short-term securities, and derivative notional offsets in the portfolio.
Holdings and allocations may
vary over time. |
| † |
Certain
categories may represent less than 0.1%. |
|
|
|
|
WHERE
CAN I FIND ADDITIONAL INFORMATION ABOUT THE FUND? |
|
Additional
information is available on https://www.franklintempleton.com/regulatory-fund-documents,
including its: |
|
•
prospectus • proxy voting information • financial information • holdings • tax information |
| Putnam
Multi-Asset Income Fund |
PAGE
1 |
39362-STSA-0426 |
32.631.920.84.33.42.12.01.20.50.20.20.20.10.10.00.00.4
|
|
|
|
Putnam
Multi-Asset Income Fund |
|
|
Class
C [PMICX]
|
|
Semi-Annual
Shareholder Report | February
28, 2026 |
|
|
This
semi-annual
shareholder report
contains important information about Putnam
Multi-Asset Income Fund for the period September
1, 2025, to February
28, 2026.
You
can find additional information about the Fund at https://www.franklintempleton.com/regulatory-fund-documents.
You can also request this information
by contacting us at (800)
225-1581.
|
|
|
|
Class
Name |
Costs
of a $10,000 investment
|
Costs
paid as a percentage of a $10,000
investment*,†
|
|
Class
C |
$79
|
%
|
| * |
Reflects
fee waivers and/or expense reimbursements, without which expenses would have been higher. |
KEY
FUND STATISTICS (as
of February 28, 2026)
|
|
|
Total
Net Assets |
$861,093,537
|
|
Total
Number of Portfolio Holdings (excludes derivatives, except purchased options, if any) |
1,862
|
|
Portfolio
Turnover Rate |
53%
|
Portfolio Composition†
(% of Total Net Assets)
| U.S.
Money Markets, if any, represent the market value weights of cash, short-term securities, and derivative notional offsets in the portfolio.
Holdings and allocations may
vary over time. |
| † |
Certain
categories may represent less than 0.1%. |
|
|
|
|
WHERE
CAN I FIND ADDITIONAL INFORMATION ABOUT THE FUND? |
|
Additional
information is available on https://www.franklintempleton.com/regulatory-fund-documents,
including its: |
|
•
prospectus • proxy voting information • financial information • holdings • tax information |
| Putnam
Multi-Asset Income Fund |
PAGE
1 |
39362-STSC-0426 |
32.631.920.84.33.42.12.01.20.50.20.20.20.10.10.00.00.4
|
|
|
|
Putnam
Multi-Asset Income Fund |
|
|
Class
P |
|
Semi-Annual
Shareholder Report | February
28, 2026 |
|
|
This
semi-annual
shareholder report
contains important information about Putnam
Multi-Asset Income Fund for the period September
1, 2025, to February
28, 2026.
You
can find additional information about the Fund at https://www.franklintempleton.com/regulatory-fund-documents.
You can also request this information
by contacting us at (800)
225-1581.
|
|
|
|
Class
Name |
Costs
of a $10,000 investment
|
Costs
paid as a percentage of a $10,000
investment*,†
|
|
Class
P |
$22
|
%
|
| * |
Reflects
fee waivers and/or expense reimbursements, without which expenses would have been higher. |
KEY
FUND STATISTICS (as
of February 28, 2026)
|
|
|
Total
Net Assets |
$861,093,537
|
|
Total
Number of Portfolio Holdings (excludes derivatives, except purchased options, if any) |
1,862
|
|
Portfolio
Turnover Rate |
53%
|
Portfolio Composition†
(% of Total Net Assets)
| U.S.
Money Markets, if any, represent the market value weights of cash, short-term securities, and derivative notional offsets in the portfolio.
Holdings and allocations may
vary over time. |
| † |
Certain
categories may represent less than 0.1%. |
|
|
|
|
WHERE
CAN I FIND ADDITIONAL INFORMATION ABOUT THE FUND? |
|
Additional
information is available on https://www.franklintempleton.com/regulatory-fund-documents,
including its: |
|
•
prospectus • proxy voting information • financial information • holdings • tax information |
| Putnam
Multi-Asset Income Fund |
PAGE
1 |
39362-STSP-0426 |
true32.631.920.84.33.42.12.01.20.50.20.20.20.10.10.00.00.4
|
|
|
|
Putnam
Multi-Asset Income Fund |
|
|
Class
R [PMIRX]
|
|
Semi-Annual
Shareholder Report | February
28, 2026 |
|
|
This
semi-annual
shareholder report
contains important information about Putnam
Multi-Asset Income Fund for the period September
1, 2025, to February
28, 2026.
You
can find additional information about the Fund at https://www.franklintempleton.com/regulatory-fund-documents.
You can also request this information
by contacting us at (800)
225-1581.
|
|
|
|
Class
Name |
Costs
of a $10,000 investment
|
Costs
paid as a percentage of a $10,000
investment*,†
|
|
Class
R |
$54
|
%
|
| * |
Reflects
fee waivers and/or expense reimbursements, without which expenses would have been higher. |
KEY
FUND STATISTICS (as
of February 28, 2026)
|
|
|
Total
Net Assets |
$861,093,537
|
|
Total
Number of Portfolio Holdings (excludes derivatives, except purchased options, if any) |
1,862
|
|
Portfolio
Turnover Rate |
53%
|
Portfolio Composition†
(% of Total Net Assets)
| U.S.
Money Markets, if any, represent the market value weights of cash, short-term securities, and derivative notional offsets in the portfolio.
Holdings and allocations may
vary over time. |
| † |
Certain
categories may represent less than 0.1%. |
|
|
|
|
WHERE
CAN I FIND ADDITIONAL INFORMATION ABOUT THE FUND? |
|
Additional
information is available on https://www.franklintempleton.com/regulatory-fund-documents,
including its: |
|
•
prospectus • proxy voting information • financial information • holdings • tax information |
| Putnam
Multi-Asset Income Fund |
PAGE
1 |
39362-STSR-0426 |
32.631.920.84.33.42.12.01.20.50.20.20.20.10.10.00.00.4
|
|
|
|
Putnam
Multi-Asset Income Fund |
|
|
Class
R5 [PMILX]
|
|
Semi-Annual
Shareholder Report | February
28, 2026 |
|
|
This
semi-annual
shareholder report
contains important information about Putnam
Multi-Asset Income Fund for the period September
1, 2025, to February
28, 2026.
You
can find additional information about the Fund at https://www.franklintempleton.com/regulatory-fund-documents.
You can also request this information
by contacting us at (800)
225-1581.
|
|
|
|
Class
Name |
Costs
of a $10,000 investment
|
Costs
paid as a percentage of a $10,000
investment*,†
|
|
Class
R5 |
$28
|
%
|
| * |
Reflects
fee waivers and/or expense reimbursements, without which expenses would have been higher. |
KEY
FUND STATISTICS (as
of February 28, 2026)
|
|
|
Total
Net Assets |
$861,093,537
|
|
Total
Number of Portfolio Holdings (excludes derivatives, except purchased options, if any) |
1,862
|
|
Portfolio
Turnover Rate |
53%
|
Portfolio Composition†
(% of Total Net Assets)
| U.S.
Money Markets, if any, represent the market value weights of cash, short-term securities, and derivative notional offsets in the portfolio.
Holdings and allocations may
vary over time. |
| † |
Certain
categories may represent less than 0.1%. |
|
|
|
|
WHERE
CAN I FIND ADDITIONAL INFORMATION ABOUT THE FUND? |
|
Additional
information is available on https://www.franklintempleton.com/regulatory-fund-documents,
including its: |
|
•
prospectus • proxy voting information • financial information • holdings • tax information |
| Putnam
Multi-Asset Income Fund |
PAGE
1 |
39362-STSR5-0426 |
32.631.920.84.33.42.12.01.20.50.20.20.20.10.10.00.00.4
|
|
|
|
Putnam
Multi-Asset Income Fund |
|
|
Class
R6 [PMIVX]
|
|
Semi-Annual
Shareholder Report | February
28, 2026 |
|
|
This
semi-annual
shareholder report
contains important information about Putnam
Multi-Asset Income Fund for the period September
1, 2025, to February
28, 2026.
You
can find additional information about the Fund at https://www.franklintempleton.com/regulatory-fund-documents.
You can also request this information
by contacting us at (800)
225-1581.
|
|
|
|
Class
Name |
Costs
of a $10,000 investment
|
Costs
paid as a percentage of a $10,000
investment*,†
|
|
Class
R6 |
$24
|
%
|
| * |
Reflects
fee waivers and/or expense reimbursements, without which expenses would have been higher. |
KEY
FUND STATISTICS (as
of February 28, 2026)
|
|
|
Total
Net Assets |
$861,093,537
|
|
Total
Number of Portfolio Holdings (excludes derivatives, except purchased options, if any) |
1,862
|
|
Portfolio
Turnover Rate |
53%
|
Portfolio Composition†
(% of Total Net Assets)
| U.S.
Money Markets, if any, represent the market value weights of cash, short-term securities, and derivative notional offsets in the portfolio.
Holdings and allocations may
vary over time. |
| † |
Certain
categories may represent less than 0.1%. |
|
|
|
|
WHERE
CAN I FIND ADDITIONAL INFORMATION ABOUT THE FUND? |
|
Additional
information is available on https://www.franklintempleton.com/regulatory-fund-documents,
including its: |
|
•
prospectus • proxy voting information • financial information • holdings • tax information |
| Putnam
Multi-Asset Income Fund |
PAGE
1 |
39362-STSR6-0426 |
32.631.920.84.33.42.12.01.20.50.20.20.20.10.10.00.00.4
|
|
|
|
Putnam
Multi-Asset Income Fund |
|
|
Class
Y [PMIYX]
|
|
Semi-Annual
Shareholder Report | February
28, 2026 |
|
|
This
semi-annual
shareholder report
contains important information about Putnam
Multi-Asset Income Fund for the period September
1, 2025, to February
28, 2026.
You
can find additional information about the Fund at https://www.franklintempleton.com/regulatory-fund-documents.
You can also request this information
by contacting us at (800)
225-1581.
|
|
|
|
Class
Name |
Costs
of a $10,000 investment
|
Costs
paid as a percentage of a $10,000
investment*,†
|
|
Class
Y |
$28
|
%
|
| * |
Reflects
fee waivers and/or expense reimbursements, without which expenses would have been higher. |
KEY
FUND STATISTICS (as
of February 28, 2026)
|
|
|
Total
Net Assets |
$861,093,537
|
|
Total
Number of Portfolio Holdings (excludes derivatives, except purchased options, if any) |
1,862
|
|
Portfolio
Turnover Rate |
53%
|
Portfolio Composition†
(% of Total Net Assets)
| U.S.
Money Markets, if any, represent the market value weights of cash, short-term securities, and derivative notional offsets in the portfolio.
Holdings and allocations may
vary over time. |
| † |
Certain
categories may represent less than 0.1%. |
|
|
|
|
WHERE
CAN I FIND ADDITIONAL INFORMATION ABOUT THE FUND? |
|
Additional
information is available on https://www.franklintempleton.com/regulatory-fund-documents,
including its: |
|
•
prospectus • proxy voting information • financial information • holdings • tax information |
| Putnam
Multi-Asset Income Fund |
PAGE
1 |
39362-STSY-0426 |
32.631.920.84.33.42.12.01.20.50.20.20.20.10.10.00.00.4
(b) Not applicable
Not applicable.
| ITEM 3. |
AUDIT COMMITTEE FINANCIAL EXPERT. |
Not applicable.
| ITEM 4. |
PRINCIPAL ACCOUNTANT FEES AND
SERVICES. |
Not applicable.
| ITEM 5. |
AUDIT COMMITTEE OF LISTED REGISTRANTS. |
Not applicable.
| ITEM 6. |
SCHEDULE OF INVESTMENTS. |
|
(a) |
Please see schedule of investments contained in the Financial Statements and Financial Highlights included under Item 7 of this Form N-CSR. |
| ITEM
7. |
FINANCIAL STATEMENTS AND FINANCIAL
HIGHLIGHTS FOR OPEN-END MANAGEMENT INVESTMENT COMPANIES. |
Putnam
Multi-Asset
Income
Fund
Financial
Statements
and
Other
Important
Information
Semi-Annual
|
February
28,
2026
If
you
need
assistance
accessing
this
content,
please
reach
out
to
your
sales
representative
or
send
an
email
to
accessibility@franklintempleton.com
.
Financial
Statements
and
Other
Important
Information—Semiannual
Consolidated
Financial
Highlights
and
Consolidated
Schedule
of
Investments
2
Consolidated
Financial
Statements
65
Notes
to
Consolidated
Financial
Statements
70
Changes
In
and
Disagreements
with
Accountants
86
Results
of
Meeting(s)
of
Shareholders
86
Remuneration
Paid
to
Directors,
Officers
and
Others
86
Board
Approval
of
Management
and
Subadvisory
Agreements
86
Putnam
Asset
Allocation
Funds
Consolidated
Financial
Highlights
Putnam
Multi-Asset
Income
Fund
Semiannual
Report
The
accompanying
notes
are
an
integral
part
of
these
consolidated
financial
statements.
a
Six
Months
Ended
February
28,
2026
(unaudited)
Year
Ended
August
31,
Year
Ended
August
31,
2023
a
2025*
2024
Class
A
Per
share
operating
performance
(for
a
share
outstanding
throughout
the
period)
Net
asset
value,
beginning
of
period
..............................
$11.04
$10.79
$9.70
$9.64
Income
from
investment
operations
b
:
Net
investment
income
c
......................................
0.20
0.43
0.35
0.20
Net
realized
and
unrealized
gains
(losses)
........................
0.52
0.27
1.11
(0.02)
Total
from
investment
operations
.................................
0.72
0.70
1.46
0.18
Less
distributions
from:
Net
investment
income
.......................................
(0.20)
(0.45)
(0.37)
(0.12)
Net
asset
value,
end
of
period
...................................
$11.56
$11.04
$10.79
$9.70
Total
return
d
................................................
6.56%
6.70%
15.38%
1.85%
Ratios
to
average
net
assets
e
Expenses
before
waiver
and
payments
by
affiliates
...................
0.99%
1.10%
1.11%
0.71%
Expenses
net
of
waiver
and
payments
by
affiliates
f
...................
0.80%
0.88%
0.83%
0.46%
Net
investment
income
........................................
3.64%
3.91%
3.43%
2.05%
Supplemental
data
Net
assets,
end
of
period
(000’s)
.................................
$151,280
$144,905
$147,709
$142,258
Portfolio
turnover
rate
.........................................
53%
101%
143%
109%
*
Includes
the
consolidated
operations
of
Franklin
Multi-Asset
Income
Ltd.
from
July
7,
2025
through
August
31,
2025.
See
Note
1(g).
a
For
the
period
February
10,
2023
(commencement
of
operations)
to
August
31,
2023.
b
The
amount
shown
for
a
share
outstanding
throughout
the
period
may
not
correlate
with
the
Consolidated
Statement
of
Operations
for
the
period
due
to
the
timing
of
sales
and
repurchases
of
the
Fund’s
shares
in
relation
to
income
earned
and/or
fluctuating
fair
value
of
the
investments
of
the
Fund.
c
Based
on
average
daily
shares
outstanding.
d
Total
return
does
not
reflect
sales
commissions
or
contingent
deferred
sales
charges,
if
applicable,
and
is
not
annualized
for
periods
less
than
one
year.
e
Ratios
are
annualized
for
periods
less
than
one
year.
f
Benefit
of
expense
reduction
rounds
to
less
than
0.01%.
Putnam
Asset
Allocation
Funds
Consolidated
Financial
Highlights
Putnam
Multi-Asset
Income
Fund
The
accompanying
notes
are
an
integral
part
of
these
consolidated
financial
statements.
Semiannual
Report
a
Six
Months
Ended
February
28,
2026
(unaudited)
Year
Ended
August
31,
Year
Ended
August
31,
2023
a
2025*
2024
Class
C
Per
share
operating
performance
(for
a
share
outstanding
throughout
the
period)
Net
asset
value,
beginning
of
period
..............................
$11.05
$10.79
$9.70
$9.64
Income
from
investment
operations
b
:
Net
investment
income
c
......................................
0.16
0.35
0.25
0.16
Net
realized
and
unrealized
gains
(losses)
........................
0.52
0.28
1.13
(0.02)
Total
from
investment
operations
.................................
0.68
0.63
1.38
0.14
Less
distributions
from:
Net
investment
income
.......................................
(0.16)
(0.37)
(0.29)
(0.08)
Net
asset
value,
end
of
period
...................................
$11.57
$11.05
$10.79
$9.70
Total
return
d
................................................
6.16%
5.95%
14.50%
1.44%
Ratios
to
average
net
assets
e
Expenses
before
waiver
and
payments
by
affiliates
...................
1.74%
1.85%
1.86%
1.13%
Expenses
net
of
waiver
and
payments
by
affiliates
f
...................
1.55%
1.63%
1.58%
0.88%
Net
investment
income
........................................
2.90%
3.16%
2.52%
1.64%
Supplemental
data
Net
assets,
end
of
period
(000’s)
.................................
$3,322
$3,680
$6,629
$12,028
Portfolio
turnover
rate
.........................................
53%
101%
143%
109%
*
Includes
the
consolidated
operations
of
Franklin
Multi-Asset
Income
Ltd.
from
July
7,
2025
through
August
31,
2025.
See
Note
1(g).
a
For
the
period
February
10,
2023
(commencement
of
operations)
to
August
31,
2023.
b
The
amount
shown
for
a
share
outstanding
throughout
the
period
may
not
correlate
with
the
Consolidated
Statement
of
Operations
for
the
period
due
to
the
timing
of
sales
and
repurchases
of
the
Fund’s
shares
in
relation
to
income
earned
and/or
fluctuating
fair
value
of
the
investments
of
the
Fund.
c
Based
on
average
daily
shares
outstanding.
d
Total
return
does
not
reflect
sales
commissions
or
contingent
deferred
sales
charges,
if
applicable,
and
is
not
annualized
for
periods
less
than
one
year.
e
Ratios
are
annualized
for
periods
less
than
one
year.
f
Benefit
of
expense
reduction
rounds
to
less
than
0.01%.
Putnam
Asset
Allocation
Funds
Consolidated
Financial
Highlights
Putnam
Multi-Asset
Income
Fund
Semiannual
Report
The
accompanying
notes
are
an
integral
part
of
these
consolidated
financial
statements.
a
Six
Months
Ended
February
28,
2026
(unaudited)
Year
Ended
August
31,
2025*
2024
2023
2022
2021
Class
P
Per
share
operating
performance
(for
a
share
outstanding
throughout
the
period)
Net
asset
value,
beginning
of
period
.....
$11.06
$10.80
$9.71
$9.59
$11.28
$10.49
Income
from
investment
operations
a
:
Net
investment
income
b
.............
0.22
0.47
0.40
0.34
0.07
0.04
Net
realized
and
unrealized
gains
(losses)
0.52
0.28
1.10
0.05
(1.30)
0.96
Total
from
investment
operations
........
0.74
0.75
1.50
0.39
(1.23)
1.00
Less
distributions
from:
Net
investment
income
..............
(0.22)
(0.49)
(0.41)
(0.15)
(0.08)
(0.21)
Net
realized
gains
.................
—
—
—
(0.12)
(0.38)
—
Total
distributions
...................
(0.22)
(0.49)
(0.41)
(0.27)
(0.46)
(0.21)
Net
asset
value,
end
of
period
..........
$11.58
$11.06
$10.80
$9.71
$9.59
$11.28
Total
return
c
.......................
6.75%
7.23%
15.85%
4.23%
(11.37)%
9.68%
Ratios
to
average
net
assets
d
Expenses
before
waiver
and
payments
by
affiliates
..........................
0.56%
0.69%
0.69%
1.78%
2.90%
1.13%
Expenses
net
of
waiver
and
payments
by
affiliates
e
..........................
0.42%
0.47%
0.41%
0.41%
0.23%
0.20%
Net
investment
income
...............
3.75%
4.32%
3.92%
3.58%
0.66%
0.40%
Supplemental
data
Net
assets,
end
of
period
(000’s)
........
$677,124
$46,813
$33,945
$20,177
$17,224
$15,322
Portfolio
turnover
rate
................
53%
101%
143%
109%
124%
144%
*
Includes
the
consolidated
operations
of
Franklin
Multi-Asset
Income
Ltd.
from
July
7,
2025
through
August
31,
2025.
See
Note
1(g).
a
The
amount
shown
for
a
share
outstanding
throughout
the
period
may
not
correlate
with
the
Consolidated
Statement
of
Operations
for
the
period
due
to
the
timing
of
sales
and
repurchases
of
the
Fund’s
shares
in
relation
to
income
earned
and/or
fluctuating
fair
value
of
the
investments
of
the
Fund.
b
Based
on
average
daily
shares
outstanding.
c
Total
return
is
not
annualized
for
periods
less
than
one
year.
d
Ratios
are
annualized
for
periods
less
than
one
year.
e
Benefit
of
expense
reduction
rounds
to
less
than
0.01%.
Putnam
Asset
Allocation
Funds
Consolidated
Financial
Highlights
Putnam
Multi-Asset
Income
Fund
The
accompanying
notes
are
an
integral
part
of
these
consolidated
financial
statements.
Semiannual
Report
a
Six
Months
Ended
February
28,
2026
(unaudited)
Year
Ended
August
31,
Year
Ended
August
31,
2023
a
2025*
2024
Class
R
Per
share
operating
performance
(for
a
share
outstanding
throughout
the
period)
Net
asset
value,
beginning
of
period
..............................
$11.04
$10.79
$9.70
$9.64
Income
from
investment
operations
b
:
Net
investment
income
c
......................................
0.19
0.40
0.32
0.18
Net
realized
and
unrealized
gains
(losses)
........................
0.52
0.27
1.12
(0.02)
Total
from
investment
operations
.................................
0.71
0.67
1.44
0.16
Less
distributions
from:
Net
investment
income
.......................................
(0.18)
(0.42)
(0.35)
(0.10)
Net
asset
value,
end
of
period
...................................
$11.57
$11.04
$10.79
$9.70
Total
return
d
................................................
6.43%
6.44%
15.10%
1.71%
Ratios
to
average
net
assets
e
Expenses
before
waiver
and
payments
by
affiliates
...................
1.24%
1.34%
1.36%
0.85%
Expenses
net
of
waiver
and
payments
by
affiliates
f
...................
1.05%
1.12%
1.08%
0.60%
Net
investment
income
........................................
3.39%
3.67%
3.22%
1.91%
Supplemental
data
Net
assets,
end
of
period
(000’s)
.................................
$1,654
$1,544
$1,556
$2,306
Portfolio
turnover
rate
.........................................
53%
101%
143%
109%
*
Includes
the
consolidated
operations
of
Franklin
Multi-Asset
Income
Ltd.
from
July
7,
2025
through
August
31,
2025.
See
Note
1(g).
a
For
the
period
February
10,
2023
(commencement
of
operations)
to
August
31,
2023.
b
The
amount
shown
for
a
share
outstanding
throughout
the
period
may
not
correlate
with
the
Consolidated
Statement
of
Operations
for
the
period
due
to
the
timing
of
sales
and
repurchases
of
the
Fund’s
shares
in
relation
to
income
earned
and/or
fluctuating
fair
value
of
the
investments
of
the
Fund.
c
Based
on
average
daily
shares
outstanding.
d
Total
return
is
not
annualized
for
periods
less
than
one
year.
e
Ratios
are
annualized
for
periods
less
than
one
year.
f
Benefit
of
expense
reduction
rounds
to
less
than
0.01%.
Putnam
Asset
Allocation
Funds
Consolidated
Financial
Highlights
Putnam
Multi-Asset
Income
Fund
Semiannual
Report
The
accompanying
notes
are
an
integral
part
of
these
consolidated
financial
statements.
a
Six
Months
Ended
February
28,
2026
(unaudited)
Year
Ended
August
31,
Year
Ended
August
31,
2023
a
2025*
2024
Class
R5
Per
share
operating
performance
(for
a
share
outstanding
throughout
the
period)
Net
asset
value,
beginning
of
period
..............................
$11.05
$10.80
$9.71
$9.64
Income
from
investment
operations
b
:
Net
investment
income
c
......................................
0.22
0.45
0.38
0.21
Net
realized
and
unrealized
gains
(losses)
........................
0.51
0.28
1.11
(0.01)
Total
from
investment
operations
.................................
0.73
0.73
1.49
0.20
Less
distributions
from:
Net
investment
income
.......................................
(0.21)
(0.48)
(0.40)
(0.13)
Net
asset
value,
end
of
period
...................................
$11.57
$11.05
$10.80
$9.71
Total
return
d
................................................
6.69%
6.98%
15.68%
2.09%
Ratios
to
average
net
assets
e
Expenses
before
waiver
and
payments
by
affiliates
...................
0.73%
0.84%
0.83%
0.56%
Expenses
net
of
waiver
and
payments
by
affiliates
f
...................
0.55%
0.62%
0.55%
0.31%
Net
investment
income
........................................
3.89%
4.17%
3.72%
2.21%
Supplemental
data
Net
assets,
end
of
period
(000’s)
.................................
$12
$12
$12
$10
Portfolio
turnover
rate
.........................................
53%
101%
143%
109%
*
Includes
the
consolidated
operations
of
Franklin
Multi-Asset
Income
Ltd.
from
July
7,
2025
through
August
31,
2025.
See
Note
1(g).
a
For
the
period
February
10,
2023
(commencement
of
operations)
to
August
31,
2023.
b
The
amount
shown
for
a
share
outstanding
throughout
the
period
may
not
correlate
with
the
Consolidated
Statement
of
Operations
for
the
period
due
to
the
timing
of
sales
and
repurchases
of
the
Fund’s
shares
in
relation
to
income
earned
and/or
fluctuating
fair
value
of
the
investments
of
the
Fund.
c
Based
on
average
daily
shares
outstanding.
d
Total
return
is
not
annualized
for
periods
less
than
one
year.
e
Ratios
are
annualized
for
periods
less
than
one
year.
f
Benefit
of
expense
reduction
rounds
to
less
than
0.01%.
Putnam
Asset
Allocation
Funds
Consolidated
Financial
Highlights
Putnam
Multi-Asset
Income
Fund
The
accompanying
notes
are
an
integral
part
of
these
consolidated
financial
statements.
Semiannual
Report
a
Six
Months
Ended
February
28,
2026
(unaudited)
Year
Ended
August
31,
Year
Ended
August
31,
2023
a
2025*
2024
Class
R6
Per
share
operating
performance
(for
a
share
outstanding
throughout
the
period)
Net
asset
value,
beginning
of
period
..............................
$11.05
$10.79
$9.70
$9.64
Income
from
investment
operations
b
:
Net
investment
income
c
......................................
0.22
0.46
0.37
0.22
Net
realized
and
unrealized
gains
(losses)
........................
0.52
0.29
1.13
(0.02)
Total
from
investment
operations
.................................
0.74
0.75
1.50
0.20
Less
distributions
from:
Net
investment
income
.......................................
(0.22)
(0.49)
(0.41)
(0.14)
Net
asset
value,
end
of
period
...................................
$11.57
$11.05
$10.79
$9.70
Total
return
d
................................................
6.74%
7.17%
15.81%
2.05%
Ratios
to
average
net
assets
e
Expenses
before
waiver
and
payments
by
affiliates
...................
0.64%
0.73%
0.73%
0.50%
Expenses
net
of
waiver
and
payments
by
affiliates
f
...................
0.46%
0.51%
0.45%
0.25%
Net
investment
income
........................................
3.98%
4.28%
3.71%
2.26%
Supplemental
data
Net
assets,
end
of
period
(000’s)
.................................
$1,048
$752
$3,894
$4,925
Portfolio
turnover
rate
.........................................
53%
101%
143%
109%
*
Includes
the
consolidated
operations
of
Franklin
Multi-Asset
Income
Ltd.
from
July
7,
2025
through
August
31,
2025.
See
Note
1(g).
a
For
the
period
February
10,
2023
(commencement
of
operations)
to
August
31,
2023.
b
The
amount
shown
for
a
share
outstanding
throughout
the
period
may
not
correlate
with
the
Consolidated
Statement
of
Operations
for
the
period
due
to
the
timing
of
sales
and
repurchases
of
the
Fund’s
shares
in
relation
to
income
earned
and/or
fluctuating
fair
value
of
the
investments
of
the
Fund.
c
Based
on
average
daily
shares
outstanding.
d
Total
return
is
not
annualized
for
periods
less
than
one
year.
e
Ratios
are
annualized
for
periods
less
than
one
year.
f
Benefit
of
expense
reduction
rounds
to
less
than
0.01%.
Putnam
Asset
Allocation
Funds
Consolidated
Financial
Highlights
Putnam
Multi-Asset
Income
Fund
Semiannual
Report
The
accompanying
notes
are
an
integral
part
of
these
consolidated
financial
statements.
a
Six
Months
Ended
February
28,
2026
(unaudited)
Year
Ended
August
31,
Year
Ended
August
31,
2023
a
2025*
2024
Class
Y
Per
share
operating
performance
(for
a
share
outstanding
throughout
the
period)
Net
asset
value,
beginning
of
period
..............................
$11.05
$10.79
$9.70
$9.64
Income
from
investment
operations
b
:
Net
investment
income
c
......................................
0.22
0.45
0.37
0.21
Net
realized
and
unrealized
gains
(losses)
........................
0.51
0.29
1.12
(0.02)
Total
from
investment
operations
.................................
0.73
0.74
1.49
0.19
Less
distributions
from:
Net
investment
income
.......................................
(0.21)
(0.48)
(0.40)
(0.13)
Net
asset
value,
end
of
period
...................................
$11.57
$11.05
$10.79
$9.70
Total
return
d
................................................
6.68%
7.05%
15.66%
1.98%
Ratios
to
average
net
assets
e
Expenses
before
waiver
and
payments
by
affiliates
...................
0.74%
0.85%
0.86%
0.57%
Expenses
net
of
waiver
and
payments
by
affiliates
f
...................
0.55%
0.63%
0.58%
0.32%
Net
investment
income
........................................
3.89%
4.16%
3.62%
2.19%
Supplemental
data
Net
assets,
end
of
period
(000’s)
.................................
$26,653
$25,161
$34,753
$39,854
Portfolio
turnover
rate
.........................................
53%
101%
143%
109%
*
Includes
the
consolidated
operations
of
Franklin
Multi-Asset
Income
Ltd.
from
July
7,
2025
through
August
31,
2025.
See
Note
1(g).
a
For
the
period
February
10,
2023
(commencement
of
operations)
to
August
31,
2023.
b
The
amount
shown
for
a
share
outstanding
throughout
the
period
may
not
correlate
with
the
Consolidated
Statement
of
Operations
for
the
period
due
to
the
timing
of
sales
and
repurchases
of
the
Fund’s
shares
in
relation
to
income
earned
and/or
fluctuating
fair
value
of
the
investments
of
the
Fund.
c
Based
on
average
daily
shares
outstanding.
d
Total
return
is
not
annualized
for
periods
less
than
one
year.
e
Ratios
are
annualized
for
periods
less
than
one
year.
f
Benefit
of
expense
reduction
rounds
to
less
than
0.01%.
Putnam
Asset
Allocation
Funds
Consolidated
Schedule
of
Investments
(unaudited),
February
28,
2026
Putnam
Multi-Asset
Income
Fund
The
accompanying
notes
are
an
integral
part
of
these
consolidated
financial
statements.
Semiannual
Report
a
a
Country
Shares
a
Value
a
a
a
a
a
a
Common
Stocks
26.2%
Aerospace
&
Defense
0.4%
a
AeroVironment,
Inc.
.................................
United
States
20
$
5,045
a
Astronics
Corp.
.....................................
United
States
552
44,502
a
Firefly
Aerospace,
Inc.
................................
United
States
1,110
21,390
General
Dynamics
Corp.
..............................
United
States
462
164,957
General
Electric
Co.
.................................
United
States
581
198,853
a
Kratos
Defense
&
Security
Solutions,
Inc.
.................
United
States
113
9,738
Lockheed
Martin
Corp.
...............................
United
States
5,171
3,402,932
Moog,
Inc.,
A
.......................................
United
States
43
14,509
Rheinmetall
AG
.....................................
Germany
106
209,687
Rolls-Royce
Holdings
plc
.............................
United
Kingdom
13,471
242,237
RTX
Corp.
........................................
United
States
970
196,541
Safran
SA
.........................................
France
280
112,767
a
V2X,
Inc.
..........................................
United
States
294
20,507
4,643,665
Air
Freight
&
Logistics
0.5%
Deutsche
Post
AG
...................................
Germany
2,143
126,191
FedEx
Corp.
.......................................
United
States
588
227,556
Hub
Group,
Inc.,
A
...................................
United
States
591
25,454
United
Parcel
Service,
Inc.,
B
..........................
United
States
26,966
3,126,977
3,506,178
Automobile
Components
0.2%
a
Adient
plc
.........................................
United
States
905
22,010
BorgWarner,
Inc.
....................................
United
States
3,717
213,988
Dana,
Inc.
.........................................
United
States
1,904
65,193
a
Dauch
Corp.
.......................................
United
States
1,030
6,798
Denso
Corp.
.......................................
Japan
3,700
53,087
a
Gentherm,
Inc.
.....................................
United
States
268
8,782
Sumitomo
Electric
Industries
Ltd.
.......................
Japan
5,800
383,260
Visteon
Corp.
......................................
United
States
508
48,600
801,718
Automobiles
1.2%
Bayerische
Motoren
Werke
AG
.........................
Germany
610
63,930
Ford
Motor
Co.
.....................................
United
States
208,269
2,934,510
Mercedes-Benz
Group
AG
............................
Germany
4,410
305,122
Stellantis
NV
.......................................
United
States
9,200
74,930
Stellantis
NV
.......................................
United
States
21,754
176,509
a
Tesla,
Inc.
.........................................
United
States
9,316
3,749,783
Toyota
Motor
Corp.
..................................
Japan
25,800
625,092
7,929,876
Banks
1.5%
b
ABN
AMRO
Bank
NV,
CVA,
144A,
Reg
S
.................
Netherlands
5,239
175,469
Amalgamated
Financial
Corp.
..........................
United
States
603
23,209
Ameris
Bancorp
....................................
United
States
123
9,552
ANZ
Group
Holdings
Ltd.
.............................
Australia
18,014
512,691
Associated
Banc-Corp.
...............................
United
States
343
9,059
a
Axos
Financial,
Inc.
..................................
United
States
620
53,828
Banco
Bilbao
Vizcaya
Argentaria
SA
.....................
Spain
12,944
299,804
Banco
BPM
SpA
....................................
Italy
17,472
257,365
Banco
de
Sabadell
SA
...............................
Spain
88,412
332,874
Bank
Leumi
Le-Israel
BM
.............................
Israel
5,783
140,004
Bank
of
America
Corp.
...............................
United
States
3,726
185,667
Bank
of
Hawaii
Corp.
................................
United
States
334
25,307
Bank
of
NT
Butterfield
&
Son
Ltd.
(The)
...................
United
States
566
28,725
Banner
Corp.
......................................
United
States
141
8,298
Putnam
Asset
Allocation
Funds
Consolidated
Schedule
of
Investments
(unaudited)
Putnam
Multi-Asset
Income
Fund
Semiannual
Report
The
accompanying
notes
are
an
integral
part
of
these
consolidated
financial
statements.
a
a
Country
Shares
a
Value
a
a
a
a
a
a
Common
Stocks
(continued)
Banks
(continued)
Beacon
Financial
Corp.
...............................
United
States
330
$
9,814
BNP
Paribas
SA
....................................
France
5,234
587,682
BOC
Hong
Kong
Holdings
Ltd.
.........................
China
35,000
200,191
CaixaBank
SA
......................................
Spain
34,457
424,692
Cathay
General
Bancorp
..............................
United
States
988
49,113
Central
Pacific
Financial
Corp.
.........................
United
States
563
17,932
Citigroup,
Inc.
......................................
United
States
2,369
261,040
Citizens
Financial
Group,
Inc.
..........................
United
States
2,958
178,042
Credit
Agricole
SA
...................................
France
12,721
281,045
a
Customers
Bancorp,
Inc.
..............................
United
States
669
45,117
Danske
Bank
A/S
...................................
Denmark
3,868
201,811
DBS
Group
Holdings
Ltd.
.............................
Singapore
2,300
103,604
Enterprise
Financial
Services
Corp.
......................
United
States
474
27,065
Financial
Institutions,
Inc.
.............................
United
States
299
9,383
First
Bancorp
......................................
United
States
2,375
50,184
First
Financial
Corp.
.................................
United
States
165
10,454
First
Merchants
Corp.
................................
United
States
109
4,260
Flushing
Financial
Corp.
..............................
United
States
1,004
15,492
Hancock
Whitney
Corp.
...............................
United
States
674
44,356
Hanmi
Financial
Corp.
................................
United
States
574
14,987
Heritage
Commerce
Corp.
.............................
United
States
849
10,553
Hilltop
Holdings,
Inc.
.................................
United
States
1,062
39,751
Hope
Bancorp,
Inc.
..................................
United
States
1,210
13,625
HSBC
Holdings
plc
..................................
United
Kingdom
50,713
947,877
Independent
Bank
Corp.
..............................
United
States
366
12,718
Intesa
Sanpaolo
SpA
.................................
Italy
72,670
498,629
JPMorgan
Chase
&
Co.
...............................
United
States
581
174,474
Mercantile
Bank
Corp.
................................
United
States
193
9,970
Metropolitan
Bank
Holding
Corp.
........................
United
States
130
10,940
Mitsubishi
UFJ
Financial
Group,
Inc.
.....................
Japan
8,100
150,369
National
Bank
Holdings
Corp.,
A
........................
United
States
870
34,791
Nordea
Bank
Abp
...................................
Finland
23,580
456,286
Northrim
BanCorp,
Inc.
...............................
United
States
325
7,634
Northwest
Bancshares,
Inc.
............................
United
States
727
9,051
OFG
Bancorp
......................................
United
States
648
25,972
Origin
Bancorp,
Inc.
.................................
United
States
247
10,275
Oversea-Chinese
Banking
Corp.
Ltd.
.....................
Singapore
4,400
74,462
Pathward
Financial,
Inc.
..............................
United
States
497
45,123
PNC
Financial
Services
Group,
Inc.
(The)
.................
United
States
872
185,169
Popular,
Inc.
.......................................
United
States
1,504
203,581
Preferred
Bank
.....................................
United
States
256
22,456
Regions
Financial
Corp.
..............................
United
States
6,449
179,476
Shore
Bancshares,
Inc.
...............................
United
States
456
8,472
Simmons
First
National
Corp.,
A
........................
United
States
1,122
22,339
SmartFinancial,
Inc.
.................................
United
States
122
4,784
Southern
Missouri
Bancorp,
Inc.
........................
United
States
156
9,658
Swedbank
AB,
A
....................................
Sweden
5,717
219,608
a
Third
Coast
Bancshares,
Inc.
..........................
United
States
219
8,675
Towne
Bank
.......................................
United
States
259
8,873
Truist
Financial
Corp.
................................
United
States
3,418
168,542
Trustmark
Corp.
....................................
United
States
864
36,798
United
Community
Banks,
Inc.
.........................
United
States
296
9,522
United
Overseas
Bank
Ltd.
............................
Singapore
8,600
250,926
Univest
Financial
Corp.
...............................
United
States
360
12,078
US
Bancorp
.......................................
United
States
51,251
2,801,380
Valley
National
Bancorp
..............................
United
States
830
10,466
WaFd,
Inc.
........................................
United
States
278
8,662
Wells
Fargo
&
Co.
...................................
United
States
23,185
1,888,418
Putnam
Asset
Allocation
Funds
Consolidated
Schedule
of
Investments
(unaudited)
Putnam
Multi-Asset
Income
Fund
The
accompanying
notes
are
an
integral
part
of
these
consolidated
financial
statements.
Semiannual
Report
a
a
Country
Shares
a
Value
a
a
a
a
a
a
Common
Stocks
(continued)
Banks
(continued)
Westamerica
BanCorp
...............................
United
States
219
$
11,092
WSFS
Financial
Corp.
................................
United
States
165
10,479
Zions
Bancorp
NA
...................................
United
States
3,395
194,466
13,406,536
Beverages
0.4%
Coca-Cola
Co.
(The)
.................................
United
States
2,412
196,723
Diageo
plc
........................................
United
Kingdom
3,807
85,378
Keurig
Dr.
Pepper,
Inc.
...............................
United
States
6,634
200,878
PepsiCo,
Inc.
......................................
United
States
21,326
3,619,875
4,102,854
Biotechnology
0.1%
AbbVie,
Inc.
.......................................
United
States
3,932
912,539
a
ACADIA
Pharmaceuticals,
Inc.
.........................
United
States
2,090
51,330
a
ADMA
Biologics,
Inc.
.................................
United
States
554
8,626
a
Alkermes
plc
.......................................
United
States
1,775
53,427
Amgen,
Inc.
.......................................
United
States
494
191,751
a
Amicus
Therapeutics,
Inc.
.............................
United
States
686
9,858
a
Arrowhead
Pharmaceuticals,
Inc.
.......................
United
States
1,105
69,913
a,c
Avidity
Biosciences,
Inc.
..............................
United
States
127
9,144
a
BioCryst
Pharmaceuticals,
Inc.
.........................
United
States
6,772
59,255
a
Capricor
Therapeutics,
Inc.
............................
United
States
405
11,312
a
CareDx,
Inc.
.......................................
United
States
423
7,935
a
Corvus
Pharmaceuticals,
Inc.
..........................
United
States
381
6,957
a
Enanta
Pharmaceuticals,
Inc.
..........................
United
States
772
11,040
a
Exelixis,
Inc.
.......................................
United
States
3,958
174,389
a
ImmunityBio,
Inc.
...................................
United
States
6,574
64,294
a
Inhibrx
Biosciences,
Inc.
..............................
United
States
574
42,551
a
Ironwood
Pharmaceuticals,
Inc.,
A
.......................
United
States
6,758
23,112
a
Kodiak
Sciences,
Inc.
................................
United
States
376
10,077
a
Kura
Oncology,
Inc.
..................................
United
States
4,474
39,058
a
Mineralys
Therapeutics,
Inc.
...........................
United
States
1,065
31,162
a
Monte
Rosa
Therapeutics,
Inc.
.........................
United
States
2,232
39,618
a
Olema
Pharmaceuticals,
Inc.
...........................
United
States
566
13,697
a
Praxis
Precision
Medicines,
Inc.
........................
United
States
29
9,766
a
Precigen,
Inc.
......................................
United
States
9,176
34,777
a
Protagonist
Therapeutics,
Inc.
..........................
United
States
671
61,786
a
PTC
Therapeutics,
Inc.
...............................
United
States
108
7,365
a
Puma
Biotechnology,
Inc.
.............................
United
States
1,907
10,870
Regeneron
Pharmaceuticals,
Inc.
.......................
United
States
233
182,129
a
Rhythm
Pharmaceuticals,
Inc.
..........................
United
States
552
51,187
a
Rigel
Pharmaceuticals,
Inc.
............................
United
States
291
10,109
a
Scholar
Rock
Holding
Corp.
...........................
United
States
188
8,323
a
Stoke
Therapeutics,
Inc.
..............................
United
States
1,429
52,030
a
Tango
Therapeutics,
Inc.
..............................
United
States
1,243
13,847
a
Travere
Therapeutics,
Inc.
.............................
United
States
1,494
44,506
a
Zymeworks,
Inc.
....................................
United
States
617
14,370
2,342,110
Broadline
Retail
0.5%
a
Amazon.com,
Inc.
...................................
United
States
19,533
4,101,930
eBay,
Inc.
.........................................
United
States
2,091
189,988
Prosus
NV
........................................
China
501
25,752
Wesfarmers
Ltd.
....................................
Australia
1,441
81,637
4,399,307
Putnam
Asset
Allocation
Funds
Consolidated
Schedule
of
Investments
(unaudited)
Putnam
Multi-Asset
Income
Fund
Semiannual
Report
The
accompanying
notes
are
an
integral
part
of
these
consolidated
financial
statements.
a
a
Country
Shares
a
Value
a
a
a
a
a
a
Common
Stocks
(continued)
Building
Products
0.1%
Apogee
Enterprises,
Inc.
..............................
United
States
256
$
10,194
Cie
de
Saint-Gobain
SA
..............................
France
2,514
254,773
a
Gibraltar
Industries,
Inc.
..............................
United
States
179
8,141
a
Janus
International
Group,
Inc.
.........................
United
States
1,360
9,466
a
Resideo
Technologies,
Inc.
............................
United
States
394
15,248
Trane
Technologies
plc
...............................
United
States
504
233,009
UFP
Industries,
Inc.
..................................
United
States
606
62,363
593,194
Capital
Markets
0.7%
3i
Group
plc
.......................................
United
Kingdom
2,791
124,690
Ameriprise
Financial,
Inc.
.............................
United
States
395
185,697
b
Amundi
SA,
144A,
Reg
S
.............................
France
2,226
212,345
Bank
of
New
York
Mellon
Corp.
(The)
....................
United
States
1,538
183,176
Charles
Schwab
Corp.
(The)
...........................
United
States
1,629
155,081
Daiwa
Securities
Group,
Inc.
...........................
Japan
12,900
135,570
Goldman
Sachs
Group,
Inc.
(The)
.......................
United
States
676
581,069
Invesco
Ltd.
.......................................
United
States
6,340
166,488
Janus
Henderson
Group
plc
...........................
United
States
3,766
196,209
Japan
Exchange
Group,
Inc.
...........................
Japan
8,900
121,120
Morgan
Stanley
.....................................
United
States
11,149
1,856,420
Nomura
Holdings,
Inc.
................................
Japan
12,400
115,122
Northern
Trust
Corp.
.................................
United
States
1,299
185,874
State
Street
Corp.
...................................
United
States
21,855
2,810,990
a
StoneX
Group,
Inc.
..................................
United
States
531
67,703
UBS
Group
AG
.....................................
Switzerland
4,989
207,292
Virtus
Investment
Partners,
Inc.
.........................
United
States
138
19,094
7,323,940
Chemicals
0.3%
Avient
Corp.
.......................................
United
States
381
15,648
Balchem
Corp.
.....................................
United
States
242
43,906
BASF
SE
.........................................
Germany
4,681
268,128
Cabot
Corp.
.......................................
United
States
147
11,193
CF
Industries
Holdings,
Inc.
...........................
United
States
2,065
205,550
Corteva,
Inc.
.......................................
United
States
2,330
186,680
Eastman
Chemical
Co.
...............................
United
States
3,018
227,889
Evonik
Industries
AG
.................................
Germany
10,352
179,992
a
Ingevity
Corp.
......................................
United
States
188
13,542
Innospec,
Inc.
......................................
United
States
256
19,604
a
Intrepid
Potash,
Inc.
.................................
United
States
353
13,050
Linde
plc
..........................................
United
States
415
210,853
LyondellBasell
Industries
NV,
A
.........................
United
States
12,587
724,004
Mativ
Holdings,
Inc.
..................................
United
States
789
8,553
Minerals
Technologies,
Inc.
............................
United
States
583
41,171
NewMarket
Corp.
...................................
United
States
265
165,893
a
Perimeter
Solutions,
Inc.
..............................
United
States
2,031
47,688
a
Rayonier
Advanced
Materials,
Inc.
.......................
United
States
1,438
13,618
Sherwin-Williams
Co.
(The)
............................
United
States
504
182,745
2,579,707
Commercial
Services
&
Supplies
0.0%
†
Brink's
Co.
(The)
....................................
United
States
514
60,020
a
Cimpress
plc
.......................................
Ireland
116
8,474
a
CoreCivic,
Inc.
.....................................
United
States
517
9,141
HNI
Corp.
.........................................
United
States
207
9,307
Putnam
Asset
Allocation
Funds
Consolidated
Schedule
of
Investments
(unaudited)
Putnam
Multi-Asset
Income
Fund
The
accompanying
notes
are
an
integral
part
of
these
consolidated
financial
statements.
Semiannual
Report
a
a
Country
Shares
a
Value
a
a
a
a
a
a
Common
Stocks
(continued)
Commercial
Services
&
Supplies
(continued)
a
OPENLANE,
Inc.
...................................
United
States
357
$
10,178
97,120
Communications
Equipment
0.7%
a
Arista
Networks,
Inc.
.................................
United
States
8,445
1,127,408
a
BK
Technologies
Corp.
...............................
United
States
127
11,060
a
Calix,
Inc.
.........................................
United
States
568
29,405
a
Ciena
Corp.
.......................................
United
States
758
264,315
Cisco
Systems,
Inc.
.................................
United
States
42,725
3,394,929
a
Extreme
Networks,
Inc.
...............................
United
States
2,976
41,604
a
NETGEAR,
Inc.
.....................................
United
States
1,438
29,652
a
NetScout
Systems,
Inc.
...............................
United
States
385
11,246
a
Viavi
Solutions,
Inc.
..................................
United
States
641
19,044
a
Vistance
Networks,
Inc.
...............................
United
States
517
9,084
4,937,747
Construction
&
Engineering
0.1%
Argan,
Inc.
........................................
United
States
174
78,517
a
Dycom
Industries,
Inc.
................................
United
States
33
13,861
Obayashi
Corp.
.....................................
Japan
4,200
118,570
Primoris
Services
Corp.
...............................
United
States
488
73,551
a
Sterling
Infrastructure,
Inc.
............................
United
States
224
95,901
Tutor
Perini
Corp.
...................................
United
States
821
61,879
Vinci
SA
..........................................
France
2,839
471,235
913,514
Construction
Materials
0.1%
Holcim
AG
........................................
United
States
4,294
394,753
Consumer
Finance
0.0%
†
Ally
Financial,
Inc.
...................................
United
States
4,146
163,518
Bread
Financial
Holdings,
Inc.
..........................
United
States
763
54,066
a
Enova
International,
Inc.
..............................
United
States
352
48,946
a
LendingClub
Corp.
..................................
United
States
2,553
38,065
OneMain
Holdings,
Inc.
...............................
United
States
2,669
146,848
PROG
Holdings,
Inc.
.................................
United
States
906
31,900
483,343
Consumer
Staples
Distribution
&
Retail
0.1%
Andersons,
Inc.
(The)
................................
United
States
174
11,360
Coles
Group
Ltd.
....................................
Australia
6,845
100,385
Costco
Wholesale
Corp.
..............................
United
States
177
178,910
Dollar
General
Corp.
.................................
United
States
1,180
184,363
Koninklijke
Ahold
Delhaize
NV
..........................
Netherlands
4,839
238,831
Target
Corp.
.......................................
United
States
1,872
213,015
Tesco
plc
.........................................
United
Kingdom
13,687
88,603
a
United
Natural
Foods,
Inc.
.............................
United
States
339
12,953
Walmart,
Inc.
......................................
United
States
1,361
174,140
1,202,560
Containers
&
Packaging
0.0%
†
Greif,
Inc.,
A
.......................................
United
States
141
10,246
a
O-I
Glass,
Inc.
......................................
United
States
730
9,782
20,028
Distributors
0.0%
†
a
GigaCloud
Technology,
Inc.,
A
..........................
United
States
310
13,745
Putnam
Asset
Allocation
Funds
Consolidated
Schedule
of
Investments
(unaudited)
Putnam
Multi-Asset
Income
Fund
Semiannual
Report
The
accompanying
notes
are
an
integral
part
of
these
consolidated
financial
statements.
a
a
Country
Shares
a
Value
a
a
a
a
a
a
Common
Stocks
(continued)
Distributors
(continued)
Gold.com,
Inc.
.....................................
United
States
285
$
16,379
30,124
Diversified
Consumer
Services
0.2%
ADT,
Inc.
..........................................
United
States
237,685
1,906,234
a
Coursera,
Inc.
......................................
United
States
7,461
47,825
a
Frontdoor,
Inc.
.....................................
United
States
167
11,451
a
Laureate
Education,
Inc.
..............................
United
States
1,733
56,045
Perdoceo
Education
Corp.
............................
United
States
299
9,972
a
Stride,
Inc.
........................................
United
States
132
11,138
a
Udemy,
Inc.
........................................
United
States
1,827
9,190
2,051,855
Diversified
REITs
0.0%
†
Alexander
&
Baldwin,
Inc.
.............................
United
States
835
17,360
American
Assets
Trust,
Inc.
............................
United
States
512
9,994
Broadstone
Net
Lease,
Inc.
............................
United
States
544
10,548
Covivio
SA
........................................
France
3,056
223,998
261,900
Diversified
Telecommunication
Services
0.6%
a
Altice
France
SA
....................................
France
905
16,967
AT&T,
Inc.
.........................................
United
States
106,204
2,974,774
a
Bandwidth,
Inc.,
A
...................................
United
States
766
11,352
Comcast
Corp.,
A
...................................
United
States
20,035
620,284
HKT
Trust
&
HKT
Ltd.
................................
Hong
Kong
223,000
351,528
IDT
Corp.,
B
.......................................
United
States
357
18,189
b
Infrastrutture
Wireless
Italiane
SpA,
144A,
Reg
S
...........
Italy
10,347
109,785
a
Lumen
Technologies,
Inc.
.............................
United
States
1,205
8,568
Singapore
Telecommunications
Ltd.
.....................
Singapore
39,100
155,562
Telstra
Group
Ltd.
...................................
Australia
57,774
212,972
Verizon
Communications,
Inc.
..........................
United
States
4,375
219,363
4,699,344
Electric
Utilities
0.5%
Constellation
Energy
Corp.
............................
United
States
588
193,969
Duke
Energy
Corp.
..................................
United
States
1,568
205,173
Edison
International
.................................
United
States
44,484
3,324,734
Enel
SpA
.........................................
Italy
44,450
534,509
Eversource
Energy
..................................
United
States
2,556
194,793
Exelon
Corp.
.......................................
United
States
4,005
198,127
Iberdrola
SA
.......................................
Spain
2,381
56,199
Kansai
Electric
Power
Co.,
Inc.
(The)
....................
Japan
3,200
57,798
NRG
Energy,
Inc.
...................................
United
States
1,170
209,383
a
Oklo,
Inc.,
A
.......................................
United
States
102
6,421
Origin
Energy
Ltd.
...................................
Australia
31,755
274,679
Portland
General
Electric
Co.
..........................
United
States
437
23,581
TXNM
Energy,
Inc.
..................................
United
States
165
9,738
5,289,104
Electrical
Equipment
0.8%
ABB
Ltd.
..........................................
Switzerland
4,697
437,461
Allient,
Inc.
........................................
United
States
405
26,665
a
Bloom
Energy
Corp.,
A
...............................
United
States
985
153,335
EnerSys
..........................................
United
States
388
64,466
Fujikura
Ltd.
.......................................
Japan
3,200
546,408
GE
Vernova,
Inc.
....................................
United
States
1,027
897,187
Putnam
Asset
Allocation
Funds
Consolidated
Schedule
of
Investments
(unaudited)
Putnam
Multi-Asset
Income
Fund
The
accompanying
notes
are
an
integral
part
of
these
consolidated
financial
statements.
Semiannual
Report
a
a
Country
Shares
a
Value
a
a
a
a
a
a
Common
Stocks
(continued)
Electrical
Equipment
(continued)
Mitsubishi
Electric
Corp.
..............................
Japan
1,800
$
68,513
a
NANO
Nuclear
Energy,
Inc.
............................
United
States
563
14,970
a
Nextpower,
Inc.,
A
...................................
United
States
671
70,522
a
Power
Solutions
International,
Inc.
.......................
United
States
360
30,060
Rockwell
Automation,
Inc.
.............................
United
States
434
176,833
Vertiv
Holdings
Co.,
A
................................
United
States
14,686
3,743,315
a
Vicor
Corp.
........................................
United
States
170
34,238
6,263,973
Electronic
Equipment,
Instruments
&
Components
0.0%
†
Advanced
Energy
Industries,
Inc.
.......................
United
States
256
85,906
a
Arlo
Technologies,
Inc.
...............................
United
States
1,721
27,002
a
Daktronics,
Inc.
.....................................
United
States
221
5,697
a
Fabrinet
..........................................
Thailand
19
10,367
a
Insight
Enterprises,
Inc.
...............................
United
States
113
9,442
a
Itron,
Inc.
.........................................
United
States
559
52,518
a
Kimball
Electronics,
Inc.
..............................
United
States
299
7,472
a
nLight,
Inc.
........................................
United
States
559
31,410
a
Ouster,
Inc.
........................................
United
States
1,640
31,078
a
Sanmina
Corp.
.....................................
United
States
109
16,923
a
ScanSource,
Inc.
...................................
United
States
224
8,239
a
TTM
Technologies,
Inc.
...............................
United
States
777
80,994
367,048
Energy
Equipment
&
Services
0.0%
†
Halliburton
Co.
.....................................
United
States
5,790
208,440
Kodiak
Gas
Services,
Inc.
.............................
United
States
247
13,479
Liberty
Energy,
Inc.,
A
................................
United
States
554
15,562
a
National
Energy
Services
Reunited
Corp.
.................
United
States
1,163
29,133
a
Oceaneering
International,
Inc.
.........................
United
States
1,616
57,368
a
Oil
States
International,
Inc.
...........................
United
States
1,918
25,107
Patterson-UTI
Energy,
Inc.
............................
United
States
1,498
12,748
SLB
Ltd.
..........................................
United
States
3,461
177,688
TechnipFMC
plc
....................................
United
Kingdom
3,345
221,807
a
Transocean
Ltd.
....................................
United
States
12,826
83,112
Weatherford
International
plc
...........................
United
States
1,979
208,705
1,053,149
Entertainment
0.0%
†
Cinemark
Holdings,
Inc.
..............................
United
States
597
16,859
a
Eventbrite,
Inc.,
A
...................................
United
States
3,341
14,767
a
Netflix,
Inc.
........................................
United
States
2,070
199,217
a
Spotify
Technology
SA
................................
United
States
200
102,988
Walt
Disney
Co.
(The)
................................
United
States
1,547
164,044
497,875
Financial
Services
0.3%
Banca
Mediolanum
SpA
..............................
Italy
1,233
26,446
Banco
Latinoamericano
de
Comercio
Exterior
SA,
E
.........
Panama
343
17,160
Corebridge
Financial,
Inc.
.............................
United
States
6,193
160,027
Equitable
Holdings,
Inc.
...............................
United
States
3,607
145,074
Essent
Group
Ltd.
...................................
United
States
138
8,396
Jackson
Financial,
Inc.,
A
.............................
United
States
634
69,410
M&G
plc
..........................................
United
Kingdom
73,552
314,063
Mastercard,
Inc.,
A
..................................
United
States
325
168,093
a
NMI
Holdings,
Inc.,
A
.................................
United
States
772
30,347
Pagseguro
Digital
Ltd.,
A
..............................
Brazil
4,958
52,604
a
Payoneer
Global,
Inc.
................................
United
States
1,546
6,679
Putnam
Asset
Allocation
Funds
Consolidated
Schedule
of
Investments
(unaudited)
Putnam
Multi-Asset
Income
Fund
Semiannual
Report
The
accompanying
notes
are
an
integral
part
of
these
consolidated
financial
statements.
a
a
Country
Shares
a
Value
a
a
a
a
a
a
Common
Stocks
(continued)
Financial
Services
(continued)
PennyMac
Financial
Services,
Inc.
......................
United
States
219
$
20,133
a
Sony
Financial
Group,
Inc.
............................
Japan
1,000
1,023
a
StoneCo
Ltd.,
A
.....................................
Brazil
2,584
43,411
Western
Union
Co.
(The)
..............................
United
States
187,779
1,808,312
2,871,178
Food
Products
0.3%
Archer-Daniels-Midland
Co.
...........................
United
States
2,997
206,913
Calavo
Growers,
Inc.
.................................
United
States
362
9,716
Cal-Maine
Foods,
Inc.
................................
United
States
538
46,865
Conagra
Brands,
Inc.
................................
United
States
10,021
192,904
Dole
plc
..........................................
United
States
1,873
30,043
General
Mills,
Inc.
...................................
United
States
3,978
179,925
Ingredion,
Inc.
......................................
United
States
775
91,031
Kraft
Heinz
Co.
(The)
................................
United
States
7,885
194,050
Nestle
SA
.........................................
United
States
4,358
476,157
a
Seneca
Foods
Corp.,
A
...............................
United
States
113
15,705
a
Simply
Good
Foods
Co.
(The)
..........................
United
States
259
4,419
Smithfield
Foods,
Inc.
................................
United
States
24,970
621,254
Tyson
Foods,
Inc.,
A
.................................
United
States
2,928
190,291
b
WH
Group
Ltd.,
144A,
Reg
S
..........................
Hong
Kong
307,000
386,134
2,645,407
Gas
Utilities
0.0%
†
National
Fuel
Gas
Co.
................................
United
States
2,057
187,249
Naturgy
Energy
Group
SA
.............................
Spain
5,262
163,771
New
Jersey
Resources
Corp.
..........................
United
States
976
52,938
Northwest
Natural
Holding
Co.
.........................
United
States
188
9,972
Spire,
Inc.
.........................................
United
States
118
10,810
424,740
Ground
Transportation
0.1%
CSX
Corp.
........................................
United
States
4,568
195,008
a
Lyft,
Inc.,
A
........................................
United
States
9,922
137,320
Norfolk
Southern
Corp.
...............................
United
States
585
184,123
Union
Pacific
Corp.
..................................
United
States
885
234,507
750,958
Health
Care
Equipment
&
Supplies
0.2%
Abbott
Laboratories
..................................
United
States
1,629
189,534
a
AtriCure,
Inc.
.......................................
United
States
277
8,659
a
Avanos
Medical,
Inc.
.................................
United
States
709
9,997
a
Axogen,
Inc.
.......................................
United
States
958
30,397
a
Glaukos
Corp.
......................................
United
States
316
38,046
a
Haemonetics
Corp.
..................................
United
States
136
8,612
Hoya
Corp.
........................................
Japan
2,300
415,444
a
Intuitive
Surgical,
Inc.
................................
United
States
333
167,669
a
Lantheus
Holdings,
Inc.
...............................
United
States
866
64,872
a
LivaNova
plc
.......................................
United
States
585
41,301
Medtronic
plc
......................................
United
States
9,815
958,533
a
Novocure
Ltd.
......................................
United
States
3,698
50,552
Sonova
Holding
AG
..................................
Switzerland
307
80,037
2,063,653
Health
Care
Providers
&
Services
0.0%
†
a
AMN
Healthcare
Services,
Inc.
.........................
United
States
544
10,597
a
Castle
Biosciences,
Inc.
..............................
United
States
1,218
36,016
Putnam
Asset
Allocation
Funds
Consolidated
Schedule
of
Investments
(unaudited)
Putnam
Multi-Asset
Income
Fund
The
accompanying
notes
are
an
integral
part
of
these
consolidated
financial
statements.
Semiannual
Report
a
a
Country
Shares
a
Value
a
a
a
a
a
a
Common
Stocks
(continued)
Health
Care
Providers
&
Services
(continued)
Cigna
Group
(The)
..................................
United
States
325
$
94,192
a
Cross
Country
Healthcare,
Inc.
.........................
United
States
563
4,898
CVS
Health
Corp.
...................................
United
States
2,180
174,182
a
GeneDx
Holdings
Corp.,
A
.............................
United
States
90
7,174
a
Guardant
Health,
Inc.
................................
United
States
789
74,087
a
HealthEquity,
Inc.
...................................
United
States
102
7,802
a
Hims
&
Hers
Health,
Inc.
..............................
United
States
330
4,792
a
Omada
Health,
Inc.
..................................
United
States
608
7,466
Select
Medical
Holdings
Corp.
..........................
United
States
577
8,638
UnitedHealth
Group,
Inc.
..............................
United
States
538
157,779
587,623
Health
Care
REITs
0.0%
†
American
Healthcare
REIT,
Inc.
.........................
United
States
193
10,082
CareTrust
REIT,
Inc.
.................................
United
States
1,810
73,522
LTC
Properties,
Inc.
.................................
United
States
250
9,920
National
Health
Investors,
Inc.
..........................
United
States
122
10,257
Omega
Healthcare
Investors,
Inc.
.......................
United
States
3,962
191,246
Sabra
Health
Care
REIT,
Inc.
..........................
United
States
488
10,028
305,055
Health
Care
Technology
0.0%
†
HealthStream,
Inc.
..................................
United
States
425
9,023
a
Phreesia,
Inc.
......................................
United
States
2,659
32,785
a
Teladoc
Health,
Inc.
.................................
United
States
8,138
42,806
a
Waystar
Holding
Corp.
...............................
United
States
313
8,028
92,642
Hotel
&
Resort
REITs
0.0%
†
Apple
Hospitality
REIT,
Inc.
............................
United
States
721
8,839
DiamondRock
Hospitality
Co.
..........................
United
States
1,079
10,833
Ryman
Hospitality
Properties,
Inc.
.......................
United
States
441
43,549
Xenia
Hotels
&
Resorts,
Inc.
...........................
United
States
634
9,688
72,909
Hotels,
Restaurants
&
Leisure
0.0%
†
a
Airbnb,
Inc.,
A
......................................
United
States
1,508
203,746
Aristocrat
Leisure
Ltd.
................................
Australia
1,219
41,674
Booking
Holdings,
Inc.
...............................
United
States
31
131,420
Brightstar
Lottery
plc
.................................
United
States
2,584
35,039
a
Brinker
International,
Inc.
.............................
United
States
432
64,022
Carnival
Corp.
......................................
United
States
6,197
195,515
a
DoorDash,
Inc.,
A
...................................
United
States
378
66,706
FDJ
United
........................................
France
7,194
218,227
Galaxy
Entertainment
Group
Ltd.
.......................
Macau
14,000
74,496
Golden
Entertainment,
Inc.
............................
United
States
353
10,202
Las
Vegas
Sands
Corp.
...............................
United
States
3,223
182,809
a
Life
Time
Group
Holdings,
Inc.
.........................
United
States
316
8,532
Monarch
Casino
&
Resort,
Inc.
.........................
United
States
109
10,475
Red
Rock
Resorts,
Inc.,
A
.............................
United
States
158
9,567
1,252,430
Household
Durables
0.1%
Garmin
Ltd.
........................................
United
States
895
226,283
a
Hovnanian
Enterprises,
Inc.,
A
..........................
United
States
94
11,808
KB
Home
.........................................
United
States
170
10,809
a
M/I
Homes,
Inc.
.....................................
United
States
313
44,496
Putnam
Asset
Allocation
Funds
Consolidated
Schedule
of
Investments
(unaudited)
Putnam
Multi-Asset
Income
Fund
Semiannual
Report
The
accompanying
notes
are
an
integral
part
of
these
consolidated
financial
statements.
a
a
Country
Shares
a
Value
a
a
a
a
a
a
Common
Stocks
(continued)
Household
Durables
(continued)
a
Sonos,
Inc.
........................................
United
States
3,470
$
53,438
a
Taylor
Morrison
Home
Corp.,
A
.........................
United
States
866
57,061
a
Tri
Pointe
Homes,
Inc.
................................
United
States
1,468
67,968
471,863
Household
Products
0.1%
Colgate-Palmolive
Co.
...............................
United
States
2,236
221,677
Kimberly-Clark
Corp.
.................................
United
States
1,719
191,565
Procter
&
Gamble
Co.
(The)
...........................
United
States
1,173
196,126
Reckitt
Benckiser
Group
plc
...........................
United
Kingdom
2,830
249,320
858,688
Independent
Power
and
Renewable
Electricity
Producers
0.1%
AES
Corp.
(The)
....................................
United
States
12,577
217,331
a,c
Glow
Energy
PCL
...................................
Thailand
35,800
11
Vistra
Corp.
........................................
United
States
1,100
191,279
408,621
Industrial
Conglomerates
0.0%
†
3M
Co.
...........................................
United
States
1,110
183,505
Hitachi
Ltd.
........................................
Japan
5,100
166,960
Honeywell
International,
Inc.
...........................
United
States
779
189,757
Siemens
AG
.......................................
Germany
366
105,827
646,049
Industrial
REITs
0.0%
†
Prologis,
Inc.
.......................................
United
States
1,448
206,441
Insurance
0.8%
AIA
Group
Ltd.
.....................................
Hong
Kong
1,000
11,031
Allianz
SE
.........................................
Germany
1,256
564,041
Allstate
Corp.
(The)
..................................
United
States
872
187,061
American
International
Group,
Inc.
......................
United
States
2,405
193,578
AXA
SA
...........................................
France
6,883
336,593
Axis
Capital
Holdings
Ltd.
.............................
United
States
1,809
191,247
CNO
Financial
Group,
Inc.
............................
United
States
1,163
48,625
Dai-ichi
Life
Holdings,
Inc.
.............................
Japan
22,000
225,750
Everest
Group
Ltd.
..................................
United
States
564
189,216
Fidelis
Insurance
Holdings
Ltd.
.........................
United
Kingdom
574
10,941
a
Genworth
Financial,
Inc.,
A
............................
United
States
6,070
51,231
a
Hamilton
Insurance
Group
Ltd.,
B
.......................
United
States
1,770
55,914
a
Heritage
Insurance
Holdings,
Inc.
.......................
United
States
1,463
40,774
Horace
Mann
Educators
Corp.
.........................
United
States
264
11,487
Legal
&
General
Group
plc
............................
United
Kingdom
109,282
399,180
Lincoln
National
Corp.
................................
United
States
4,335
148,691
MetLife,
Inc.
.......................................
United
States
22,275
1,605,359
Muenchener
Rueckversicherungs-Gesellschaft
AG
in
Muenchen
Germany
101
65,915
NN
Group
NV
......................................
Netherlands
2,074
170,104
Phoenix
Group
Holdings
plc
...........................
United
Kingdom
29,938
309,222
Prudential
Financial,
Inc.
..............................
United
States
13,115
1,290,254
a
SiriusPoint
Ltd.
.....................................
United
States
1,140
24,100
Suncorp
Group
Ltd.
..................................
Australia
4,572
47,587
Swiss
Re
AG
.......................................
United
States
463
81,506
Tokio
Marine
Holdings,
Inc.
............................
Japan
3,800
157,820
Travelers
Cos.,
Inc.
(The)
.............................
United
States
628
193,826
Universal
Insurance
Holdings,
Inc.
.......................
United
States
494
17,374
Putnam
Asset
Allocation
Funds
Consolidated
Schedule
of
Investments
(unaudited)
Putnam
Multi-Asset
Income
Fund
The
accompanying
notes
are
an
integral
part
of
these
consolidated
financial
statements.
Semiannual
Report
a
a
Country
Shares
a
Value
a
a
a
a
a
a
Common
Stocks
(continued)
Insurance
(continued)
Unum
Group
.......................................
United
States
2,180
$
156,371
6,784,798
Interactive
Media
&
Services
2.2%
Alphabet,
Inc.,
A
....................................
United
States
37,053
11,551,643
b
Autotrader
Group
plc,
144A,
Reg
S
......................
United
Kingdom
3,840
25,436
a
Cargurus,
Inc.,
A
....................................
United
States
1,245
38,222
a
EverQuote,
Inc.,
A
...................................
United
States
1,396
22,057
a
fuboTV,
Inc.
.......................................
United
States
9,751
11,409
a
Grindr,
Inc.
........................................
Singapore
835
9,503
LY
Corp.
..........................................
Japan
41,300
102,083
Meta
Platforms,
Inc.,
A
...............................
United
States
9,926
6,433,835
18,194,188
IT
Services
0.0%
†
Accenture
plc,
A
....................................
United
States
611
127,528
Capgemini
SE
......................................
France
129
16,303
Fujitsu
Ltd.
........................................
Japan
2,400
53,503
197,334
Leisure
Products
0.0%
†
Hasbro,
Inc.
.......................................
United
States
1,984
197,587
Polaris,
Inc.
........................................
United
States
817
49,625
247,212
Life
Sciences
Tools
&
Services
0.0%
†
a
10X
Genomics,
Inc.,
A
................................
United
States
2,394
55,182
a
CryoPort,
Inc.
......................................
United
States
497
4,185
Mesa
Laboratories,
Inc.
...............................
United
States
352
33,993
93,360
Machinery
0.7%
Alamo
Group,
Inc.
...................................
United
States
55
11,744
Albany
International
Corp.,
A
...........................
United
States
198
11,415
Atmus
Filtration
Technologies,
Inc.
......................
United
States
1,077
69,499
a
Blue
Bird
Corp.
.....................................
United
States
973
56,697
Caterpillar,
Inc.
.....................................
United
States
342
254,048
Cummins,
Inc.
......................................
United
States
4,911
2,867,386
ESCO
Technologies,
Inc.
..............................
United
States
72
19,965
FANUC
Corp.
......................................
Japan
9,600
434,689
Federal
Signal
Corp.
.................................
United
States
81
9,431
Franklin
Electric
Co.,
Inc.
.............................
United
States
108
10,759
GEA
Group
AG
.....................................
Germany
860
66,679
Hyster-Yale,
Inc.
....................................
United
States
277
10,202
Kennametal,
Inc.
....................................
United
States
316
12,728
Komatsu
Ltd.
......................................
Japan
11,500
552,004
Lincoln
Electric
Holdings,
Inc.
..........................
United
States
680
195,194
a
Microvast
Holdings,
Inc.
..............................
United
States
8,671
19,423
Mueller
Water
Products,
Inc.,
A
.........................
United
States
408
12,211
a
Proto
Labs,
Inc.
.....................................
United
States
287
17,817
Sandvik
AB
........................................
Sweden
1,963
86,512
a
SPX
Technologies,
Inc.
...............................
United
States
50
11,347
Tennant
Co.
.......................................
United
States
118
7,202
Terex
Corp.
........................................
United
States
844
58,059
Toro
Co.
(The)
.....................................
United
States
1,897
187,537
Watts
Water
Technologies,
Inc.,
A
.......................
United
States
247
81,199
Putnam
Asset
Allocation
Funds
Consolidated
Schedule
of
Investments
(unaudited)
Putnam
Multi-Asset
Income
Fund
Semiannual
Report
The
accompanying
notes
are
an
integral
part
of
these
consolidated
financial
statements.
a
a
Country
Shares
a
Value
a
a
a
a
a
a
Common
Stocks
(continued)
Machinery
(continued)
Worthington
Enterprises,
Inc.
..........................
United
States
189
$
10,586
5,074,333
Marine
Transportation
0.2%
AP
Moller
-
Maersk
A/S,
B
.............................
United
States
145
360,014
Matson,
Inc.
.......................................
United
States
414
68,778
Nippon
Yusen
KK
...................................
Japan
3,200
109,876
SITC
International
Holdings
Co.
Ltd.
.....................
China
83,000
354,054
892,722
Media
0.0%
†
a
Ibotta,
Inc.,
A
.......................................
United
States
419
10,462
New
York
Times
Co.
(The),
A
...........................
United
States
2,487
198,438
Publicis
Groupe
SA
..................................
France
694
61,797
a
PubMatic,
Inc.,
A
....................................
United
States
1,227
9,939
280,636
Metals
&
Mining
0.3%
a
Alpha
Metallurgical
Resources,
Inc.
......................
United
States
55
8,946
BHP
Group
Ltd.,
(AUD
Traded)
.........................
Australia
8,031
325,860
BHP
Group
Ltd.,
(GBP
Traded)
.........................
Australia
950
38,841
a
Coeur
Mining,
Inc.
...................................
United
States
1,581
42,924
Commercial
Metals
Co.
...............................
United
States
167
12,241
a
Constellium
SE,
A
...................................
United
States
2,498
62,175
Fortescue
Ltd.
......................................
Australia
24,329
365,451
Freeport-McMoRan,
Inc.
..............................
United
States
5,089
346,459
Hecla
Mining
Co.
...................................
United
States
3,416
85,093
Rio
Tinto
Ltd.
......................................
Australia
399
47,433
Rio
Tinto
plc
.......................................
Australia
6,364
630,479
Southern
Copper
Corp.
...............................
Mexico
1,009
220,265
SunCoke
Energy,
Inc.
................................
United
States
1,254
7,148
2,193,315
Mortgage
Real
Estate
Investment
Trusts
(REITs)
0.6%
AGNC
Investment
Corp.
..............................
United
States
85,413
957,480
Annaly
Capital
Management,
Inc.
.......................
United
States
55,934
1,299,906
Chimera
Investment
Corp.
.............................
United
States
769
10,466
Ladder
Capital
Corp.,
A
...............................
United
States
866
8,980
MFA
Financial,
Inc.
..................................
United
States
1,021
10,322
Rithm
Capital
Corp.
..................................
United
States
195,699
1,966,775
Starwood
Property
Trust,
Inc.
..........................
United
States
9,888
176,105
4,430,034
Multi-Utilities
0.1%
Avista
Corp.
.......................................
United
States
950
38,589
Black
Hills
Corp.
....................................
United
States
671
49,426
E.ON
SE
..........................................
Germany
10,245
238,236
Engie
SA
.........................................
France
15,876
542,373
Northwestern
Energy
Group,
Inc.
.......................
United
States
144
10,074
Public
Service
Enterprise
Group,
Inc.
....................
United
States
2,335
200,973
1,079,671
Office
REITs
0.0%
†
COPT
Defense
Properties
.............................
United
States
310
9,852
Empire
State
Realty
Trust,
Inc.,
A
.......................
United
States
1,471
8,649
18,501
Putnam
Asset
Allocation
Funds
Consolidated
Schedule
of
Investments
(unaudited)
Putnam
Multi-Asset
Income
Fund
The
accompanying
notes
are
an
integral
part
of
these
consolidated
financial
statements.
Semiannual
Report
a
a
Country
Shares
a
Value
a
a
a
a
a
a
Common
Stocks
(continued)
Oil,
Gas
&
Consumable
Fuels
0.9%
Aker
BP
ASA
.......................................
Norway
9,296
$
282,437
Antero
Midstream
Corp.
..............................
United
States
9,935
223,339
BP
plc
............................................
United
States
4,864
31,526
California
Resources
Corp.
............................
United
States
193
11,356
Cheniere
Energy,
Inc.
................................
United
States
856
201,785
Chevron
Corp.
.....................................
United
States
5,461
1,019,896
ConocoPhillips
.....................................
United
States
1,805
204,795
DHT
Holdings,
Inc.
..................................
United
States
723
14,091
Dorian
LPG
Ltd.
....................................
United
States
360
13,316
ENEOS
Holdings,
Inc.
................................
Japan
3,200
30,530
Eni
SpA
..........................................
Italy
3,659
85,455
Equinor
ASA
.......................................
Norway
7,200
215,742
Exxon
Mobil
Corp.
...................................
United
States
16,653
2,539,583
a
Gulfport
Energy
Corp.
................................
United
States
47
9,807
HF
Sinclair
Corp.
...................................
United
States
4,008
200,440
Kinder
Morgan,
Inc.
..................................
United
States
6,150
204,610
Marathon
Petroleum
Corp.
............................
United
States
1,121
222,193
Murphy
Oil
Corp.
....................................
United
States
821
27,216
OMV
AG
..........................................
Austria
2,396
155,213
Peabody
Energy
Corp.
...............................
United
States
1,698
53,555
Permian
Resources
Corp.,
A
...........................
United
States
12,512
228,844
Phillips
66
.........................................
United
States
646
99,697
Repsol
SA
.........................................
Spain
10,020
226,759
Scorpio
Tankers,
Inc.
.................................
Monaco
875
69,195
Shell
plc
..........................................
United
States
2,967
124,267
SM
Energy
Co.
.....................................
United
States
8,931
206,574
Teekay
Corp.
Ltd.
...................................
United
States
2,812
36,415
Teekay
Tankers
Ltd.,
A
...............................
Canada
766
59,955
TotalEnergies
SE
...................................
France
3,028
242,548
Valero
Energy
Corp.
.................................
United
States
1,070
218,965
Williams
Cos.,
Inc.
(The)
..............................
United
States
2,769
206,900
Woodside
Energy
Group
Ltd.
..........................
Australia
22,314
455,585
World
Kinect
Corp.
..................................
United
States
380
9,481
7,932,070
Paper
&
Forest
Products
0.0%
†
Sylvamo
Corp.
.....................................
United
States
566
26,206
UPM-Kymmene
OYJ
.................................
Finland
5,414
172,410
198,616
Passenger
Airlines
0.0%
†
Delta
Air
Lines,
Inc.
..................................
United
States
2,642
173,579
International
Consolidated
Airlines
Group
SA
...............
United
Kingdom
2,977
16,836
a
Joby
Aviation,
Inc.
...................................
United
States
3,191
32,101
Singapore
Airlines
Ltd.
...............................
Singapore
10,500
59,548
a
SkyWest,
Inc.
......................................
United
States
549
57,140
a
Sun
Country
Airlines
Holdings,
Inc.
......................
United
States
662
13,028
352,232
Personal
Care
Products
0.0%
†
Kenvue,
Inc.
.......................................
United
States
9,918
189,632
L'Oreal
SA
........................................
France
125
58,568
Unilever
plc
........................................
United
Kingdom
458
33,655
281,855
Pharmaceuticals
2.2%
a
Arvinas,
Inc.
.......................................
United
States
3,640
48,303
Astellas
Pharma,
Inc.
................................
Japan
22,800
379,427
Putnam
Asset
Allocation
Funds
Consolidated
Schedule
of
Investments
(unaudited)
Putnam
Multi-Asset
Income
Fund
Semiannual
Report
The
accompanying
notes
are
an
integral
part
of
these
consolidated
financial
statements.
a
a
Country
Shares
a
Value
a
a
a
a
a
a
Common
Stocks
(continued)
Pharmaceuticals
(continued)
AstraZeneca
plc
....................................
United
Kingdom
694
$
146,040
a
Atrium
Therapeutics,
Inc.
..............................
United
States
13
187
Bristol-Myers
Squibb
Co.
..............................
United
States
54,854
3,421,244
Daiichi
Sankyo
Co.
Ltd.
...............................
Japan
10,200
200,889
Eli
Lilly
&
Co.
......................................
United
States
4,369
4,596,144
GSK
plc
..........................................
United
States
10,926
324,647
Johnson
&
Johnson
.................................
United
States
2,005
498,102
a
Maze
Therapeutics,
Inc.
..............................
United
States
1,082
49,328
Merck
&
Co.,
Inc.
...................................
United
States
31,478
3,897,606
Novartis
AG
.......................................
United
States
5,515
927,302
Novo
Nordisk
A/S,
B
.................................
Denmark
11,723
443,405
Pfizer,
Inc.
.........................................
United
States
63,556
1,757,323
Roche
Holding
AG
..................................
United
States
368
175,132
Sanofi
SA
.........................................
United
States
1,222
119,513
a
Supernus
Pharmaceuticals,
Inc.
........................
United
States
892
48,819
Takeda
Pharmaceutical
Co.
Ltd.
........................
Japan
5,300
198,364
17,231,775
Professional
Services
0.3%
Automatic
Data
Processing,
Inc.
........................
United
States
10,763
2,307,157
a
IBEX
Holdings
Ltd.
..................................
United
States
371
10,722
Korn
Ferry
........................................
United
States
388
24,316
a
Legalzoom.com,
Inc.
.................................
United
States
4,124
28,992
Maximus,
Inc.
......................................
United
States
108
8,166
Robert
Half,
Inc.
....................................
United
States
6,081
148,498
a
Upwork,
Inc.
.......................................
United
States
2,436
32,691
2,560,542
Real
Estate
Management
&
Development
0.0%
†
a
Cushman
&
Wakefield
Ltd.
............................
United
States
3,323
44,561
Kennedy-Wilson
Holdings,
Inc.
.........................
United
States
946
10,292
54,853
Residential
REITs
0.0%
†
Equity
Residential
...................................
United
States
2,850
180,149
Invitation
Homes,
Inc.
................................
United
States
6,484
170,789
Sun
Communities,
Inc.
...............................
United
States
1,348
183,948
534,886
Retail
REITs
0.1%
Alexander's,
Inc.
....................................
United
States
34
7,977
CBL
&
Associates
Properties,
Inc.
.......................
United
States
294
11,107
Kite
Realty
Group
Trust
...............................
United
States
434
11,306
Link
REIT
.........................................
Hong
Kong
6,700
33,124
NNN
REIT,
Inc.
.....................................
United
States
4,275
193,743
Simon
Property
Group,
Inc.
............................
United
States
4,124
840,677
SITE
Centers
Corp.
..................................
United
States
3,514
21,646
Tanger,
Inc.
........................................
United
States
282
10,451
Urban
Edge
Properties
...............................
United
States
483
10,264
1,140,295
Semiconductors
&
Semiconductor
Equipment
3.2%
a
Ambarella,
Inc.
.....................................
United
States
830
50,082
Applied
Materials,
Inc.
................................
United
States
749
278,853
ASML
Holding
NV
...................................
Netherlands
927
1,348,236
Broadcom,
Inc.
.....................................
United
States
6,679
2,134,274
a
CEVA,
Inc.
........................................
United
States
224
4,673
Putnam
Asset
Allocation
Funds
Consolidated
Schedule
of
Investments
(unaudited)
Putnam
Multi-Asset
Income
Fund
The
accompanying
notes
are
an
integral
part
of
these
consolidated
financial
statements.
Semiannual
Report
a
a
Country
Shares
a
Value
a
a
a
a
a
a
Common
Stocks
(continued)
Semiconductors
&
Semiconductor
Equipment
(continued)
a
Credo
Technology
Group
Holding
Ltd.
....................
United
States
810
$
90,939
a
Impinj,
Inc.
........................................
United
States
291
35,694
Infineon
Technologies
AG
.............................
Germany
690
37,187
Lam
Research
Corp.
.................................
United
States
11,382
2,662,136
a
MaxLinear,
Inc.,
A
...................................
United
States
615
10,719
Micron
Technology,
Inc.
...............................
United
States
757
312,164
a
Navitas
Semiconductor
Corp.,
A
........................
United
States
870
7,830
NVIDIA
Corp.
......................................
United
States
79,821
14,143,483
QUALCOMM,
Inc.
...................................
United
States
20,296
2,889,339
a
Rambus,
Inc.
......................................
United
States
727
72,453
Renesas
Electronics
Corp.
............................
Japan
7,500
141,441
a
Rigetti
Computing,
Inc.
...............................
United
States
1,365
23,778
SCREEN
Holdings
Co.
Ltd.
............................
Japan
400
58,311
a
Semtech
Corp.
.....................................
United
States
118
10,646
Skyworks
Solutions,
Inc.
..............................
United
States
3,018
179,812
Tokyo
Electron
Ltd.
..................................
Japan
2,300
647,162
25,139,212
Software
0.9%
a
ACI
Worldwide,
Inc.
..................................
United
States
434
17,221
a
Adobe,
Inc.
........................................
United
States
601
157,708
a
Alarm.com
Holdings,
Inc.
.............................
United
States
188
8,996
a
Appian
Corp.,
A
.....................................
United
States
334
8,908
a
Arteris,
Inc.
........................................
United
States
1,979
33,623
a
Autodesk,
Inc.
......................................
United
States
663
163,012
a
Blend
Labs,
Inc.,
A
..................................
United
States
10,228
17,183
a
Cerence,
Inc.
......................................
United
States
1,105
8,741
a
Commvault
Systems,
Inc.
.............................
United
States
352
29,948
a
Daily
Journal
Corp.
..................................
United
States
13
6,624
a
DocuSign,
Inc.,
A
...................................
United
States
3,193
143,909
a
Domo,
Inc.,
B
......................................
United
States
1,962
7,044
InterDigital,
Inc.
.....................................
United
States
212
77,704
Intuit,
Inc.
.........................................
United
States
299
122,300
a
LiveRamp
Holdings,
Inc.
..............................
United
States
1,252
34,017
Microsoft
Corp.
.....................................
United
States
17,429
6,845,065
OneSpan,
Inc.
......................................
United
States
766
8,457
a
PagerDuty,
Inc.
.....................................
United
States
4,570
32,264
a
Palantir
Technologies,
Inc.,
A
...........................
United
States
997
136,778
a
Q2
Holdings,
Inc.
...................................
United
States
221
10,635
a
Rapid7,
Inc.
.......................................
United
States
2,258
14,045
Salesforce,
Inc.
.....................................
United
States
788
153,495
SAP
SE
..........................................
Germany
1,436
288,481
a
SEMrush
Holdings,
Inc.,
A
.............................
United
States
821
9,704
a
ServiceNow,
Inc.
....................................
United
States
1,352
146,030
a
Weave
Communications,
Inc.
..........................
United
States
1,346
6,784
a
Workiva,
Inc.,
A
.....................................
United
States
108
6,651
8,495,327
Specialized
REITs
0.5%
American
Tower
Corp.
................................
United
States
970
186,104
EPR
Properties
.....................................
United
States
3,646
216,609
Farmland
Partners,
Inc.
...............................
United
States
852
11,110
Millrose
Properties,
Inc.,
A
.............................
United
States
46,984
1,473,418
Outfront
Media,
Inc.
.................................
United
States
2,318
66,782
Public
Storage
.....................................
United
States
659
202,353
Rayonier,
Inc.
......................................
United
States
388
8,338
Putnam
Asset
Allocation
Funds
Consolidated
Schedule
of
Investments
(unaudited)
Putnam
Multi-Asset
Income
Fund
Semiannual
Report
The
accompanying
notes
are
an
integral
part
of
these
consolidated
financial
statements.
a
a
Country
Shares
a
Value
a
a
a
a
a
a
Common
Stocks
(continued)
Specialized
REITs
(continued)
VICI
Properties,
Inc.,
A
...............................
United
States
61,208
$
1,849,094
4,013,808
Specialty
Retail
0.6%
a
Abercrombie
&
Fitch
Co.,
A
............................
United
States
641
62,690
American
Eagle
Outfitters,
Inc.
.........................
United
States
824
20,246
Best
Buy
Co.,
Inc.
...................................
United
States
4,332
268,454
Buckle,
Inc.
(The)
...................................
United
States
179
9,585
Fast
Retailing
Co.
Ltd.
................................
Japan
400
175,385
Gap,
Inc.
(The)
.....................................
United
States
6,944
194,710
H
&
M
Hennes
&
Mauritz
AB,
B
.........................
Sweden
3,213
68,500
Home
Depot,
Inc.
(The)
...............................
United
States
468
178,177
Industria
de
Diseno
Textil
SA
...........................
Spain
2,258
150,783
Ross
Stores,
Inc.
...................................
United
States
1,066
219,212
a
Sally
Beauty
Holdings,
Inc.
............................
United
States
891
14,318
TJX
Cos.,
Inc.
(The)
.................................
United
States
18,225
2,946,254
a
Urban
Outfitters,
Inc.
.................................
United
States
216
14,299
a
Victoria's
Secret
&
Co.
...............................
United
States
988
61,948
4,384,561
Technology
Hardware,
Storage
&
Peripherals
1.7%
Apple,
Inc.
........................................
United
States
50,606
13,369,093
Canon,
Inc.
........................................
Japan
7,500
226,664
a
IonQ,
Inc.
.........................................
United
States
1,468
56,327
NetApp,
Inc.
.......................................
United
States
1,702
168,549
a
Sandisk
Corp.
......................................
United
States
1,239
787,211
14,607,844
Textiles,
Apparel
&
Luxury
Goods
0.2%
Carter's,
Inc.
.......................................
United
States
1,096
36,771
Cie
Financiere
Richemont
SA
..........................
Switzerland
451
91,940
G-III
Apparel
Group
Ltd.
..............................
United
States
432
13,215
Hermes
International
SCA
.............................
France
91
218,715
LVMH
Moet
Hennessy
Louis
Vuitton
SE
..................
France
846
540,612
NIKE,
Inc.,
B
.......................................
United
States
2,779
172,798
Tapestry,
Inc.
......................................
United
States
1,361
211,595
1,285,646
Tobacco
0.2%
British
American
Tobacco
plc
...........................
United
Kingdom
9,031
563,944
Imperial
Brands
plc
..................................
United
Kingdom
3,716
166,436
Philip
Morris
International,
Inc.
.........................
United
States
1,502
280,619
1,010,999
Trading
Companies
&
Distributors
0.2%
a
DNOW,
Inc.
.......................................
United
States
915
10,779
a
Hudson
Technologies,
Inc.
............................
United
States
1,096
7,793
ITOCHU
Corp.
.....................................
Japan
12,400
179,537
Marubeni
Corp.
.....................................
Japan
9,500
363,544
McGrath
RentCorp
..................................
United
States
102
11,317
Mitsubishi
Corp.
....................................
Japan
9,600
323,957
Mitsui
&
Co.
Ltd.
....................................
Japan
15,100
566,095
a
NPK
International,
Inc.
...............................
United
States
688
9,928
Sumitomo
Corp.
....................................
Japan
5,800
246,286
Toyota
Tsusho
Corp.
.................................
Japan
900
40,231
1,759,467
Putnam
Asset
Allocation
Funds
Consolidated
Schedule
of
Investments
(unaudited)
Putnam
Multi-Asset
Income
Fund
The
accompanying
notes
are
an
integral
part
of
these
consolidated
financial
statements.
Semiannual
Report
a
a
Country
Shares
a
Value
a
a
a
a
a
a
Common
Stocks
(continued)
Transportation
Infrastructure
0.1%
b
Aena
SME
SA,
144A,
Reg
S
...........................
Spain
12,939
$
407,814
Water
Utilities
0.0%
†
American
States
Water
Co.
............................
United
States
130
9,689
California
Water
Service
Group
.........................
United
States
202
9,106
H2O
America
......................................
United
States
184
9,897
United
Utilities
Group
plc
..............................
United
Kingdom
3,234
60,619
89,311
Wireless
Telecommunication
Services
0.0%
†
KDDI
Corp.
........................................
Japan
5,800
99,630
SoftBank
Corp.
.....................................
Japan
61,200
83,710
Tele2
AB,
B
........................................
Sweden
8,910
188,038
Vodafone
Group
plc
.................................
United
Kingdom
77,051
118,646
490,024
Total
Common
Stocks
(Cost
$208,282,190)
...................................
225,308,020
Management
Investment
Companies
0.2%
Capital
Markets
0.2%
State
Street
SPDR
S&P
500
ETF
Trust
...................
United
States
2,097
1,438,521
State
Street
SPDR
S&P
MidCap
400
ETF
Trust
.............
United
States
300
195,846
1,634,367
Total
Management
Investment
Companies
(Cost
$1,634,379)
...................
1,634,367
Convertible
Preferred
Stocks
0.0%
†
Aerospace
&
Defense
0.0%
†
Boeing
Co.
(The),
6%
................................
United
States
5,039
367,494
Financial
Services
0.0%
†
Apollo
Global
Management,
Inc.,
6.75%
..................
United
States
707
39,635
Software
0.0%
†
Oracle
Corp.,
D,
6.5%
................................
United
States
1,462
67,237
Total
Convertible
Preferred
Stocks
(Cost
$452,417)
............................
474,366
Preferred
Stocks
0.0%
†
Automobiles
0.0%
†
d
Volkswagen
AG,
6.32%
...............................
Germany
670
79,664
Total
Preferred
Stocks
(Cost
$84,375)
........................................
79,664
Rights
Rights
0.0%
†
Biotechnology
0.0%
†
a,c
Akero
Therapeutics,
Inc.,
CVR,
6/30/31
...................
United
States
344
224
a,c
Blueprint
Medicines
Corp.,
CVR,
12/31/28
.................
United
States
101
46
a,c
Icosavax,
Inc.,
CVR,
2/19/31
...........................
United
Kingdom
230
69
a,c
Pfizer,
Inc.,
CVR,
3/31/32
.............................
United
States
105
514
a,c
Sage
Therapeutics,
Inc.,
CVR,
12/31/30
..................
United
States
1,071
193
1,046
Total
Rights
(Cost
$1,049)
..................................................
1,046
Putnam
Asset
Allocation
Funds
Consolidated
Schedule
of
Investments
(unaudited)
Putnam
Multi-Asset
Income
Fund
Semiannual
Report
The
accompanying
notes
are
an
integral
part
of
these
consolidated
financial
statements.
a
a
Country
Principal
Amount
*
a
Value
a
a
a
a
a
Convertible
Bonds
0.2%
Consumer
Staples
Distribution
&
Retail
0.1%
Chefs'
Warehouse,
Inc.
(The)
,
Senior
Note
,
2.375
%
,
12/15/28
..
United
States
214,000
$
367,417
Food
Products
0.1%
Post
Holdings,
Inc.
,
Senior
Note
,
2.5
%
,
8/15/27
.............
United
States
270,000
305,640
Health
Care
Technology
0.0%
†
Teladoc
Health,
Inc.
,
Senior
Note
,
1.25
%
,
6/01/27
...........
United
States
70,000
66,885
Hotels,
Restaurants
&
Leisure
0.0%
†
b,e
DoorDash,
Inc.
,
Senior
Note
,
144A,
0.84%
,
5/15/30
..........
United
States
300,000
289,650
Pharmaceuticals
0.0%
†
b
Zoetis,
Inc.
,
Senior
Note
,
144A,
0.25
%
,
6/15/29
.............
United
States
290,000
305,225
Software
0.0%
†
Guidewire
Software,
Inc.
,
Senior
Note
,
1.25
%
,
11/01/29
.......
United
States
74,000
73,926
e
Unity
Software,
Inc.
,
Senior
Note
,
4.44%
,
11/15/26
..........
United
States
70,000
67,865
141,791
Technology
Hardware,
Storage
&
Peripherals
0.0%
†
Seagate
HDD
Cayman
,
Senior
Note
,
3.5
%
,
6/01/28
..........
United
States
45,000
222,086
Total
Convertible
Bonds
(Cost
$1,675,125)
...................................
1,698,694
Corporate
Bonds
26.8%
Aerospace
&
Defense
1.4%
ATI,
Inc.
,
Senior
Bond,
5.125%,
10/01/31
.......................
United
States
15,000
15,083
Senior
Note,
5.875%,
12/01/27
.......................
United
States
135,000
135,537
Senior
Note,
7.25%,
8/15/30
.........................
United
States
75,000
78,613
b
Axon
Enterprise,
Inc.
,
Senior
Note,
144A,
6.125%,
3/15/30
...................
United
States
55,000
56,822
Senior
Note,
144A,
6.25%,
3/15/33
....................
United
States
425,000
440,841
b
BAE
Systems
plc
,
Senior
Bond,
144A,
5.3%,
3/26/34
.....................
United
Kingdom
1,400,000
1,474,502
Senior
Bond,
144A,
5.5%,
3/26/54
.....................
United
Kingdom
200,000
206,165
Senior
Note,
144A,
5.125%,
3/26/29
...................
United
Kingdom
400,000
414,454
Boeing
Co.
(The)
,
Senior
Bond,
2.95%,
2/01/30
.........................
United
States
519,000
498,042
Senior
Bond,
6.125%,
2/15/33
........................
United
States
163,000
178,229
Senior
Bond,
3.6%,
5/01/34
..........................
United
States
46,000
42,451
Senior
Bond,
3.25%,
2/01/35
.........................
United
States
45,000
40,136
Senior
Bond,
3.5%,
3/01/39
..........................
United
States
80,000
67,134
Senior
Bond,
6.875%,
3/15/39
........................
United
States
480,000
550,549
Senior
Bond,
5.875%,
2/15/40
........................
United
States
45,000
47,206
Senior
Bond,
3.9%,
5/01/49
..........................
United
States
671,000
513,989
Senior
Bond,
6.858%,
5/01/54
........................
United
States
479,000
549,696
Senior
Bond,
3.95%,
8/01/59
.........................
United
States
768,000
551,109
Senior
Note,
6.259%,
5/01/27
........................
United
States
7,000
7,173
Senior
Note,
6.298%,
5/01/29
........................
United
States
8,000
8,527
b
Bombardier,
Inc.
,
Senior
Bond,
144A,
7.45%,
5/01/34
....................
Canada
565,000
637,927
Senior
Note,
144A,
7.5%,
2/01/29
.....................
Canada
5,000
5,202
Senior
Note,
144A,
8.75%,
11/15/30
...................
Canada
295,000
316,415
Senior
Note,
144A,
7%,
6/01/32
......................
Canada
5,000
5,273
Senior
Note,
144A,
6.75%,
6/15/33
....................
Canada
45,000
47,475
b
Carpenter
Technology
Corp.
,
Senior
Note
,
144A,
5.625
%
,
3/01/34
United
States
465,000
474,732
Putnam
Asset
Allocation
Funds
Consolidated
Schedule
of
Investments
(unaudited)
Putnam
Multi-Asset
Income
Fund
The
accompanying
notes
are
an
integral
part
of
these
consolidated
financial
statements.
Semiannual
Report
a
a
Country
Principal
Amount
*
a
Value
a
a
a
a
a
Corporate
Bonds
(continued)
Aerospace
&
Defense
(continued)
b
Efesto
Bidco
SpA
Efesto
US
LLC
,
XR
,
Senior
Secured
Note
,
144A,
7.5
%
,
2/15/32
...............................
Italy
550,000
$
563,677
Howmet
Aerospace,
Inc.
,
f
Senior
Bond,
4.75%,
4/15/36
.........................
United
States
75,000
75,264
Senior
Bond,
5.95%,
2/01/37
.........................
United
States
1,508,000
1,649,344
Senior
Note,
3%,
1/15/29
...........................
United
States
37,000
36,124
Spirit
AeroSystems,
Inc.
,
Senior
Bond
,
4.6
%
,
6/15/28
........
United
States
115,000
116,046
b
TransDigm,
Inc.
,
Senior
Secured
Note,
144A,
6.875%,
12/15/30
...........
United
States
145,000
150,995
Senior
Secured
Note,
144A,
7.125%,
12/01/31
...........
United
States
15,000
15,740
Senior
Secured
Note,
144A,
6.625%,
3/01/32
............
United
States
300,000
311,173
Senior
Secured
Note,
144A,
6%,
1/15/33
................
United
States
495,000
504,125
Senior
Secured
Note,
144A,
6.25%,
1/31/34
.............
United
States
20,000
20,702
Senior
Sub.
Note,
144A,
6.75%,
1/31/34
................
United
States
435,000
451,807
11,258,279
Automobile
Components
0.3%
b
Adient
Global
Holdings
Ltd.
,
Senior
Note
,
144A,
8.25
%
,
4/15/31
United
States
115,000
120,366
b
American
Axle
&
Manufacturing,
Inc.
,
Senior
Secured
Note
,
144A,
6.375
%
,
10/15/32
..................................
United
States
245,000
249,504
b
Clarios
Global
LP
/
Clarios
US
Finance
Co.
,
Senior
Note
,
144A,
6.75
%
,
9/15/32
...................................
United
States
420,000
436,212
b
Dornoch
Debt
Merger
Sub,
Inc.
,
Senior
Note
,
144A,
6.625
%
,
10/15/29
........................................
United
States
80,000
72,337
b
Forvia
SE
,
Senior
Note
,
144A,
6.75
%
,
9/15/33
..............
France
735,000
757,539
b,g
IHO
Verwaltungs
GmbH
,
Senior
Secured
Note,
144A,
PIK,
7.75%,
11/15/30
.........
Germany
400,000
421,593
Senior
Secured
Note,
144A,
PIK,
8%,
11/15/32
...........
Germany
590,000
629,788
2,687,339
Automobiles
0.3%
b
Hyundai
Capital
America
,
Senior
Bond,
144A,
6.375%,
4/08/30
...................
United
States
867,000
932,605
Senior
Note,
144A,
6.5%,
1/16/29
.....................
United
States
140,000
148,733
Senior
Note,
144A,
5.35%,
3/19/29
....................
United
States
90,000
93,189
Senior
Note,
144A,
4.55%,
9/26/29
....................
United
States
50,000
50,728
Senior
Note,
144A,
5.4%,
1/08/31
.....................
United
States
46,000
48,154
Senior
Note,
144A,
5.4%,
6/23/32
.....................
United
States
35,000
36,761
b
Nissan
Motor
Co.
Ltd.
,
Senior
Bond
,
144A,
8.125
%
,
7/17/35
...
Japan
445,000
486,339
1,796,509
Banks
2.2%
b
Australia
&
New
Zealand
Banking
Group
Ltd.
,
Sub.
Bond
,
144A,
2.57%
to
11/24/30,
FRN
thereafter
,
11/25/35
..............
Australia
445,000
407,057
Banco
Santander
SA
,
Sub.
Bond
,
6.921
%
,
8/08/33
..........
Spain
400,000
445,006
Bank
of
America
Corp.
,
Senior
Bond,
2.496%
to
2/12/30,
FRN
thereafter,
2/13/31
...
United
States
675,000
634,098
Senior
Bond,
5.468%
to
1/22/34,
FRN
thereafter,
1/23/35
...
United
States
173,000
181,361
Senior
Note,
5.162%
to
1/23/30,
FRN
thereafter,
1/24/31
....
United
States
430,000
446,393
Sub.
Bond,
5.425%
to
8/14/34,
FRN
thereafter,
8/15/35
.....
United
States
917,000
939,797
Sub.
Bond,
6.11%,
1/29/37
..........................
United
States
100,000
108,024
Sub.
Bond,
3.846%
to
3/07/32,
FRN
thereafter,
3/08/37
.....
United
States
1,061,000
1,004,562
Bank
of
Montreal
,
Sub.
Bond
,
3.803%
to
12/14/27,
FRN
thereafter
,
12/15/32
................................
Canada
39,000
38,720
Bank
of
Nova
Scotia
(The)
,
Junior
Sub.
Bond
,
7.35%
to
4/26/30,
FRN
thereafter
,
4/27/85
.............................
Canada
400,000
420,785
Putnam
Asset
Allocation
Funds
Consolidated
Schedule
of
Investments
(unaudited)
Putnam
Multi-Asset
Income
Fund
Semiannual
Report
The
accompanying
notes
are
an
integral
part
of
these
consolidated
financial
statements.
a
a
Country
Principal
Amount
*
a
Value
a
a
a
a
a
Corporate
Bonds
(continued)
Banks
(continued)
b
Banque
Federative
du
Credit
Mutuel
SA
,
Senior
Preferred
Note
,
144A,
4.541
%
,
1/15/31
..............................
France
400,000
$
402,370
Barclays
plc
,
Senior
Note
,
5.367%
to
2/24/30,
FRN
thereafter
,
2/25/31
.........................................
United
Kingdom
400,000
415,285
b
CaixaBank
SA
,
Senior
Non-Preferred
Note
,
144A,
5.673%
to
3/14/29,
FRN
thereafter
,
3/15/30
......................
Spain
600,000
625,810
Citigroup,
Inc.
,
h
Junior
Sub.
Bond,
6.625%
to
2/14/31,
FRN
thereafter,
Perpetual
.......................................
United
States
105,000
108,615
h
CC,
Junior
Sub.
Bond,
7.125%
to
8/14/29,
FRN
thereafter,
Perpetual
.......................................
United
States
417,000
432,175
h
GG,
Junior
Sub.
Bond,
6.875%
to
8/14/30,
FRN
thereafter,
Perpetual
.......................................
United
States
532,000
545,808
Senior
Note,
4.503%
to
9/10/30,
FRN
thereafter,
9/11/31
....
United
States
571,000
575,475
Sub.
Bond,
6.174%
to
5/24/33,
FRN
thereafter,
5/25/34
.....
United
States
332,000
354,525
Sub.
Bond,
4.75%,
5/18/46
..........................
United
States
503,000
449,462
b
Commonwealth
Bank
of
Australia
,
Sub.
Bond
,
144A,
5.837
%
,
3/13/34
.........................................
Australia
695,000
740,290
Fifth
Third
Bancorp
,
Senior
Note,
6.339%
to
7/26/28,
FRN
thereafter,
7/27/29
....
United
States
138,000
145,133
Senior
Note,
4.895%
to
9/05/29,
FRN
thereafter,
9/06/30
....
United
States
245,000
250,167
JPMorgan
Chase
&
Co.
,
i
W,
Junior
Sub.
Bond,
FRN,
4.914%,
(3-month
SOFR
+
1.262%),
5/15/47
.................................
United
States
78,000
71,300
Senior
Bond,
5.502%
to
1/23/35,
FRN
thereafter,
1/24/36
...
United
States
64,000
67,342
Senior
Note,
5.14%
to
1/23/30,
FRN
thereafter,
1/24/31
.....
United
States
164,000
170,210
Sub.
Bond,
2.956%
to
5/12/30,
FRN
thereafter,
5/13/31
.....
United
States
1,180,000
1,123,070
Sub.
Bond,
5.717%
to
9/13/32,
FRN
thereafter,
9/14/33
.....
United
States
1,228,000
1,301,504
Sub.
Bond,
5.576%
to
7/22/35,
FRN
thereafter,
7/23/36
.....
United
States
1,117,000
1,162,100
Lloyds
Banking
Group
plc
,
Sub.
Bond
,
3.369%
to
12/13/41,
FRN
thereafter
,
12/14/46
................................
United
Kingdom
200,000
151,606
PNC
Financial
Services
Group,
Inc.
(The)
,
Senior
Bond,
5.373%
to
7/20/35,
FRN
thereafter,
7/21/36
...
United
States
29,000
30,078
Sub.
Bond,
4.626%
to
6/05/32,
FRN
thereafter,
6/06/33
.....
United
States
817,000
815,379
Toronto-Dominion
Bank
(The)
,
Junior
Sub.
Bond
,
8.125%
to
10/30/27,
FRN
thereafter
,
10/31/82
.....................
Canada
200,000
209,411
Truist
Financial
Corp.
,
Senior
Bond
,
5.711%
to
1/23/34,
FRN
thereafter
,
1/24/35
.................................
United
States
289,000
306,739
US
Bancorp
,
Sub.
Bond
,
2.491%
to
11/02/31,
FRN
thereafter
,
11/03/36
........................................
United
States
179,000
158,558
Wells
Fargo
Bank
NA
,
Sub.
Bond
,
6.6
%
,
1/15/38
............
United
States
500,000
565,984
Westpac
Banking
Corp.
,
Sub.
Bond,
4.421%,
7/24/39
.........................
Australia
66,000
61,802
Sub.
Bond,
2.963%,
11/16/40
........................
Australia
344,000
268,608
16,134,609
Biotechnology
0.6%
f
AbbVie,
Inc.
,
Senior
Bond,
4.75%,
3/15/36
.........................
United
States
25,000
25,141
Senior
Note,
4.4%,
3/15/33
..........................
United
States
70,000
70,314
Amgen,
Inc.
,
Senior
Bond,
5.25%,
3/02/33
.........................
United
States
290,000
303,738
Senior
Bond,
4.663%,
6/15/51
........................
United
States
69,000
60,290
Senior
Bond,
5.65%,
3/02/53
.........................
United
States
305,000
304,666
Senior
Bond,
5.75%,
3/02/63
.........................
United
States
227,000
225,173
Senior
Note,
5.25%,
3/02/30
.........................
United
States
640,000
667,990
Putnam
Asset
Allocation
Funds
Consolidated
Schedule
of
Investments
(unaudited)
Putnam
Multi-Asset
Income
Fund
The
accompanying
notes
are
an
integral
part
of
these
consolidated
financial
statements.
Semiannual
Report
a
a
Country
Principal
Amount
*
a
Value
a
a
a
a
a
Corporate
Bonds
(continued)
Biotechnology
(continued)
Biogen,
Inc.
,
Senior
Bond
,
2.25
%
,
5/01/30
.................
United
States
965,000
$
895,393
b
Genmab
A/S
/
Genmab
Finance
LLC
,
Senior
Secured
Note
,
144A,
6.25
%
,
12/15/32
..............................
Denmark
1,035,000
1,074,840
b
Grifols
SA
,
Senior
Note,
Reg
S,
3.875%,
10/15/28
.................
Spain
210,000
EUR
246,956
Senior
Note,
144A,
4.75%,
10/15/28
...................
Spain
915,000
904,180
Regeneron
Pharmaceuticals,
Inc.
,
Senior
Bond
,
1.75
%
,
9/15/30
United
States
995,000
897,192
5,675,873
Broadline
Retail
0.1%
b
Kohl's
Corp.
,
Senior
Secured
Note
,
144A,
10
%
,
6/01/30
......
United
States
30,000
32,683
b
Wayfair
LLC
,
Senior
Secured
Note,
144A,
7.25%,
10/31/29
............
United
States
75,000
77,557
Senior
Secured
Note,
144A,
7.75%,
9/15/30
.............
United
States
690,000
726,090
Senior
Secured
Note,
144A,
6.75%,
11/15/32
............
United
States
90,000
91,797
928,127
Building
Products
0.2%
b
Builders
FirstSource,
Inc.
,
Senior
Bond,
144A,
6.375%,
3/01/34
...................
United
States
40,000
41,251
Senior
Bond,
144A,
6.75%,
5/15/35
....................
United
States
35,000
36,568
Carlisle
Cos.,
Inc.
,
Senior
Bond
,
5.25
%
,
9/15/35
............
United
States
175,000
180,666
b
JH
North
America
Holdings,
Inc.
,
Senior
Secured
Note,
144A,
5.875%,
1/31/31
............
United
States
310,000
316,776
Senior
Secured
Note,
144A,
6.125%,
7/31/32
............
United
States
35,000
35,946
b
Miter
Brands
Acquisition
Holdco,
Inc.
/
MIWD
Borrower
LLC
,
Senior
Secured
Note
,
144A,
6.75
%
,
4/01/32
..............
United
States
305,000
307,722
b
Quikrete
Holdings,
Inc.
,
Senior
Note,
144A,
6.75%,
3/01/33
....................
United
States
205,000
213,231
Senior
Secured
Note,
144A,
6.375%,
3/01/32
............
United
States
605,000
629,169
b
Smyrna
Ready
Mix
Concrete
LLC
,
Senior
Secured
Note
,
144A,
8.875
%
,
11/15/31
..................................
United
States
75,000
79,726
b
Standard
Building
Solutions,
Inc.
,
Senior
Note,
144A,
6.5%,
8/15/32
.....................
United
States
310,000
319,553
Senior
Note,
144A,
6.25%,
8/01/33
....................
United
States
315,000
321,097
b
Standard
Industries,
Inc.
,
Senior
Bond
,
144A,
4.375
%
,
7/15/30
.
United
States
130,000
125,508
2,607,213
Capital
Markets
1.1%
Ares
Capital
Corp.
,
Senior
Note
,
7
%
,
1/15/27
..............
United
States
77,000
78,799
b
Aretec
Group,
Inc.
,
Senior
Secured
Note
,
144A,
10
%
,
8/15/30
..
United
States
23,000
24,499
Blackstone
Private
Credit
Fund
,
Senior
Note
,
3.25
%
,
3/15/27
..
United
States
93,000
91,361
Deutsche
Bank
AG
,
Senior
Non-Preferred
Note,
2.311%
to
11/15/26,
FRN
thereafter,
11/16/27
........................................
Germany
254,000
250,945
Goldman
Sachs
Group,
Inc.
(The)
,
Senior
Bond,
5.065%
to
1/20/36,
FRN
thereafter,
1/21/37
...
United
States
430,000
433,192
Senior
Note,
4.153%
to
10/20/28,
FRN
thereafter,
10/21/29
..
United
States
382,000
382,167
Intercontinental
Exchange,
Inc.
,
Senior
Note
,
4.35
%
,
6/15/29
...
United
States
350,000
354,555
b
Jane
Street
Group
/
JSG
Finance,
Inc.
,
Senior
Secured
Note,
144A,
6.125%,
11/01/32
...........
United
States
185,000
186,246
Senior
Secured
Note,
144A,
6.75%,
5/01/33
.............
United
States
1,445,000
1,483,942
Jefferies
Financial
Group,
Inc.
,
Senior
Note
,
4.5
%
,
9/15/26
....
United
States
170,000
170,038
b
KKR
Group
Finance
Co.
VI
LLC
,
Senior
Bond
,
144A,
3.75
%
,
7/01/29
.........................................
United
States
303,000
298,598
Putnam
Asset
Allocation
Funds
Consolidated
Schedule
of
Investments
(unaudited)
Putnam
Multi-Asset
Income
Fund
Semiannual
Report
The
accompanying
notes
are
an
integral
part
of
these
consolidated
financial
statements.
a
a
Country
Principal
Amount
*
a
Value
a
a
a
a
a
Corporate
Bonds
(continued)
Capital
Markets
(continued)
LPL
Holdings,
Inc.
,
Senior
Note,
6.75%,
11/17/28
........................
United
States
91,000
$
96,538
Senior
Note,
5.2%,
3/15/30
..........................
United
States
106,000
108,298
b
Senior
Note,
144A,
4%,
3/15/29
......................
United
States
680,000
670,970
Morgan
Stanley
,
Senior
Bond,
5.073%
to
1/29/36,
FRN
thereafter,
1/30/37
...
United
States
70,000
70,624
Senior
Note,
5.123%
to
1/31/28,
FRN
thereafter,
2/01/29
....
United
States
247,000
252,186
Senior
Note,
5.23%
to
1/14/30,
FRN
thereafter,
1/15/31
.....
United
States
1,061,000
1,098,945
Senior
Note,
4.493%
to
1/15/31,
FRN
thereafter,
1/16/32
....
United
States
70,000
70,421
Sub.
Bond,
5.948%
to
1/18/33,
FRN
thereafter,
1/19/38
.....
United
States
654,000
689,666
Sub.
Bond,
5.942%
to
2/06/34,
FRN
thereafter,
2/07/39
.....
United
States
712,000
750,669
b
MSCI,
Inc.
,
Senior
Bond
,
144A,
3.625
%
,
9/01/30
............
United
States
585,000
560,154
S&P
Global,
Inc.
,
Senior
Bond
,
2.5
%
,
12/01/29
.............
United
States
555,000
527,827
b
Stonex
Escrow
Issuer
LLC
,
Secured
Note
,
144A,
6.875
%
,
7/15/32
United
States
465,000
482,905
b
UBS
Group
AG
,
Senior
Note
,
144A,
5.428%
to
2/07/29,
FRN
thereafter
,
2/08/30
.................................
Switzerland
200,000
207,337
9,340,882
Chemicals
0.3%
b
Avient
Corp.
,
Senior
Note
,
144A,
6.25
%
,
11/01/31
...........
United
States
30,000
30,998
b
Braskem
Netherlands
Finance
BV
,
Senior
Bond
,
144A,
8
%
,
10/15/34
........................................
Brazil
210,000
85,632
Celanese
US
Holdings
LLC
,
Senior
Note
,
1.4
%
,
8/05/26
......
United
States
110,000
108,570
CF
Industries,
Inc.
,
Senior
Bond
,
4.95
%
,
6/01/43
............
United
States
120,000
110,296
b
Element
Solutions,
Inc.
,
Senior
Note
,
144A,
3.875
%
,
9/01/28
...
United
States
775,000
762,436
FMC
Corp.
,
Sub.
Bond
,
8.45%
to
10/31/30,
FRN
thereafter
,
11/01/55
........................................
United
States
370,000
243,671
b
Rain
Carbon,
Inc.
,
Senior
Secured
Note
,
144A,
12.25
%
,
9/01/29
United
States
575,000
613,028
b
SCIH
Salt
Holdings,
Inc.
,
Senior
Note,
144A,
6.625%,
5/01/29
...................
United
States
60,000
59,899
Senior
Secured
Note,
144A,
4.875%,
5/01/28
............
United
States
80,000
79,753
b
Solstice
Advanced
Materials,
Inc.
,
Senior
Note
,
144A,
5.625
%
,
9/30/33
.........................................
United
States
625,000
632,141
2,726,424
Commercial
Services
&
Supplies
0.6%
b
Aramark
Services,
Inc.
,
Senior
Bond
,
144A,
5
%
,
2/01/28
......
United
States
95,000
95,085
b
Clean
Harbors,
Inc.
,
Senior
Note
,
144A,
6.375
%
,
2/01/31
.....
United
States
310,000
318,534
b
GFL
Environmental,
Inc.
,
Senior
Note
,
144A,
6.75
%
,
1/15/31
...
United
States
155,000
162,766
b
Madison
IAQ
LLC
,
Senior
Secured
Note
,
144A,
4.125
%
,
6/30/28
United
States
45,000
44,446
b
Neptune
Bidco
US,
Inc.
,
Senior
Secured
Note,
144A,
9.29%,
4/15/29
.............
United
States
20,000
20,057
Senior
Secured
Note,
144A,
9.5%,
2/15/33
..............
United
States
725,000
710,529
Republic
Services,
Inc.
,
Senior
Note
,
5
%
,
11/15/29
..........
United
States
645,000
668,995
b
RR
Donnelley
&
Sons
Co.
,
Senior
Secured
Note
,
144A,
9.5
%
,
8/01/29
.........................................
United
States
600,000
618,839
b
Veritiv
Operating
Co.
,
Senior
Secured
Note
,
144A,
10.5
%
,
11/30/30
........................................
United
States
30,000
32,137
Waste
Connections,
Inc.
,
Senior
Bond
,
5
%
,
3/01/34
..........
United
States
865,000
894,584
b
Waste
Pro
USA,
Inc.
,
Senior
Note
,
144A,
7
%
,
2/01/33
........
United
States
615,000
641,596
b
Wrangler
Holdco
Corp.
,
Senior
Note
,
144A,
6.625
%
,
4/01/32
...
Canada
445,000
464,536
4,672,104
Putnam
Asset
Allocation
Funds
Consolidated
Schedule
of
Investments
(unaudited)
Putnam
Multi-Asset
Income
Fund
The
accompanying
notes
are
an
integral
part
of
these
consolidated
financial
statements.
Semiannual
Report
a
a
Country
Principal
Amount
*
a
Value
a
a
a
a
a
Corporate
Bonds
(continued)
Communications
Equipment
0.3%
Motorola
Solutions,
Inc.
,
Senior
Bond,
2.3%,
11/15/30
.........................
United
States
407,000
$
374,606
Senior
Note,
4.85%,
8/15/30
.........................
United
States
37,000
38,018
Senior
Note,
5.2%,
8/15/32
..........................
United
States
106,000
110,701
b
Viasat,
Inc.
,
Senior
Note
,
144A,
7.5
%
,
5/30/31
..............
United
States
1,250,000
1,234,735
1,758,060
Construction
&
Engineering
0.0%
†
b
Arcosa,
Inc.
,
Senior
Note
,
144A,
6.875
%
,
8/15/32
...........
United
States
35,000
36,744
MasTec,
Inc.
,
Senior
Note
,
5.9
%
,
6/15/29
.................
United
States
226,000
237,252
273,996
Consumer
Finance
0.8%
AerCap
Ireland
Capital
DAC
/
AerCap
Global
Aviation
Trust
,
Senior
Bond,
3.3%,
1/30/32
..........................
Ireland
655,000
612,272
Senior
Note,
5.1%,
1/19/29
..........................
Ireland
150,000
154,048
Senior
Note,
4.125%,
2/28/29
........................
Ireland
450,000
450,313
b
Aircastle
Ltd.
/
Aircastle
Ireland
DAC
,
Senior
Note
,
144A,
5.25
%
,
3/15/30
.........................................
United
States
150,000
154,890
Ally
Financial,
Inc.
,
Senior
Bond
,
8
%
,
11/01/31
.............
United
States
226,000
256,573
American
Express
Co.
,
Senior
Note
,
5.098%
to
2/15/27,
FRN
thereafter
,
2/16/28
.................................
United
States
295,000
298,076
b
Avolon
Holdings
Funding
Ltd.
,
Senior
Note,
144A,
5.75%,
11/15/29
...................
Ireland
147,000
153,709
Senior
Note,
144A,
4.9%,
10/10/30
....................
Ireland
1,035,000
1,050,174
Capital
One
Financial
Corp.
,
Senior
Note,
4.493%
to
9/10/30,
FRN
thereafter,
9/11/31
....
United
States
105,000
105,041
Senior
Note,
7.624%
to
10/29/30,
FRN
thereafter,
10/30/31
..
United
States
371,000
418,269
Sub.
Bond,
2.359%
to
7/28/31,
FRN
thereafter,
7/29/32
.....
United
States
385,000
339,459
b
Encore
Capital
Group,
Inc.
,
Senior
Secured
Note
,
144A,
8.5
%
,
5/15/30
.........................................
United
States
815,000
872,351
b
FirstCash,
Inc.
,
Senior
Note
,
144A,
6.875
%
,
3/01/32
.........
United
States
880,000
909,261
Ford
Motor
Credit
Co.
LLC
,
Senior
Note
,
5.8
%
,
3/05/27
.......
United
States
205,000
207,820
General
Motors
Financial
Co.,
Inc.
,
Senior
Bond,
5.45%,
9/06/34
.........................
United
States
205,000
210,501
Senior
Note,
4.2%,
10/27/28
.........................
United
States
40,000
40,163
Senior
Note,
5.8%,
1/07/29
..........................
United
States
105,000
109,679
Senior
Note,
4.9%,
10/06/29
.........................
United
States
221,000
226,035
b
Macquarie
Airfinance
Holdings
Ltd.
,
Senior
Note,
144A,
5.15%,
3/17/30
....................
United
Kingdom
657,000
671,687
Senior
Note,
144A,
6.5%,
3/26/31
.....................
United
Kingdom
86,000
92,845
OneMain
Finance
Corp.
,
Senior
Bond,
5.375%,
11/15/29
.......................
United
States
110,000
108,826
Senior
Note,
7.5%,
5/15/31
..........................
United
States
70,000
72,325
Senior
Note,
7.125%,
11/15/31
.......................
United
States
915,000
936,103
Senior
Note,
6.5%,
3/15/33
..........................
United
States
50,000
49,593
8,500,013
Consumer
Staples
Distribution
&
Retail
0.2%
b
7-Eleven,
Inc.
,
Senior
Bond,
144A,
1.8%,
2/10/31
.....................
United
States
30,000
26,684
Senior
Note,
144A,
1.3%,
2/10/28
.....................
United
States
734,000
697,880
b
Alimentation
Couche-Tard,
Inc.
,
Senior
Bond
,
144A,
3.55
%
,
7/26/27
.........................................
Canada
146,000
145,355
Putnam
Asset
Allocation
Funds
Consolidated
Schedule
of
Investments
(unaudited)
Putnam
Multi-Asset
Income
Fund
Semiannual
Report
The
accompanying
notes
are
an
integral
part
of
these
consolidated
financial
statements.
a
a
Country
Principal
Amount
*
a
Value
a
a
a
a
a
Corporate
Bonds
(continued)
Consumer
Staples
Distribution
&
Retail
(continued)
b
US
Foods,
Inc.
,
Senior
Note,
144A,
7.25%,
1/15/32
....................
United
States
325,000
$
340,779
Senior
Note,
144A,
5.75%,
4/15/33
....................
United
States
230,000
234,832
1,445,530
Containers
&
Packaging
0.3%
AptarGroup,
Inc.
,
Senior
Note
,
4.75
%
,
3/30/31
.............
United
States
230,000
233,499
Berry
Global,
Inc.
,
Senior
Secured
Note
,
1.65
%
,
1/15/27
......
United
States
143,000
140,343
b
Clydesdale
Acquisition
Holdings,
Inc.
,
Senior
Secured
Note
,
144A,
6.75
%
,
4/15/32
...............................
United
States
500,000
504,168
b
Mauser
Packaging
Solutions
Holding
Co.
,
Secured
Note,
144A,
9.25%,
4/15/30
...................
United
States
315,000
310,674
Senior
Secured
Note,
144A,
7.875%,
4/15/30
............
United
States
90,000
92,185
b
Toucan
FinCo
Ltd.
/
Toucan
FinCo
Can,
Inc.
/
Toucan
FinCo
US
LLC
,
Senior
Secured
Note
,
144A,
9.5
%
,
5/15/30
...........
Canada
705,000
669,624
WestRock
MWV
LLC
,
Senior
Bond
,
8.2
%
,
1/15/30
...........
United
States
310,000
355,232
2,305,725
Distributors
0.1%
b
American
Builders
&
Contractors
Supply
Co.,
Inc.
,
Senior
Note,
144A,
3.875%,
11/15/29
..................
United
States
330,000
319,763
Senior
Secured
Note,
144A,
4%,
1/15/28
................
United
States
55,000
54,245
374,008
Diversified
Consumer
Services
0.0%
†
Service
Corp.
International
,
Senior
Note
,
4
%
,
5/15/31
........
United
States
220,000
210,445
Diversified
REITs
0.1%
f
Equinix
Asia
Financing
Corp.
Pte.
Ltd.
,
Senior
Note
,
4.4
%
,
3/15/31
.........................................
United
States
320,000
319,835
GLP
Capital
LP
/
GLP
Financing
II,
Inc.
,
Senior
Bond
,
6.75
%
,
12/01/33
........................................
United
States
121,000
132,128
VICI
Properties
LP
,
Senior
Bond,
5.75%,
4/01/34
.........................
United
States
90,000
93,556
Senior
Note,
4.75%,
2/15/28
.........................
United
States
115,000
116,182
Senior
Note,
5.125%,
11/15/31
.......................
United
States
13,000
13,242
b
VICI
Properties
LP
/
VICI
Note
Co.,
Inc.
,
Senior
Note,
144A,
3.75%,
2/15/27
....................
United
States
41,000
40,810
Senior
Note,
144A,
4.5%,
1/15/28
.....................
United
States
133,000
133,568
Senior
Note,
144A,
3.875%,
2/15/29
...................
United
States
758,000
747,541
1,596,862
Diversified
Telecommunication
Services
0.8%
b
Altice
France
SA
,
Senior
Secured
Note
,
144A,
6.875
%
,
7/15/32
.
France
152,439
146,519
b
APLD
ComputeCo
LLC
,
Senior
Secured
Note
,
144A,
9.25
%
,
12/15/30
........................................
United
States
195,000
204,825
AT&T,
Inc.
,
Senior
Bond,
2.25%,
2/01/32
.........................
United
States
108,000
96,483
Senior
Bond,
2.55%,
12/01/33
........................
United
States
161,000
139,685
Senior
Bond,
5.125%,
4/30/36
........................
United
States
775,000
786,723
Senior
Bond,
4.75%,
5/15/46
.........................
United
States
12,000
10,567
Senior
Bond,
3.55%,
9/15/55
.........................
United
States
69,000
46,767
b
Black
Pearl
Compute
LLC
,
Senior
Secured
Note
,
144A,
6.125
%
,
2/15/31
.........................................
United
States
90,000
92,223
b
CCO
Holdings
LLC
/
CCO
Holdings
Capital
Corp.
,
Senior
Bond,
144A,
5.375%,
6/01/29
...................
United
States
215,000
214,634
Putnam
Asset
Allocation
Funds
Consolidated
Schedule
of
Investments
(unaudited)
Putnam
Multi-Asset
Income
Fund
The
accompanying
notes
are
an
integral
part
of
these
consolidated
financial
statements.
Semiannual
Report
a
a
Country
Principal
Amount
*
a
Value
a
a
a
a
a
Corporate
Bonds
(continued)
Diversified
Telecommunication
Services
(continued)
b
CCO
Holdings
LLC
/
CCO
Holdings
Capital
Corp.,
(continued)
Senior
Bond,
144A,
4.75%,
3/01/30
....................
United
States
95,000
$
91,907
Senior
Bond,
144A,
4.75%,
2/01/32
....................
United
States
2,695,000
2,508,119
Senior
Note,
144A,
7%,
2/01/33
......................
United
States
60,000
61,392
b
Cipher
Compute
LLC
,
Senior
Secured
Note
,
144A,
7.125
%
,
11/15/30
........................................
United
States
1,360,000
1,419,288
Comcast
Corp.
,
Senior
Bond
,
3.45
%
,
2/01/50
..............
United
States
63,000
43,388
b
Frontier
Communications
Holdings
LLC
,
Senior
Secured
Note
,
144A,
8.75
%
,
5/15/30
...............................
United
States
60,000
61,906
b
IHS
Holding
Ltd.
,
Senior
Note
,
Reg
S,
8.25
%
,
11/29/31
.......
Nigeria
200,000
213,213
Sprint
Capital
Corp.
,
Senior
Bond
,
6.875
%
,
11/15/28
.........
United
States
119,000
127,680
b
SV
RNO
Property
Owner
1
LLC
,
Senior
Secured
Note
,
144A,
5.875
%
,
3/01/31
...................................
United
States
205,000
206,063
Verizon
Communications,
Inc.
,
Senior
Bond,
5.875%,
11/30/55
.......................
United
States
200,000
201,479
Senior
Note,
4.75%,
1/15/33
.........................
United
States
255,000
258,684
b
Virgin
Media
Secured
Finance
plc
,
Senior
Secured
Bond
,
144A,
4.5
%
,
8/15/30
....................................
United
Kingdom
260,000
237,218
b
WULF
Compute
LLC
,
Senior
Secured
Note
,
144A,
7.75
%
,
10/15/30
........................................
United
States
555,000
588,175
7,756,938
Electric
Utilities
1.7%
American
Electric
Power
Co.,
Inc.
,
C,
Junior
Sub.
Bond,
5.8%
to
3/14/31,
FRN
thereafter,
3/15/56
United
States
307,000
308,559
D,
Junior
Sub.
Bond,
6.05%
to
3/14/36,
FRN
thereafter,
3/15/56
.........................................
United
States
250,000
250,979
J,
Senior
Bond,
4.3%,
12/01/28
.......................
United
States
195,000
196,956
b
American
Transmission
Systems,
Inc.
,
Senior
Bond
,
144A,
2.65
%
,
1/15/32
...................................
United
States
511,000
467,746
b
Buffalo
Energy
Mexico
Holdings
/
Buffalo
Energy
Infrastructure
/
Buffalo
Energy
,
Senior
Secured
Bond
,
144A,
7.875
%
,
2/15/39
Mexico
198,268
217,122
b
California
Buyer
Ltd.
/
Atlantica
Sustainable
Infrastructure
plc
,
Senior
Note
,
144A,
6.375
%
,
2/15/32
....................
United
Kingdom
775,000
773,223
DTE
Electric
Co.
,
Senior
Bond,
5.25%,
5/15/35
.........................
United
States
555,000
576,608
A,
Senior
Bond,
4.85%,
3/01/36
.......................
United
States
70,000
70,500
Duke
Energy
Carolinas
LLC
,
Senior
Bond
,
4.25
%
,
12/15/41
...
United
States
51,000
45,657
Duke
Energy
Corp.
,
Senior
Bond,
5.75%,
9/15/33
.........................
United
States
158,000
169,020
Senior
Bond,
5.8%,
6/15/54
..........................
United
States
21,000
20,839
Senior
Note,
4.85%,
1/05/29
.........................
United
States
246,000
252,154
Duke
Energy
Ohio,
Inc.
,
Senior
Bond
,
3.65
%
,
2/01/29
........
United
States
20,000
19,930
b
Enel
Finance
International
NV
,
Senior
Note
,
144A,
4.375
%
,
9/30/30
.........................................
Italy
510,000
512,758
b
Evergy
Missouri
West,
Inc.
,
Senior
Note
,
144A,
5.15
%
,
12/15/27
United
States
243,000
247,659
Eversource
Energy
,
Senior
Note
,
5.45
%
,
3/01/28
............
United
States
92,000
94,441
Exelon
Corp.
,
Senior
Bond,
5.625%,
6/15/35
........................
United
States
292,000
308,345
Senior
Note,
5.15%,
3/15/29
.........................
United
States
246,000
254,338
FirstEnergy
Transmission
LLC
,
Senior
Note
,
4.55
%
,
1/15/30
...
United
States
50,000
50,763
Georgia
Power
Co.
,
Senior
Bond,
4.95%,
5/17/33
.........................
United
States
114,000
117,778
Senior
Bond,
5.25%,
3/15/34
.........................
United
States
36,000
37,613
Putnam
Asset
Allocation
Funds
Consolidated
Schedule
of
Investments
(unaudited)
Putnam
Multi-Asset
Income
Fund
Semiannual
Report
The
accompanying
notes
are
an
integral
part
of
these
consolidated
financial
statements.
a
a
Country
Principal
Amount
*
a
Value
a
a
a
a
a
Corporate
Bonds
(continued)
Electric
Utilities
(continued)
NextEra
Energy
Capital
Holdings,
Inc.
,
Senior
Bond,
5.9%,
3/15/55
..........................
United
States
432,000
$
439,560
Senior
Note,
5.3%,
3/15/32
..........................
United
States
457,000
479,587
Northern
States
Power
Co.
,
Senior
Bond
,
5.05
%
,
5/15/35
.....
United
States
434,000
446,024
b
NRG
Energy,
Inc.
,
h
Junior
Sub.
Bond,
144A,
10.25%
to
3/14/28,
FRN
thereafter,
Perpetual
.......................................
United
States
70,000
77,106
Senior
Bond,
144A,
6.25%,
11/01/34
...................
United
States
245,000
253,500
Senior
Bond,
144A,
6%,
1/15/36
......................
United
States
495,000
504,050
Senior
Note,
144A,
3.375%,
2/15/29
...................
United
States
335,000
323,060
Senior
Secured
Bond,
144A,
7%,
3/15/33
...............
United
States
280,000
311,777
Senior
Secured
Note,
144A,
2.45%,
12/02/27
............
United
States
683,000
662,090
Oncor
Electric
Delivery
Co.
LLC
,
Senior
Secured
Bond,
4.95%,
9/15/52
..................
United
States
159,000
145,258
Senior
Secured
Note,
3.7%,
11/15/28
..................
United
States
70,000
69,715
Pacific
Gas
and
Electric
Co.
,
Senior
Bond,
5.9%,
6/15/32
..........................
United
States
311,000
330,014
Senior
Bond,
6.95%,
3/15/34
.........................
United
States
22,000
24,797
Senior
Bond,
4.95%,
7/01/50
.........................
United
States
64,000
55,445
Senior
Bond,
6.75%,
1/15/53
.........................
United
States
355,000
383,845
Senior
Note,
2.1%,
8/01/27
..........................
United
States
36,000
35,101
Senior
Note,
3.3%,
12/01/27
.........................
United
States
170,000
168,049
Senior
Note,
6.1%,
1/15/29
..........................
United
States
255,000
267,866
Senior
Note,
5.55%,
5/15/29
.........................
United
States
31,000
32,235
PG&E
Corp.
,
Junior
Sub.
Bond,
7.375%
to
3/14/30,
FRN
thereafter,
3/15/55
United
States
45,000
46,582
Senior
Secured
Bond,
5.25%,
7/01/30
..................
United
States
145,000
145,205
Southern
Co.
(The)
,
Senior
Bond,
5.7%,
3/15/34
..........................
United
States
107,000
113,845
Senior
Note,
5.5%,
3/15/29
..........................
United
States
31,000
32,319
Virginia
Electric
and
Power
Co.
,
Senior
Bond,
5.05%,
8/15/34
.........................
United
States
348,000
355,051
f
Senior
Bond,
4.95%,
3/15/36
.........................
United
States
135,000
134,832
C,
Senior
Bond,
4.9%,
9/15/35
.......................
United
States
395,000
396,334
b
Vistra
Operations
Co.
LLC
,
Senior
Note,
144A,
4.375%,
5/01/29
...................
United
States
515,000
509,754
Senior
Note,
144A,
7.75%,
10/15/31
...................
United
States
135,000
142,726
Senior
Note,
144A,
6.875%,
4/15/32
...................
United
States
180,000
189,448
Senior
Secured
Bond,
144A,
4.3%,
7/15/29
..............
United
States
320,000
320,335
Senior
Secured
Bond,
144A,
6.95%,
10/15/33
............
United
States
137,000
153,672
Senior
Secured
Bond,
144A,
6%,
4/15/34
...............
United
States
75,000
79,554
Senior
Secured
Bond,
144A,
5.7%,
12/30/34
.............
United
States
519,000
538,192
Senior
Secured
Bond,
144A,
5.25%,
10/15/35
............
United
States
430,000
431,183
Senior
Secured
Note,
144A,
3.7%,
1/30/27
..............
United
States
151,000
150,491
Senior
Secured
Note,
144A,
4.6%,
10/15/30
.............
United
States
405,000
407,771
Wisconsin
Electric
Power
Co.
,
Senior
Bond
,
4.6
%
,
10/01/34
...
United
States
242,000
244,414
Xcel
Energy,
Inc.
,
Senior
Bond
,
5.6
%
,
4/15/35
..............
United
States
285,000
298,013
14,691,788
Electrical
Equipment
0.0%
†
b
Energizer
Gamma
Acquisition
BV
,
Senior
Note
,
Reg
S,
3.5
%
,
6/30/29
.........................................
United
States
100,000
EUR
115,516
b
Sensata
Technologies
BV
,
Senior
Note
,
144A,
5.875
%
,
9/01/30
.
United
States
235,000
238,150
b
Vertiv
Group
Corp.
,
Senior
Secured
Note
,
144A,
4.125
%
,
11/15/28
........................................
United
States
301,000
299,983
Putnam
Asset
Allocation
Funds
Consolidated
Schedule
of
Investments
(unaudited)
Putnam
Multi-Asset
Income
Fund
The
accompanying
notes
are
an
integral
part
of
these
consolidated
financial
statements.
Semiannual
Report
a
a
Country
Principal
Amount
*
a
Value
a
a
a
a
a
Corporate
Bonds
(continued)
Electrical
Equipment
(continued)
f
Vertiv
Holdings
Co.
,
Senior
Bond,
4.85%,
3/15/36
.........................
United
States
100,000
$
99,654
Senior
Bond,
5.8%,
3/15/56
..........................
United
States
30,000
30,073
783,376
Electronic
Equipment,
Instruments
&
Components
0.2%
Amphenol
Corp.
,
Senior
Note
,
4.4
%
,
2/15/33
...............
United
States
415,000
416,142
CDW
LLC
/
CDW
Finance
Corp.
,
Senior
Note
,
3.25
%
,
2/15/29
..
United
States
385,000
372,146
b
TTM
Technologies,
Inc.
,
Senior
Note
,
144A,
4
%
,
3/01/29
......
United
States
560,000
543,941
1,332,229
Energy
Equipment
&
Services
0.6%
b
Archrock
Services
LP
/
Archrock
Partners
Finance
Corp.
,
Senior
Note
,
144A,
6
%
,
2/01/34
............................
United
States
570,000
577,404
b
Borr
IHC
Ltd.
/
Borr
Finance
LLC
,
Senior
Secured
Note
,
144A,
10.375
%
,
11/15/30
.................................
Mexico
419,854
439,011
b
Kodiak
Gas
Services
LLC
,
Senior
Bond,
144A,
6.75%,
10/01/35
...................
United
States
120,000
125,448
Senior
Note,
144A,
7.25%,
2/15/29
....................
United
States
245,000
254,204
Senior
Note,
144A,
6.5%,
10/01/33
....................
United
States
305,000
314,679
b
Nabors
Industries,
Inc.
,
Senior
Note
,
144A,
8.875
%
,
8/15/31
...
United
States
35,000
36,278
b
Transocean
Aquila
Ltd.
,
Senior
Secured
Note
,
144A,
8
%
,
9/30/28
United
States
14,462
14,892
Transocean
International
Ltd.
,
Senior
Bond,
6.8%,
3/15/38
..........................
United
States
320,000
310,270
b
Senior
Note,
144A,
8.5%,
5/15/31
.....................
United
States
295,000
312,145
b
Senior
Secured
Note,
144A,
8.75%,
2/15/30
.............
United
States
493,500
516,626
b
Senior
Secured
Note,
144A,
7.875%,
10/15/32
...........
United
States
410,000
440,432
b
Weatherford
International
Ltd.
,
Senior
Note,
144A,
8.625%,
4/30/30
...................
United
States
38,000
39,178
Senior
Note,
144A,
6.75%,
10/15/33
...................
United
States
480,000
502,087
3,882,654
Entertainment
0.2%
b
Banijay
Entertainment
SAS
,
Senior
Secured
Note
,
144A,
8.125
%
,
5/01/29
.........................................
France
865,000
896,067
Discovery
Global
Holdings,
Inc.
,
Senior
Bond
,
5.05
%
,
3/15/42
..
United
States
60,000
42,300
b
Live
Nation
Entertainment,
Inc.
,
Senior
Secured
Note
,
144A,
6.5
%
,
5/15/27
....................................
United
States
70,000
70,378
Netflix,
Inc.
,
Senior
Bond,
5.875%,
11/15/28
.......................
United
States
45,000
47,351
b
Senior
Bond,
144A,
5.375%,
11/15/29
..................
United
States
365,000
380,927
b
Pinewood
Finco
plc
,
Senior
Secured
Note
,
144A,
6
%
,
3/27/30
..
United
Kingdom
100,000
GBP
136,347
1,573,370
Financial
Services
0.7%
Corebridge
Financial,
Inc.
,
Senior
Note
,
3.85
%
,
4/05/29
.......
United
States
180,000
178,038
b
CrossCountry
Intermediate
HoldCo
LLC
,
Senior
Note,
144A,
6.5%,
10/01/30
....................
United
States
85,000
84,769
Senior
Note,
144A,
6.75%,
12/01/32
...................
United
States
1,030,000
1,020,199
b
Freedom
Mortgage
Corp.
,
Senior
Note
,
144A,
12.25
%
,
10/01/30
United
States
765,000
832,564
b
Freedom
Mortgage
Holdings
LLC
,
Senior
Note
,
144A,
8.375
%
,
4/01/32
.........................................
United
States
120,000
121,001
b
GGAM
Finance
Ltd.
,
Senior
Note
,
144A,
8
%
,
2/15/27
........
Ireland
30,000
30,360
b
Jefferson
Capital
Holdings
LLC
,
Senior
Note,
144A,
9.5%,
2/15/29
.....................
United
States
95,000
100,363
Putnam
Asset
Allocation
Funds
Consolidated
Schedule
of
Investments
(unaudited)
Putnam
Multi-Asset
Income
Fund
Semiannual
Report
The
accompanying
notes
are
an
integral
part
of
these
consolidated
financial
statements.
a
a
Country
Principal
Amount
*
a
Value
a
a
a
a
a
Corporate
Bonds
(continued)
Financial
Services
(continued)
b
Jefferson
Capital
Holdings
LLC,
(continued)
Senior
Note,
144A,
8.25%,
5/15/30
....................
United
States
810,000
$
849,255
b
Osaic
Holdings,
Inc.
,
Senior
Note,
144A,
8%,
8/01/33
......................
United
States
930,000
927,471
Senior
Secured
Note,
144A,
6.75%,
8/01/32
.............
United
States
95,000
95,937
b
Petronas
Capital
Ltd.
,
Senior
Bond
,
Reg
S,
2.48
%
,
1/28/32
....
Malaysia
680,000
621,891
b
PHH
Escrow
Issuer
LLC
/
PHH
Corp.
,
Senior
Note
,
144A,
9.875
%
,
11/01/29
..................................
United
States
835,000
839,087
b
PRA
Group,
Inc.
,
Senior
Note
,
144A,
8.875
%
,
1/31/30
........
United
States
145,000
147,719
b
Rocket
Cos.,
Inc.
,
Senior
Note,
144A,
7.125%,
2/01/32
...................
United
States
75,000
78,478
Senior
Note,
144A,
6.375%,
8/01/33
...................
United
States
765,000
791,599
b
Shift4
Payments
LLC
/
Shift4
Payments
Finance
Sub,
Inc.
,
Senior
Note
,
144A,
5.5
%
,
5/15/33
...........................
United
States
255,000
EUR
298,990
7,017,721
Food
Products
0.7%
b,g
Chobani
Holdco
II
LLC
,
Senior
Note
,
144A,
PIK,
8.75
%
,
10/01/29
United
States
32,742
33,783
b
Chobani
LLC
/
Chobani
Finance
Corp.,
Inc.
,
Senior
Note
,
144A,
7.625
%
,
7/01/29
...................................
United
States
80,000
83,317
b
Froneri
Lux
FinCo
SARL
,
Senior
Secured
Note
,
144A,
6
%
,
8/01/32
.........................................
United
Kingdom
715,000
719,482
b
Industrial
F&B
Investments
III,
Inc.
,
Senior
Secured
Note
,
144A,
7.75
%
,
2/11/33
....................................
United
States
95,000
97,577
JBS
NV
/
JBS
USA
Foods
Group
Holdings,
Inc.
/
JBS
USA
Food
Co.
Holdings
,
Senior
Note,
3%,
2/02/29
...........................
United
States
187,000
181,770
Senior
Note,
6.75%,
3/15/34
.........................
United
States
462,000
515,356
Senior
Note,
5.95%,
4/20/35
.........................
United
States
34,000
36,083
Kellanova
,
Senior
Bond,
4.5%,
4/01/46
..........................
United
States
16,000
14,393
B,
Senior
Bond,
7.45%,
4/01/31
.......................
United
States
21,000
24,204
Kraft
Heinz
Foods
Co.
,
Senior
Bond,
6.875%,
1/26/39
........................
United
States
40,000
45,136
Senior
Bond,
4.625%,
10/01/39
.......................
United
States
40,000
36,666
Senior
Bond,
5%,
6/04/42
...........................
United
States
565,000
518,596
b
Mars,
Inc.
,
Senior
Bond,
144A,
5.65%,
5/01/45
....................
United
States
665,000
680,943
Senior
Bond,
144A,
5.7%,
5/01/55
.....................
United
States
740,000
750,931
Senior
Bond,
144A,
5.8%,
5/01/65
.....................
United
States
29,000
29,728
Senior
Note,
144A,
5%,
3/01/32
......................
United
States
15,000
15,542
Senior
Note,
144A,
5.2%,
3/01/35
.....................
United
States
703,000
728,185
Pilgrim's
Pride
Corp.
,
Senior
Note
,
3.5
%
,
3/01/32
...........
United
States
432,000
405,638
4,917,330
Gas
Utilities
0.0%
†
CenterPoint
Energy
Resources
Corp.
,
Senior
Bond
,
5.4
%
,
7/01/34
.........................................
United
States
99,000
103,477
Ground
Transportation
0.1%
b
Ashtead
Capital,
Inc.
,
Senior
Bond,
144A,
4.375%,
8/15/27
...................
United
Kingdom
200,000
199,783
Senior
Note,
144A,
4%,
5/01/28
......................
United
Kingdom
200,000
198,921
b
Beacon
Mobility
Corp.
,
Senior
Secured
Note
,
144A,
7.25
%
,
8/01/30
.........................................
United
States
50,000
52,407
Burlington
Northern
Santa
Fe
LLC
,
Senior
Bond
,
5.55
%
,
3/15/56
United
States
200,000
200,889
Putnam
Asset
Allocation
Funds
Consolidated
Schedule
of
Investments
(unaudited)
Putnam
Multi-Asset
Income
Fund
The
accompanying
notes
are
an
integral
part
of
these
consolidated
financial
statements.
Semiannual
Report
a
a
Country
Principal
Amount
*
a
Value
a
a
a
a
a
Corporate
Bonds
(continued)
Ground
Transportation
(continued)
b
Penske
Truck
Leasing
Co.
LP
/
PTL
Finance
Corp.
,
Senior
Note
,
144A,
4.4
%
,
7/01/27
...............................
United
States
45,000
$
45,214
b
SMBC
Aviation
Capital
Finance
DAC
,
Senior
Note
,
144A,
5.3
%
,
4/03/29
.........................................
Ireland
490,000
506,001
b
Transnet
SOC
Ltd.
,
Senior
Note
,
Reg
S,
8.25
%
,
2/06/28
......
South
Africa
200,000
210,961
b
Watco
Cos.
LLC
/
Watco
Finance
Corp.
,
Senior
Note
,
144A,
7.125
%
,
8/01/32
...................................
United
States
115,000
121,079
1,535,255
Health
Care
Equipment
&
Supplies
0.3%
b
Bausch
+
Lomb
Corp.
,
Senior
Secured
Note
,
144A,
8.375
%
,
10/01/28
........................................
United
States
40,000
41,500
b,i
Bausch
+
Lomb
Netherlands
BV
and
Bausch
&
Lomb,
Inc.
,
Senior
Secured
Note
,
144A,
FRN
,
5.891
%
,
(
3-month
EURIBOR
+
3.875
%
),
1/15/31
..................................
United
States
100,000
EUR
120,042
GE
HealthCare
Technologies,
Inc.
,
Senior
Note,
5.65%,
11/15/27
........................
United
States
110,000
113,059
Senior
Note,
4.8%,
8/14/29
..........................
United
States
220,000
225,659
b
Insulet
Corp.
,
Senior
Note
,
144A,
6.5
%
,
4/01/33
............
United
States
65,000
67,643
b
Medline
Borrower
LP
,
Senior
Note,
144A,
5.25%,
10/01/29
...................
United
States
575,000
575,328
Senior
Secured
Note,
144A,
3.875%,
4/01/29
............
United
States
1,740,000
1,712,432
2,855,663
Health
Care
Providers
&
Services
0.8%
b
CHS/Community
Health
Systems,
Inc.
,
Senior
Secured
Note,
144A,
5.25%,
5/15/30
.............
United
States
540,000
519,249
Senior
Secured
Note,
144A,
10.875%,
1/15/32
...........
United
States
331,000
359,127
Senior
Secured
Note,
144A,
9.75%,
1/15/34
.............
United
States
350,000
369,274
b
Concentra
Health
Services,
Inc.
,
Senior
Note
,
144A,
6.875
%
,
7/15/32
.........................................
United
States
345,000
360,661
CVS
Health
Corp.
,
Junior
Sub.
Bond,
7%
to
3/09/30,
FRN
thereafter,
3/10/55
...
United
States
675,000
710,376
Senior
Bond,
1.875%,
2/28/31
........................
United
States
625,000
557,383
Senior
Bond,
4.78%,
3/25/38
.........................
United
States
707,000
675,839
b
DaVita,
Inc.
,
Senior
Note,
144A,
6.875%,
9/01/32
...................
United
States
960,000
998,122
Senior
Note,
144A,
6.75%,
7/15/33
....................
United
States
15,000
15,585
HCA,
Inc.
,
Senior
Bond,
5.25%,
6/15/26
.........................
United
States
23,000
23,016
Senior
Bond,
5.6%,
4/01/34
..........................
United
States
50,000
52,560
Senior
Bond,
6%,
4/01/54
...........................
United
States
274,000
274,410
Senior
Note,
3.625%,
3/15/32
........................
United
States
238,000
226,844
Senior
Note,
4.6%,
11/15/32
.........................
United
States
65,000
65,124
Humana,
Inc.
,
Senior
Note
,
5.75
%
,
3/01/28
................
United
States
156,000
160,315
Icon
Investments
Six
DAC
,
Senior
Secured
Note
,
5.809
%
,
5/08/27
.........................................
United
States
200,000
201,831
b
Kedrion
SpA
,
Senior
Secured
Note
,
144A,
6.5
%
,
9/01/29
......
Italy
705,000
686,645
Tenet
Healthcare
Corp.
,
b
Senior
Note,
144A,
6%,
11/15/33
......................
United
States
645,000
666,959
Senior
Secured
Note,
6.125%,
6/15/30
.................
United
States
275,000
280,828
UnitedHealth
Group,
Inc.
,
Senior
Bond
,
4.625
%
,
7/15/35
......
United
States
250,000
248,588
7,452,736
Putnam
Asset
Allocation
Funds
Consolidated
Schedule
of
Investments
(unaudited)
Putnam
Multi-Asset
Income
Fund
Semiannual
Report
The
accompanying
notes
are
an
integral
part
of
these
consolidated
financial
statements.
a
a
Country
Principal
Amount
*
a
Value
a
a
a
a
a
Corporate
Bonds
(continued)
Health
Care
REITs
0.1%
b
MPT
Operating
Partnership
LP
/
MPT
Finance
Corp.
,
Senior
Secured
Note
,
144A,
8.5
%
,
2/15/32
....................
United
States
780,000
$
835,382
Health
Care
Technology
0.1%
b
AthenaHealth
Group,
Inc.
,
Senior
Note
,
144A,
6.5
%
,
2/15/30
...
United
States
90,000
84,709
b
IQVIA,
Inc.
,
Senior
Note
,
144A,
6.25
%
,
6/01/32
.............
United
States
960,000
988,729
1,073,438
Hotel
&
Resort
REITs
0.1%
b
RHP
Hotel
Properties
LP
/
RHP
Finance
Corp.
,
Senior
Note,
144A,
7.25%,
7/15/28
....................
United
States
20,000
20,552
Senior
Note,
144A,
6.5%,
4/01/32
.....................
United
States
685,000
709,250
Senior
Note,
144A,
6.5%,
6/15/33
.....................
United
States
40,000
41,575
f
Senior
Note,
144A,
5.75%,
3/15/34
....................
United
States
155,000
156,254
b
XHR
LP
,
Senior
Note
,
144A,
6.625
%
,
5/15/30
..............
United
States
25,000
25,955
953,586
Hotels,
Restaurants
&
Leisure
1.3%
b
1011778
BC
ULC
/
New
Red
Finance,
Inc.
,
Secured
Bond
,
144A,
4
%
,
10/15/30
.....................................
Canada
580,000
557,346
b
Boyd
Gaming
Corp.
,
Senior
Bond
,
144A,
4.75
%
,
6/15/31
......
United
States
195,000
190,897
b
Caesars
Entertainment,
Inc.
,
Senior
Note,
144A,
6%,
10/15/32
.....................
United
States
35,000
34,243
Senior
Secured
Note,
144A,
7%,
2/15/30
................
United
States
130,000
133,348
b
Carnival
Corp.
,
Senior
Note,
144A,
5.125%,
5/01/29
...................
United
States
255,000
258,779
Senior
Note,
144A,
5.75%,
3/15/30
....................
United
States
1,044,000
1,080,475
Senior
Note,
144A,
5.875%,
6/15/31
...................
United
States
80,000
83,656
Senior
Note,
144A,
5.75%,
8/01/32
....................
United
States
1,110,000
1,153,345
Senior
Note,
144A,
6.125%,
2/15/33
...................
United
States
1,470,000
1,522,723
Senior
Secured
Note,
144A,
4%,
8/01/28
................
United
States
291,000
289,158
b
Churchill
Downs,
Inc.
,
Senior
Note
,
144A,
5.75
%
,
4/01/30
.....
United
States
90,000
90,769
b
Fertitta
Entertainment
LLC
/
Fertitta
Entertainment
Finance
Co.,
Inc.
,
Senior
Note
,
144A,
6.75
%
,
1/15/30
.................
United
States
920,000
868,494
b
Great
Canadian
Gaming
Corp.
/
Raptor
LLC
,
Senior
Secured
Note
,
144A,
8.75
%
,
11/15/29
.........................
Canada
70,000
71,202
b
Hilton
Domestic
Operating
Co.,
Inc.
,
Senior
Note
,
144A,
5.75
%
,
9/15/33
.........................................
United
States
750,000
768,150
Hyatt
Hotels
Corp.
,
Senior
Note,
5.25%,
6/30/29
.........................
United
States
110,000
113,700
Senior
Note,
5.375%,
12/15/31
.......................
United
States
325,000
337,424
b
Light
&
Wonder
International,
Inc.
,
Senior
Note,
144A,
7.25%,
11/15/29
...................
United
States
195,000
200,099
Senior
Note,
144A,
7.5%,
9/01/31
.....................
United
States
15,000
15,695
Marriott
International,
Inc.
,
Senior
Note
,
4.5
%
,
5/01/33
........
United
States
270,000
269,193
b
Mohegan
Tribal
Gaming
Authority
/
MS
Digital
Entertainment
Holdings
LLC
,
Senior
Secured
Note
,
144A,
8.25
%
,
4/15/30
..
United
States
495,000
516,178
b
NCL
Corp.
Ltd.
,
Senior
Note,
144A,
7.75%,
2/15/29
....................
United
States
50,000
53,459
Senior
Note,
144A,
6.75%,
2/01/32
....................
United
States
470,000
484,344
Senior
Note,
144A,
6.25%,
9/15/33
....................
United
States
35,000
35,349
b
Penn
Entertainment,
Inc.
,
Senior
Note
,
144A,
5.625
%
,
1/15/27
.
United
States
75,000
75,316
b
Rivers
Enterprise
Borrower
LLC
,
Senior
Secured
Note
,
144A,
6.25
%
,
10/15/30
...................................
United
States
285,000
291,341
b
Royal
Caribbean
Cruises
Ltd.
,
Senior
Note,
144A,
5.625%,
9/30/31
...................
United
States
55,000
56,708
Senior
Note,
144A,
6.25%,
3/15/32
....................
United
States
795,000
829,263
Putnam
Asset
Allocation
Funds
Consolidated
Schedule
of
Investments
(unaudited)
Putnam
Multi-Asset
Income
Fund
The
accompanying
notes
are
an
integral
part
of
these
consolidated
financial
statements.
Semiannual
Report
a
a
Country
Principal
Amount
*
a
Value
a
a
a
a
a
Corporate
Bonds
(continued)
Hotels,
Restaurants
&
Leisure
(continued)
b
Royal
Caribbean
Cruises
Ltd.,
(continued)
Senior
Note,
144A,
6%,
2/01/33
......................
United
States
125,000
$
129,518
b
Scientific
Games
Holdings
LP
/
Scientific
Games
US
FinCo,
Inc.
,
Senior
Note
,
144A,
6.625
%
,
3/01/30
....................
United
States
75,000
68,034
b
Station
Casinos
LLC
,
Senior
Note
,
144A,
6.625
%
,
3/15/32
.....
United
States
70,000
71,712
b
Viking
Cruises
Ltd.
,
Senior
Note,
144A,
7%,
2/15/29
......................
United
States
30,000
30,066
Senior
Note,
144A,
9.125%,
7/15/31
...................
United
States
515,000
548,194
b
Wynn
Resorts
Finance
LLC
/
Wynn
Resorts
Capital
Corp.
,
Senior
Note
,
144A,
7.125
%
,
2/15/31
.........................
United
States
185,000
199,879
11,428,057
Household
Durables
0.5%
b
Ashton
Woods
USA
LLC
/
Ashton
Woods
Finance
Co.
,
Senior
Note
,
144A,
6.875
%
,
8/01/33
.........................
United
States
570,000
575,833
DR
Horton,
Inc.
,
Senior
Bond
,
5
%
,
10/15/34
...............
United
States
628,000
643,988
b
K.
Hovnanian
Enterprises,
Inc.
,
Senior
Note,
144A,
8%,
4/01/31
......................
United
States
180,000
185,267
Senior
Note,
144A,
8.375%,
10/01/33
..................
United
States
180,000
184,743
b
LGI
Homes,
Inc.
,
Senior
Note
,
144A,
8.75
%
,
12/15/28
........
United
States
100,000
104,399
Newell
Brands,
Inc.
,
Senior
Note,
6.375%,
5/15/30
........................
United
States
30,000
30,116
Senior
Note,
6.625%,
5/15/32
........................
United
States
330,000
330,186
b
Taylor
Morrison
Communities,
Inc.
,
Senior
Bond,
144A,
5.125%,
8/01/30
...................
United
States
190,000
191,811
Senior
Note,
144A,
5.75%,
1/15/28
....................
United
States
35,000
35,729
Senior
Note,
144A,
5.75%,
11/15/32
...................
United
States
430,000
444,655
Toll
Brothers
Finance
Corp.
,
Senior
Bond,
4.35%,
2/15/28
.........................
United
States
75,000
75,527
Senior
Bond,
3.8%,
11/01/29
.........................
United
States
357,000
353,691
b
Weekley
Homes
LLC
/
Weekley
Finance
Corp.
,
Senior
Note,
144A,
4.875%,
9/15/28
...................
United
States
385,000
381,439
Senior
Note,
144A,
6.75%,
1/15/34
....................
United
States
645,000
649,548
4,186,932
Household
Products
0.0%
†
b
Energizer
Holdings,
Inc.
,
Senior
Note
,
144A,
4.375
%
,
3/31/29
..
United
States
30,000
29,167
Independent
Power
and
Renewable
Electricity
Producers
0.6%
b
AES
Andes
SA
,
Senior
Note
,
144A,
6.25
%
,
3/14/32
..........
Chile
200,000
208,343
b
Alexander
Funding
Trust
II
,
Senior
Secured
Note
,
144A,
7.467
%
,
7/31/28
.........................................
United
States
600,000
639,370
b
Clearway
Energy
Operating
LLC
,
Senior
Bond,
144A,
3.75%,
1/15/32
....................
United
States
415,000
386,211
Senior
Note,
144A,
3.75%,
2/15/31
....................
United
States
205,000
194,334
Senior
Note,
144A,
5.75%,
1/15/34
....................
United
States
315,000
319,299
Constellation
Energy
Generation
LLC
,
Senior
Bond,
6.125%,
1/15/34
........................
United
States
216,000
236,663
Senior
Bond,
6.5%,
10/01/53
.........................
United
States
252,000
278,237
Senior
Bond,
5.75%,
3/15/54
.........................
United
States
113,000
113,695
Senior
Note,
4.4%,
1/15/31
..........................
United
States
715,000
720,038
b
Senior
Note,
144A,
5%,
2/01/31
......................
United
States
315,000
319,822
b
FIEMEX
Energia
-
Banco
Actinver
SA
Institucion
de
Banca
Multiple
,
Senior
Secured
Bond
,
144A,
7.25
%
,
1/31/41
......
Mexico
198,101
206,852
Southern
Power
Co.
,
B,
Senior
Bond,
4.9%,
10/01/35
.......................
United
States
410,000
408,757
Putnam
Asset
Allocation
Funds
Consolidated
Schedule
of
Investments
(unaudited)
Putnam
Multi-Asset
Income
Fund
Semiannual
Report
The
accompanying
notes
are
an
integral
part
of
these
consolidated
financial
statements.
a
a
Country
Principal
Amount
*
a
Value
a
a
a
a
a
Corporate
Bonds
(continued)
Independent
Power
and
Renewable
Electricity
Producers
(continued)
Southern
Power
Co.,
(continued)
A,
Senior
Note,
4.25%,
10/01/30
......................
United
States
385,000
$
387,100
b
Talen
Energy
Supply
LLC
,
Senior
Bond,
144A,
6.5%,
2/01/36
.....................
United
States
430,000
442,360
Senior
Note,
144A,
6.25%,
2/01/34
....................
United
States
445,000
453,094
b,h
Vistra
Corp.
,
Junior
Sub.
Bond
,
144A,
8%
to
10/14/26,
FRN
thereafter
,
Perpetual
...............................
United
States
65,000
66,257
5,380,432
Insurance
0.5%
b
Acrisure
LLC
/
Acrisure
Finance,
Inc.
,
Senior
Note,
144A,
8.5%,
6/15/29
.....................
United
States
85,000
84,872
Senior
Secured
Note,
144A,
7.5%,
11/06/30
.............
United
States
85,000
86,552
b
Alliant
Holdings
Intermediate
LLC
/
Alliant
Holdings
Co-Issuer
,
Senior
Note,
144A,
5.875%,
11/01/29
..................
United
States
105,000
102,533
Senior
Note,
144A,
7.375%,
10/01/32
..................
United
States
25,000
24,750
Senior
Secured
Note,
144A,
7%,
1/15/31
................
United
States
1,105,000
1,125,824
Arthur
J
Gallagher
&
Co.
,
Senior
Note
,
4.85
%
,
12/15/29
......
United
States
80,000
81,983
b
Asurion
LLC
and
Asurion
Co-Issuer,
Inc.
,
Senior
Secured
Note,
144A,
8%,
12/31/32
...............
United
States
530,000
557,119
Senior
Secured
Note,
144A,
8.375%,
2/01/34
............
United
States
605,000
602,451
b
Athene
Global
Funding
,
Secured
Note,
144A,
5.526%,
7/11/31
..................
United
States
175,000
180,637
Secured
Note,
144A,
5.322%,
11/13/31
.................
United
States
476,000
483,435
Senior
Secured
Bond,
144A,
5.543%,
8/22/35
............
United
States
75,000
74,746
Athene
Holding
Ltd.
,
Senior
Bond
,
6.25
%
,
4/01/54
...........
United
States
25,000
23,357
Brown
&
Brown,
Inc.
,
Senior
Note,
4.9%,
6/23/30
..........................
United
States
484,000
492,265
Senior
Note,
5.25%,
6/23/32
.........................
United
States
42,000
42,816
CNA
Financial
Corp.
,
Senior
Bond
,
5.125
%
,
2/15/34
.........
United
States
69,000
70,130
b
CNO
Global
Funding
,
Secured
Note
,
144A,
4.95
%
,
9/09/29
....
United
States
305,000
310,830
F&G
Annuities
&
Life,
Inc.
,
Senior
Note
,
6.5
%
,
6/04/29
.......
United
States
280,000
288,403
b
Jones
Deslauriers
Insurance
Management,
Inc.
,
Senior
Secured
Note
,
144A,
8.5
%
,
3/15/30
...........................
Canada
35,000
36,341
b
Massachusetts
Mutual
Life
Insurance
Co.
,
Sub.
Bond
,
144A,
3.729
%
,
10/15/70
..................................
United
States
116,000
75,864
b
Metropolitan
Life
Global
Funding
I
,
Senior
Secured
Bond
,
144A,
2.95
%
,
4/09/30
...................................
United
States
325,000
311,828
5,056,736
Interactive
Media
&
Services
0.0%
†
Alphabet,
Inc.
,
Senior
Bond
,
4.8
%
,
2/15/36
................
United
States
210,000
213,532
Meta
Platforms,
Inc.
,
Senior
Bond
,
5.55
%
,
8/15/64
..........
United
States
124,000
116,928
330,460
IT
Services
0.0%
†
b
Cogent
Communications
Group
LLC
/
Cogent
Finance,
Inc.
,
Senior
Secured
Note
,
144A,
6.5
%
,
7/01/32
...............
United
States
215,000
190,742
b
Fortress
Intermediate
3,
Inc.
,
Senior
Secured
Note
,
144A,
7.5
%
,
6/01/31
.........................................
United
States
65,000
63,629
254,371
Leisure
Products
0.1%
Brunswick
Corp.
,
Senior
Bond,
2.4%,
8/18/31
..........................
United
States
242,000
215,138
Putnam
Asset
Allocation
Funds
Consolidated
Schedule
of
Investments
(unaudited)
Putnam
Multi-Asset
Income
Fund
The
accompanying
notes
are
an
integral
part
of
these
consolidated
financial
statements.
Semiannual
Report
a
a
Country
Principal
Amount
*
a
Value
a
a
a
a
a
Corporate
Bonds
(continued)
Leisure
Products
(continued)
Brunswick
Corp.,
(continued)
Senior
Note,
5.85%,
3/18/29
.........................
United
States
212,000
$
220,555
435,693
Life
Sciences
Tools
&
Services
0.0%
†
Illumina,
Inc.
,
Senior
Note
,
4.65
%
,
9/09/26
................
United
States
86,000
86,305
Thermo
Fisher
Scientific,
Inc.
,
Senior
Bond
,
4.902
%
,
2/12/36
...
United
States
230,000
234,078
320,383
Machinery
0.0%
†
b
Chart
Industries,
Inc.
,
Senior
Note
,
144A,
9.5
%
,
1/01/31
......
United
States
25,000
26,317
b
Terex
Corp.
,
Senior
Note,
144A,
5%,
5/15/29
......................
United
States
320,000
320,496
Senior
Note,
144A,
6.25%,
10/15/32
...................
United
States
35,000
36,071
382,884
Media
1.0%
b
Block
Communications,
Inc.
,
Senior
Secured
Note
,
144A,
10.25
%
,
3/01/31
...................................
United
States
410,000
377,280
Charter
Communications
Operating
LLC
/
Charter
Communications
Operating
Capital
Corp.
,
Senior
Secured
Bond,
5.85%,
12/01/35
.................
United
States
345,000
347,363
Senior
Secured
Bond,
3.5%,
6/01/41
...................
United
States
470,000
338,906
Senior
Secured
Bond,
4.8%,
3/01/50
...................
United
States
385,000
293,644
Senior
Secured
Note,
2.25%,
1/15/29
..................
United
States
92,000
86,874
b
Clear
Channel
Outdoor
Holdings,
Inc.
,
Senior
Note,
144A,
7.75%,
4/15/28
....................
United
States
30,000
30,256
Senior
Secured
Note,
144A,
7.875%,
4/01/30
............
United
States
40,000
42,176
Senior
Secured
Note,
144A,
7.5%,
3/15/33
..............
United
States
120,000
129,609
Directv
Financing
LLC
,
b
Senior
Secured
Note,
144A,
8.875%,
2/01/30
............
United
States
1,100,000
1,102,278
b
Directv
Financing
LLC
/
Directv
Financing
Co-Obligor,
Inc.
,
Senior
Secured
Note,
144A,
5.875%,
8/15/27
............
United
States
13,000
13,023
Senior
Secured
Note,
144A,
10%,
2/15/31
...............
United
States
60,000
61,412
Discovery
Communications
LLC
,
Senior
Note
,
4.125
%
,
5/15/29
.
United
States
75,000
74,018
EchoStar
Corp.
,
Senior
Secured
Note
,
10.75
%
,
11/30/29
......
United
States
100,000
109,252
b
EW
Scripps
Co.
(The)
,
Secured
Note
,
144A,
9.875
%
,
8/15/30
..
United
States
770,000
773,898
b
Gray
Media,
Inc.
,
Secured
Note,
144A,
9.625%,
7/15/32
..................
United
States
480,000
499,093
Senior
Bond,
144A,
5.375%,
11/15/31
..................
United
States
85,000
66,999
Senior
Secured
Note,
144A,
7.25%,
8/15/33
.............
United
States
415,000
428,824
b
McGraw-Hill
Education,
Inc.
,
Senior
Note,
144A,
8%,
8/01/29
......................
United
States
120,000
119,237
Senior
Secured
Note,
144A,
5.75%,
8/01/28
.............
United
States
65,000
64,955
Senior
Secured
Note,
144A,
7.375%,
9/01/31
............
United
States
90,000
92,040
b
Nexstar
Media,
Inc.
,
Senior
Note
,
144A,
4.75
%
,
11/01/28
......
United
States
240,000
238,967
Omnicom
Group,
Inc.
,
Senior
Note
,
2.4
%
,
3/01/31
...........
United
States
62,000
56,551
b
Outfront
Media
Capital
LLC
/
Outfront
Media
Capital
Corp.
,
Senior
Bond,
144A,
4.625%,
3/15/30
...................
United
States
45,000
44,181
Senior
Secured
Note,
144A,
7.375%,
2/15/31
............
United
States
40,000
42,079
Paramount
Global
,
Senior
Bond,
4.2%,
6/01/29
..........................
United
States
164,000
157,596
Senior
Note,
3.7%,
6/01/28
..........................
United
States
38,000
36,807
b
Sinclair
Television
Group,
Inc.
,
Senior
Secured
Note
,
144A,
8.125
%
,
2/15/33
...................................
United
States
900,000
937,800
Putnam
Asset
Allocation
Funds
Consolidated
Schedule
of
Investments
(unaudited)
Putnam
Multi-Asset
Income
Fund
Semiannual
Report
The
accompanying
notes
are
an
integral
part
of
these
consolidated
financial
statements.
a
a
Country
Principal
Amount
*
a
Value
a
a
a
a
a
Corporate
Bonds
(continued)
Media
(continued)
b
Sirius
XM
Radio
LLC
,
Senior
Bond
,
144A,
3.875
%
,
9/01/31
....
United
States
705,000
$
647,046
Time
Warner
Cable
Enterprises
LLC
,
Senior
Secured
Bond
,
8.375
%
,
7/15/33
...................................
United
States
575,000
672,631
b
Univision
Communications,
Inc.
,
Senior
Secured
Note
,
144A,
9.375
%
,
8/01/32
...................................
United
States
475,000
503,026
b
VZ
Secured
Financing
BV
,
Senior
Secured
Note
,
144A,
5
%
,
1/15/32
.........................................
Netherlands
685,000
609,451
8,997,272
Metals
&
Mining
0.5%
b
Big
River
Steel
LLC
/
BRS
Finance
Corp.
,
Senior
Secured
Note
,
144A,
6.625
%
,
1/31/29
..............................
United
States
70,000
70,431
b
Cleveland-Cliffs,
Inc.
,
Senior
Note,
144A,
7%,
3/15/32
......................
United
States
60,000
61,012
Senior
Note,
144A,
7.625%,
1/15/34
...................
United
States
565,000
580,222
Commercial
Metals
Co.
,
Senior
Bond
,
4.375
%
,
3/15/32
.......
United
States
490,000
469,764
b
Constellium
SE
,
Senior
Note
,
Reg
S,
3.125
%
,
7/15/29
........
United
States
100,000
EUR
117,903
b
First
Quantum
Minerals
Ltd.
,
Senior
Note
,
144A,
8
%
,
3/01/33
..
Zambia
290,000
309,971
b
Fortescue
Treasury
Pty.
Ltd.
,
Senior
Bond
,
144A,
6.125
%
,
4/15/32
.........................................
Australia
300,000
314,473
b
Glencore
Funding
LLC
,
Senior
Bond,
144A,
2.5%,
9/01/30
.....................
Australia
290,000
268,984
Senior
Bond,
144A,
5.634%,
4/04/34
...................
Australia
255,000
269,814
b
Hudbay
Minerals,
Inc.
,
Senior
Note
,
144A,
6.125
%
,
4/01/29
....
Canada
70,000
70,607
b
Mineral
Resources
Ltd.
,
Senior
Note
,
144A,
7
%
,
4/01/31
......
Australia
300,000
315,793
b
Novelis
Corp.
,
Senior
Bond,
144A,
4.75%,
1/30/30
....................
United
States
480,000
465,482
Senior
Bond,
144A,
3.875%,
8/15/31
...................
United
States
350,000
320,222
Senior
Note,
144A,
6.875%,
1/30/30
...................
United
States
250,000
258,204
Senior
Note,
144A,
6.375%,
8/15/33
...................
United
States
315,000
318,652
b
TMS
International
Corp.
,
Senior
Note
,
144A,
6.25
%
,
4/15/29
...
United
States
80,000
78,808
United
States
Steel
Corp.
,
Senior
Bond
,
6.65
%
,
6/01/37
......
United
States
35,000
36,838
4,327,180
Mortgage
Real
Estate
Investment
Trusts
(REITs)
0.0%
†
b
Apollo
Commercial
Real
Estate
Finance,
Inc.
,
Senior
Secured
Note
,
144A,
4.625
%
,
6/15/29
.........................
United
States
80,000
79,662
Multi-Utilities
0.1%
Ameren
Corp.
,
Senior
Note
,
5
%
,
1/15/29
..................
United
States
165,000
169,691
Consolidated
Edison
Co.
of
New
York,
Inc.
,
12-A
,
Senior
Bond
,
4.2
%
,
3/15/42
....................................
United
States
24,000
21,040
Dominion
Energy,
Inc.
,
Junior
Sub.
Bond
,
6.2%
to
2/14/36,
FRN
thereafter
,
2/15/56
.................................
United
States
315,000
320,814
DTE
Energy
Co.
,
Senior
Bond
,
5.85
%
,
6/01/34
.............
United
States
66,000
71,012
NiSource,
Inc.
,
Senior
Note
,
5.2
%
,
7/01/29
................
United
States
174,000
180,224
Puget
Sound
Energy,
Inc.
,
Senior
Bond
,
5.448
%
,
6/01/53
.....
United
States
299,000
293,744
Sempra,
Inc.
,
Senior
Bond
,
5.5
%
,
8/01/33
.................
United
States
65,000
68,588
Southern
Co.
Gas
Capital
Corp.
,
Senior
Bond
,
4.95
%
,
9/15/34
.
United
States
478,000
485,892
1,611,005
Oil,
Gas
&
Consumable
Fuels
1.9%
b
Aker
BP
ASA
,
Senior
Bond
,
144A,
5.8
%
,
10/01/54
...........
Norway
250,000
234,977
b
Calumet
Specialty
Products
Partners
LP
/
Calumet
Finance
Corp.
,
Senior
Note
,
144A,
9.75
%
,
2/15/31
.....................
United
States
180,000
191,887
Putnam
Asset
Allocation
Funds
Consolidated
Schedule
of
Investments
(unaudited)
Putnam
Multi-Asset
Income
Fund
The
accompanying
notes
are
an
integral
part
of
these
consolidated
financial
statements.
Semiannual
Report
a
a
Country
Principal
Amount
*
a
Value
a
a
a
a
a
Corporate
Bonds
(continued)
Oil,
Gas
&
Consumable
Fuels
(continued)
Canadian
Natural
Resources
Ltd.
,
Senior
Bond,
7.2%,
1/15/32
..........................
Canada
270,000
$
305,578
Senior
Note,
5%,
12/15/29
..........................
Canada
241,000
248,788
Cheniere
Energy
Partners
LP
,
Senior
Bond,
3.25%,
1/31/32
.........................
United
States
446,000
415,951
Senior
Note,
4.5%,
10/01/29
.........................
United
States
606,000
609,743
b
Columbia
Pipelines
Operating
Co.
LLC
,
Senior
Note
,
144A,
5.927
%
,
8/15/30
...................................
United
States
72,000
76,934
b
Coronado
Finance
Pty.
Ltd.
,
Senior
Secured
Note
,
144A,
9.25
%
,
10/01/29
........................................
Australia
335,000
310,761
b
Crescent
Energy
Finance
LLC
,
Senior
Note,
144A,
7.875%,
4/15/32
...................
United
States
310,000
315,994
Senior
Note,
144A,
7.375%,
1/15/33
...................
United
States
320,000
318,131
Senior
Note,
144A,
8.375%,
1/15/34
...................
United
States
310,000
320,641
b
DT
Midstream,
Inc.
,
Senior
Bond
,
144A,
5.8
%
,
12/15/34
......
United
States
149,000
157,154
Eastern
Energy
Gas
Holdings
LLC
,
Senior
Bond,
5.8%,
1/15/35
..........................
United
States
696,000
747,591
Senior
Bond,
5.65%,
10/15/54
........................
United
States
188,000
185,847
Enbridge,
Inc.
,
Senior
Bond
,
4.25
%
,
12/01/26
..............
Canada
64,000
64,090
Energy
Transfer
LP
,
h
B,
Junior
Sub.
Bond,
6.625%
to
2/14/28,
FRN
thereafter,
Perpetual
.......................................
United
States
904,000
916,332
Senior
Bond,
6.5%,
2/01/42
..........................
United
States
14,000
14,993
Senior
Note,
5.25%,
7/01/29
.........................
United
States
279,000
289,356
Senior
Note,
5.2%,
4/01/30
..........................
United
States
441,000
458,695
b
Expand
Energy
Corp.
,
Senior
Note
,
144A,
6.75
%
,
4/15/29
.....
United
States
175,000
175,511
b
Global
Partners
LP
/
GLP
Finance
Corp.
,
Senior
Note
,
144A,
7.125
%
,
7/01/33
...................................
United
States
130,000
134,754
b
Hess
Midstream
Operations
LP
,
Senior
Note,
144A,
6.5%,
6/01/29
.....................
United
States
305,000
315,746
Senior
Note,
144A,
4.25%,
2/15/30
....................
United
States
595,000
583,653
b
Hilcorp
Energy
I
LP
/
Hilcorp
Finance
Co.
,
Senior
Note
,
144A,
8.375
%
,
11/01/33
..................................
United
States
785,000
828,846
b
KazMunayGas
National
Co.
JSC
,
Senior
Bond,
Reg
S,
5.375%,
4/24/30
..................
Kazakhstan
200,000
206,094
Senior
Bond,
Reg
S,
6.375%,
10/24/48
.................
Kazakhstan
200,000
205,423
Kinder
Morgan,
Inc.
,
Senior
Bond
,
7.75
%
,
1/15/32
...........
United
States
547,000
643,281
b
Kinetik
Holdings
LP
,
Senior
Note
,
144A,
5.875
%
,
6/15/30
......
United
States
630,000
638,760
Occidental
Petroleum
Corp.
,
Senior
Bond,
7.5%,
5/01/31
..........................
United
States
144,000
164,056
Senior
Bond,
6.2%,
3/15/40
..........................
United
States
420,000
438,048
ONEOK,
Inc.
,
Senior
Note
,
4.75
%
,
10/15/31
...............
United
States
331,000
335,871
b
Pertamina
Hulu
Energi
PT
,
Senior
Note
,
144A,
5.25
%
,
5/21/30
.
Indonesia
200,000
204,119
SM
Energy
Co.
,
Senior
Bond
,
6.75
%
,
9/15/26
..............
United
States
65,000
65,100
South
Bow
USA
Infrastructure
Holdings
LLC
,
Senior
Note,
5.026%,
10/01/29
.......................
Canada
658,000
672,954
Senior
Note,
5.584%,
10/01/34
.......................
Canada
69,000
70,310
b
Sunoco
LP
,
Senior
Note,
144A,
5.375%,
7/15/31
...................
United
States
155,000
155,556
Senior
Note,
144A,
6.25%,
7/01/33
....................
United
States
560,000
577,061
Senior
Note,
144A,
5.625%,
7/15/34
...................
United
States
25,000
25,027
Targa
Resources
Corp.
,
Senior
Note
,
4.35
%
,
4/15/31
........
United
States
165,000
165,051
Targa
Resources
Partners
LP
/
Targa
Resources
Partners
Finance
Corp.
,
Senior
Bond,
5%,
1/15/28
...........................
United
States
201,000
201,117
Putnam
Asset
Allocation
Funds
Consolidated
Schedule
of
Investments
(unaudited)
Putnam
Multi-Asset
Income
Fund
Semiannual
Report
The
accompanying
notes
are
an
integral
part
of
these
consolidated
financial
statements.
a
a
Country
Principal
Amount
*
a
Value
a
a
a
a
a
Corporate
Bonds
(continued)
Oil,
Gas
&
Consumable
Fuels
(continued)
Targa
Resources
Partners
LP
/
Targa
Resources
Partners
Finance
Corp.,
(continued)
Senior
Bond,
4.875%,
2/01/31
........................
United
States
113,000
$
114,483
b
TGNR
Intermediate
Holdings
LLC
,
Senior
Note
,
144A,
5.5
%
,
10/15/29
........................................
United
States
105,000
103,948
b
Transcontinental
Gas
Pipe
Line
Co.
LLC
,
Senior
Bond
,
144A,
5.1
%
,
3/15/36
....................................
United
States
255,000
260,089
b
Venture
Global
Calcasieu
Pass
LLC
,
Senior
Secured
Note
,
144A,
6.25
%
,
1/15/30
...................................
United
States
695,000
718,141
b
Venture
Global
LNG,
Inc.
,
h
Junior
Sub.
Bond,
144A,
9%
to
9/29/29,
FRN
thereafter,
Perpetual
.......................................
United
States
350,000
306,359
Senior
Secured
Note,
144A,
9.5%,
2/01/29
..............
United
States
440,000
472,174
Senior
Secured
Note,
144A,
8.375%,
6/01/31
............
United
States
305,000
312,539
Senior
Secured
Note,
144A,
9.875%,
2/01/32
............
United
States
300,000
318,052
b
Venture
Global
Plaquemines
LNG
LLC
,
Senior
Secured
Bond,
144A,
7.75%,
5/01/35
.............
United
States
20,000
22,695
Senior
Secured
Bond,
144A,
6.75%,
1/15/36
.............
United
States
180,000
191,845
Senior
Secured
Note,
144A,
7.5%,
5/01/33
..............
United
States
285,000
316,296
Senior
Secured
Note,
144A,
6.5%,
1/15/34
..............
United
States
25,000
26,324
Viper
Energy
Partners
LLC
,
Senior
Bond,
5.7%,
8/01/35
..........................
United
States
227,000
235,621
Senior
Note,
4.9%,
8/01/30
..........................
United
States
219,000
223,556
Williams
Cos.,
Inc.
(The)
,
Senior
Bond
,
5.6
%
,
3/15/35
........
United
States
276,000
290,191
16,902,094
Paper
&
Forest
Products
0.1%
b
Georgia-Pacific
LLC
,
Senior
Note
,
144A,
4.95
%
,
6/30/32
......
United
States
421,000
437,586
b
Magnera
Corp.
,
Senior
Secured
Note,
144A,
4.75%,
11/15/29
............
United
States
200,000
185,984
Senior
Secured
Note,
144A,
7.25%,
11/15/31
............
United
States
190,000
186,168
809,738
Passenger
Airlines
0.3%
b
American
Airlines,
Inc.
/
AAdvantage
Loyalty
IP
Ltd.
,
Senior
Secured
Note,
144A,
5.5%,
4/20/26
..............
United
States
12,084
12,108
Senior
Secured
Note,
144A,
5.75%,
4/20/29
.............
United
States
825,000
834,889
b
AS
Mileage
Plan
IP
Ltd.
,
Senior
Secured
Note
,
144A,
5.021
%
,
10/20/29
........................................
United
States
735,000
747,644
b
OneSky
Flight
LLC
,
Senior
Note
,
144A,
8.875
%
,
12/15/29
.....
United
States
415,000
441,981
b
United
Airlines,
Inc.
,
Senior
Secured
Note
,
144A,
4.625
%
,
4/15/29
United
States
95,000
94,991
2,131,613
Personal
Care
Products
0.3%
b
Coty,
Inc.
/
HFC
Prestige
Products,
Inc.
/
HFC
Prestige
International
US
LLC
,
Senior
Note,
144A,
6.625%,
7/15/30
...................
United
States
310,000
314,309
Senior
Secured
Note,
144A,
4.75%,
1/15/29
.............
United
States
75,000
73,821
Kenvue,
Inc.
,
Senior
Note,
4.85%,
5/22/32
.........................
United
States
13,000
13,445
Senior
Note,
4.9%,
3/22/33
..........................
United
States
728,000
752,228
b
Opal
Bidco
SAS
,
Senior
Secured
Note
,
144A,
6.5
%
,
3/31/32
...
France
930,000
958,502
2,112,305
Pharmaceuticals
0.7%
Bristol-Myers
Squibb
Co.
,
Senior
Bond
,
4.125
%
,
6/15/39
......
United
States
645,000
593,214
Putnam
Asset
Allocation
Funds
Consolidated
Schedule
of
Investments
(unaudited)
Putnam
Multi-Asset
Income
Fund
The
accompanying
notes
are
an
integral
part
of
these
consolidated
financial
statements.
Semiannual
Report
a
a
Country
Principal
Amount
*
a
Value
a
a
a
a
a
Corporate
Bonds
(continued)
Pharmaceuticals
(continued)
Merck
&
Co.,
Inc.
,
Senior
Bond,
4.75%,
12/04/35
........................
United
States
170,000
$
171,613
Senior
Note,
4.45%,
12/04/32
........................
United
States
115,000
116,585
Novartis
Capital
Corp.
,
Senior
Note
,
4.1
%
,
11/05/30
.........
United
States
250,000
251,709
Pfizer
Investment
Enterprises
Pte.
Ltd.
,
Senior
Bond,
4.75%,
5/19/33
.........................
United
States
840,000
857,718
Senior
Bond,
5.3%,
5/19/53
..........................
United
States
90,000
86,233
Royalty
Pharma
plc
,
Senior
Bond,
5.4%,
9/02/34
..........................
United
States
253,000
262,192
Senior
Bond,
5.2%,
9/25/35
..........................
United
States
285,000
289,737
Senior
Note,
2.2%,
9/02/30
..........................
United
States
293,000
269,301
Teva
Pharmaceutical
Finance
Netherlands
III
BV
,
Senior
Bond,
4.1%,
10/01/46
.........................
Israel
345,000
265,396
Senior
Note,
6.75%,
3/01/28
.........................
Israel
230,000
238,857
Senior
Note,
8.125%,
9/15/31
........................
Israel
1,385,000
1,591,677
Wyeth
LLC
,
Senior
Bond
,
5.95
%
,
4/01/37
.................
United
States
6,000
6,565
Zoetis,
Inc.
,
Senior
Bond,
2%,
5/15/30
...........................
United
States
72,000
66,532
Senior
Bond,
5%,
8/17/35
...........................
United
States
817,000
833,776
5,901,105
Professional
Services
0.2%
b
CACI
International,
Inc.
,
Senior
Note
,
144A,
6.375
%
,
6/15/33
..
United
States
515,000
530,595
Paychex,
Inc.
,
Senior
Note
,
5.1
%
,
4/15/30
.................
United
States
490,000
500,531
1,031,126
Real
Estate
Management
&
Development
0.0%
†
b
Anywhere
Real
Estate
Group
LLC
/
Anywhere
Co-Issuer
Corp.
,
Secured
Note
,
144A,
7
%
,
4/15/30
.....................
United
States
51,000
51,592
Semiconductors
&
Semiconductor
Equipment
0.6%
Broadcom,
Inc.
,
Senior
Bond,
4.15%,
11/15/30
........................
United
States
465,000
466,625
Senior
Bond,
4.95%,
1/15/36
.........................
United
States
55,000
55,827
Senior
Bond,
5.7%,
1/15/56
..........................
United
States
460,000
472,700
b
Senior
Bond,
144A,
3.187%,
11/15/36
..................
United
States
66,000
56,962
b
Senior
Bond,
144A,
4.926%,
5/15/37
...................
United
States
465,000
465,314
Senior
Note,
5.05%,
7/12/29
.........................
United
States
251,000
259,745
b
Foundry
JV
Holdco
LLC
,
Senior
Secured
Bond,
144A,
6.4%,
1/25/38
..............
United
States
400,000
435,483
Senior
Secured
Note,
144A,
5.5%,
1/25/31
..............
United
States
400,000
417,675
Senior
Secured
Note,
144A,
5.9%,
1/25/33
..............
United
States
600,000
636,282
Intel
Corp.
,
Senior
Bond
,
4.15
%
,
8/05/32
..................
United
States
610,000
596,974
Marvell
Technology,
Inc.
,
Senior
Note,
5.75%,
2/15/29
.........................
United
States
135,000
141,143
Senior
Note,
4.75%,
7/15/30
.........................
United
States
40,000
40,790
Senior
Note,
5.95%,
9/15/33
.........................
United
States
130,000
139,714
b
Qnity
Electronics,
Inc.
,
Senior
Note,
144A,
6.25%,
8/15/33
....................
United
States
385,000
400,226
Senior
Secured
Note,
144A,
5.75%,
8/15/32
.............
United
States
520,000
532,697
5,118,157
Software
0.3%
b
Cloud
Software
Group,
Inc.
,
Secured
Note,
144A,
9%,
9/30/29
.....................
United
States
40,000
39,214
Putnam
Asset
Allocation
Funds
Consolidated
Schedule
of
Investments
(unaudited)
Putnam
Multi-Asset
Income
Fund
Semiannual
Report
The
accompanying
notes
are
an
integral
part
of
these
consolidated
financial
statements.
a
a
Country
Principal
Amount
*
a
Value
a
a
a
a
a
Corporate
Bonds
(continued)
Software
(continued)
b
Cloud
Software
Group,
Inc.,
(continued)
Senior
Secured
Note,
144A,
6.5%,
3/31/29
..............
United
States
60,000
$
58,893
b
McAfee
Corp.
,
Senior
Note
,
144A,
7.375
%
,
2/15/30
..........
United
States
95,000
77,842
Oracle
Corp.
,
Senior
Bond,
5.7%,
2/04/36
..........................
United
States
130,000
130,121
Senior
Bond,
3.65%,
3/25/41
.........................
United
States
768,000
570,919
Senior
Bond,
6.7%,
2/04/56
..........................
United
States
45,000
43,667
Senior
Note,
4.45%,
9/26/30
.........................
United
States
590,000
578,825
Senior
Note,
4.8%,
9/26/32
..........................
United
States
620,000
606,060
b
Rocket
Software,
Inc.
,
Senior
Note
,
144A,
6.5
%
,
2/15/29
......
United
States
65,000
54,485
ServiceNow,
Inc.
,
Senior
Bond
,
1.4
%
,
9/01/30
..............
United
States
176,000
155,963
Synopsys,
Inc.
,
Senior
Bond,
5.15%,
4/01/35
.........................
United
States
843,000
863,712
Senior
Bond,
5.7%,
4/01/55
..........................
United
States
8,000
8,001
b
UKG,
Inc.
,
Senior
Secured
Note
,
144A,
6.875
%
,
2/01/31
......
United
States
90,000
87,376
3,275,078
Specialized
REITs
0.5%
American
Tower
Corp.
,
Senior
Bond,
3.125%,
1/15/27
........................
United
States
251,000
249,110
Senior
Bond,
2.9%,
1/15/30
..........................
United
States
511,000
488,444
Senior
Bond,
2.7%,
4/15/31
..........................
United
States
502,000
466,547
Senior
Note,
4.7%,
12/15/32
.........................
United
States
45,000
45,530
Crown
Castle,
Inc.
,
Senior
Bond,
3.65%,
9/01/27
.........................
United
States
82,000
81,637
Senior
Bond,
3.8%,
2/15/28
..........................
United
States
69,000
68,739
Senior
Bond,
4.75%,
5/15/47
.........................
United
States
27,000
23,847
Senior
Note,
4.9%,
9/01/29
..........................
United
States
1,005,000
1,025,199
EPR
Properties
,
Senior
Bond
,
4.5
%
,
6/01/27
...............
United
States
43,000
43,094
Equinix,
Inc.
,
Senior
Bond
,
3.2
%
,
11/18/29
................
United
States
220,000
212,708
b
Iron
Mountain,
Inc.
,
Senior
Note
,
144A,
6.25
%
,
1/15/33
.......
United
States
755,000
771,967
b
Millrose
Properties,
Inc.
,
Senior
Note
,
144A,
6.375
%
,
8/01/30
..
United
States
755,000
775,008
4,251,830
Specialty
Retail
0.2%
Bath
&
Body
Works,
Inc.
,
Senior
Bond
,
6.875
%
,
11/01/35
.....
United
States
95,000
96,882
Dick's
Sporting
Goods,
Inc.
,
Senior
Bond,
3.15%,
1/15/32
.........................
United
States
274,000
254,962
Senior
Bond,
4.1%,
1/15/52
..........................
United
States
350,000
255,310
b
PetSmart
LLC
/
PetSmart
Finance
Corp.
,
Senior
Secured
Note
,
144A,
7.5
%
,
9/15/32
...............................
United
States
390,000
394,926
1,002,080
Technology
Hardware,
Storage
&
Peripherals
0.2%
Hewlett
Packard
Enterprise
Co.
,
Senior
Note,
4.55%,
10/15/29
........................
United
States
493,000
499,006
Senior
Note,
4.85%,
10/15/31
........................
United
States
83,000
84,196
b
Seagate
Data
Storage
Technology
Pte.
Ltd.
,
Senior
Note,
144A,
3.125%,
7/15/29
...................
United
States
30,000
26,865
Senior
Note,
144A,
5.875%,
7/15/30
...................
United
States
500,000
515,032
1,125,099
Putnam
Asset
Allocation
Funds
Consolidated
Schedule
of
Investments
(unaudited)
Putnam
Multi-Asset
Income
Fund
The
accompanying
notes
are
an
integral
part
of
these
consolidated
financial
statements.
Semiannual
Report
a
a
Country
Principal
Amount
*
a
Value
a
a
a
a
a
Corporate
Bonds
(continued)
Textiles,
Apparel
&
Luxury
Goods
0.2%
b
Beach
Acquisition
Bidco
LLC
,
g
Senior
Note,
144A,
PIK,
10%,
7/15/33
..................
United
States
650,809
$
716,785
Senior
Secured
Note,
144A,
5.25%,
7/15/32
.............
United
States
100,000
EUR
121,507
b
Crocs,
Inc.
,
Senior
Note
,
144A,
4.25
%
,
3/15/29
.............
United
States
255,000
248,652
Tapestry,
Inc.
,
Senior
Bond,
3.05%,
3/15/32
.........................
United
States
214,000
199,200
Senior
Bond,
5.5%,
3/11/35
..........................
United
States
96,000
99,612
Senior
Note,
5.1%,
3/11/30
..........................
United
States
244,000
251,989
1,637,745
Tobacco
0.4%
BAT
Capital
Corp.
,
Senior
Bond,
4.39%,
8/15/37
.........................
United
Kingdom
503,000
470,009
Senior
Note,
4.625%,
3/22/33
........................
United
Kingdom
1,140,000
1,145,129
Philip
Morris
International,
Inc.
,
Senior
Note,
5.125%,
2/15/30
........................
United
States
1,128,000
1,172,275
Senior
Note,
4.375%,
4/30/30
........................
United
States
90,000
91,189
Senior
Note,
4.75%,
11/01/31
........................
United
States
94,000
96,702
2,975,304
Trading
Companies
&
Distributors
0.4%
b
Aviation
Capital
Group
LLC
,
Senior
Note,
144A,
5.375%,
7/15/29
...................
United
States
156,000
161,178
Senior
Note,
144A,
5.125%,
4/10/30
...................
United
States
635,000
652,807
b
Boise
Cascade
Co.
,
Senior
Note
,
144A,
4.875
%
,
7/01/30
.....
United
States
490,000
490,128
b
EquipmentShare.com,
Inc.
,
Secured
Note,
144A,
9%,
5/15/28
.....................
United
States
420,000
440,443
Secured
Note,
144A,
8.625%,
5/15/32
..................
United
States
295,000
315,913
b
Herc
Holdings,
Inc.
,
Senior
Note
,
144A,
6.625
%
,
6/15/29
......
United
States
40,000
41,319
b
Imola
Merger
Corp.
,
Senior
Secured
Note
,
144A,
4.75
%
,
5/15/29
United
States
75,000
73,784
b
QXO
Building
Products,
Inc.
,
Senior
Secured
Note
,
144A,
6.75
%
,
4/30/32
.........................................
United
States
605,000
627,147
b
United
Rentals
North
America,
Inc.
,
Senior
Bond
,
144A,
6.125
%
,
3/15/34
.........................................
United
States
240,000
251,720
b
WESCO
Distribution,
Inc.
,
Senior
Note,
144A,
6.375%,
3/15/29
...................
United
States
20,000
20,586
Senior
Note,
144A,
6.625%,
3/15/32
...................
United
States
80,000
83,321
Senior
Note,
144A,
6.375%,
3/15/33
...................
United
States
30,000
31,299
3,189,645
Wireless
Telecommunication
Services
0.6%
b
Connect
Finco
SARL
/
Connect
US
Finco
LLC
,
Senior
Secured
Note
,
144A,
9
%
,
9/15/29
............................
United
Kingdom
200,000
212,485
b
Digicel
International
Finance
Ltd.
/
DIFL
US
LLC
,
Senior
Secured
Note
,
144A,
8.625
%
,
8/01/32
.........................
Bermuda
260,000
270,357
Rogers
Communications,
Inc.
,
Senior
Note,
3.8%,
3/15/32
..........................
Canada
1,488,000
1,424,757
Sub.
Bond,
7.125%
to
4/14/35,
FRN
thereafter,
4/15/55
.....
Canada
90,000
95,365
NC5,
Sub.
Bond,
7%
to
4/14/30,
FRN
thereafter,
4/15/55
....
Canada
185,000
193,589
T-Mobile
USA,
Inc.
,
Senior
Bond,
2.875%,
2/15/31
........................
United
States
65,000
61,049
Senior
Bond,
5.05%,
7/15/33
.........................
United
States
38,000
39,210
Senior
Bond,
5%,
2/15/36
...........................
United
States
710,000
714,831
Senior
Note,
3.375%,
4/15/29
........................
United
States
138,000
135,527
Senior
Note,
3.875%,
4/15/30
........................
United
States
8,000
7,940
Senior
Note,
5.125%,
5/15/32
........................
United
States
575,000
597,453
Putnam
Asset
Allocation
Funds
Consolidated
Schedule
of
Investments
(unaudited)
Putnam
Multi-Asset
Income
Fund
Semiannual
Report
The
accompanying
notes
are
an
integral
part
of
these
consolidated
financial
statements.
a
a
Country
Principal
Amount
*
a
Value
a
a
a
a
a
Corporate
Bonds
(continued)
Wireless
Telecommunication
Services
(continued)
T-Mobile
USA,
Inc.,
(continued)
Senior
Note,
6.7%,
12/15/33
.........................
United
States
612,000
$
692,837
b
Zegona
Finance
plc
,
Senior
Secured
Note
,
144A,
8.625
%
,
7/15/29
.........................................
United
Kingdom
530,000
561,267
5,006,667
Total
Corporate
Bonds
(Cost
$228,462,773)
...................................
230,398,353
j
Senior
Floating
Rate
Interests
0.4%
Automobile
Components
0.0%
†
k
DexKo
Global,
Inc.,
First
Lien,
Closing
Date
Dollar
CME
Term
Loan,
7.678%,
(3-month
SOFR
+
3.75%),
10/04/28
........
United
States
44,385
44,265
k
Chemicals
0.0%
†
Hexion
Holdings
Corp.,
Second
Lien,
Initial
CME
Term
Loan,
11.211%,
(1-month
SOFR
+
7.438%),
3/15/30
............
United
States
18,926
17,885
Nouryon
Finance
BV,
First
Lien,
November
2024
Dollar
CME
Term
Loan,
B1,
7.036%,
(3-month
SOFR
+
3.25%),
4/03/28
..
Netherlands
33,449
33,501
Nouryon
Finance
BV,
First
Lien,
November
2024
Dollar
CME
Term
Loan,
B2,
6.917%,
(3-month
SOFR
+
3.25%),
4/03/28
..
Netherlands
34,304
34,144
85,530
a
a
a
a
a
a
Commercial
Services
&
Supplies
0.0%
†
k
Filtration
Group
Corp.,
First
Lien,
2025
Incremental
Dollar
CME
Term
Loan,
B,
6.423%,
(1-month
SOFR
+
2.75%),
10/23/28
..
United
States
28,656
28,722
k
Containers
&
Packaging
0.0%
†
g
Kleopatra
Finco
SARL,
First
Lien,
Debtor-In-Possession
Roll-Up
Term
Loan,
PIK,
6.675%,
(1-month
SOFR
+
3%),
8/07/26
....
Luxembourg
23,541
21,226
Kleopatra
Finco
SARL,
First
Lien,
Initial
USD
Debtor-In-
Possession
Term
Loan,
6.675%,
(1-month
SOFR
+
3%),
8/07/26
.........................................
Luxembourg
15,647
14,108
l
Klockner
Pentaplast
of
America,
Inc.,
First
Lien,
USD
Term
Loan,
B,
9.044%,
(6-month
SOFR
+
4.75%),
3/12/26
............
Luxembourg
48,852
7,878
f
Mauser
Packaging
Solutions
Holding
Co.,
First
Lien,
2025
CME
Term
Loan,
7.164%,
(3-month
SOFR
+
3.5%),
4/15/30
......
United
States
260,000
256,303
299,515
a
a
a
a
a
a
Distributors
0.1%
f,k
Verde
Purchaser
LLC,
First
Lien,
Second
Refinancing
CME
Term
Loan,
7.672%,
(3-month
SOFR
+
4%),
11/30/30
...........
United
States
452,563
449,763
k
Food
Products
0.2%
f
Froneri
US,
Inc.,
First
Lien,
CME
Term
Loan,
B6,
5.877%,
(6-month
SOFR
+
2.25%),
9/30/32
.....................
United
States
370,157
362,291
f
TreeHouse
Foods,
Inc.,
First
Lien,
CME
Term
Loan,
B,
7.667%,
(12-month
SOFR
+
4.25%),
2/11/33
....................
United
States
557,500
550,763
913,054
a
a
a
a
a
a
k
Health
Care
Equipment
&
Supplies
0.0%
†
Bausch
+
Lomb
Corp.,
First
Lien,
2025-2
Refinancing
CME
Term
Loan,
7.423%,
(1-month
SOFR
+
3.75%),
1/15/31
.........
United
States
61,111
61,249
Medline
Borrower
LP,
First
Lien,
2028
Refinancing
CME
Term
Loan,
5.423%,
(1-month
SOFR
+
1.75%),
10/23/28
........
United
States
7,462
7,481
68,730
a
a
a
a
a
a
Putnam
Asset
Allocation
Funds
Consolidated
Schedule
of
Investments
(unaudited)
Putnam
Multi-Asset
Income
Fund
The
accompanying
notes
are
an
integral
part
of
these
consolidated
financial
statements.
Semiannual
Report
a
a
Country
Principal
Amount
*
a
Value
a
a
a
a
a
j
Senior
Floating
Rate
Interests
(continued)
k
Hotels,
Restaurants
&
Leisure
0.0%
†
f
Fertitta
Entertainment
LLC,
First
Lien,
Initial
CME
Term
Loan,
B,
6.923%,
(1-month
SOFR
+
3.25%),
1/29/29
..............
United
States
363,546
$
362,217
Scientific
Games
Holdings
LP,
First
Lien,
2024
Refinancing
Dollar
CME
Term
Loan,
6.652%,
(3-month
SOFR
+
3%),
4/04/29
...
United
States
34,475
33,852
396,069
a
a
a
a
a
a
IT
Services
0.0%
†
k
Fortress
Intermediate
3,
Inc.,
First
Lien,
CME
Term
Loan,
B,
6.668%,
(1-month
SOFR
+
3%),
6/27/31
................
United
States
54,451
53,090
k
Media
0.0%
†
Clear
Channel
Outdoor
Holdings,
Inc.,
First
Lien,
2024
Refinancing
CME
Term
Loan,
7.787%,
(1-month
SOFR
+
4%),
8/23/28
.........................................
United
States
54,606
54,913
DIRECTV
Financing
LLC,
First
Lien,
2024
Refinancing
CME
Term
Loan,
B,
9.178%,
(3-month
SOFR
+
5.25%),
8/02/29
.......
United
States
79,100
79,297
134,210
a
a
a
a
a
a
Mortgage
Real
Estate
Investment
Trusts
(REITs)
0.0%
†
k
Apollo
Commercial
Real
Estate
Finance,
Inc.,
First
Lien,
Initial
CME
Term
Loan,
6.917%,
(1-month
SOFR
+
3.25%),
6/13/30
.
United
States
8,955
8,976
k
Pharmaceuticals
0.1%
f
1261229
BC
Ltd.,
First
Lien,
Initial
CME
Term
Loan,
9.923%,
(1-month
SOFR
+
6.25%),
10/08/30
....................
United
States
1,059,775
1,035,930
Endo
Finance
Holdings
LP,
First
Lien,
2024
Refinancing
CME
Term
Loan,
7.423%,
(1-month
SOFR
+
3.75%),
4/23/31
.....
United
States
79,988
80,177
1,116,107
a
a
a
a
a
a
k
Software
0.0%
†
Rocket
Software,
Inc.,
First
Lien,
CME
Term
Loan,
7.423%,
(1-month
SOFR
+
3.75%),
11/28/28
....................
United
States
56,007
52,250
UKG,
Inc.,
First
Lien,
Initial
CME
Term
Loan,
6.167%,
(3-month
SOFR
+
2.5%),
2/10/31
.............................
United
States
9,875
9,374
61,624
a
a
a
a
a
a
Specialty
Retail
0.0%
†
k
White
Cap
Supply
Holdings
LLC,
First
Lien,
CME
Term
Loan,
C,
6.923%,
(1-month
SOFR
+
3.25%),
10/19/29
.............
United
States
97,628
96,713
Textiles,
Apparel
&
Luxury
Goods
0.0%
†
k
Flash
Charm,
Inc.,
First
Lien,
CME
Term
Loan,
B2,
7.16%,
(3-month
SOFR
+
3.5%),
3/02/28
......................
United
States
59,097
47,573
Wireless
Telecommunication
Services
0.0%
†
k
Connect
Finco
SARL,
First
Lien,
Amendment
No.
4
CME
Term
Loan,
8.173%,
(1-month
SOFR
+
4.5%),
9/13/29
..........
United
Kingdom
44,213
44,240
Total
Senior
Floating
Rate
Interests
(Cost
$3,886,161)
.........................
3,848,181
Foreign
Government
and
Agency
Securities
3.5%
b
Angola
Government
Bond
,
Senior
Bond,
144A,
9.375%,
5/08/48
...................
Angola
200,000
181,659
Senior
Bond,
Reg
S,
8.75%,
4/14/32
...................
Angola
440,000
432,213
Argentina
Government
Bond
,
Senior
Bond,
4.125%,
7/09/35
........................
Argentina
880,000
665,544
Senior
Note,
0.75%,
7/09/30
.........................
Argentina
237,600
201,960
Putnam
Asset
Allocation
Funds
Consolidated
Schedule
of
Investments
(unaudited)
Putnam
Multi-Asset
Income
Fund
Semiannual
Report
The
accompanying
notes
are
an
integral
part
of
these
consolidated
financial
statements.
a
a
Country
Principal
Amount
*
a
Value
a
a
a
a
a
Foreign
Government
and
Agency
Securities
(continued)
b
Argentina
Provincia
de
Cordoba
,
Senior
Note
,
144A,
8.6
%
,
2/03/35
.........................................
Argentina
170,000
$
165,702
b
Bahrain
Government
Bond
,
Senior
Bond
,
Reg
S,
7.375
%
,
5/14/30
Bahrain
410,000
431,514
b
Benin
Government
Bond
,
Senior
Bond,
144A,
7.96%,
2/13/38
....................
Benin
230,000
242,614
Senior
Bond,
144A,
8.375%,
1/23/41
...................
Benin
200,000
214,105
Brazil
Government
Bond
,
Senior
Bond,
4.5%,
5/30/29
..........................
Brazil
410,000
408,811
Senior
Bond,
6.125%,
3/15/34
........................
Brazil
660,000
677,886
Senior
Bond,
4.75%,
1/14/50
.........................
Brazil
550,000
413,517
b
Bulgaria
Government
Bond
,
Senior
Bond
,
Reg
S,
5
%
,
3/05/37
..
Bulgaria
230,000
232,836
Chile
Government
Bond
,
Senior
Bond,
5.65%,
1/13/37
.........................
Chile
480,000
515,232
Senior
Bond,
4.34%,
3/07/42
.........................
Chile
370,000
339,789
Colombia
Government
Bond
,
Senior
Bond,
8%,
11/14/35
...........................
Colombia
310,000
331,173
Senior
Bond,
5%,
6/15/45
...........................
Colombia
450,000
332,011
Senior
Note,
7.375%,
4/25/30
.........................
Colombia
410,000
432,365
b
Comision
Federal
de
Electricidad
,
Senior
Bond
,
Reg
S,
3.875
%
,
7/26/33
.........................................
Mexico
200,000
179,175
b
Costa
Rica
Government
Bond
,
Senior
Bond,
144A,
6.55%,
4/03/34
....................
Costa
Rica
400,000
436,146
Senior
Bond,
Reg
S,
7.158%,
3/12/45
..................
Costa
Rica
200,000
224,686
b
Dominican
Republic
Government
Bond
,
Senior
Bond,
Reg
S,
4.5%,
1/30/30
....................
Dominican
Republic
380,000
372,457
Senior
Bond,
Reg
S,
4.875%,
9/23/32
..................
Dominican
Republic
520,000
501,525
Senior
Bond,
Reg
S,
7.45%,
4/30/44
...................
Dominican
Republic
100,000
111,100
Senior
Bond,
Reg
S,
6.85%,
1/27/45
...................
Dominican
Republic
160,000
167,691
b
Eagle
Funding
Luxco
SARL
,
Senior
Note
,
144A,
5.5
%
,
8/17/30
.
Mexico
250,000
254,660
Ecopetrol
SA
,
Senior
Bond
,
4.625
%
,
11/02/31
..............
Colombia
260,000
233,112
b
Ecuador
Government
Bond
,
Senior
Bond,
Reg
S,
6.9%,
7/31/35
....................
Ecuador
130,575
118,823
Senior
Bond,
Reg
S,
6.9%,
7/31/35
....................
Ecuador
169,425
154,177
b
Egypt
Government
Bond
,
Senior
Bond,
Reg
S,
7.6%,
3/01/29
....................
Egypt
200,000
210,898
Senior
Bond,
Reg
S,
7.053%,
1/15/32
..................
Egypt
300,000
302,396
Senior
Bond,
Reg
S,
7.3%,
9/30/33
....................
Egypt
490,000
493,507
Senior
Note,
144A,
8.625%,
2/04/30
....................
Egypt
200,000
217,401
b
El
Salvador
Government
Bond
,
Senior
Bond,
144A,
7.65%,
6/15/35
....................
El
Salvador
330,000
341,550
Senior
Bond,
Reg
S,
8.625%,
2/28/29
..................
El
Salvador
210,000
226,537
b
Empresa
Nacional
del
Petroleo
,
Senior
Bond
,
144A,
5.95
%
,
7/30/34
.........................................
Chile
200,000
210,517
b
Eskom
Holdings
SOC
Ltd.
,
Senior
Bond
,
Reg
S,
6.35
%
,
8/10/28
South
Africa
200,000
206,785
b
Gabon
Government
Bond
,
Senior
Bond
,
Reg
S,
6.625
%
,
2/06/31
Gabon
200,000
166,198
Ghana
Government
Bond
,
b
Senior
Bond,
144A,
5%,
7/03/35
.......................
Ghana
370,000
336,367
b
Guatemala
Government
Bond
,
Senior
Bond,
Reg
S,
6.6%,
6/13/36
....................
Guatemala
600,000
652,926
Senior
Note,
144A,
7.05%,
10/04/32
....................
Guatemala
490,000
544,089
b
Honduras
Government
Bond
,
Senior
Bond
,
Reg
S,
6.25
%
,
1/19/27
.........................................
Honduras
150,000
152,070
b
Hungary
Government
Bond
,
Senior
Note
,
Reg
S,
5.25
%
,
6/16/29
Hungary
600,000
616,850
Putnam
Asset
Allocation
Funds
Consolidated
Schedule
of
Investments
(unaudited)
Putnam
Multi-Asset
Income
Fund
The
accompanying
notes
are
an
integral
part
of
these
consolidated
financial
statements.
Semiannual
Report
a
a
Country
Principal
Amount
*
a
Value
a
a
a
a
a
Foreign
Government
and
Agency
Securities
(continued)
Indonesia
Government
Bond
,
Senior
Bond,
4.65%,
9/20/32
.........................
Indonesia
390,000
$
393,258
b
Senior
Bond,
Reg
S,
7.75%,
1/17/38
...................
Indonesia
380,000
472,276
b
Iraq
Government
Bond
,
Senior
Bond
,
Reg
S,
5.8
%
,
1/15/28
....
Iraq
137,500
136,945
b
Istanbul
Metropolitan
Municipality
,
Senior
Note
,
Reg
S,
10.5
%
,
12/06/28
........................................
Turkiye
200,000
221,008
b
Ivory
Coast
Government
Bond
,
Senior
Bond
,
Reg
S,
6.125
%
,
6/15/33
.........................................
Ivory
Coast
1,020,000
1,017,537
Jamaica
Government
Bond
,
Senior
Bond
,
8
%
,
3/15/39
.......
Bermuda
170,000
206,606
b
Jordan
Government
Bond
,
Senior
Bond
,
Reg
S,
5.85
%
,
7/07/30
Jordan
270,000
272,004
Mexico
Government
Bond
,
Senior
Bond,
4.875%,
5/19/33
........................
Mexico
200,000
194,460
Senior
Bond,
4.28%,
8/14/41
.........................
Mexico
380,000
310,194
Senior
Bond,
5%,
4/27/51
...........................
Mexico
200,000
163,780
Senior
Bond,
6.338%,
5/04/53
........................
Mexico
200,000
194,630
b
Montenegro
Government
Bond
,
Senior
Note
,
Reg
S,
7.25
%
,
3/12/31
.........................................
Montenegro
400,000
429,144
b
Morocco
Government
Bond
,
Senior
Bond
,
Reg
S,
5.5
%
,
12/11/42
Morocco
210,000
204,341
b
Nigeria
Government
Bond
,
Senior
Bond,
144A,
8.631%,
1/13/36
...................
Nigeria
680,000
732,032
Senior
Bond,
Reg
S,
6.5%,
11/28/27
...................
Nigeria
400,000
406,431
b
Oman
Government
Bond
,
Senior
Bond,
Reg
S,
6%,
8/01/29
......................
Oman
290,000
304,845
Senior
Bond,
Reg
S,
7.375%,
10/28/32
.................
Oman
300,000
345,344
Senior
Bond,
Reg
S,
6.5%,
3/08/47
....................
Oman
250,000
271,473
Panama
Government
Bond
,
Senior
Bond,
6.4%,
2/14/35
..........................
Panama
420,000
449,358
Senior
Bond,
3.87%,
7/23/60
.........................
Panama
200,000
139,460
b
Paraguay
Government
Bond
,
Senior
Bond,
Reg
S,
4.95%,
4/28/31
...................
Paraguay
400,000
407,705
Senior
Bond,
Reg
S,
3.849%,
6/28/33
..................
Paraguay
240,000
229,333
Peru
Government
Bond
,
Senior
Bond,
2.783%,
1/23/31
........................
Peru
740,000
689,902
b
Perusahaan
Perseroan
Persero
PT
Perusahaan
Listrik
Negara
,
Senior
Bond
,
Reg
S,
5.45
%
,
5/21/28
...................
Indonesia
200,000
204,518
Petroleos
Mexicanos
,
Senior
Bond,
5.95%,
1/28/31
.........................
Mexico
310,000
303,996
Senior
Bond,
6.75%,
9/21/47
.........................
Mexico
30,000
24,972
Senior
Note,
10%,
2/07/33
...........................
Mexico
230,000
269,422
Philippines
Government
Bond
,
Senior
Bond,
3.75%,
1/14/29
.........................
Philippines
520,000
517,362
Senior
Bond,
4.2%,
3/29/47
..........................
Philippines
280,000
236,487
b
Romania
Government
Bond
,
Senior
Bond,
144A,
3%,
2/14/31
.......................
Romania
450,000
415,180
Senior
Bond,
144A,
7.125%,
1/17/33
...................
Romania
310,000
344,004
Senior
Bond,
Reg
S,
6.125%,
1/22/44
..................
Romania
380,000
380,378
b
Saudi
Arabia
Government
Bond
,
Senior
Bond
,
Reg
S,
4.5
%
,
10/26/46
........................................
Saudi
Arabia
510,000
440,063
b
Serbia
Government
Bond
,
Senior
Bond,
144A,
6.5%,
9/26/33
.....................
Serbia
200,000
218,928
Senior
Note,
Reg
S,
6.25%,
5/26/28
....................
Serbia
200,000
208,763
South
Africa
Government
Bond
,
Senior
Bond,
5.875%,
4/20/32
........................
South
Africa
200,000
206,959
Senior
Bond,
5%,
10/12/46
...........................
South
Africa
430,000
336,630
Senior
Bond,
7.3%,
4/20/52
..........................
South
Africa
200,000
202,895
b
Suriname
Government
Bond
,
Senior
Bond
,
144A,
8.5
%
,
11/06/35
Suriname
470,000
500,256
Putnam
Asset
Allocation
Funds
Consolidated
Schedule
of
Investments
(unaudited)
Putnam
Multi-Asset
Income
Fund
Semiannual
Report
The
accompanying
notes
are
an
integral
part
of
these
consolidated
financial
statements.
a
a
Country
Principal
Amount
*
a
Value
a
a
a
a
a
Foreign
Government
and
Agency
Securities
(continued)
Turkiye
Government
Bond
,
Senior
Bond,
7.625%,
5/15/34
........................
Turkiye
410,000
$
440,309
Senior
Note,
8.6%,
9/24/27
..........................
Turkiye
200,000
212,526
Senior
Note,
9.125%,
7/13/30
.........................
Turkiye
390,000
442,517
b
Ukraine
Government
Bond
,
Senior
Bond,
144A,
2/01/35
..........................
Ukraine
30,270
17,358
Senior
Bond,
144A,
4.5%,
2/01/35
.....................
Ukraine
160,000
98,093
Senior
Bond,
144A,
2/01/36
..........................
Ukraine
25,225
14,420
Senior
Bond,
144A,
4.5%,
2/01/36
.....................
Ukraine
190,000
115,024
Senior
Note,
144A,
2/01/30
..........................
Ukraine
9,585
6,224
Senior
Note,
144A,
2/01/34
..........................
Ukraine
35,820
17,678
Senior
Note,
144A,
4.5%,
2/01/34
.....................
Ukraine
110,000
68,724
b
United
Arab
Emirates
Government
Bond
,
Senior
Bond
,
144A,
2.875
%
,
10/19/41
..................................
United
Arab
Emirates
570,000
443,485
Uruguay
Government
Bond
,
Senior
Bond,
7.875%,
1/15/33
........................
Uruguay
400,000
479,200
Senior
Bond,
5.1%,
6/18/50
..........................
Uruguay
60,000
57,759
b
Uzbekistan
Government
Bond
,
Senior
Note
,
Reg
S,
6.9
%
,
2/28/32
.........................................
Uzbekistan
520,000
563,624
b,l
Venezuela
Government
Bond
,
Senior
Bond,
Reg
S,
6%,
12/09/20
.....................
Venezuela
760,000
269,116
Senior
Bond,
Reg
S,
7.65%,
4/21/25
...................
Venezuela
690,000
268,134
Total
Foreign
Government
and
Agency
Securities
(Cost
$29,499,011)
............
30,167,644
U.S.
Government
and
Agency
Securities
2.8%
U.S.
Treasury
Bonds
,
4.25%,
11/15/40
..................................
United
States
2,360,000
2,338,428
m
2.75%,
8/15/42
...................................
United
States
5,000,000
3,990,039
3%,
2/15/49
.....................................
United
States
5,000,000
3,823,828
2%,
8/15/51
.....................................
United
States
1,370,000
819,806
2.875%,
5/15/52
..................................
United
States
220,000
159,921
3.625%,
2/15/53
..................................
United
States
470,000
394,709
U.S.
Treasury
Notes
,
2.75%,
2/15/28
...................................
United
States
2,080,000
2,055,381
1.25%,
9/30/28
...................................
United
States
2,100,000
1,990,119
2.375%,
3/31/29
..................................
United
States
1,160,000
1,125,472
1.5%,
2/15/30
....................................
United
States
90,000
83,584
2.75%,
8/15/32
...................................
United
States
660,000
624,899
3.375%,
5/15/33
..................................
United
States
2,770,000
2,705,998
3.875%,
8/15/33
..................................
United
States
1,650,000
1,662,182
4.375%,
5/15/34
..................................
United
States
1,180,000
1,225,310
4.25%,
11/15/34
..................................
United
States
830,000
852,873
Total
U.S.
Government
and
Agency
Securities
(Cost
$24,090,757)
...............
23,852,549
Asset-Backed
Securities
1.7%
Automobiles
0.0%
†
k
Volkswagen
Auto
Loan
Enhanced
Trust
,
2025-2
,
A2B
,
FRN
,
4.032
%
,
(
30-day
SOFR
Average
+
0.37
%
),
8/21/28
.
........
United
States
232,000
232,271
Banks
0.1%
Capital
One
Multi-Asset
Execution
Trust
,
2023-A1
,
A
,
4.42
%
,
5/15/28
.
.........................................
United
States
625,000
625,778
Capital
Markets
0.1%
b,k
Magnetite
XL
Ltd.
,
2024-40A
,
A1
,
144A,
FRN
,
5.122
%
,
(
3-month
SOFR
+
1.45
%
),
7/15/37
.
............................
United
States
500,000
501,625
Putnam
Asset
Allocation
Funds
Consolidated
Schedule
of
Investments
(unaudited)
Putnam
Multi-Asset
Income
Fund
The
accompanying
notes
are
an
integral
part
of
these
consolidated
financial
statements.
Semiannual
Report
a
a
Country
Principal
Amount
*
a
Value
a
a
a
a
a
Asset-Backed
Securities
(continued)
Consumer
Finance
0.2%
Capital
One
Prime
Auto
Receivables
Trust
,
2025-1
,
A3
,
3.85
%
,
7/15/30
.
.........................................
United
States
162,000
$
162,643
GM
Financial
Consumer
Automobile
Receivables
Trust
,
2022-3
,
A4
,
3.71
%
,
12/16/27
.
...............................
United
States
110,885
110,827
Hyundai
Auto
Receivables
Trust
,
2023-B,
A3,
5.48%,
4/17/28
..........................
United
States
255,928
257,563
k
2026-A,
A2B,
FRN,
3.998%,
(30-day
SOFR
Average
+
0.34%),
2/15/29
.........................................
United
States
327,000
327,175
Nissan
Auto
Receivables
Owner
Trust
,
2025-B
,
A2A
,
4
%
,
7/17/28
.
United
States
327,000
327,580
Toyota
Auto
Receivables
Owner
Trust
,
2023-B,
A3,
4.71%,
2/15/28
..........................
United
States
36,230
36,368
k
2025-D,
A2B,
FRN,
3.978%,
(30-day
SOFR
Average
+
0.32%),
8/15/28
.........................................
United
States
174,000
174,117
World
Omni
Auto
Receivables
Trust
,
2026-A
,
A3
,
3.86
%
,
5/15/31
.
United
States
50,000
50,240
1,446,513
a
a
a
a
a
a
Financial
Services
1.3%
b,k
Allegro
CLO
XII
Ltd.
,
2020-1A
,
A1R
,
144A,
FRN
,
5.11
%
,
(
3-month
SOFR
+
1.44
%
),
7/21/37
.
............................
United
States
250,000
250,625
b,k
Bain
Capital
Credit
CLO
Ltd.
,
2022-2A
,
A1R
,
144A,
FRN
,
4.819
%
,
(
3-month
SOFR
+
1.15
%
),
4/22/35
.
....................
United
States
250,000
250,552
b
Bank
of
America
Auto
Trust
,
2023-2A
,
A4
,
144A,
5.66
%
,
11/15/29
.
United
States
175,000
178,184
b,k
Birch
Grove
CLO
2
Ltd.
,
2021-2A
,
A1R
,
144A,
FRN
,
5.068
%
,
(
3-month
SOFR
+
1.4
%
),
10/19/37
.
....................
United
States
125,000
125,393
b,k
Birch
Grove
CLO
8
Ltd.
,
2024-8A
,
A1
,
144A,
FRN
,
5.298
%
,
(
3-month
SOFR
+
1.63
%
),
4/20/37
.
....................
Jersey
150,000
150,562
b
BofA
Auto
Trust
,
2024-1A
,
A3
,
144A,
5.35
%
,
11/15/28
.
........
United
States
45,758
46,175
b,k
BRAVO
Residential
Funding
Trust
,
2025-HE1
,
A1
,
144A,
FRN
,
5.017
%
,
(
30-day
SOFR
Average
+
1.35
%
),
9/25/72
.
........
United
States
130,402
130,783
b,k
CBAM
Ltd.
,
2017-2A
,
AR
,
144A,
FRN
,
5.119
%
,
(
3-month
SOFR
+
1.452
%
),
7/17/34
.
.................................
United
States
200,000
200,406
b
Chase
Auto
Owner
Trust
,
2025-1A
,
A3
,
144A,
4.29
%
,
6/25/30
.
..
United
States
50,000
50,529
b,k
CIFC
Funding
Ltd.
,
2021-7A
,
AR
,
144A,
FRN
,
4.761
%
,
(
3-month
SOFR
+
1.09
%
),
1/23/35
.
............................
United
States
488,000
488,672
b
Compass
Datacenters
Issuer
II
LLC
,
2024-2A,
A1,
144A,
5.022%,
8/25/49
...................
United
States
181,000
182,822
2025-2A,
A1,
144A,
4.926%,
11/25/50
..................
United
States
259,000
261,281
b,k
Diameter
Capital
CLO
7
Ltd.
,
2024-7A
,
A1A
,
144A,
FRN
,
5.148
%
,
(
3-month
SOFR
+
1.48
%
),
7/20/37
.
....................
United
States
250,000
250,936
b,k
Elevation
CLO
Ltd.
,
2018-10A,
AR,
144A,
FRN,
4.588%,
(3-month
SOFR
+
0.92%),
10/20/31
........................................
United
States
315
315
2021-13A,
A1R,
144A,
FRN,
4.732%,
(3-month
SOFR
+
1.06%),
7/15/34
...................................
United
States
250,000
250,301
b
FIGRE
Trust
,
2025-FL1,
A1,
144A,
5.265%,
7/25/55
..................
United
States
124,371
125,206
2025-FL2,
A1,
144A,
5.053%,
11/25/55
.................
United
States
142,504
143,678
Ford
Credit
Auto
Owner
Trust
,
2022-C,
A4,
4.59%,
12/15/27
.........................
United
States
62,082
62,185
k
2025-B,
A2B,
FRN,
3.958%,
(30-day
SOFR
Average
+
0.3%),
6/15/28
.........................................
United
States
51,000
51,020
b,k
GoldenTree
Loan
Management
US
CLO
11
Ltd.
,
2021-11A
,
AR
,
144A,
FRN
,
4.748
%
,
(
3-month
SOFR
+
1.08
%
),
10/20/34
.
...
United
States
2,500,000
2,503,263
Honda
Auto
Receivables
Owner
Trust
,
2026-1
,
A2A
,
3.71
%
,
9/21/28
.
.........................................
United
States
194,000
193,947
Putnam
Asset
Allocation
Funds
Consolidated
Schedule
of
Investments
(unaudited)
Putnam
Multi-Asset
Income
Fund
Semiannual
Report
The
accompanying
notes
are
an
integral
part
of
these
consolidated
financial
statements.
a
a
Country
Principal
Amount
*
a
Value
a
a
a
a
a
Asset-Backed
Securities
(continued)
Financial
Services
(continued)
b
J.P.
Morgan
Mortgage
Trust
,
k
2023-HE2,
A1,
144A,
FRN,
5.362%,
(30-day
SOFR
Average
+
1.7%),
3/20/54
....................................
United
States
135,504
$
136,066
2024-CES1,
A1A,
144A,
5.919%,
6/25/54
................
United
States
48,939
49,303
k
2025-HE3,
A1,
144A,
FRN,
5.012%,
(30-day
SOFR
Average
+
1.35%),
3/20/56
...................................
United
States
79,645
79,959
b,k
Madison
Park
Funding
XXX
Ltd.
,
2018-30A
,
A1R
,
144A,
FRN
,
5.031
%
,
(
3-month
SOFR
+
1.36
%
),
7/16/37
.
..............
United
States
250,000
250,769
b,f,k
Neuberger
Berman
Loan
Advisers
CLO
51
Ltd.
,
2022-51A
,
BR2
,
144A,
FRN
,
Zero
Cpn.,
(
3-month
SOFR
+
1.4
%
),
10/23/36
.
..
Jersey
250,000
250,125
b,k
Northwoods
Capital
25
Ltd.
,
2021-25A
,
B1R
,
144A,
FRN
,
5.268
%
,
(
3-month
SOFR
+
1.6
%
),
7/20/34
.
.....................
United
States
370,000
370,845
b,k
Oaktree
CLO
Ltd.
,
2021-1A
,
A1R
,
144A,
FRN
,
5.022
%
,
(
3-month
SOFR
+
1.35
%
),
1/15/38
.
............................
United
States
250,000
250,695
b
PK
Alift
Loan
Funding
7
LP
,
2025-2
,
A
,
144A,
4.75
%
,
3/15/43
.
..
United
States
237,708
239,586
b,f
PK
Alift
Loan
Funding
8
LP
,
2026-1
,
A
,
144A,
4.614
%
,
9/15/43
.
.
United
States
250,000
252,405
b,k
Signal
Peak
CLO
5
Ltd.
,
2018-5A
,
A1R
,
144A,
FRN
,
5.218
%
,
(
3-month
SOFR
+
1.55
%
),
4/25/37
.
....................
United
States
250,000
250,837
b,k
Sound
Point
CLO
XXXII
Ltd.
,
2021-4A,
A,
144A,
FRN,
5.08%,
(3-month
SOFR
+
1.412%),
10/25/34
........................................
United
States
250,000
250,000
2021-4A,
AR,
144A,
FRN,
Zero
Cpn.,
(3-month
SOFR
+
1.03%),
10/25/34
........................................
United
States
250,000
250,000
b,k
Symphony
CLO
XXIII
Ltd.
,
2020-23A
,
AR2
,
144A,
FRN
,
4.572
%
,
(
3-month
SOFR
+
0.9
%
),
1/15/34
.
.....................
United
States
136,637
136,827
b,k
TCW
CLO
Ltd.
,
2020-1A
,
A1R3
,
144A,
FRN
,
4.718
%
,
(
3-month
SOFR
+
1.05
%
),
4/20/34
.
............................
United
States
2,450,000
2,452,754
b
Towd
Point
Mortgage
Trust
,
2024-CES4,
A1,
144A,
5.122%,
9/25/64
.................
United
States
65,185
65,376
k
2025-HE1,
A1A,
144A,
FRN,
5.017%,
(30-day
SOFR
Average
+
1.35%),
7/25/65
...................................
United
States
81,662
81,900
b,k
Venture
41
CLO
Ltd.
,
2021-41A
,
A1RR
,
144A,
FRN
,
4.798
%
,
(
3-month
SOFR
+
1.13
%
),
1/20/34
.
....................
United
States
290,000
290,347
b,k
Venture
XIX
CLO
Ltd.
,
2014-19A
,
ARR
,
144A,
FRN
,
5.194
%
,
(
3-month
SOFR
+
1.522
%
),
1/15/32
.
...................
United
States
62,280
62,455
b,k
Venture
XV
CLO
Ltd.
,
2013-15A
,
AR3
,
144A,
FRN
,
5.114
%
,
(
3-month
SOFR
+
1.442
%
),
7/15/32
.
...................
United
States
115,887
116,346
11,733,430
a
a
a
a
a
a
Total
Asset-Backed
Securities
(Cost
$14,514,742)
.............................
14,539,617
Commercial
Mortgage-Backed
Securities
1.7%
Financial
Services
1.7%
b,n
1301
Trust
,
2025-1301
,
A
,
144A,
FRN
,
5.059
%
,
8/11/42
.......
United
States
139,000
142,456
b,k
AREIT
Trust
,
2022-CRE6
,
A
,
144A,
FRN
,
4.91
%
,
(
30-day
SOFR
Average
+
1.25
%
),
1/20/37
...........................
United
States
125,655
125,787
n
Banc
of
America
Commercial
Mortgage
Trust
,
2015-UBS7
,
AS
,
FRN
,
3.989
%
,
9/15/48
..............................
United
States
91,869
91,678
n,o
BANK
,
2020-BN26
,
XA
,
IO,
FRN
,
1.19
%
,
3/15/63
...........
United
States
3,716,134
131,290
BANK5
Trust
,
n,o
2025-5YR18,
XA,
IO,
FRN,
1.048%,
12/15/58
.............
United
States
14,901,993
666,912
2026-5YR20,
AS,
5.336%,
2/15/59
.....................
United
States
174,000
180,753
Barclays
Commercial
Mortgage
Trust
,
2019-C5
,
C
,
3.71
%
,
11/15/52
........................................
United
States
402,000
373,950
n
BBCMS
Mortgage
Trust
,
2023-C21,
A3,
FRN,
6.296%,
9/15/56
...................
United
States
73,000
78,621
o
2025-5C34,
XA,
IO,
FRN,
1.167%,
5/15/58
...............
United
States
1,630,499
71,938
Putnam
Asset
Allocation
Funds
Consolidated
Schedule
of
Investments
(unaudited)
Putnam
Multi-Asset
Income
Fund
The
accompanying
notes
are
an
integral
part
of
these
consolidated
financial
statements.
Semiannual
Report
a
a
Country
Principal
Amount
*
a
Value
a
a
a
a
a
Commercial
Mortgage-Backed
Securities
(continued)
Financial
Services
(continued)
Benchmark
Mortgage
Trust
,
2019-B13,
A2,
2.889%,
8/15/57
.......................
United
States
145,189
$
141,428
n,o
2020-B21,
XA,
IO,
FRN,
1.402%,
12/17/53
...............
United
States
5,372,582
281,117
n
2025-V16,
AS,
FRN,
5.859%,
8/15/58
...................
United
States
483,000
509,528
n,o
BMO
Mortgage
Trust
,
2025-5C10
,
XA
,
IO,
FRN
,
1.354
%
,
5/15/58
United
States
1,021,875
49,947
b,k
BX
Commercial
Mortgage
Trust
,
2026-CSMO
,
A
,
144A,
FRN
,
5.067
%
,
(
1-month
SOFR
+
1.4
%
),
2/15/42
...............
United
States
179,000
179,276
b
BX
Trust
,
n
2025-ARIA,
B,
144A,
FRN,
5.177%,
12/13/42
.............
United
States
130,000
133,269
k
2025-VOLT,
A,
144A,
FRN,
5.36%,
(1-month
SOFR
+
1.7%),
12/15/44
........................................
United
States
125,000
125,337
n
CGMS
Commercial
Mortgage
Trust
,
2017-B1
,
AS
,
FRN
,
3.711
%
,
8/15/50
.........................................
United
States
80,000
78,907
Citigroup
Commercial
Mortgage
Trust
,
n
2014-GC21,
C,
FRN,
4.78%,
5/10/47
...................
United
States
643,275
641,641
2016-C3,
A4,
3.154%,
11/15/49
.......................
United
States
953,000
944,782
n
2016-P6,
B,
FRN,
4.148%,
12/10/49
....................
United
States
368,000
345,901
COMM
Mortgage
Trust
,
b
2013-CR6,
B,
144A,
3.397%,
3/10/46
...................
United
States
158,017
157,068
n
2015-CR26,
B,
FRN,
4.613%,
10/10/48
.................
United
States
834,265
824,027
n
2015-DC1,
B,
FRN,
4.035%,
2/10/48
...................
United
States
352,000
337,642
n
2017-COR2,
C,
FRN,
4.587%,
9/10/50
..................
United
States
127,000
122,078
CSAIL
Commercial
Mortgage
Trust
,
2016-C6,
AS,
3.346%,
1/15/49
........................
United
States
171,000
170,411
n,o
2019-C15,
XA,
IO,
FRN,
0.987%,
3/15/52
................
United
States
5,143,084
116,924
n
CSMC
Trust
,
2016-NXSR
,
AS
,
FRN
,
4.049
%
,
12/15/49
.......
United
States
176,000
173,549
J.P.
Morgan
Chase
Commercial
Mortgage
Securities
Trust
,
n
2013-C10,
C,
FRN,
4.206%,
12/15/47
..................
United
States
35,255
34,224
2016-JP3,
AS,
3.144%,
8/15/49
.......................
United
States
675,000
662,773
n
JPMBB
Commercial
Mortgage
Securities
Trust
,
2014-C18
,
B
,
FRN
,
4.525
%
,
2/15/47
..............................
United
States
659,563
655,585
n
JPMDB
Commercial
Mortgage
Securities
Trust
,
2018-C8
,
C
,
FRN
,
4.755
%
,
6/15/51
...................................
United
States
133,000
121,020
b,n,o
LCCM
Trust
,
2017-LC26
,
XA
,
IO,
144A,
FRN
,
1.502
%
,
7/12/50
.
United
States
2,879,256
34,313
b,n
MAD
Commercial
Mortgage
Trust
,
2025-11MD,
A,
144A,
FRN,
4.912%,
10/15/42
............
United
States
125,000
126,997
2025-11MD,
C,
144A,
FRN,
5.818%,
10/15/42
............
United
States
175,000
179,035
n
Morgan
Stanley
Bank
of
America
Merrill
Lynch
Trust
,
2013-C9,
B,
FRN,
3.708%,
5/15/46
....................
United
States
185,834
181,664
2015-C21,
B,
FRN,
3.854%,
3/15/48
...................
United
States
909,948
891,729
2015-C22,
B,
FRN,
3.883%,
4/15/48
...................
United
States
138,000
127,931
2016-C32,
AS,
FRN,
3.994%,
12/15/49
.................
United
States
1,022,000
1,015,400
o
2016-C32,
XA,
IO,
FRN,
0.633%,
12/15/49
...............
United
States
8,832,959
34,690
n
Morgan
Stanley
Capital
I
Trust
,
2018-L1
,
C
,
FRN
,
4.8
%
,
10/15/51
United
States
263,000
244,217
b
One
Bryant
Park
Trust
,
2019-OBP
,
A
,
144A,
2.516
%
,
9/15/54
..
United
States
125,000
117,508
b,k
SHRN
Trust
,
2025-MF18
,
A
,
144A,
FRN
,
4.86
%
,
(
1-month
SOFR
+
1.2
%
),
10/15/40
.................................
United
States
180,000
180,332
n,o
Wachovia
Bank
Commercial
Mortgage
Trust
,
2006-C29
,
IO,
FRN
,
0.293
%
,
11/15/48
..................................
United
States
6,963
9
Wells
Fargo
Commercial
Mortgage
Trust
,
2017-C39,
B,
4.025%,
9/15/50
........................
United
States
491,000
473,955
2019-C49,
B,
4.546%,
3/15/52
........................
United
States
581,000
573,432
n
2020-C56,
B,
FRN,
3.61%,
6/15/53
....................
United
States
904,000
830,696
Putnam
Asset
Allocation
Funds
Consolidated
Schedule
of
Investments
(unaudited)
Putnam
Multi-Asset
Income
Fund
Semiannual
Report
The
accompanying
notes
are
an
integral
part
of
these
consolidated
financial
statements.
a
a
Country
Principal
Amount
*
a
Value
a
a
a
a
a
Commercial
Mortgage-Backed
Securities
(continued)
Financial
Services
(continued)
n
WFRBS
Commercial
Mortgage
Trust
,
2014-C21
,
B
,
FRN
,
4.213
%
,
8/15/47
.........................................
United
States
746,505
$
736,362
14,418,089
a
a
a
a
a
a
Total
Commercial
Mortgage-Backed
Securities
(Cost
$13,829,644)
..............
14,418,089
Mortgage-Backed
Securities
17.8%
Federal
Home
Loan
Mortgage
Corp.
(FHLMC)
Fixed
Rate
0.8%
FHLMC
Pool,
15
Year,
2.5%,
10/01/36
....................
United
States
302,448
288,753
FHLMC
Pool,
30
Year,
2%,
3/01/51
......................
United
States
1,079,921
901,974
FHLMC
Pool,
30
Year,
2.5%,
1/01/52
-
4/01/52
.............
United
States
2,914,814
2,578,795
FHLMC
Pool,
30
Year,
3%,
3/01/43
-
8/01/52
...............
United
States
1,141,989
1,054,217
FHLMC
Pool,
30
Year,
3.5%,
8/01/43
.....................
United
States
159,067
154,052
FHLMC
Pool,
30
Year,
4%,
9/01/49
......................
United
States
864,247
853,707
FHLMC
Pool,
30
Year,
4.5%,
9/01/52
.....................
United
States
448,519
448,439
FHLMC
Pool,
30
Year,
5.5%,
12/01/52
....................
United
States
211,853
216,464
FHLMC
Pool,
30
Year,
6%,
9/01/53
......................
United
States
299,619
310,235
6,806,636
Federal
National
Mortgage
Association
(FNMA)
Fixed
Rate
12.4%
FNMA,
3.5%,
6/01/56
................................
United
States
1,050,896
989,076
FNMA,
15
Year,
1.5%,
7/01/36
.........................
United
States
584,655
535,956
FNMA,
15
Year,
2%,
3/01/36
...........................
United
States
840,868
786,300
FNMA,
30
Year,
2%,
10/01/50
-
3/01/52
...................
United
States
4,383,890
3,686,610
FNMA,
30
Year,
2.5%,
11/01/51
-
3/01/52
.................
United
States
1,552,996
1,373,176
FNMA,
30
Year,
3%,
2/01/43
-
3/01/52
....................
United
States
826,163
762,903
FNMA,
30
Year,
3.5%,
6/01/42
-
6/01/52
..................
United
States
1,292,651
1,227,583
FNMA,
30
Year,
4.5%,
8/01/52
-
1/01/53
..................
United
States
436,891
436,724
FNMA,
30
Year,
5%,
1/01/49
-
8/01/49
....................
United
States
42,363
43,289
FNMA,
30
Year,
5.5%,
1/01/38
-
11/01/52
.................
United
States
552,286
568,190
FNMA,
30
Year,
6.5%,
4/01/53
.........................
United
States
166,184
173,305
p
Uniform
Mortgage-Backed
Securities,
1.5%,
TBA,
3/25/41
.....
United
States
1,460,000
1,331,918
p
Uniform
Mortgage-Backed
Securities,
2%,
TBA,
3/25/41
......
United
States
1,710,000
1,593,919
p
Uniform
Mortgage-Backed
Securities,
2%,
TBA,
3/25/56
......
United
States
15,100,000
12,513,409
p
Uniform
Mortgage-Backed
Securities,
2.5%,
TBA,
3/25/41
.....
United
States
260,000
247,979
p
Uniform
Mortgage-Backed
Securities,
2.5%,
TBA,
3/25/56
.....
United
States
10,680,000
9,255,336
p
Uniform
Mortgage-Backed
Securities,
3%,
TBA,
3/25/56
......
United
States
4,580,000
4,142,613
p
Uniform
Mortgage-Backed
Securities,
3.5%,
TBA,
3/25/56
.....
United
States
3,300,000
3,110,299
p
Uniform
Mortgage-Backed
Securities,
4%,
TBA,
3/25/56
......
United
States
3,590,000
3,489,651
p
Uniform
Mortgage-Backed
Securities,
4.5%,
TBA,
3/25/41
.....
United
States
40,000
40,174
p
Uniform
Mortgage-Backed
Securities,
5%,
TBA,
3/25/41
......
United
States
1,560,000
1,583,779
p
Uniform
Mortgage-Backed
Securities,
5.5%,
TBA,
3/25/56
.....
United
States
36,000,000
36,582,805
p
Uniform
Mortgage-Backed
Securities,
6%,
TBA,
3/25/56
......
United
States
13,920,000
14,279,756
p
Uniform
Mortgage-Backed
Securities,
6.5%,
TBA,
3/25/56
.....
United
States
7,590,000
7,884,224
106,638,974
Government
National
Mortgage
Association
(GNMA)
Fixed
Rate
4.6%
GNMA
II,
30
Year,
2.5%,
2/20/52
-
3/20/52
.................
United
States
985,631
870,198
GNMA
II,
30
Year,
3.5%,
3/20/47
........................
United
States
886,198
841,552
p
GNMA
II,
Single-family,
30
Year,
2%,
3/15/56
...............
United
States
4,170,000
3,534,040
p
GNMA
II,
Single-family,
30
Year,
2.5%,
3/15/56
.............
United
States
3,260,000
2,877,342
GNMA
II,
Single-family,
30
Year,
3%,
11/20/53
-
1/20/54
.......
United
States
776,836
716,324
p
GNMA
II,
Single-family,
30
Year,
3%,
3/15/56
...............
United
States
1,720,000
1,577,913
GNMA
II,
Single-family,
30
Year,
3.5%,
10/20/49
-
11/20/49
....
United
States
43,582
40,471
p
GNMA
II,
Single-family,
30
Year,
3.5%,
3/15/56
.............
United
States
1,250,000
1,173,422
GNMA
II,
Single-family,
30
Year,
4%,
12/20/52
..............
United
States
492,707
478,340
Putnam
Asset
Allocation
Funds
Consolidated
Schedule
of
Investments
(unaudited)
Putnam
Multi-Asset
Income
Fund
The
accompanying
notes
are
an
integral
part
of
these
consolidated
financial
statements.
Semiannual
Report
a
a
Country
Principal
Amount
*
a
Value
a
a
a
a
a
Mortgage-Backed
Securities
(continued)
Government
National
Mortgage
Association
(GNMA)
Fixed
Rate
(continued)
p
GNMA
II,
Single-family,
30
Year,
4%,
3/15/56
...............
United
States
2,040,000
$
1,962,860
p
GNMA
II,
Single-family,
30
Year,
4.5%,
3/15/56
.............
United
States
3,260,000
3,222,561
GNMA
II,
Single-family,
30
Year,
5%,
5/20/49
...............
United
States
34,769
35,299
p
GNMA
II,
Single-family,
30
Year,
5%,
3/15/56
...............
United
States
6,250,000
6,272,670
GNMA
II,
Single-family,
30
Year,
5.5%,
5/20/49
.............
United
States
13,235
13,594
p
GNMA
II,
Single-family,
30
Year,
5.5%,
3/15/56
.............
United
States
10,480,000
10,615,377
GNMA
II,
Single-family,
30
Year,
6%,
11/20/53
..............
United
States
833,459
868,291
p
GNMA
II,
Single-family,
30
Year,
6%,
3/15/56
...............
United
States
4,690,000
4,784,812
39,885,066
Total
Mortgage-Backed
Securities
(Cost
$152,795,910)
.........................
153,330,676
Residential
Mortgage-Backed
Securities
1.0%
Financial
Services
1.0%
b
A&D
Mortgage
Trust
,
2023-NQM2,
A1,
144A,
6.132%,
5/25/68
................
United
States
224,340
224,394
2023-NQM5,
A1,
144A,
7.049%,
11/25/68
...............
United
States
383,677
387,904
b,k
Chase
Home
Lending
Mortgage
Trust
,
2024-11,
A11,
144A,
FRN,
4.917%,
(30-day
SOFR
Average
+
1.25%),
11/25/55
..................................
United
States
92,739
93,110
2025-10,
A11,
144A,
FRN,
4.967%,
(30-day
SOFR
Average
+
1.3%),
7/25/56
....................................
United
States
88,316
88,675
2025-7,
A11,
144A,
FRN,
5.067%,
(30-day
SOFR
Average
+
1.4%),
5/25/56
....................................
United
States
49,133
49,385
b
COLT
Mortgage
Loan
Trust
,
2023-3
,
A1
,
144A,
7.18
%
,
9/25/68
.
United
States
486,988
492,003
b
Cross
Mortgage
Trust
,
2024-H3
,
A1
,
144A,
6.272
%
,
6/25/69
...
United
States
332,988
337,301
b,k
EFMT
,
2025-NQM4
,
A1F
,
144A,
FRN
,
4.867
%
,
(
30-day
SOFR
Average
+
1.2
%
),
9/25/70
............................
United
States
177,283
177,587
b,k
FHLMC
STACR
REMIC
Trust
,
2021-DNA5,
M2,
144A,
FRN,
5.317%,
(30-day
SOFR
Average
+
1.65%),
1/25/34
.................................
United
States
9,460
9,502
2021-DNA6,
M2,
144A,
FRN,
5.167%,
(30-day
SOFR
Average
+
1.5%),
10/25/41
.................................
United
States
35,994
36,100
2021-DNA7,
M2,
144A,
FRN,
5.467%,
(30-day
SOFR
Average
+
1.8%),
11/25/41
..................................
United
States
108,000
108,506
2022-DNA5,
M1A,
144A,
FRN,
6.617%,
(30-day
SOFR
Average
+
2.95%),
6/25/42
.................................
United
States
174,377
177,110
2022-DNA6,
M1A,
144A,
FRN,
5.817%,
(30-day
SOFR
Average
+
2.15%),
9/25/42
.................................
United
States
34,369
34,508
2023-DNA1,
M1A,
144A,
FRN,
5.768%,
(30-day
SOFR
Average
+
2.1%),
3/25/43
..................................
United
States
13,289
13,436
2023-HQA2,
M1A,
144A,
FRN,
5.667%,
(30-day
SOFR
Average
+
2%),
6/25/43
....................................
United
States
4,040
4,045
2023-HQA3,
A1,
144A,
FRN,
5.517%,
(30-day
SOFR
Average
+
1.85%),
11/25/43
..................................
United
States
31,816
32,085
2023-HQA3,
M1,
144A,
FRN,
5.517%,
(30-day
SOFR
Average
+
1.85%),
11/25/43
.................................
United
States
7,286
7,322
2024-HQA2,
A1,
144A,
FRN,
4.917%,
(30-day
SOFR
Average
+
1.25%),
8/25/44
...................................
United
States
202,400
203,256
2025-DNA1,
A1,
144A,
FRN,
4.617%,
(30-day
SOFR
Average
+
0.95%),
1/25/45
...................................
United
States
34,840
34,857
2025-DNA2,
A1,
144A,
FRN,
4.767%,
(30-day
SOFR
Average
+
1.1%),
5/25/45
....................................
United
States
93,413
93,652
2025-DNA2,
M1,
144A,
FRN,
4.867%,
(30-day
SOFR
Average
+
1.2%),
5/25/45
..................................
United
States
387,642
387,925
2025-DNA3,
M1,
144A,
FRN,
4.767%,
(30-day
SOFR
Average
+
1.1%),
9/25/45
..................................
United
States
142,136
142,213
Putnam
Asset
Allocation
Funds
Consolidated
Schedule
of
Investments
(unaudited)
Putnam
Multi-Asset
Income
Fund
Semiannual
Report
The
accompanying
notes
are
an
integral
part
of
these
consolidated
financial
statements.
a
a
Country
Principal
Amount
*
a
Value
a
a
a
a
a
Residential
Mortgage-Backed
Securities
(continued)
Financial
Services
(continued)
b,k
FHLMC
STACR
REMIC
Trust,
(continued)
2025-DNA4,
M1,
144A,
FRN,
4.767%,
(30-day
SOFR
Average
+
1.1%),
10/25/45
.................................
United
States
86,175
$
86,524
k
FNMA
Connecticut
Avenue
Securities
Trust
,
2017-C06,
2M2,
FRN,
6.582%,
(30-day
SOFR
Average
+
2.914%),
2/25/30
..................................
United
States
239,676
245,750
2018-C04,
2M2,
FRN,
6.332%,
(30-day
SOFR
Average
+
2.664%),
12/25/30
.................................
United
States
51,855
53,225
b
2021-R03,
1M2,
144A,
FRN,
5.317%,
(30-day
SOFR
Average
+
1.65%),
12/25/41
..................................
United
States
35,000
35,167
b
2022-R02,
2M2,
144A,
FRN,
6.667%,
(30-day
SOFR
Average
+
3%),
1/25/42
.....................................
United
States
531,550
540,015
b
2022-R03,
1M2,
144A,
FRN,
7.167%,
(30-day
SOFR
Average
+
3.5%),
3/25/42
....................................
United
States
13,000
13,314
b
2022-R04,
1M2,
144A,
FRN,
6.767%,
(30-day
SOFR
Average
+
3.1%),
3/25/42
....................................
United
States
13,000
13,286
b
2022-R05,
2M1,
144A,
FRN,
5.567%,
(30-day
SOFR
Average
+
1.9%),
4/25/42
....................................
United
States
62,860
62,948
b
2023-R01,
1M1,
144A,
FRN,
6.067%,
(30-day
SOFR
Average
+
2.4%),
12/25/42
...................................
United
States
11,687
11,994
b
2023-R02,
1M1,
144A,
FRN,
5.967%,
(30-day
SOFR
Average
+
2.3%),
1/25/43
....................................
United
States
25,499
26,149
b
2023-R06,
1M1,
144A,
FRN,
5.367%,
(30-day
SOFR
Average
+
1.7%),
7/25/43
....................................
United
States
25,420
25,529
b
2023-R07,
2M1,
144A,
FRN,
5.617%,
(30-day
SOFR
Average
+
1.95%),
9/25/43
...................................
United
States
5,539
5,560
b
2024-R03,
2M1,
144A,
FRN,
4.817%,
(30-day
SOFR
Average
+
1.15%),
3/25/44
...................................
United
States
212,967
213,012
b
2024-R04,
1M1,
144A,
FRN,
4.767%,
(30-day
SOFR
Average
+
1.1%),
5/25/44
....................................
United
States
4,684
4,686
b
2024-R06,
1A1,
144A,
FRN,
4.817%,
(30-day
SOFR
Average
+
1.15%),
9/25/44
...................................
United
States
38,524
38,651
b
2025-R01,
1A1,
144A,
FRN,
4.617%,
(30-day
SOFR
Average
+
0.95%),
1/25/45
...................................
United
States
36,084
36,111
b
2025-R01,
1M1,
144A,
FRN,
4.767%,
(30-day
SOFR
Average
+
1.1%),
1/25/45
....................................
United
States
25,744
25,771
b
2025-R02,
1A1,
144A,
FRN,
4.667%,
(30-day
SOFR
Average
+
1%),
2/25/45
.....................................
United
States
87,521
87,636
b
2025-R02,
1M1,
144A,
FRN,
4.817%,
(30-day
SOFR
Average
+
1.15%),
2/25/45
...................................
United
States
152,023
152,134
b
2025-R03,
2A1,
144A,
FRN,
5.117%,
(30-day
SOFR
Average
+
1.45%),
3/25/45
...................................
United
States
114,076
114,738
b
2025-R04,
1A1,
144A,
FRN,
4.667%,
(30-day
SOFR
Average
+
1%),
5/25/45
.....................................
United
States
69,932
70,039
b
2025-R04,
1M1,
144A,
FRN,
4.867%,
(30-day
SOFR
Average
+
1.2%),
5/25/45
....................................
United
States
158,793
159,149
b
2025-R06,
1A1,
144A,
FRN,
4.567%,
(30-day
SOFR
Average
+
0.9%),
9/25/45
....................................
United
States
137,430
137,530
b
2026-R01,
2A1,
144A,
FRN,
4.517%,
(30-day
SOFR
Average
+
0.85%),
1/25/46
...................................
United
States
237,027
237,013
b
2026-R01,
2M1,
144A,
FRN,
4.667%,
(30-day
SOFR
Average
+
1%),
1/25/46
.....................................
United
States
279,834
279,976
b
GCAT
Trust
,
2020-NQM2
,
A3
,
144A,
3.935
%
,
4/25/65
........
United
States
12,970
12,768
b
HOMES
Trust
,
2024-NQM1
,
A1
,
144A,
5.915
%
,
7/25/69
......
United
States
71,817
72,677
b
Mill
City
Mortgage
Loan
Trust
,
2023-NQM1
,
A1
,
144A,
6.05
%
,
10/25/67
........................................
United
States
220,571
220,079
k
MortgageIT
Trust
,
2004-1
,
M2
,
FRN
,
4.793
%
,
(
1-month
SOFR
+
1.119
%
),
11/25/34
.................................
United
States
67,753
64,440
Putnam
Asset
Allocation
Funds
Consolidated
Schedule
of
Investments
(unaudited)
Putnam
Multi-Asset
Income
Fund
The
accompanying
notes
are
an
integral
part
of
these
consolidated
financial
statements.
Semiannual
Report
a
a
Country
Principal
Amount
*
a
Value
a
a
a
a
a
Residential
Mortgage-Backed
Securities
(continued)
Financial
Services
(continued)
b
OBX
Trust
,
2023-NQM8,
A1,
144A,
7.045%,
9/25/63
................
United
States
90,014
$
90,906
k
2025-J2,
AF,
144A,
FRN,
4.967%,
(30-day
SOFR
Average
+
1.3%),
9/25/55
....................................
United
States
83,022
83,422
b,n
OLIT
,
2025-HB2
,
A
,
144A,
FRN
,
3
%
,
11/25/38
..............
United
States
138,537
136,033
b,k
Radian
Mortgage
Capital
Trust
,
2025-J3
,
A25
,
144A,
FRN
,
5.167
%
,
(
30-day
SOFR
Average
+
1.5
%
),
12/25/55
........
United
States
98,760
99,420
k
RALI
Trust
,
2006-QO5
,
1A1
,
FRN
,
4.218
%
,
(
1-month
SOFR
+
0.544
%
),
5/25/46
..................................
United
States
123,353
113,013
b,k
Sequoia
Mortgage
Trust
,
2026-2
,
A26F
,
144A,
FRN
,
4.809
%
,
(
30-
day
SOFR
Average
+
1.15
%
),
3/25/56
..................
United
States
238,000
238,589
b,k
Station
Place
Securitization
Trust
,
2025-1,
A,
144A,
FRN,
4.573%,
(1-month
SOFR
+
0.9%),
7/23/26
.........................................
United
States
427,000
433,754
2025-3,
A,
144A,
FRN,
4.573%,
(1-month
SOFR
+
0.9%),
9/23/26
.........................................
United
States
410,000
411,471
2025-7,
A,
144A,
FRN,
4.573%,
(1-month
SOFR
+
0.9%),
11/24/26
........................................
United
States
423,000
424,022
k
Structured
Asset
Mortgage
Investments
II
Trust
,
2007-AR1
,
2A1
,
FRN
,
4.148
%
,
(
1-month
SOFR
+
0.474
%
),
1/25/37
.........
United
States
411,204
377,496
8,588,873
a
a
a
a
a
a
Total
Residential
Mortgage-Backed
Securities
(Cost
$8,524,291)
................
8,588,873
Agency
Commercial
Mortgage-Backed
Securities
0.1%
Financial
Services
0.1%
k
FHLMC
,
5466,
FG,
FRN,
4.617%,
(30-day
SOFR
Average
+
0.95%),
10/25/54
........................................
United
States
570,804
575,026
5471,
FD,
FRN,
4.517%,
(30-day
SOFR
Average
+
0.85%),
11/25/54
........................................
United
States
108,365
108,750
k
FNMA
,
2024-77,
DF,
FRN,
4.867%,
(30-day
SOFR
Average
+
1.2%),
10/25/53
........................................
United
States
128,844
130,493
2024-82,
FE,
FRN,
4.617%,
(30-day
SOFR
Average
+
0.95%),
11/25/54
........................................
United
States
156,119
156,948
2024-93,
FD,
FRN,
4.717%,
(30-day
SOFR
Average
+
1.05%),
12/25/54
........................................
United
States
225,369
226,778
1,197,995
a
a
a
a
a
a
Total
Agency
Commercial
Mortgage-Backed
Securities
(Cost
$1,194,113)
........
1,197,995
Municipal
Bonds
0.1%
California
0.1%
California
Health
Facilities
Financing
Authority
,
State
of
California
Personal
Income
Tax
,
Revenue
,
2022
,
4.19
%
,
6/01/37
......
United
States
130,000
127,366
City
of
Orange
,
Revenue
,
2021
,
Refunding
,
2.65
%
,
6/01/34
....
United
States
60,000
53,072
County
of
Fresno
,
Revenue
,
2004
A
,
NATL
Insured
,
4.27
%,
8/15/32
.........................................
United
States
75,000
57,240
State
of
California
,
GO
,
4.35
%
,
11/01/32
..................
United
States
160,000
163,652
401,330
New
Jersey
0.0%
†
New
Jersey
Transportation
Trust
Fund
Authority
,
State
of
New
Jersey
,
Revenue
,
2010
B
,
6.561
%
,
12/15/40
.............
United
States
25,000
28,726
Putnam
Asset
Allocation
Funds
Consolidated
Schedule
of
Investments
(unaudited)
Putnam
Multi-Asset
Income
Fund
Semiannual
Report
The
accompanying
notes
are
an
integral
part
of
these
consolidated
financial
statements.
a
a
Country
Principal
Amount
*
a
Value
a
a
a
a
a
Municipal
Bonds
(continued)
New
York
0.0%
†
New
York
City
Transitional
Finance
Authority
,
Future
Tax
Secured
,
Revenue
,
2026
F-2
,
4.66
%
,
2/01/36
....................
United
States
90,000
$
91,582
Ohio
0.0%
†
JobsOhio
Beverage
System
,
Revenue,
Senior
Lien
,
2020
A
,
ETM,
2.833
%
,
1/01/38
...................................
United
States
70,000
61,266
Pennsylvania
0.0%
†
Pennsylvania
Economic
Development
Financing
Authority
,
Revenue
,
2025
,
5.689
%
,
6/01/54
......................
United
States
85,000
87,693
Total
Municipal
Bonds
(Cost
$660,381)
.......................................
670,597
Total
Long
Term
Investments
(Cost
$689,587,318)
.............................
710,208,731
a
Short
Term
Investments
0.3%
a
a
Country
Principal
Amount
*
a
Value
a
a
a
a
a
a
U.S.
Government
and
Agency
Securities
0.2%
e,m
U.S.
Treasury
Bills,
3.53%,
7/16/26
......................
United
States
1,700,000
1,677,283
Total
U.S.
Government
and
Agency
Securities
(Cost
$1,677,119)
................
1,677,283
Shares
Money
Market
Funds
0.1%
q,r
JPM
USD
Treasury
CNAV
Fund,
3.176%
..................
Luxembourg
12,151
12,151
q,r,s
Putnam
Government
Money
Market
Fund,
Class
G,
3.508%
...
United
States
1,117,672
1,117,672
Total
Money
Market
Funds
(Cost
$1,129,823)
.................................
1,129,823
Total
Short
Term
Investments
(Cost
$2,806,942
)
...............................
2,807,106
a
Total
Investments
(Cost
$692,394,260)
82.8%
.................................
$713,015,837
TBA
Sale
Commitments
(0.8)%
..............................................
(6,629,715)
Other
Assets,
less
Liabilities
18.0%
..........................................
154,707,415
Net
Assets
100.0%
.........................................................
$861,093,537
a
a
a
Principal
Amount
*
t
TBA
Sale
Commitments
(0.8)%
Mortgage-Backed
Securities
(0.8)%
Federal
National
Mortgage
Association
(FNMA)
Fixed
Rate
(0.8)%
Uniform
Mortgage-Backed
Securities
,
4.5%,
TBA,
3/25/56
................................
United
States
(4,590,000)
(4,539,898)
5%,
TBA,
3/25/56
..................................
United
States
(2,080,000)
(2,089,817)
(6,629,715)
Total
TBA
Sale
Commitments
(Proceeds
$(6,599,878))
.........................
$(6,629,715)
Putnam
Asset
Allocation
Funds
Consolidated
Schedule
of
Investments
(unaudited)
Putnam
Multi-Asset
Income
Fund
The
accompanying
notes
are
an
integral
part
of
these
consolidated
financial
statements.
Semiannual
Report
*
The
principal
amount
is
stated
in
U.S.
dollars
unless
otherwise
indicated.
†
Rounds
to
less
than
0.1%
of
net
assets.
a
Non-income
producing.
b
Security
was
purchased
pursuant
to
Rule
144A
or
Regulation
S
under
the
Securities
Act
of
1933.
144A
securities
may
be
sold
in
transactions
exempt
from
registration
only
to
qualified
institutional
buyers
or
in
a
public
offering
registered
under
the
Securities
Act
of
1933.
Regulation
S
securities
cannot
be
sold
in
the
United
States
without
either
an
effective
registration
statement
filed
pursuant
to
the
Securities
Act
of
1933,
or
pursuant
to
an
exemption
from
registration.
At
February
28,
2026,
the
aggregate
value
of
these
securities
was
$176,687,957,
representing
20.5%
of
net
assets.
c
Fair
valued
using
significant
unobservable
inputs.
See
Note
10
regarding
fair
value
measurements.
d
Variable
rate
security.
The
rate
shown
represents
the
yield
at
period
end.
e
The
rate
shown
represents
the
yield
at
period
end.
f
A
portion
or
all
of
the
security
purchased
on
a
delayed
delivery
basis.
See
Note
1(d).
g
Income
may
be
received
in
additional
securities
and/or
cash.
h
Perpetual
security
with
no
stated
maturity
date.
i
The
coupon
rate
shown
represents
the
rate
at
period
end.
j
See
Note
1
(
f
)
regarding
senior
floating
rate
interests.
k
The
coupon
rate
shown
represents
the
rate
inclusive
of
any
caps
or
floors,
if
applicable,
in
effect
at
period
end.
l
Defaulted
security
or
security
for
which
income
has
been
deemed
uncollectible.
See
Note
7
.
m
A
portion
or
all
of
the
security
has
been
segregated
as
collateral
for
certain
derivative
contracts.
At
February
28,
2026,
the
aggregate
value
of
these
securities
pledged
amounted
to
$4,989,158,
representing
0.6%
of
net
assets.
n
Adjustable
rate
security
with
an
interest
rate
that
is
not
based
on
a
published
reference
index
and
spread.
The
rate
is
based
on
the
structure
of
the
agreement
and
current
market
conditions.
The
coupon
rate
shown
represents
the
rate
at
period
end.
o
Investment
in
an
interest-only
security
entitles
holders
to
receive
only
the
interest
payment
on
the
underlying
instruments.
The
principal
amount
shown
is
the
notional
amount
of
the
underlying
instruments.
p
Security
purchased
on
a
to-be-announced
(TBA)
basis.
See
Note
1
(
d
).
q
The
rate
shown
is
the
annualized
seven-day
effective
yield
at
period
end.
r
The
security
is
owned
by
Franklin
Multi-Asset
Income
Ltd.,
a
wholly-owned
subsidiary
of
the
Fund.
See
Note
1(g).
s
See
Note
3
(
g
)
regarding
investments
in
affiliated
management
investment
companies.
t
Security
sold
on
a
to-be-announced
(TBA)
basis
resulting
in
a
short
position.
As
such,
the
Fund
is
not
subject
to
fees
and
expenses
associated
with
short
sale
transactions.
Putnam
Asset
Allocation
Funds
Consolidated
Schedule
of
Investments
(unaudited)
Putnam
Multi-Asset
Income
Fund
Semiannual
Report
The
accompanying
notes
are
an
integral
part
of
these
consolidated
financial
statements.
At
February
28,
2026,
the
Fund
had
the
following futures
contracts
outstanding.
See
Note
1(e).
At
February
28,
2026,
the
Fund
had
the
following
forward
exchange
contracts
outstanding.
See
Note
1
(
e
).
Futures
Contracts
Description
Type
Number
of
Contracts
Notional
Amount
*
Expiration
Date
Value/
Unrealized
Appreciation
(Depreciation)
Equity
contracts
MSCI
EAFE
Index
............................
Short
28
$
4,431,140
3/20/26
$
(165,283)
MSCI
Emerging
Markets
Index
..................
Long
185
14,834,225
3/20/26
205,437
Russell
2000
E-Mini
Index
......................
Short
7
922,145
3/20/26
(24,540)
S&P
500
E-Mini
Index
.........................
Long
19
6,544,550
3/20/26
(37,504)
Interest
rate
contracts
Canada
10
Year
Bonds
........................
Long
104
9,365,756
6/19/26
44,600
Euro-BTP
..................................
Long
33
4,790,265
3/06/26
27,456
Euro-Bund
.................................
Long
123
18,927,211
3/06/26
144,320
Euro-OAT
..................................
Long
33
4,831,988
3/06/26
33,284
Japan
10
Year
Bonds
.........................
Long
21
17,858,035
3/13/26
46,132
Long
Gilt
...................................
Long
53
6,691,136
6/26/26
76,865
U.S.
Treasury
10
Year
Notes
....................
Short
1,763
200,651,438
6/18/26
(1,108,594)
U.S.
Treasury
10
Year
Ultra
Notes
................
Short
72
8,404,875
6/18/26
(47,366)
U.S.
Treasury
2
Year
Notes
.....................
Long
282
59,015,110
6/30/26
106,296
U.S.
Treasury
5
Year
Notes
.....................
Long
749
82,495,328
6/30/26
289,696
U.S.
Treasury
Long
Bonds
.....................
Long
671
79,492,531
6/18/26
610,371
U.S.
Treasury
Ultra
Bonds
......................
Long
25
3,039,844
6/18/26
25,324
Total
Futures
Contracts
......................................................................
$226,494
*
As
of
period
end.
Forward
Exchange
Contracts
Currency
Counter-
party
a
Type
Quantity
Contract
Amount
*
Settlement
Date
Unrealized
Appreciation
Unrealized
Depreciation
a
a
a
a
a
a
a
a
OTC
Forward
Exchange
Contracts
British
Pound
......
BOFA
Sell
355,200
477,095
3/17/26
$
—
$
(1,604)
British
Pound
......
BZWS
Buy
103,100
138,479
3/17/26
467
—
British
Pound
......
GSCO
Sell
13,400
17,998
3/17/26
—
(61)
British
Pound
......
MSCO
Buy
163,800
219,414
3/17/26
1,337
—
British
Pound
......
SSBT
Buy
53,100
70,893
3/17/26
670
—
British
Pound
......
TDOM
Sell
69,500
92,789
3/17/26
—
(875)
Danish
Krone
......
BOFA
Buy
164,900
26,099
3/17/26
1
—
Danish
Krone
......
BZWS
Sell
13,000
2,058
3/17/26
—
—
Danish
Krone
......
CITI
Sell
99,500
15,750
3/17/26
1
—
Danish
Krone
......
MSCO
Sell
1,309,500
207,461
3/17/26
195
—
Danish
Krone
......
SSBT
Sell
65,100
10,287
3/17/26
—
(17)
Danish
Krone
......
UBSW
Sell
259,100
40,944
3/17/26
—
(66)
Euro
.............
BOFA
Sell
226,000
266,915
3/17/26
—
(326)
Euro
.............
BZWS
Sell
406,000
479,969
3/17/26
100
(220)
Euro
.............
CITI
Sell
30,200
35,700
3/17/26
—
(11)
Euro
.............
GSCO
Sell
12,600
14,882
3/17/26
—
(18)
Euro
.............
JPHQ
Sell
191,200
225,798
3/17/26
—
(293)
Euro
.............
MSCO
Buy
21,000
24,761
3/17/26
71
—
Euro
.............
SSBT
Sell
341,100
402,188
3/17/26
—
(1,158)
Euro
.............
TDOM
Buy
95,600
111,351
3/17/26
1,695
—
Putnam
Asset
Allocation
Funds
Consolidated
Schedule
of
Investments
(unaudited)
Putnam
Multi-Asset
Income
Fund
The
accompanying
notes
are
an
integral
part
of
these
consolidated
financial
statements.
Semiannual
Report
Forward
Exchange
Contracts
(continued)
Currency
Counter-
party
a
Type
Quantity
Contract
Amount*
Settlement
Date
Unrealized
Appreciation
Unrealized
Depreciation
a
a
a
a
a
a
a
a
OTC
Forward
Exchange
Contracts
(continued)
Euro
.............
TDOM
Sell
327,700
389,998
3/17/26
$
2,498
$
—
Euro
.............
UBSW
Sell
124,800
147,149
3/17/26
—
(425)
Norwegian
Krone
...
MSCO
Sell
466,200
45,952
3/17/26
—
(3,075)
Norwegian
Krone
...
SSBT
Sell
487,800
48,079
3/17/26
—
(3,219)
Norwegian
Krone
...
TDOM
Buy
65,700
6,455
3/17/26
454
—
Norwegian
Krone
...
TDOM
Sell
67,900
6,693
3/17/26
—
(448)
Swedish
Krona
.....
BOFA
Sell
15,400
1,674
3/17/26
—
(33)
Swedish
Krona
.....
BZWS
Buy
93,300
10,143
3/17/26
201
—
Swedish
Krona
.....
MSCO
Buy
27,000
2,922
3/17/26
71
—
Swedish
Krona
.....
SSBT
Buy
1,897,400
205,344
3/17/26
5,006
—
Swedish
Krona
.....
TDOM
Buy
408,200
44,174
3/17/26
1,080
—
Swedish
Krona
.....
TDOM
Sell
306,200
33,132
3/17/26
—
(814)
Swiss
Franc
.......
BOFA
Buy
53,600
68,233
3/17/26
1,600
—
Swiss
Franc
.......
BZWS
Buy
4,200
5,347
3/17/26
125
—
Swiss
Franc
.......
MSCO
Buy
89,800
113,997
3/17/26
2,997
—
Swiss
Franc
.......
UBSW
Buy
36,300
46,068
3/17/26
1,225
—
Australian
Dollar
....
BOFA
Buy
82,600
55,188
4/15/26
3,583
—
Australian
Dollar
....
CITI
Buy
39,500
26,392
4/15/26
1,713
—
Australian
Dollar
....
MSCO
Sell
161,100
108,259
4/15/26
—
(6,365)
Australian
Dollar
....
TDOM
Buy
149,300
100,334
4/15/26
5,894
—
Australian
Dollar
....
UBSW
Sell
32,100
21,571
4/15/26
—
(1,268)
Israeli
New
Shekel
..
UBSW
Buy
213,800
68,152
4/15/26
134
—
Hong
Kong
Dollar
...
BZWS
Buy
3,600
462
5/13/26
—
—
Hong
Kong
Dollar
...
CITI
Buy
456,500
58,579
5/13/26
—
(55)
Hong
Kong
Dollar
...
GSCO
Sell
399,900
51,324
5/13/26
56
—
Hong
Kong
Dollar
...
MSCO
Sell
193,200
24,794
5/13/26
25
—
Hong
Kong
Dollar
...
UBSW
Sell
709,600
91,055
5/13/26
83
—
Japanese
Yen
......
BZWS
Sell
5,612,700
36,058
5/13/26
—
(111)
Japanese
Yen
......
CITI
Sell
10,537,300
67,685
5/13/26
—
(220)
Japanese
Yen
......
MSCO
Buy
14,221,900
91,372
5/13/26
277
—
Japanese
Yen
......
SSBT
Sell
1,422,900
9,141
5/13/26
—
(28)
Japanese
Yen
......
TDOM
Buy
25,928,000
166,553
5/13/26
533
—
Japanese
Yen
......
UBSW
Buy
5,460,800
35,083
5/13/26
108
—
Singapore
Dollar
....
BZWS
Buy
130,400
103,229
5/13/26
392
—
Singapore
Dollar
....
JPHQ
Buy
4,800
3,800
5/13/26
14
—
Singapore
Dollar
....
MSCO
Buy
39,500
31,272
5/13/26
116
—
Singapore
Dollar
....
SSBT
Buy
12,400
9,816
5/13/26
37
—
Singapore
Dollar
....
UBSW
Sell
69,200
54,776
5/13/26
—
(213)
Total
Forward
Exchange
Contracts
...................................................
$32,759
$(20,923)
Net
unrealized
appreciation
(depreciation)
............................................
$11,836
*
In
U.S.
dollars
unless
otherwise
indicated.
a
May
be
comprised
of
multiple
contracts
with
the
same
counterparty,
currency
and
settlement
date.
Putnam
Asset
Allocation
Funds
Consolidated
Schedule
of
Investments
(unaudited)
Putnam
Multi-Asset
Income
Fund
Semiannual
Report
The
accompanying
notes
are
an
integral
part
of
these
consolidated
financial
statements.
At
February
28,
2026,
the
Fund
had
the
following
interest
rate
swap
contracts
outstanding.
See
Note
1
(
e
).
Interest
Rate
Swap
Contracts
Description
Payment
Frequency
Maturity
Date
Notional
Amount
*
Value
Upfront
Payments
(Receipts)
Unrealized
Appreciation
(Depreciation)
aa
aa
aa
aa
Centrally
Cleared
Swap
Contracts
Receive
Floating
1-day
SOFR
..............
Annual
Pay
Fixed
3.32%
....
Annual
3/18/28
205,000
$
(441)
$
10
$
(451)
Receive
Floating
1-day
SOFR
..............
Annual
Pay
Fixed
3.47%
....
Annual
3/18/31
649,000
(6,989)
(342)
(6,647)
Receive
Floating
1-day
SOFR
..............
Annual
Pay
Fixed
3.77%
....
Annual
3/18/36
1,743,000
(33,938)
(24,378)
(9,560)
Receive
Fixed
4.12%
..
Annual
Pay
Floating
1-day
SOFR
............
Annual
3/18/56
2,732,000
105,413
70,595
34,818
Total
Interest
Rate
Swap
Contracts
.................................
$64,045
$
45,885
$18,160
*
In
U.S.
dollars
unless
otherwise
indicated.
See
Note
8
regarding
other
derivative
information.
See
A
bbreviations
on
page
85
.
Putnam
Asset
Allocation
Funds
Consolidated
Financial
Statements
Consolidated
Statement
of
Assets
and
Liabilities*
February
28,
2026
(unaudited)
The
accompanying
notes
are
an
integral
part
of
these
consolidated
financial
statements.
Semiannual
Report
Putnam
Multi-
Asset
Income
Fund
Assets:
Investments
in
securities:
Cost
-
Unaffiliated
issuers
...................................................................
$691,276,588
Cost
-
Non-controlled
affiliates
(Note
3
g
)
........................................................
1,117,672
Value
-
Unaffiliated
issuers
..................................................................
$711,898,165
Value
-
Non-controlled
affiliates
(Note
3
g
)
.......................................................
1,117,672
Cash
....................................................................................
278,545,439
Receivables:
Investment
securities
sold
...................................................................
126,340
Receivable
for
sales
of
TBA
securities
(Note
1
d
)
..................................................
6,599,878
Capital
shares
sold
........................................................................
9,716,632
Dividends
and
interest
.....................................................................
4,279,663
Deposits
with
brokers
for:
Centrally
cleared
swap
contracts
............................................................
190,563
Variation
margin
on
futures
contracts
...........................................................
544,430
Unrealized
appreciation
on
OTC
forward
exchange
contracts
..........................................
32,759
Prepaid
expenses
..........................................................................
159,738
Other
assets
..............................................................................
56
Total
assets
..........................................................................
1,013,211,335
Liabilities:
Payables:
Investment
securities
purchased
..............................................................
12,872,368
Payable
for
purchases
of
TBA
securities
(Note
1
d
)
................................................
131,748,856
Capital
shares
redeemed
...................................................................
351,135
Management
fees
.........................................................................
77,774
Administrative
fees
........................................................................
147
Distribution
fees
..........................................................................
32,050
Transfer
agent
fees
........................................................................
77,693
Trustees'
fees
and
expenses
.................................................................
166,951
Variation
margin
on
centrally
cleared
swap
contracts
...............................................
23,959
Unrealized
depreciation
on
OTC
forward
exchange
contracts
..........................................
20,923
TBA
sale
commitments,
at
value
(proceeds
$6,599,878
)
(Note
1d)
.....................................
6,629,715
Accrued
expenses
and
other
liabilities
...........................................................
116,227
Total
liabilities
.........................................................................
152,117,798
Net
assets,
at
value
.................................................................
$861,093,537
Net
assets
consist
of:
Paid-in
capital
.............................................................................
$916,452,664
Total
distributable
earnings
(losses)
.............................................................
(55,359,127)
Net
assets,
at
value
.................................................................
$861,093,537
Putnam
Asset
Allocation
Funds
Consolidated
Financial
Statements
Consolidated
Statement
of
Assets
and
Liabilities*
(continued)
February
28,
2026
(unaudited)
Semiannual
Report
The
accompanying
notes
are
an
integral
part
of
these
consolidated
financial
statements.
Putnam
Multi-
Asset
Income
Fund
Class
A:
Net
assets,
at
value
.......................................................................
$151,279,507
Shares
outstanding
........................................................................
13,082,044
Net
asset
value
per
share
a,b
..................................................................
$11.56
Maximum
offering
price
per
share
(net
asset
value
per
share
÷
96.00%)
b
................................
$12.04
Class
C:
Net
assets,
at
value
.......................................................................
$3,322,264
Shares
outstanding
........................................................................
287,044
Net
asset
value
and
maximum
offering
price
per
share
a,b
............................................
$11.57
Class
P:
Net
assets,
at
value
.......................................................................
$677,124,239
Shares
outstanding
........................................................................
58,475,673
Net
asset
value
and
maximum
offering
price
per
share
b
.............................................
$11.58
Class
R:
Net
assets,
at
value
.......................................................................
$1,653,884
Shares
outstanding
........................................................................
143,000
Net
asset
value
and
maximum
offering
price
per
share
b
.............................................
$11.57
Class
R5:
Net
assets,
at
value
.......................................................................
$12,404
Shares
outstanding
........................................................................
1,072
Net
asset
value
and
maximum
offering
price
per
share
b
.............................................
$11.57
Class
R6:
Net
assets,
at
value
.......................................................................
$1,048,074
Shares
outstanding
........................................................................
90,582
Net
asset
value
and
maximum
offering
price
per
share
b
.............................................
$11.57
Class
Y:
Net
assets,
at
value
.......................................................................
$26,653,165
Shares
outstanding
........................................................................
2,303,197
Net
asset
value
and
maximum
offering
price
per
share
b
.............................................
$11.57
*
Consolidated
financial
statement.
See
Note
1(g).
a
Redemption
price
is
equal
to
net
asset
value
less
contingent
deferred
sales
charges,
if
applicable.
b
Net
asset
value
per
share
may
not
recalculate
due
to
rounding.
Putnam
Asset
Allocation
Funds
Consolidated
Financial
Statements
Consolidated
Statement
of
Operations*
for
the
six
months
ended
February
28,
2026
(unaudited)
The
accompanying
notes
are
an
integral
part
of
these
consolidated
financial
statements.
Semiannual
Report
Putnam
Multi-
Asset
Income
Fund
Investment
income:
Dividends:
(net
of
foreign
taxes
of
$12,222)
Unaffiliated
issuers
........................................................................
$747,167
Non-controlled
affiliates
(Note
3
g
)
.............................................................
305,814
Interest:
Unaffiliated
issuers:
Paydown
gain
(loss)
.....................................................................
259,852
Paid
in
cash
a
...........................................................................
3,978,919
Total
investment
income
...................................................................
5,291,752
Expenses:
Management
fees
(Note
3
a
)
...................................................................
533,643
Administrative
fees
(Note
3
b
)
..................................................................
1,441
Distribution
fees:
(Note
3c
)
Class
A
................................................................................
184,375
Class
C
................................................................................
17,452
Class
R
................................................................................
4,001
Transfer
agent
fees:
(Note
3e
)
Class
A
................................................................................
109,923
Class
C
................................................................................
2,620
Class
P
................................................................................
2,932
Class
R
................................................................................
1,192
Class
R5
...............................................................................
9
Class
R6
...............................................................................
214
Class
Y
................................................................................
18,926
Custodian
fe
es
.............................................................................
4,672
Reports
to
shareholders
fees
..................................................................
30,132
Registration
and
filing
fees
....................................................................
42,940
Professional
fees
...........................................................................
69,054
Trustees'
fees
and
expenses
(Note
3
f
)
...........................................................
4,208
Other
....................................................................................
18,931
Total
expenses
.........................................................................
1,046,665
Expense
reductions
(Note
4
)
...............................................................
(6,671)
Expenses
waived/paid
by
affiliates
(Note
3
g
and
3
h
)
..............................................
(205,975)
Net
expenses
.........................................................................
834,019
Net
investment
income
................................................................
4,457,733
Putnam
Asset
Allocation
Funds
Consolidated
Financial
Statements
Consolidated
Statement
of
Operations*
(continued)
for
the
six
months
ended
February
28,
2026
(unaudited)
Semiannual
Report
The
accompanying
notes
are
an
integral
part
of
these
consolidated
financial
statements.
Putnam
Multi-
Asset
Income
Fund
Realized
and
unrealized
gains
(losses):
Net
realized
gain
(loss)
from:
Investments:
Unaffiliated
issuers
......................................................................
3,571,094
Foreign
currency
transactions
................................................................
68
Forward
exchange
contracts
.................................................................
(12,408)
Futures
contracts
.........................................................................
164,582
TBA
sale
commitments
.....................................................................
(48,725)
Swap
contracts
...........................................................................
894
Net
realized
gain
(loss)
..................................................................
3,675,505
Net
change
in
unrealized
appreciation
(depreciation)
on:
Investments:
Unaffiliated
issuers
......................................................................
6,215,340
Translation
of
other
assets
and
liabilities
denominated
in
foreign
currencies
..............................
(255)
Forward
exchange
contracts
.................................................................
25,920
Futures
contracts
.........................................................................
281,894
TBA
sale
commitments
.....................................................................
(28,017)
Swap
contracts
...........................................................................
34,339
Net
change
in
unrealized
appreciation
(depreciation)
............................................
6,529,221
Net
realized
and
unrealized
gain
(loss)
............................................................
10,204,726
Net
increase
(decrease)
in
net
assets
resulting
from
operations
..........................................
$14,662,459
*
Consolidated
financial
statement.
See
Note
1(g).
a
Includes
amortization
of
premium
and
accretion
of
discount.
Putnam
Asset
Allocation
Funds
Consolidated
Financial
Statements
Consolidated
Statements
of
Changes
in
Net
Assets
The
accompanying
notes
are
an
integral
part
of
these
consolidated
financial
statements.
Semiannual
Report
Putnam
Multi-Asset
Income
Fund
Six
Months
Ended
February
28,
2026
(unaudited)*
Year
Ended
August
31,
2025
a
Increase
(decrease)
in
net
assets:
Operations:
Net
investment
income
.................................................
$4,457,733
$9,137,528
Net
realized
gain
(loss)
.................................................
3,675,505
7,152,603
Net
change
in
unrealized
appreciation
(depreciation)
...........................
6,529,221
(1,636,243)
Net
increase
(decrease)
in
net
assets
resulting
from
operations
................
14,662,459
14,653,888
Distributions
to
shareholders:
Class
A
.............................................................
(2,604,037)
(6,036,883)
Class
C
.............................................................
(48,977)
(172,750)
Class
P
.............................................................
(1,269,133)
(1,937,247)
Class
R
.............................................................
(26,419)
(58,978)
Class
R5
............................................................
(228)
(513)
Class
R6
............................................................
(16,778)
(92,248)
Class
Y
.............................................................
(479,080)
(1,364,653)
Total
distributions
to
shareholders
..........................................
(4,444,652)
(9,663,272)
Capital
share
transactions:
(Note
2
)
Class
A
.............................................................
(480,193)
(5,977,438)
Class
C
.............................................................
(519,772)
(3,018,473)
Class
P
.............................................................
628,410,089
11,592,931
Class
R
.............................................................
35,628
(47,409)
Class
R6
............................................................
255,997
(3,127,380)
Class
Y
.............................................................
307,301
(10,043,007)
Total
capital
share
transactions
............................................
628,009,050
(10,620,776)
Net
increase
(decrease)
in
net
assets
...................................
638,226,857
(5,630,160)
Net
assets:
Beginning
of
period
.....................................................
222,866,680
228,496,840
End
of
period
..........................................................
$861,093,537
$222,866,680
*
Consolidated
financial
statement
.
See
Note
1(g).
a
Includes
the
consolidated
operations
of
Franklin
Multi-Asset
Income
Ltd.
from
July
7,
2025
through
August
31,
2025.
See
Note
1(g).
Putnam
Asset
Allocation
Funds
Notes
to
Consolidated
Financial
Statements
(unaudited)
Putnam
Multi-Asset
Income
Fund
1.
Organization
and
Significant
Accounting
Policies
Putnam
Asset
Allocation
Funds (Trust)
is
registered
under
the
Investment
Company
Act
of
1940
(1940
Act)
as
an
open-end
management
investment
company,
consisting
of four
separate
funds.
The
Trust
follows
the
accounting
and
reporting
guidance
in
Financial
Accounting
Standards
Board
(FASB)
Accounting
Standards
Codification
Topic
946,
Financial
Services
–
Investment
Companies
(ASC
946)
and applies
the
specialized
accounting
and
reporting
guidance
in
U.S.
Generally
Accepted
Accounting
Principles
(U.S.
GAAP),
including,
but
not
limited
to,
ASC
946.
Putnam
Multi-Asset
Income
Fund
(Fund)
is
included
in
this
report.
The
Fund
offers seven
classes
of
shares:
Class
A,
Class
C,
Class
P,
Class
R,
Class
R5,
Class
R6
and
Class
Y. Class
C
shares
automatically
convert
to
Class
A
shares
on
a
monthly
basis,
after
they
have
been
held
for
8
years.
Each
class
of
shares
may
differ
by
its
initial
sales
load,
contingent
deferred
sales
charges,
voting
rights
on
matters
affecting
a
single
class,
its
exchange
privilege
and
fees
due
to
differing
arrangements
for
distribution
and
transfer
agent
fees.
Effective
July
15,
2026,
Putnam
Multi-Asset
Income
Fund
was
renamed
Franklin
Multi-Asset
Income
Fund.
The
following
summarizes
the
Fund
's
significant
accounting
policies.
a.
Financial
Instrument
Valuation
The
Fund's
investments
in
financial
instruments
are
carried
at
fair
value
daily.
Fair
value
is
the
price
that
would
be
received
to
sell
an
asset
or
paid
to
transfer
a
liability
in
an
orderly
transaction
between
market
participants
on
the
measurement
date.
The
Fund
calculates
the
net
asset
value
(NAV)
per
share
each business
day as
of
4
p.m.
Eastern
time
or
the
regularly
scheduled
close
of
the
New
York
Stock
Exchange
(NYSE),
whichever
is
earlier.
Under
compliance
policies
and
procedures
approved
by
the Trust's
Board
of
Trustees
(the
Board),
the
Board
has
designated
the
Fund’s
investment
manager
as
the
valuation
designee
and
has
responsibility
for
oversight
of
valuation.
The
investment
manager
is
assisted
by
the
Fund’s
administrator
in
performing
this
responsibility,
including
leading
the
cross-
functional
Valuation
Committee
(VC).
The
Fund
may
utilize
independent
pricing
services,
quotations
from
securities
and
financial
instrument
dealers,
and
other
market
sources
to
determine
fair
value.
Equity
securities,
exchange
traded
funds,
and
derivative
financial
instruments
listed
on
an
exchange
or
on
the
NASDAQ
National
Market
System
are
valued
at
the
last
quoted
sale
price
or
the
official
closing
price
of
the
day,
respectively.
Over-the-counter
(OTC)
securities
are
valued
within
the
range
of
the
most
recent
quoted
bid
and
ask
prices.
Securities
that
trade
in
multiple
markets
or
on
multiple
exchanges
are
valued
according
to
the
broadest
and
most
representative
market.
Certain
equity
securities
are
valued
based
upon
fundamental
characteristics
or
relationships
to
similar
securities.
Debt
securities
generally
trade
in
the OTC
market
rather
than
on
a
securities
exchange.
The
Fund's
pricing
services
use
multiple
valuation
techniques
to
determine
fair
value.
In
instances
where
sufficient
market
activity
exists,
the
pricing
services
may
utilize
a
market-based
approach
through
which
quotes
from
market
makers
are
used
to
determine
fair
value.
In
instances
where
sufficient
market
activity
may
not
exist
or
is
limited,
the
pricing
services
also
utilize
proprietary
valuation
models
which
may
consider
market
characteristics
such
as
benchmark
yield
curves,
credit
spreads,
estimated
default
rates,
anticipated
market
interest
rate
volatility,
coupon
rates,
anticipated
timing
of
principal
repayments,
underlying
collateral,
and
other
unique
security
features
in
order
to
estimate
the
relevant
cash
flows,
which
are
then
discounted
to
calculate
the
fair
value.
Securities
denominated
in
a
foreign
currency
are
converted
into
their
U.S.
dollar
equivalent
at
the
foreign
exchange
rate
in
effect
at
4
p.m.
Eastern
time
on
the
date
that
the
values
of
the
foreign
debt
securities
are
determined.
Investments
in open-end mutual
funds
are
valued
at
the
closing
NAV.
Certain
derivative
financial
instruments
are
centrally
cleared
or
trade
in
the
OTC
market.
The
Fund's
pricing
services
use
various
techniques
including
industry
standard
option
pricing
models
and
proprietary
discounted
cash
flow
models
to
determine
the
fair
value
of
those
instruments.
The
Fund's
net
benefit
or
obligation
under
the
derivative
contract,
as
measured
by
the
fair
value
of
the
contract,
is
included
in
net
assets.
The
Fund
has
procedures
to
determine
the
fair
value
of
financial
instruments
for
which
market
prices
are
not
reliable
or
readily
available.
Under
these
procedures,
the Fund
primarily
employs
a
market-based
approach
which
may
use
related
or
comparable
assets
or
liabilities,
recent
transactions,
market
multiples,
and
other
relevant
Putnam
Asset
Allocation
Funds
Notes
to
Consolidated
Financial
Statements
(unaudited)
Putnam
Multi-Asset
Income
Fund
(continued)
information
for
the
investment
to
determine
the
fair
value
of
the
investment.
An
income-based
valuation
approach
may
also
be
used
in
which
the
anticipated
future
cash
flows
of
the
investment
are
discounted
to
calculate
fair
value.
Discounts
may
also
be
applied
due
to
the
nature
or
duration
of
any
restrictions
on
the
disposition
of
the
investments.
Due
to
the
inherent
uncertainty
of
valuations
of
such
investments,
the
fair
values
may
differ
significantly
from
the
values
that
would
have
been
used
had
an
active
market
existed.
Trading
in
securities
on
foreign
securities
stock
exchanges
and
OTC
markets
may
be
completed
before
4
p.m.
Eastern
time.
In
addition,
trading
in
certain
foreign
markets
may
not
take
place
on
every
Fund's
business
day. Events
can occur
between
the
time
at
which
trading
in
a
foreign
security
is
completed
and
4
p.m.
Eastern
time
that
might
call
into
question
the
reliability
of
the
value
of
a
portfolio
security
held
by
the
Fund.
As
a
result,
differences
may
arise
between
the
value
of
the
Fund's
portfolio
securities
as
determined
at
the
foreign
market
close
and
the
latest
indications
of
value
at
4
p.m.
Eastern
time. In
order
to
minimize
the
potential
for
these
differences,
an
independent
pricing
service
may
be
used
to
adjust
the
value
of
the
Fund's
portfolio
securities
to
the
latest
indications
of
fair
value
at
4
p.m.
Eastern
time.
At
February
28,
2026,
certain
securities
may
have
been
fair
valued
using
these
procedures,
in
which
case
the
securities
were
categorized
as
Level
2
within
the
fair
value
hierarchy
(referred
to
as
“market
level
fair
value”).
See
the
Fair
Value
Measurements
note
for
more
information.
When
the
last
day
of
the
reporting
period
is
a
non-business
day,
certain
foreign
markets
may
be
open
on
those
days
that
the
Fund's
NAV
is
not
calculated,
which
could
result
in
differences
between
the
value
of
the
Fund's
portfolio
securities
on
the
last
business
day
and
the
last
calendar
day
of
the
reporting
period.
Any
security
valuation
changes
due
to
an
open
foreign
market
are
adjusted
and
reflected
by
the
Fund
for
financial
reporting
purposes.
b.
Foreign
Currency
Translation
Portfolio
securities
and
other
assets
and
liabilities
denominated
in
foreign
currencies
are
translated
into
U.S.
dollars
based
on
the
exchange
rate
of
such
currencies
against
U.S.
dollars
on
the
date
of
valuation.
The
Fund
may
enter
into
foreign
currency
exchange
contracts
to
facilitate
transactions
denominated
in
a
foreign
currency.
Purchases
and
sales
of
securities,
income
and
expense
items
denominated
in
foreign
currencies
are
translated
into
U.S.
dollars
at
the
exchange
rate
in
effect
on
the
transaction
date.
Portfolio
securities
and
assets
and
liabilities
denominated
in
foreign
currencies
contain
risks
that
those
currencies
will
decline
in
value
relative
to
the
U.S.
dollar.
Occasionally,
events
may
impact
the
availability
or
reliability
of
foreign
exchange
rates
used
to
convert
the
U.S.
dollar
equivalent
value.
If
such
an
event
occurs,
the
foreign
exchange
rate
will
be
valued
at
fair
value
using
procedures
established
and
approved
by
the
Board.
The
Fund
does
not
separately
report
the
effect
of
changes
in
foreign
exchange
rates
from
changes
in
market
prices
on
securities
held.
Such
changes
are
included
in
net
realized
and
unrealized
gain
or
loss
from
investments
in
the
Consolidated
Statement of
Operations.
Realized
foreign
exchange
gains
or
losses
arise
from
sales
of
foreign
currencies,
currency
gains
or
losses
realized
between
the
trade
and
settlement
dates
on
securities
transactions
and
the
difference
between
the
recorded
amounts
of
dividends,
interest,
and
foreign
withholding
taxes
and
the
U.S.
dollar
equivalent
of
the
amounts
actually
received
or
paid.
Net
unrealized
foreign
exchange
gains
and
losses
arise
from
changes
in
foreign
exchange
rates
on
foreign
denominated
assets
and
liabilities
other
than
investments
in
securities
held
at
the
end
of
the
reporting
period.
c.
Stripped
Securities
The
Fund
may
invest
in
stripped
securities
which
represent
a
participation
in
securities
that
may
be
structured
in
classes
with
rights
to
receive
different
portions
of
the
interest
and
principal.
Interest-only
securities
receive
all
of
the
interest
and
principal-only
securities
receive
all
of
the
principal.
If
the
interest
only
securities
experience
greater
than
anticipated
prepayments
of
principal,
the
Fund
may
fail
to
recoup
fully
its
initial
investment
in
these
securities.
Conversely,
principal-
only
securities
increase
in
value
if
prepayments
are
greater
than
anticipated
and
decline
if
prepayments
are
slower
than
anticipated.
The
fair
value
of
these
securities
is
highly
sensitive
to
changes
in
interest
rates.
1.
Organization
and
Significant
Accounting
Policies
(continued)
a.
Financial
Instrument
Valuation
(continued)
Putnam
Asset
Allocation
Funds
Notes
to
Consolidated
Financial
Statements
(unaudited)
Putnam
Multi-Asset
Income
Fund
(continued)
d.
Securities
Purchased
on
a
When-Issued,
Forward Commitment or
Delayed
Delivery
Basis
and
TBA
Basis
The
Fund
may
purchase
securities
on
a when-issued,
forward
commitment
or
delayed
delivery
and to-be-
announced
(TBA)
basis,
with
payment
and
delivery
scheduled
for
a
future
date.
These
transactions
are
subject
to
market
fluctuations
and
are
subject
to
the
risk
that
the
value
at
delivery
may
be
more
or
less
than
the
trade
date
purchase
price.
Although
the
Fund
will
generally
purchase
these
securities
with
the
intention
of
holding
the
securities, it
may
sell
the
securities
before
the
settlement
date.
The
Fund
may
also
enter
into
TBA
sale
commitments
to
hedge
its
portfolio
positions,
to
sell
mortgage-backed
securities
it
owns
under
delayed
delivery
arrangements
or
to
take
a
short
position
in
mortgage-backed
securities.
Proceeds
of
TBA
sale
commitments
are
not
received
until
the
contractual
settlement
date.
During
the
time
a
TBA
sale
commitment
is
outstanding,
either
equivalent
deliverable
securities
or
an
offsetting
TBA
purchase
commitment
deliverable
on
or
before
the
sale
commitment
date
are
held
as
“cover”
for
the
transaction,
or
other
liquid
assets
in
an
amount
equal
to
the
notional
value
of
the
TBA
sale
commitment
are
segregated.
If
the
TBA
sale
commitment
is
closed
through
the
acquisition
of
an
offsetting
TBA
purchase
commitment,
the
Fund
realizes
a
gain
or
loss.
If
the
Fund
delivers
securities
under
the
commitment,
the
Fund
realizes
a
gain
or
a
loss
from
the
sale
of
the
securities
based
upon
the
unit
price
established
at
the
date
the
commitment
was
entered
into.
TBA
commitments,
which
are
accounted
for
as
purchase
and
sale
transactions,
may
be
considered
securities
themselves,
and
involve
a
risk
of
loss
due
to
changes
in
the
value
of
the
security
prior
to
the
settlement
date
as
well
as
the
risk
that
the
counterparty
to
the
transaction
will
not
perform
its
obligations.
Counterparty
risk
is
mitigated
by
having
a
master
agreement
between
the
Fund
and
the
counterparty.
Unsettled
TBA
commitments
are
valued
at
their
fair
value
according
to
the
procedures
described
in
the
Financial
Instrument
Valuation
note.
The
contract
is
marked
to
market
daily
and
the
change
in
fair
value
is
recorded
by
the
Fund
as
an
unrealized
gain
or
loss.
Based
on
market
circumstances,
the
investment
manager
will
determine
whether
to
take
delivery
of
the
underlying
securities
or
to
dispose
of
the
TBA
commitments
prior
to
settlement.
e.
Derivative
Financial
Instruments
The
Fund invested
in
derivative
financial
instruments
in
order
to
manage
risk
or
gain
exposure
to
various
other
investments
or
markets.
Derivatives
are
financial
contracts
based
on
an
underlying
or
notional
amount,
require
no
initial
investment
or
an
initial
net
investment
that
is
smaller
than
would
normally
be
required
to
have
a
similar
response
to
changes
in
market
factors,
and
require
or
permit
net
settlement.
Derivatives
contain
various
risks
including
the
potential
inability
of
the
counterparty
to
fulfill
their
obligations
under
the
terms
of
the
contract,
the
potential
for
an
illiquid
secondary
market,
and/or
the
potential
for
market
movements
which
expose
the
Fund
to
gains
or
losses
in
excess
of
the
amounts
shown
in
the
Consolidated
Statement
of
Assets
and
Liabilities.
Realized
gain
and
loss
and
unrealized
appreciation
and
depreciation
on
these
contracts
for
the
period
are
included
in
the
Consolidated
Statement
of
Operations.
Derivative
counterparty
credit
risk
is
managed
through
a
formal
evaluation
of
the
creditworthiness
of
all
potential
counterparties.
The
Fund
attempts
to
reduce
its
exposure
to
counterparty
credit
risk
on
OTC
derivatives,
whenever
possible,
by
entering
into
International
Swaps
and
Derivatives
Association
(ISDA)
master
agreements
with
certain
counterparties.
These
agreements
contain
various
provisions,
including
but
not
limited
to
collateral
requirements,
events
of
default,
or
early
termination.
Termination
events
applicable
to
the
counterparty
include
certain
deteriorations
in
the
credit
quality
of
the
counterparty.
Termination
events
applicable
to
the
Fund
include
failure
of
the
Fund
to
maintain
certain
net
asset
levels
and/
or
limit
the
decline
in
net
assets
over
various
periods
of
time.
In
the
event
of
default
or
early
termination,
the
ISDA
master
agreement
gives
the
non-defaulting
party
the
right
to
net
and
close-out
all
transactions
traded,
whether
or
not
arising
under
the
ISDA
agreement,
to
one
net
amount
payable
by
one
counterparty
to
the
other.
However,
absent
an
event
of
default
or
early
termination,
OTC
derivative
assets
and
liabilities
are
presented
gross
and
not
offset
in
the
Consolidated
Statement
of
Assets
and
Liabilities.
Early
termination
by
the
counterparty
may
result
in
an
immediate
payment
by
the
Fund
of
any
net
liability
owed
to
that
1.
Organization
and
Significant
Accounting
Policies
(continued)
Putnam
Asset
Allocation
Funds
Notes
to
Consolidated
Financial
Statements
(unaudited)
Putnam
Multi-Asset
Income
Fund
(continued)
counterparty
under
the
ISDA
agreement.
At
February
28,
2026,
the
Fund
had
OTC
derivatives
in
a
net
liability
position
of
$5,075.
Collateral
requirements
differ
by
type
of
derivative.
Collateral
or
initial
margin
requirements
are
set
by
the
broker
or
exchange
clearing
house
for
exchange
traded
and
centrally
cleared
derivatives.
Initial
margin
deposited
is
held
at
the
exchange
or
at
the
broker and
can
be
in
the
form
of
cash
and/or
securities.
For
OTC
derivatives
traded
under
an
ISDA
master
agreement,
posting
of
collateral
is
required
by
either
the
Fund
or
the
applicable
counterparty
if
the
total
net
exposure
of
all
OTC
derivatives
with
the
applicable
counterparty
exceeds
the
minimum
transfer
amount,
which
typically
ranges
from
$100,000
to
$250,000,
and
can
vary
depending
on
the
counterparty
and
the
type
of agreement.
Generally,
collateral
is
determined
at
the
close
of
Fund
business
each
day
and
any
additional
collateral
required
due
to
changes
in
derivative
values
may
be
delivered
by
the
Fund
or
the
counterparty
the
next
business
day,
or
within
a
few
business
days.
Collateral
pledged
and/or
received
by
the
Fund
for
OTC
derivatives,
if
any,
is
held
in
segregated
accounts
with
the
Fund's
custodian/counterparty
broker
and
can
be
in
the
form
of
cash
and/or
securities.
Unrestricted
cash
may
be
invested
according
to
the
Fund's
investment
objectives.
To
the
extent
that
the
amounts
due
to
the
Fund
from
its
counterparties
are
not
subject
to
collateralization
or
are
not
fully
collateralized,
the
Fund
bears
the
risk
of
loss
from
counterparty
non-performance.
The
Fund entered
into
OTC
forward
exchange
contracts
primarily
to
manage
and/or
gain exposure
to
certain
foreign
currencies.
A
forward
exchange
contract
is
an
agreement
between
the
Fund
and
a
counterparty
to
buy
or
sell
a
foreign
currency at
a
specific
exchange
rate
on
a
future
date.
Forward
exchange
contracts
outstanding
at
period
end,
if
any,
are
listed
in
the
Fund's
Consolidated
Schedule
of
Investments.
The
Fund
entered
into
exchange
traded
futures
contracts
primarily
to
manage
and/or
gain
exposure
to
commodity
price, interest
rate
and
equity
price
risk.
A
futures
contract
is
an
agreement
between
the
Fund
and
a
counterparty
to
buy
or
sell
an
asset
at
a
specified
price
on
a
future
date.
Required
initial
margins
are
pledged
by
the
Fund,
and
the
daily
change
in
fair
value
is
accounted
for
as
a
variation
margin
payable
or
receivable
in
the
Consolidated
Statement
of
Assets
and
Liabilities.
Futures
contracts
outstanding
at
period
end,
if
any,
are
listed
in
the
Fund's
Consolidated
Schedule
of
Investments.
The
Fund entered
into
interest
rate
swap
contracts
primarily
to
manage
interest
rate
risk.
An
interest
rate
swap
is
an
agreement
between
the
Fund
and
a
counterparty
to
exchange
cash
flows
based
on
the
difference
between
two
interest
rates,
applied
to
a
notional
amount.
These
agreements
may
be
privately
negotiated
in
the
over-the-
counter
market
(OTC
interest
rate
swaps)
or
may
be
executed
on
a
registered
exchange
(centrally
cleared
interest
rate
swaps).
For
centrally
cleared
interest
rate
swaps,
required
initial
margins
are
pledged
by
the
Fund,
and
the
daily
change
in
fair
value
is
accounted
for
as
a
variation
margin
payable
or
receivable
in
the
Consolidated
Statement
of
Assets
and
Liabilities.
Over
the
term
of
the
contract,
contractually
required
payments
to
be
paid
and
to
be
received
are
accrued
daily
and
recorded
as
unrealized
appreciation
or
depreciation
until
the
payments
are
made,
at
which
time
they
are
realized.
Interest
rate
swap
contracts
outstanding
at
period
end,
if
any,
are
listed
in
the
Fund's
Consolidated
Schedule
of
Investments.
See
Note
8
regarding
other
derivative
information.
f.
Senior
Floating
Rate
Interests
The
Fund
invests
in
senior
secured
corporate
loans
that
pay
interest
at
rates
which
are
periodically
reset
by
reference
to
a
base
lending
rate
plus
a
spread.
These
base
lending
rates
are
generally
the
prime
rate
offered
by
a
designated
U.S.
bank
or
the
Secured
Overnight
Financing
Rate
(SOFR).
Senior
secured
corporate
loans
often
require
prepayment
of
principal
from
excess
cash
flows
or
at
the
discretion
of
the
borrower.
As
a
result,
actual
maturity
may
be
substantially
less
than
the
stated
maturity.
Senior
secured
corporate
loans
in
which
the Fund
invests
are
generally
readily
marketable,
but
may
be
subject
to
certain
restrictions
on
resale.
g.
Investments
in
Franklin
Multi-Asset
Income
Ltd.
(FT
Subsidiary)
The Fund
invests
in
certain
financial
instruments,
warrants
or
commodities
through
its
investments
in
FT
Subsidiary.
FT
Subsidiary,
a
Cayman
Islands
exempted
company
with
limited
liability,
is
a
wholly-owned
subsidiary
of
the
Fund.
FT
Subsidiary
is
able
to
invest
in
certain
financial
instruments
consistent
with
the
investment
objective
of
the
1.
Organization
and
Significant
Accounting
Policies
(continued)
e.
Derivative
Financial
Instruments
(continued)
Putnam
Asset
Allocation
Funds
Notes
to
Consolidated
Financial
Statements
(unaudited)
Putnam
Multi-Asset
Income
Fund
(continued)
Fund.
At
February
28,
2026,
FT
Subsidiary’s
investments,
as
well
as
any
other
assets
and
liabilities
of
FT
Subsidiary
are
reflected
in
the
Fund’s
Consolidated
Schedule
of
Investments
and
Consolidated
Statement
of
Assets
and
Liabilities.
All
intercompany
transactions
and
balances
have
been
eliminated.
At
February
28,
2026,
the
net
assets
of
FT
Subsidiary
were
$1,117,807,
representing 0.13% of
the
Fund's
consolidated
net
assets.
The
Fund’s
investment
in
FT
Subsidiary
is
limited
to
25%
of
consolidated
assets.
h.
Income
and
Deferred
Taxes
It
is the Fund's
policy
to
qualify
as
a
regulated
investment
company
under
the
Internal
Revenue
Code. The Fund
intends
to
distribute
to
shareholders
substantially
all
of
its
taxable
income
and
net
realized
gains
to
relieve
it
from
federal
income
and if
applicable,
excise
taxes.
As
a
result,
no
provision
for
U.S.
federal
income
taxes
is
required.
The
Fund
may
be
subject
to
foreign
taxation
related
to
income
received,
capital
gains
on
the
sale
of
securities
and
certain
foreign
currency
transactions
in
the
foreign
jurisdictions
in
which it
invests.
Foreign
taxes,
if
any,
are
recorded
based
on
the
tax
regulations
and
rates
that
exist
in
the
foreign
markets
in
which
the
Fund
invests.
In
some
cases,
the
Fund
may
be
entitled
to
reclaim
all
or
a
portion
of
such
taxes,
and
such
reclaim
amounts,
if
any,
are
reflected
as
a
dividend
receivable
in
the
Statement
of
Assets
and
Liabilities
and
dividend
income
in
the
Statement
of
Operations.
In
many
cases,
however,
the
Fund
may
not
receive
such
amounts
for
an
extended
period
of
time,
depending
on
the
country
of
investment.
When
a
capital
gain
tax
is
determined
to
apply,
the
Fund
records
an
estimated
deferred
tax
liability
in
an
amount
that
would
be
payable
if
the
securities
were
disposed
of
on
the
valuation
date.
The Fund
may
recognize
an
income
tax
liability
related
to
its
uncertain
tax
positions
under
U.S.
GAAP
when
the
uncertain
tax
position
has
a
less
than
50%
probability
that
it
will
be
sustained
upon
examination
by
the
tax
authorities
based
on
its
technical
merits.
As
of
February
28,
2026, the Fund
has
determined
that
no
tax
liability
is
required
in
its
consolidated
financial
statements
related
to
uncertain
tax
positions
for
any
open
tax
years
(or
expected
to
be
taken
in
future
tax
years).
The
Fund’s
federal
and
state
income
and
federal
excise
tax
returns
for
the
prior
three
fiscal
years
are
subject
to
examination
by
the
Internal
Revenue
Service
and
state
departments
of
revenue.
i.
Security
Transactions,
Investment
Income,
Expenses
and
Distributions
Security
transactions
are
accounted
for
on
trade
date.
Realized
gains
and
losses
on
security
transactions
are
determined
on
a
specific
identification
basis.
Interest
income
(including
interest
income
from
payment-in-kind
securities,
if
any)
and
estimated
expenses
are
accrued
daily.
Amortization
of
premium
and
accretion
of
discount
on
debt
securities
are
included
in
interest
income.
Paydown
gains
and
losses
are
recorded
separately
in
the
Consolidated
Statement
of
Operations.
Distributions
to
shareholders
are
recorded
on
the
ex-dividend
date.
Distributable
earnings
are
determined
according
to
income
tax
regulations
(tax
basis)
and
may
differ
from
earnings
recorded
in
accordance
with
U.S.
GAAP.
These
differences
may
be
permanent
or
temporary.
Permanent
differences
are
reclassified
among
capital
accounts
to
reflect
their
tax
character.
These
reclassifications
have
no
impact
on
net
assets
or
the
results
of
operations.
Temporary
differences
are
not
reclassified,
as
they
may
reverse
in
subsequent
periods.
Realized
and
unrealized
gains
and
losses
and
net
investment
income,
excluding
class
specific
expenses,
are
allocated
daily
to
each
class
of
shares
based
upon
the
relative
proportion
of
net
assets
of
each
class.
Differences
in
per
share
distributions
by
class
are
generally
due
to
differences
in
class
specific
expenses.
Common
expenses
incurred
by
the
Trust
are
allocated
among
the
Funds
based
on
the
ratio
of
net
assets
of
each
Fund
to
the
combined
net
assets
of
the
Trust
or
based
on
the
ratio
of
number
of
shareholders
of
each
Fund
to
the
combined
number
of
shareholders
of
the
Trust.
Fund
specific
expenses
are
charged
directly
to
the
Fund
that
incurred
the
expense.
j.
Accounting
Estimates
The
preparation
of
financial
statements
in
accordance
with
U.S.
GAAP
requires
management
to
make
estimates
and
assumptions
that
affect
the
reported
amounts
of
assets
and
liabilities
at
the
date
of
the
financial
statements
and
the
amounts
of
income
and
expenses
during
the
reporting
period.
Actual
results
could
differ
from
those
estimates.
1.
Organization
and
Significant
Accounting
Policies
(continued)
g.
Investments
in
Franklin
Multi-Asset
Income
Ltd.
(FT
Subsidiary)
(continued)
Putnam
Asset
Allocation
Funds
Notes
to
Consolidated
Financial
Statements
(unaudited)
Putnam
Multi-Asset
Income
Fund
(continued)
k.
Guarantees
and
Indemnifications
Under
the Trust's
organizational
documents,
its
officers
and trustees
are
indemnified
by
the Trust against
certain
liabilities
arising
out
of
the
performance
of
their
duties
to
the
Trust.
Additionally,
in
the
normal
course
of
business,
the Trust,
on
behalf
of
the
Fund, enters
into
contracts
with
service
providers
that
contain
general
indemnification
clauses.
The Trust's
maximum
exposure
under
these
arrangements
is
unknown
as
this
would
involve
future
claims
that
may
be
made
against
the Trust
that
have
not
yet
occurred.
Currently,
the Trust
expects
the
risk
of
loss
to
be
remote.
2.
Shares
of
Beneficial
Interest
At
February
28,
2026,
there
were
an
unlimited
number
of
shares
authorized
(without
par
value).
Transactions
in
the
Fund's
shares
were
as
follows:
Six
Months
Ended
February
28,
2026
Year
Ended
August
31,
2025
Shares
Amount
Shares
Amount
Class
A
Shares:
Shares
sold
a
...................................
595,132
$6,724,151
1,160,275
$12,484,017
Shares
issued
in
reinvestment
of
distributions
..........
225,276
2,549,451
550,533
5,899,318
Shares
redeemed
...............................
(861,432)
(9,753,795)
(2,276,681)
(24,360,773)
Net
increase
(decrease)
..........................
(41,024)
$(480,193)
(565,873)
$(5,977,438)
Class
C
Shares:
Shares
sold
...................................
17,197
$194,472
30,066
$323,867
Shares
issued
in
reinvestment
of
distributions
..........
4,306
48,727
16,030
171,750
Shares
redeemed
a
..............................
(67,424)
(762,971)
(327,269)
(3,514,090)
Net
increase
(decrease)
..........................
(45,921)
$(519,772)
(281,173)
$(3,018,473)
Class
P
Shares:
Shares
sold
...................................
57,739,033
$668,818,482
4,359,398
$47,202,041
Shares
issued
in
reinvestment
of
distributions
..........
111,336
1,268,934
180,481
1,937,194
Shares
redeemed
...............................
(3,609,147)
(41,677,327)
(3,447,595)
(37,546,304)
Net
increase
(decrease)
..........................
54,241,222
$628,410,089
1,092,284
$11,592,931
Class
R
Shares:
Shares
sold
...................................
7,712
$87,278
4,975
$53,044
Shares
issued
in
reinvestment
of
distributions
..........
2,319
26,255
5,460
58,525
Shares
redeemed
...............................
(6,865)
(77,905)
(14,745)
(158,978)
Net
increase
(decrease)
..........................
3,166
$35,628
(4,310)
$(47,409)
Class
R6
Shares:
Shares
sold
...................................
26,425
$301,024
30,657
$329,123
Shares
issued
in
reinvestment
of
distributions
..........
1,464
16,589
8,561
91,725
Shares
redeemed
...............................
(5,415)
(61,616)
(331,839)
(3,548,228)
Net
increase
(decrease)
..........................
22,474
$255,997
(292,621)
$(3,127,380)
1.
Organization
and
Significant
Accounting
Policies
(continued)
Putnam
Asset
Allocation
Funds
Notes
to
Consolidated
Financial
Statements
(unaudited)
Putnam
Multi-Asset
Income
Fund
(continued)
3.
Transactions
with
Affiliates
Franklin
Resources,
Inc.
is
the
holding
company
for
various
subsidiaries
that
together
are
referred
to
as
Franklin
Templeton.
Certain
officers
and trustees
of
the Fund are
also
officers
and/or directors
of
the
following
subsidiaries:
a.
Management
Fees
The
Fund
pays Advisers
a
management
fee
(based
on
the
Fund’s
average
net
assets
and
computed
and
paid
monthly)
at
annual
rates
that
may
vary
based
on
the
average
of
the
aggregate
net
assets
of
all
open-end
mutual
funds
sponsored
by
Putnam
Management
(including
open-end
funds
managed
by
affiliates
of
Putnam
Management
that
have
been
deemed
to
be
sponsored
by
Putnam
Management
for
this
purpose)
(excluding
net
assets
of
such
funds
that
are
invested
in,
or
that
are
invested
in
by,
other
such
funds
to
the
extent
necessary
to
avoid
“double
counting”
of
those
assets).
Such
annual
rates
may
vary
as
follows:
For
the
period
ended
February
28,
2026,
the
annualized
gross
effective
investment
management
fee
rate
was 0.441%
of
the
Fund’s
average daily
net
assets.
Six
Months
Ended
February
28,
2026
Year
Ended
August
31,
2025
Shares
Amount
Shares
Amount
Class
Y
Shares:
Shares
sold
...................................
171,532
$1,954,003
187,789
$2,028,074
Shares
issued
in
reinvestment
of
distributions
..........
41,551
470,741
125,454
1,344,290
Shares
redeemed
...............................
(186,980)
(2,117,443)
(1,255,706)
(13,415,371)
Net
increase
(decrease)
..........................
26,103
$307,301
(942,463)
$(10,043,007)
a
May
include
a
portion
of
Class
C
shares
that
were
automatically
converted
to
Class
A.
Subsidiary
Affiliation
Franklin
Advisers,
Inc.
(Advisers)
Investment
manager
Franklin
Templeton
Investment
Management
Limited
(FTIML)
Subadvisor
Putnam
Investment
Management,
LLC
(Putnam
Management)
Subadvisor
Putnam
Advisory
Company,
LLC
(PAC)
Subadvisor
Franklin
Templeton
Services,
LLC
(FT
Services)
Administrative
manager
Franklin
Distributors,
LLC
(Distributors)
Principal
underwriter
Putnam
Investor
Services,
Inc.
(PSERV)
Transfer
agent
Annualized
Fee
Rate
Net
Assets
0.630%
of
the
first
$5
billion,
0.580%
of
the
next
$5
billion,
0.530%
of
the
next
$10
billion,
0.480%
of
the
next
$10
billion,
0.430%
of
the
next
$50
billion,
0.410%
of
the
next
$50
billion,
0.400%
of
the
next
$100
billion
and
0.395%
of
any
excess
thereafter.
2.
Shares
of
Beneficial
Interest
(continued)
Putnam
Asset
Allocation
Funds
Notes
to
Consolidated
Financial
Statements
(unaudited)
Putnam
Multi-Asset
Income
Fund
(continued)
Advisers
retained
Putnam
Management
as
subadvisor
for
the
Fund.
Pursuant
to
the
agreement,
Putnam
Management
provides
certain
advisory
and
related
services
to
the
Fund.
Advisers
pays
a
monthly
fee
to
Putnam
Management
based
on
the
costs
of
Putnam
Management
in
providing
these
services
to
the
Fund,
which
may
include
a
mark-up
not
to
exceed
15%
over
such
costs.
Under
a
subadvisory
agreement,
FTIML
provides
subadvisory
services
to
the
Fund.
The
subadvisory
fee
is
paid by Advisers
based
on
the
average
net
assets
managed
by
FTIML,
and
is
not
an
additional
expense
of
the
Fund.
Under
a
subadvisory
agreement,
PAC
provides
subadvisory
services
to
the
Fund.
The
subadvisory
fee
is
paid by
Advisers based
on
the
average
net
assets
managed
by
PAC,
and
is
not
an
additional
expense
of
the
Fund.
b.
Administrative
Fees
Under
an
agreement
with
Advisers,
FT
Services
provides
administrative
services
to
the
Fund.
The
fee
is
paid
by Advisers
based
on
the Fund's
average
daily
net
assets,
and
is
not
an
additional
expense
of
the
Fund.
The
Fund
reimburses
Advisers
an
allocated
amount
for
the
compensation
and
related
expenses
of
certain
officers
of
the
Fund
and
their
staff
who
provide
administrative
services
to
the
Fund.
The
aggregate
amount
of
all
such
reimbursements
is
determined
annually
by
the
Trustees.
c.
Distribution
Fees
The
Fund
has
adopted
distribution
plans
(the
Plans)
with
respect
to
the
following
share
classes
pursuant
to
Rule
12b–1
under
the
1940
Act.
The
purpose
of
the
Plans
is
to
compensate
Distributors
for
services
provided
and
expenses
incurred
in
distributing
shares
of
the
Fund.
The
Plans
provide
payments
by
the
Fund
to
Distributors
at
an
annual
rate
of
up
to
the
following
amounts
(Maximum
%)
of
the
average
net
assets
attributable
to
each
class.
The
Trustees
have
approved
payment
by
the
Fund
at
the
following
annual
rate
(Approved
%)
of
the
average
net
assets
attributable
to
each
class.
d.
Sales
Charges/Underwriting
Agreements
Front-end
sales
charges
and
contingent
deferred
sales
charges
(CDSC)
do
not
represent
expenses
of
the
Fund.
These
charges
are
deducted
from
the
proceeds
of
sales
of
fund
shares
prior
to
investment
or
from
redemption
proceeds
prior
to
remittance,
as
applicable.
Distributors
has
advised
the
Fund
of
the
following
commission
transactions
related
to
the
sales
and
redemptions
of
the
Fund's
shares
for
the
period:
Maximum
%
Approved
%
Class
A
...................................................................
0.35%
0.25%
Class
C
...................................................................
1.00%
1.00%
Class
R
...................................................................
1.00%
0.50%
Sales
charges
retained
net
of
commissions
paid
to
unaffiliated
brokers/dealers
..............................
$3,575
CDSC
retained
..............................................................................
$302
3.
Transactions
with
Affiliates
(continued)
a.
Management
Fees
(continued)
Putnam
Asset
Allocation
Funds
Notes
to
Consolidated
Financial
Statements
(unaudited)
Putnam
Multi-Asset
Income
Fund
(continued)
e.
Transfer
Agent
Fees
PSERV,
an
affiliate
of
Advisers,
provides
investor
servicing
agent
functions
to
the
Fund.
PSERV
received
fees
for
investor
servicing
for
Class
A,
Class
C,
Class
R
and
Class
Y shares
that
included
(1)
a
per
account
fee
for
each
direct
and
underlying
non-defined
contribution
account
(retail
account)
of
the
Fund;
(2)
a
specified
rate
of
the
Fund’s
assets
attributable
to
defined
contribution
plan
accounts;
and
(3)
a
specified
rate
based
on
the
average
net
assets
in
retail
accounts.
PSERV
has
agreed
that
the
aggregate
investor
servicing
fees
for
each
Fund’s
retail
and
defined
contribution
accounts
for
these
share
classes
will
not
exceed
an
annual
rate
of
0.25%
of
the
Fund’s
average
assets
attributable
to
such
accounts.
Class P
shares
paid
a
monthly
fee
based
on
the
average
net
assets
of
Class P
shares
at
an
annual
rate
of
0.01%.
Class R5
shares
paid
a
monthly
fee
based
on
the
average
net
assets
of
Class R5
shares
at
an
annual
rate
of
0.15%.
Class R6
shares
paid
a
monthly
fee
based
on
the
average
net
assets
of
Class R6
shares
at
an
annual
rate
of
0.05%.
f.
Trustee
Fees
The
Fund
has
adopted
a
Trustee
Fee
Deferral
Plan
(the
Deferral
Plan)
which
allows
the
Trustees to
defer
the
receipt
of
all
or
a
portion
of
Trustees'
fees
payable
from
July
1,
1995
through
December
31,
2023.
The
deferred
fees
remain
invested
in
certain
Putnam
funds
until
distribution
in
accordance
with
the
Deferral
Plan.
The
Fund
has
adopted
an
unfunded
noncontributory
defined
benefit
pension
plan
(the
Pension
Plan)
covering
all
Trustees
of
the
Fund
who
have
served
as
a
Trustee
for
at
least
five
years
and
were
first
elected
prior
to
2004.
Benefits
under
the
Pension
Plan
are
equal
to
50%
of
the
Trustee's
average
annual
attendance
and
retainer
fees
for
the
three
years
ended
December
31,
2005.
The
retirement
benefit
is
payable
during
a
Trustee's
lifetime,
beginning
the
year
following
retirement,
for
the
number
of
years
of
service
through
December
31,
2006.
Pension
expense
for
the
Fund
is
included
in
the
Trustees' fees
and
expenses
in
the
Consolidated
Statement
of
Operations.
Accrued
pension
liability
is
included
in
Payable
for
Trustees' fees
and
expenses
in
the
Consolidated
Statement
of
Assets
and
Liabilities.
The
Trustees
have
terminated
the
Pension
Plan
with
respect
to
any
Trustee
first
elected
after
2003.
g.
Investments
in
Affiliated
Management
Investment
Companies
The
Fund
invests
in
one
or
more
affiliated
management
investment
companies.
As
defined
in
the
1940
Act,
an
investment
is
deemed
to
be
a
“Controlled
Affiliate”
of
a
fund
when
a
fund
owns,
either
directly
or
indirectly,
25%
or
more
of
the
affiliated
fund’s
outstanding
shares
or
has
the
power
to
exercise
control
over
management
or
policies
of
such
fund.
The
Fund
does
not
invest
for
purposes
of
exercising
a
controlling
influence
over
the
management
or
policies.
Management
fees
paid
by
the
Fund
are
waived
on
assets
invested
in
the
affiliated
management
investment
companies,
as
noted
in
the
Consolidated
Statement
of
Operations,
in
an
amount
not
to
exceed
the
management
and
administrative
fees,
if
applicable, paid
directly
or
indirectly
by
each
affiliate.
During
the
period
ended
February
28,
2026,
the
Fund
held
investments
in
affiliated
management
investment
companies
as
follows:
aa
Value
at
Beginning
of
Period
Purchases
Sales
Realized
Gain
(Loss)
Net
Change
in
Unrealized
Appreciation
(Depreciation)
Value
at
End
of
Period
Number
of
Shares
Held
at
End
of
Period
Investment
Income
a
a
a
a
a
a
a
a
Putnam
Multi-Asset
Income
Fund
Non-Controlled
Affiliates
Dividends
Putnam
Government
Money
Market
Fund,
Class
G,
3.508%
.
$—
$79,852,429
$(78,734,757)
$—
$—
$1,117,672
1,117,672
$63,012
3.
Transactions
with
Affiliates
(continued)
Putnam
Asset
Allocation
Funds
Notes
to
Consolidated
Financial
Statements
(unaudited)
Putnam
Multi-Asset
Income
Fund
(continued)
h.
Waiver
and
Expense
Reimbursements
Advisers has
contractually
agreed,
through
December
30,
2026,
to
waive
fees
and/or
reimburse
the
Fund’s
expenses
to
the
extent
necessary
to
limit
the
cumulative
expenses
of
the
Fund,
exclusive
of
brokerage,
interest,
taxes,
investment-related
expenses,
extraordinary
expenses,
acquired
fund
fees
and
expenses
and
payments
under
the
Fund’s
investor
servicing
contract,
investment
management
contract
and
distribution
plans,
on
a
fiscal
year-to-date
basis
to
an
annual
rate
of
0.20%
of
the
Fund’s
average
net
assets
over
such
fiscal
year-to-date
period.
Advisers
has
also
contractually
agreed
to
waive
fees
(and,
to
the
extent
necessary,
bear
other
expenses)
of
the
Fund
through December
30,
2026,
to
the
extent
that
total
expenses
of
the
Fund
(excluding
brokerage,
interest,
taxes,
investment-
related
expenses,
payments
under
distribution
plans,
extraordinary
expenses,
payments
under
the
Fund’s
investor
servicing
contract
and
acquired
fund
fees
and
expenses,
but
including
payments
under
the
Fund’s
investment
management
contract)
would
exceed
an
annual
rate
of
0.40%
of
the
Fund’s
average
net
assets.
i.
Other
Affiliated
Transactions
At
February
28,
2026,
one
or
more
of
the
funds
in
Putnam
Target
Date
Funds
owned
5%
or
more
of
the
Fund's
outstanding
shares,
totaling
70.6%
of
the
Fund's
outstanding
shares.
4.
Expense
Offset
Arrangement
The Fund has entered
into arrangements
with PSERV
whereby
credits
realized
as
a
result
of
uninvested
cash
balances
are
used
to
reduce
a
portion
of
the
Fund's
transfer
agent
fees.
During
the
period
ended
February
28,
2026,
the
fees
were
reduced
as
noted
in
the
Statement
of
Operations.
5.
Income
Taxes
For
tax
purposes,
capital
losses
may
be
carried
over
to
offset
future
capital
gains.
At
August
31,
2025,
the
capital
loss
carryforwards
were
as
follows:
aa
Value
at
Beginning
of
Period
Purchases
Sales
Realized
Gain
(Loss)
Net
Change
in
Unrealized
Appreciation
(Depreciation)
Value
at
End
of
Period
Number
of
Shares
Held
at
End
of
Period
Investment
Income
a
a
a
a
a
a
a
a
Putnam
Multi-Asset
Income
Fund
(continued)
Putnam
Short
Term
Investment
Fund,
Class
P,
3.852%
......
11,277,701
243,247,847
(254,525,548)
—
—
—
—
242,802
Total
Affiliated
Securities
...
$11,277,701
$323,100,276
$(333,260,305)
$—
$—
$1,117,672
$305,814
Capital
loss
carryforwards
not
subject
to
expiration:
Short
term
................................................................................
$
48,624,183
Long
term
................................................................................
31,255,425
Total
capital
loss
carryforwards
...............................................................
$79,879,608
3.
Transactions
with
Affiliates
(continued)
g.
Investments
in
Affiliated
Management
Investment
Companies
(continued)
Putnam
Asset
Allocation
Funds
Notes
to
Consolidated
Financial
Statements
(unaudited)
Putnam
Multi-Asset
Income
Fund
(continued)
At
February
28,
2026,
the
cost
of
investments
and
net
unrealized
appreciation
(depreciation) for
income
tax
purposes
were
as
follows:
Differences
between
income
and/or
capital
gains
as
determined
on
a
book
basis
and
a
tax
basis
are
primarily
due
to
differing
treatments
of
wash
sales
and
passive
foreign
investment
company
shares.
6.
Investment
Transactions
Purchases
and
sales
of
investments (excluding
short
term
securities) for
the
period
ended
February
28,
2026,
aggregated
$613,231,243 and
$155,223,079,
respectively.
7.
Credit
Risk
and
Defaulted
Securities
At
February
28,
2026,
the
Fund
had 17.3%
of
its
portfolio
invested
in
high
yield
securities,
senior
secured
floating
rate
loans,
or
other
securities
rated
below
investment
grade and
unrated
securities.
These
securities
may
be
more
sensitive
to
economic
conditions
causing
greater
price
volatility
and
are
potentially
subject
to
a
greater
risk
of
loss
due
to
default
than
higher
rated
securities.
The
Fund held
defaulted
securities
and/or
other
securities
for
which
the
income
has
been
deemed
uncollectible.
At
February
28,
2026,
the
aggregate
value
of
these
securities
was $545,127
representing 0.1%
of
the
Fund's
net
assets.
The
Fund
discontinues
accruing
income
on
securities
for
which
income
has
been
deemed
uncollectible
and
provides
an
estimate
for
losses
on
interest
receivable.
The
securities
have
been
identified
in
the
accompanying Schedule
of
Investments.
8.
Other
Derivative
Information
At
February
28,
2026,
investments
in
derivative
contracts
are
reflected
in
the Consolidated
Statement of
Assets
and
Liabilities
as
follows:
Cost
of
investments
..........................................................................
$686,071,764
Unrealized
appreciation
........................................................................
$25,355,738
Unrealized
depreciation
........................................................................
(4,739,005)
Net
unrealized
appreciation
(depreciation)
..........................................................
$20,616,733
Asset
Derivatives
Liability
Derivatives
Derivative
Contracts
Not
Accounted
for
as
Hedging
Instruments
Consolidated
Statement
of
Assets
and
Liabilities
Location
Fair
Value
Consolidated
Statement
of
Assets
and
Liabilities
Location
Fair
Value
Putnam
Multi-Asset
Income
Fund
Interest
rate
contracts
.......
Variation
margin
on
futures
contracts
$
1,404,344
a
Variation
margin
on
futures
contracts
$
1,155,960
a
Variation
margin
on
centrally
cleared
swap
contracts
34,818
a
Variation
margin
on
centrally
cleared
swap
contracts
16,658
a
Foreign
exchange
contracts
..
Unrealized
appreciation
on
OTC
forward
exchange
contracts
32,759
Unrealized
depreciation
on
OTC
forward
exchange
contracts
20,923
5.
Income
Taxes
(continued)
Putnam
Asset
Allocation
Funds
Notes
to
Consolidated
Financial
Statements
(unaudited)
Putnam
Multi-Asset
Income
Fund
(continued)
For
the
period
ended
February
28,
2026,
the
effect
of
derivative
contracts
in
the Consolidated
Statement
of
Operations
was
as
follows:
For
the
period
ended
February
28,
2026,
the
average
month
end
notional
amount
of
futures
contracts
and
swap
contracts
represented
$107,673,446
and
$2,426,571,
respectively. The
average
month
end
contract
value
of
forward
exchange
contracts
was
$4,071,887.
See
Note
1(e)
regarding
derivative
financial
instruments.
See
Abbreviations
on
page
85
.
Asset
Derivatives
Liability
Derivatives
Derivative
Contracts
Not
Accounted
for
as
Hedging
Instruments
Consolidated
Statement
of
Assets
and
Liabilities
Location
Fair
Value
Consolidated
Statement
of
Assets
and
Liabilities
Location
Fair
Value
Putnam
Multi-Asset
Income
Fund
(continued)
Equity
contracts
...........
Variation
margin
on
futures
contracts
$
205,437
a
Variation
margin
on
futures
contracts
$
227,327
a
Total
....................
$1,677,358
$1,420,868
a
This
amount
reflects
the
cumulative
appreciation
(depreciation)
of
futures
contracts
and
centrally
cleared
swap
contracts
as
reported
in
the
Consolidated
Schedule
of
Investments.
Only
the
variation
margin
receivable/payable
at
period
end
is
separately
reported
within
the
Consolidated
Statement
of
Assets
and
Liabilities.
Prior
variation
margin
movements
were
recorded
to
cash
upon
receipt
or
payment.
Derivative
Contracts
Not
Accounted
for
as
Hedging
Instruments
Consolidated
Statement
of
Operations
Location
Net
Realized
Gain
(Loss)
for
the
Period
Consolidated
Statement
of
Operations
Location
Net
Change
in
Unrealized
Appreciation
(Depreciation)
for
the
Period
Putnam
Multi-Asset
Income
Fund
Net
realized
gain
(loss)
from:
Net
change
in
unrealized
appreciation
(depreciation)
on:
Interest
rate
contracts
..........
Futures
contracts
$57,463
Futures
contracts
$253,248
Swap
contracts
894
Swap
contracts
34,339
Foreign
exchange
contracts
.....
Forward
exchange
contracts
(12,408)
Forward
exchange
contracts
25,920
Equity
contracts
..............
Futures
contracts
(100,556)
Futures
contracts
28,646
Commodity
contracts
..........
Futures
contracts
207,675
Futures
contracts
—
Total
.......................
$153,068
$342,153
8.
Other
Derivative
Information
(continued)
Putnam
Asset
Allocation
Funds
Notes
to
Consolidated
Financial
Statements
(unaudited)
Putnam
Multi-Asset
Income
Fund
(continued)
9.
Credit
Facility
The
Fund,
together
with
other
U.S.
registered
and
foreign
investment
funds
(collectively,
Borrowers),
managed
by
Franklin
Templeton,
are
borrowers
in
a
joint
syndicated
senior
unsecured
credit
facility
totaling
$2.995
billion
(Global
Credit
Facility)
which
matures
on
January
29,
2027.
This
Global
Credit
Facility
provides
a
source
of
funds
to
the
Borrowers
for
temporary
and
emergency
purposes,
including
the
ability
to
meet
future
unanticipated
or
unusually
large
redemption
requests.
Under
the
terms
of
the
Global
Credit
Facility,
the
Fund
may,
in
addition
to
interest
charged
on
any
borrowings
made
by
the
Fund
and
other
costs
incurred
by
the
Fund,
pay
its
share
of
fees
and
expenses
incurred
in
connection
with
the
implementation
and
maintenance
of
the
Global
Credit
Facility,
based
upon
its
relative
share
of
the
aggregate
net
assets
of
all
of
the
Borrowers,
including
an
annual
commitment
fee
of
0.15%
based
upon
the
unused
portion
of
the
Global
Credit
Facility.
These
fees
are
reflected
in
other
expenses
in
the
Consolidated
Statement
of
Operations.
During
the
period
ended
February
28,
2026,
the Fund
did
not
use
the
Global
Credit
Facility.
10.
Fair
Value
Measurements
The
Fund
follows
a
fair
value
hierarchy
that
distinguishes
between
market
data
obtained
from
independent
sources
(observable
inputs)
and
the Fund's
own
market
assumptions
(unobservable
inputs).
These
inputs
are
used
in
determining
the
value
of
the
Fund's financial
instruments
and
are
summarized
in
the
following
fair
value
hierarchy:
Level
1
–
quoted
prices
in
active
markets
for
identical
financial
instruments
Level
2
–
other
significant
observable
inputs
(including
quoted
prices
for
similar
financial
instruments,
interest
rates,
prepayment
speed,
credit
risk,
etc.)
Level
3
–
significant
unobservable
inputs
(including
the
Fund's
own
assumptions
in
determining
the
fair
value
of
financial
instruments)
The
input
levels
are
not
necessarily
an
indication
of
the
risk
or
liquidity
associated
with
financial
instruments
at
that
level.
A
summary
of
inputs
used
as
of
February
28,
2026,
in
valuing
the
Fund's assets
and
liabilities carried
at
fair
value,
is
as
follows:
Level
1
Level
2
Level
3
Total
Putnam
Multi-Asset
Income
Fund
Assets:
Investments
in
Securities:
a
Common
Stocks
:
Aerospace
&
Defense
...................
$
4,078,974
$
564,691
$
—
$
4,643,665
Air
Freight
&
Logistics
...................
3,379,987
126,191
—
3,506,178
Automobile
Components
.................
365,371
436,347
—
801,718
Automobiles
..........................
6,684,293
1,245,583
—
7,929,876
Banks
...............................
7,291,147
6,115,389
—
13,406,536
Beverages
...........................
4,017,476
85,378
—
4,102,854
Biotechnology
.........................
2,332,966
—
9,144
2,342,110
Broadline
Retail
.......................
4,291,918
107,389
—
4,399,307
Building
Products
......................
338,421
254,773
—
593,194
Capital
Markets
........................
6,407,801
916,139
—
7,323,940
Chemicals
...........................
2,131,587
448,120
—
2,579,707
Commercial
Services
&
Supplies
...........
97,120
—
—
97,120
Communications
Equipment
..............
4,937,747
—
—
4,937,747
Construction
&
Engineering
...............
323,709
589,805
—
913,514
Construction
Materials
..................
—
394,753
—
394,753
Consumer
Finance
.....................
483,343
—
—
483,343
Consumer
Staples
Distribution
&
Retail
......
1,013,572
188,988
—
1,202,560
Putnam
Asset
Allocation
Funds
Notes
to
Consolidated
Financial
Statements
(unaudited)
Putnam
Multi-Asset
Income
Fund
(continued)
Level
1
Level
2
Level
3
Total
Putnam
Multi-Asset
Income
Fund
(continued)
Assets:
(continued)
Investments
in
Securities:
a
(continued)
Common
Stocks:
(continued)
Containers
&
Packaging
.................
$
20,028
$
—
$
—
$
20,028
Distributors
...........................
30,124
—
—
30,124
Diversified
Consumer
Services
............
2,051,855
—
—
2,051,855
Diversified
REITs
......................
37,902
223,998
—
261,900
Diversified
Telecommunication
Services
.....
3,852,530
846,814
—
4,699,344
Electric
Utilities
........................
4,365,919
923,185
—
5,289,104
Electrical
Equipment
....................
5,211,591
1,052,382
—
6,263,973
Electronic
Equipment,
Instruments
&
Components
........................
367,048
—
—
367,048
Energy
Equipment
&
Services
.............
1,053,149
—
—
1,053,149
Entertainment
.........................
497,875
—
—
497,875
Financial
Services
......................
2,529,646
341,532
—
2,871,178
Food
Products
........................
2,169,250
476,157
—
2,645,407
Gas
Utilities
..........................
424,740
—
—
424,740
Ground
Transportation
..................
750,958
—
—
750,958
Health
Care
Equipment
&
Supplies
.........
1,568,172
495,481
—
2,063,653
Health
Care
Providers
&
Services
..........
587,623
—
—
587,623
Health
Care
REITs
.....................
305,055
—
—
305,055
Health
Care
Technology
.................
92,642
—
—
92,642
Hotel
&
Resort
REITs
...................
72,909
—
—
72,909
Hotels,
Restaurants
&
Leisure
.............
918,033
334,397
—
1,252,430
Household
Durables
....................
471,863
—
—
471,863
Household
Products
....................
609,368
249,320
—
858,688
Independent
Power
and
Renewable
Electricity
Producers
..........................
408,610
—
11
408,621
Industrial
Conglomerates
................
373,262
272,787
—
646,049
Industrial
REITs
.......................
206,441
—
—
206,441
Insurance
............................
4,416,049
2,368,749
—
6,784,798
Interactive
Media
&
Services
..............
18,066,669
127,519
—
18,194,188
IT
Services
...........................
127,528
69,806
—
197,334
Leisure
Products
.......................
247,212
—
—
247,212
Life
Sciences
Tools
&
Services
............
93,360
—
—
93,360
Machinery
............................
3,934,449
1,139,884
—
5,074,333
Marine
Transportation
...................
68,778
823,944
—
892,722
Media
...............................
218,839
61,797
—
280,636
Metals
&
Mining
.......................
785,251
1,408,064
—
2,193,315
Mortgage
Real
Estate
Investment
Trusts
(REITs)
............................
4,430,034
—
—
4,430,034
Multi-Utilities
..........................
537,298
542,373
—
1,079,671
Office
REITs
..........................
18,501
—
—
18,501
Oil,
Gas
&
Consumable
Fuels
.............
6,082,008
1,850,062
—
7,932,070
Paper
&
Forest
Products
.................
26,206
172,410
—
198,616
Passenger
Airlines
.....................
275,848
76,384
—
352,232
Personal
Care
Products
.................
189,632
92,223
—
281,855
Pharmaceuticals
.......................
14,317,056
2,914,719
—
17,231,775
Professional
Services
...................
2,560,542
—
—
2,560,542
Real
Estate
Management
&
Development
....
54,853
—
—
54,853
Residential
REITs
......................
534,886
—
—
534,886
Retail
REITs
..........................
1,107,171
33,124
—
1,140,295
Semiconductors
&
Semiconductor
Equipment
.
22,906,875
2,232,337
—
25,139,212
Software
.............................
8,206,846
288,481
—
8,495,327
Specialized
REITs
......................
4,013,808
—
—
4,013,808
Specialty
Retail
........................
3,989,893
394,668
—
4,384,561
Technology
Hardware,
Storage
&
Peripherals
.
14,381,180
226,664
—
14,607,844
10.
Fair
Value
Measurements
(continued)
Putnam
Asset
Allocation
Funds
Notes
to
Consolidated
Financial
Statements
(unaudited)
Putnam
Multi-Asset
Income
Fund
(continued)
A
reconciliation
in
which
Level
3
inputs
are
used
in
determining
fair
value
is
presented
when
there
are
significant
Level
3
assets
and/or
liabilities
at
the
beginning
and/or
end
of
the period.
11.
Operating
Segments
The Fund operates
as
a
single
operating
segment,
which
is
an
investment
portfolio.
The
portfolio
managers
assigned
to
the
Fund
within
the
Fund’s
investment
manager serve
as
the
Chief
Operating
Decision
Maker
(“CODM”)
and
are
responsible
for
evaluating
the
Fund's
operating
results
and
allocating
resources
in
accordance
with
the
Fund’s
investment
strategy.
Internal
reporting
provided
to
the
CODM
aligns
with
the
accounting
policies
and
measurement
principles
used
in
the consolidated
financial
statements.
Level
1
Level
2
Level
3
Total
Putnam
Multi-Asset
Income
Fund
(continued)
Assets:
(continued)
Investments
in
Securities:
a
(continued)
Common
Stocks:
(continued)
Textiles,
Apparel
&
Luxury
Goods
..........
$
434,379
$
851,267
$
—
$
1,285,646
Tobacco
.............................
280,619
730,380
—
1,010,999
Trading
Companies
&
Distributors
..........
39,817
1,719,650
—
1,759,467
Transportation
Infrastructure
..............
—
407,814
—
407,814
Water
Utilities
.........................
28,692
60,619
—
89,311
Wireless
Telecommunication
Services
.......
—
490,024
—
490,024
Management
Investment
Companies
.........
1,634,367
—
—
1,634,367
Convertible
Preferred
Stocks
................
474,366
—
—
474,366
Preferred
Stocks
.........................
—
79,664
—
79,664
Rights
.................................
—
—
1,046
1,046
Convertible
Bonds
.......................
—
1,698,694
—
1,698,694
Corporate
Bonds
........................
—
230,398,353
—
230,398,353
Senior
Floating
Rate
Interests
...............
—
3,848,181
—
3,848,181
Foreign
Government
and
Agency
Securities
....
—
30,167,644
—
30,167,644
U.S.
Government
and
Agency
Securities
.......
—
23,852,549
—
23,852,549
Asset-Backed
Securities
...................
—
14,539,617
—
14,539,617
Commercial
Mortgage-Backed
Securities
......
—
14,418,089
—
14,418,089
Mortgage-Backed
Securities
................
—
153,330,676
—
153,330,676
Residential
Mortgage-Backed
Securities
.......
—
8,588,873
—
8,588,873
Agency
Commercial
Mortgage-Backed
Securities
—
1,197,995
—
1,197,995
Municipal
Bonds
.........................
—
670,597
—
670,597
Short
Term
Investments
...................
1,129,823
1,677,283
—
2,807,106
Total
Investments
in
Securities
...........
$192,764,860
$520,240,776
b
$10,201
$713,015,837
Other
Financial
Instruments:
Forward
Exchange
Contracts
...............
$—
$32,759
$—
$32,759
Futures
Contracts
.......................
1,609,781
—
—
1,609,781
Swap
Contracts
.........................
—
34,818
—
34,818
Total
Other
Financial
Instruments
.........
$1,609,781
$67,577
$—
$1,677,358
Liabilities:
Other
Financial
Instruments:
TBA
Sale
Commitments
...................
$
—
$
6,629,715
$
—
$
6,629,715
Forward
Exchange
Contracts
...............
—
20,923
—
20,923
Futures
Contracts
........................
1,383,287
—
—
1,383,287
Swap
Contracts
.........................
—
16,658
—
16,658
Total
Other
Financial
Instruments
.........
$1,383,287
$6,667,296
$—
$8,050,583
a
For
detailed
categories,
see
the
accompanying
Schedule
of
Investments.
b
Includes
foreign
securities
valued
at
$35,835,258,
which
were
categorized
as
Level
2
as
a
result
of
the
application
of
market
level
fair
value
procedures.
See
the
Financial
Instrument
Valuation
note
for
more
information.
10.
Fair
Value
Measurements
(continued)
Putnam
Asset
Allocation
Funds
Notes
to
Consolidated
Financial
Statements
(unaudited)
Putnam
Multi-Asset
Income
Fund
(continued)
For
information
regarding
segment
assets,
segment
profit
or
loss,
and
significant
expenses,
refer
to
the Consolidated
Statement
of
Assets
and
Liabilities
and
the Consolidated
Statement
of
Operations,
along
with
the
related
notes
to
the consolidated
financial
statements.
The Consolidated
Schedule
of
Investments
provides
details
of
the Fund's investments
that
generate
returns
such
as
interest,
dividends,
and
realized
and
unrealized
gains
or
losses.
Performance
metrics,
including
portfolio
turnover
and
expense
ratios,
are
disclosed
in
the Consolidated
Financial
Highlights.
12.
Subsequent
Events
The Fund
has
evaluated
subsequent
events
through
the
issuance
of
the
consolidated
financial
statements
and
determined
that
no
events
have
occurred
that
require
disclosure
other
than
those
already
disclosed
in
the
financial
statements.
Abbreviations
Counterparty
BOFA
Bank
of
America
NA
BZWS
Barclays
Bank
plc
CITI
Citibank
NA
GSCO
Goldman
Sachs
Group,
Inc.
JPHQ
JPMorgan
Chase
Bank
NA
MSCO
Morgan
Stanley
SSBT
State
Street
Bank
and
Trust
Co.
TDOM
Toronto
Dominion
Bank
UBSW
UBS
AG
Cu
r
rency
AUD
Australian
Dollar
CAD
Canadian
Dollar
CHF
Swiss
Franc
EUR
Euro
GBP
British
Pound
JPY
Japanese
Yen
NOK
Norwegian
Krone
SEK
Swedish
Krona
USD
United
States
Dollar
Selected
Portfolio
CLO
Collateralized
Loan
Obligation
CME
Chicago
Mercantile
Exchange
CVR
Contingent
Value
Right
ETF
Exchange-Traded
Fund
ETM
Escrowed
to
Maturity
EURIBOR
Euro
Inter-Bank
Offer
Rate
FHLMC
Federal
Home
Loan
Mortgage
Corp.
FNMA
Federal
National
Mortgage
Association
FRN
Floating
Rate
Note
GNMA
Government
National
Mortgage
Association
GO
General
Obligation
NATL
National
Reinsurance
Corp.
PIK
Payment-In-Kind
REMIC
Real
Estate
Mortgage
Investment
Conduit
SOFR
Secured
Overnight
Financing
Rate
STACR
Structured
Agency
Credit
Risk
11.
Operating
Segments
(continued)
Putnam
Asset
Allocation
Funds
Changes
In
and
Disagreements
with
Accountants
For
the
period
covered
by
this
report
Not
applicable.
Results
of
Meeting(s)
of
Shareholders
For
the
period
covered
by
this
report
Not
applicable.
Remuneration
Paid
to
Directors,
Officers
and
Others
For
the
period
covered
by
this
report
Refer
to
the
consolidated
financial
statements
included
herein.
Remuneration
to
officers
is
paid
by
the
Fund’s
investment
manager
according
to
the
terms
of
the
agreement.
Board
Approval
of
Management
and
Subadvisory
Agreements
For
the
period
covered
by
this
report
Not
applicable.
©
2026
Franklin
Templeton.
All
rights
reserved.
| ITEM
8. |
CHANGES IN AND DISAGREEMENTS
WITH ACCOUNTANTS FOR OPEN-END MANAGEMENT INVESTMENT COMPANIES. |
The information is disclosed as part of the Financial Statements
included in Item 7 of this Form N-CSR.
| ITEM 9. |
PROXY DISCLOSURES FOR OPEN-END
MANAGEMENT INVESTMENT COMPANIES. |
The information is disclosed as part of the Financial Statements
included in Item 7 of this Form N-CSR.
| ITEM
10. |
REMUNERATION PAID TO DIRECTORS,
OFFICERS, AND OTHERS OF OPEN-END MANAGEMENT INVESTMENT COMPANIES. |
The information is disclosed as part of the Financial Statements
included in Item 7 of this Form N-CSR.
| ITEM 11. |
STATEMENT REGARDING BASIS FOR
APPROVAL OF INVESTMENT ADVISORY CONTRACT. |
The information is disclosed as part of the Financial Statements
included in Item 7 of this Form N-CSR, as applicable.
| ITEM
12. |
DISCLOSURE OF PROXY VOTING
POLICIES AND PROCEDURES FOR CLOSED-END MANAGEMENT INVESTMENT COMPANIES. |
Not applicable.
| ITEM 13. |
PORTFOLIO MANAGERS OF CLOSED-END
MANAGEMENT INVESTMENT COMPANIES. |
Not applicable.
| ITEM
14. |
PURCHASES OF EQUITY SECURITIES
BY CLOSED-END MANAGEMENT INVESTMENT COMPANY AND AFFILIATED PURCHASERS. |
Not applicable.
| ITEM 15. |
SUBMISSION OF MATTERS TO A
VOTE OF SECURITY HOLDERS. |
There have been no changes to the procedures
by which shareholders may recommend nominees to the Registrant’s Board of Trustees that would require disclosure herein.
| ITEM 16. |
CONTROLS AND PROCEDURES. |
|
(a) |
The Registrant’s principal executive officer and principal financial officer have concluded that the Registrant’s disclosure
controls and procedures (as defined in Rule 30a-3(c) under the Investment Company Act of 1940, as amended (the “1940 Act”))
are effective as of a date within 90 days of the filing date of this report that includes the disclosure required by this paragraph, based
on their evaluation of the disclosure controls and procedures required by Rule 30a-3(b) under the 1940 Act and 15d-15(b) under the Securities
Exchange Act of 1934. |
|
(b) |
During the period covered by this report, the Registrant transitioned to a new third-party service provider who performs certain accounting
and administrative services for the Registrant that are subject to Franklin Templeton’s oversight. |
| ITEM
17. |
DISCLOSURE OF SECURITIES LENDING
ACTIVITIES FOR CLOSED-END MANAGEMENT INVESTMENT COMPANIES. |
Not applicable.
| ITEM
18. |
RECOVERY OF ERRONEOUSLY AWARDED
COMPENSATION. |
(a) (1) Not applicable.
Exhibit 99.CODE ETH
(a) (3) Certifications pursuant
to section 302 of the Sarbanes-Oxley Act of 2002 attached hereto.
Exhibit 99.CERT
(b) Certifications
pursuant to Section 906 of the Sarbanes-Oxley Act of 2002 attached hereto.
Exhibit 99.906CERT
SIGNATURES
Pursuant to the requirements of the Securities Exchange
Act of 1934 and the Investment Company Act of 1940, the registrant has duly caused this Report to be signed on its behalf by the undersigned,
there unto duly authorized.
| Putnam Asset Allocation Funds |
|
| |
|
|
| By: |
/s/ Jonathan S. Horwitz |
|
|
Jonathan S. Horwitz |
|
|
Principal Executive Officer |
|
| |
|
|
| Date: |
April 29, 2026 |
|
Pursuant to the requirements of the Securities Exchange
Act of 1934 and the Investment Company Act of 1940, this report has been signed below by the following persons on behalf of the registrant
and in the capacities and on the dates indicated.
| By: |
/s/ Jonathan S. Horwitz |
|
|
Jonathan S. Horwitz |
|
|
Principal Executive Officer |
|
| |
|
|
| Date: |
April 29, 2026 |
|
| |
|
|
| By: |
/s/ Jeffrey White |
|
|
Jeffrey White |
|
|
Principal Financial Officer |
|
| |
|
|
| Date: |
April 29, 2026 |
|