Performance Management - Loomis Sayles Funds I - Classes Admin, Retail, Institutional, and N
Dec. 31, 2025
The following bar chart and table give an indication of the risks of investing in the Fund by showing changes in the Fund’s performance from year to year and by showing how the Fund’s average annual returns for the one-year, five-year and ten-year periods compare to those of a broad-based securities market index that reflects the performance of the overall market applicable to the Fund. The Fund’s past performance (before and after taxes) does not necessarily indicate how the Fund will perform in the future. The Fund’s performance prior to December 31, 2025 reflects returns achieved pursuant to a different investment objective and different principal investment strategies than those that are currently being pursued. If the Fund’s current investment objective and strategies had been in place during those prior periods, the performance information shown would have been different. Updated performance information is available online at www.loomissayles.com and/or by calling the Fund toll-free at 800-633-3330. Effective after the close of business on June 5, 2026, the telephone number will be 800-225-5478 and the website address will be www.im.natixis.com.
To the extent that a class of shares was subject to the waiver or reimbursement of certain expenses during a period, had such expenses not been waived or reimbursed during the period, total returns would have been lower.
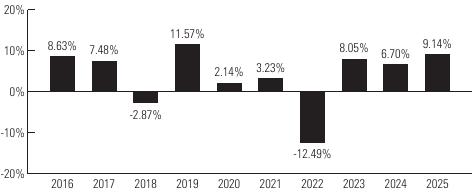
Highest Quarterly Return:
Fourth Quarter 2023, 7.34%
Lowest Quarterly Return:
First Quarter 2020, -11.75%
Fourth Quarter 2023, 7.34%
Lowest Quarterly Return:
First Quarter 2020, -11.75%
|
Average Annual Total Returns
|
|
|
|
|
(for the periods ended December 31, 2025)
|
Past 1 Year
|
Past 5 Years
|
Past 10 Years
|
|
Institutional Class - Return Before Taxes
|
9.14%
|
2.59%
|
3.92%
|
|
Return After Taxes on Distributions
|
7.09%
|
0.70%
|
2.20%
|
|
Return After Taxes on Distributions and Sale of Fund Shares
|
5.36%
|
1.13%
|
2.31%
|
|
Retail Class - Return Before Taxes
|
8.93%
|
2.34%
|
3.66%
|
|
Admin Class - Return Before Taxes
|
8.60%
|
2.11%
|
3.42%
|
|
Class N - Return Before Taxes
|
9.21%
|
2.64%
|
3.99%
|
|
Bloomberg U.S. Aggregate Bond Index
|
7.30%
|
-0.36%
|
2.01%
|
After-tax returns are calculated using the historical highest individual federal marginal income tax rates and do not reflect the impact of state and local taxes. Actual after-tax returns depend on an investor’s tax situation and may differ from those shown. After-tax returns shown are
not relevant to investors who hold their shares through tax-advantaged arrangements, such as 401(k) plans, qualified plans, education savings accounts, such as 529 plans, or individual retirement accounts. The after-tax returns are shown for the Institutional Class of the Fund. After-tax returns for the other classes of the Fund will vary. Index performance reflects no deduction for fees, expenses or taxes.
The following bar chart and table give an indication of the risks of investing in the Fund by showing changes in the Fund’s performance from year to year and by showing how the Fund’s average annual returns for the one-year, five-year and ten-year periods
compare to those of a broad-based securities market index that reflects the performance of the overall market applicable to the Fund. The Fund’s past performance (before and after taxes) does not necessarily indicate how the Fund will perform in the future. Updated performance information is available online at www.loomissayles.com and/or by calling the Fund toll-free at 800-633-3330. Effective after the close of business on June 5, 2026, the telephone number will be 800-225-5478 and the website address will be www.im.natixis.com.To the extent that a class of shares was subject to the waiver or reimbursement of certain expenses during a period, had such expenses not been waived or reimbursed during the period, total returns would have been lower.
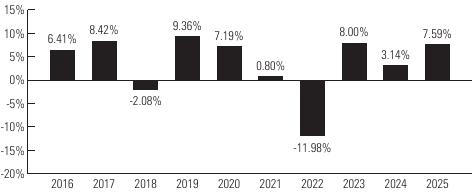
Highest Quarterly Return:
Fourth Quarter 2023, 7.59%
Lowest Quarterly Return:
First Quarter 2020, -7.01%
Fourth Quarter 2023, 7.59%
Lowest Quarterly Return:
First Quarter 2020, -7.01%
|
Average Annual Total Returns
|
|
|
|
|
(for the periods ended December 31, 2025)
|
Past 1 Year
|
Past 5 Years
|
Past 10 Years
|
|
Institutional Class - Return Before Taxes
|
7.59%
|
1.24%
|
3.48%
|
|
Return After Taxes on Distributions
|
5.34%
|
-0.54%
|
1.85%
|
|
Return After Taxes on Distributions and Sale of Fund Shares
|
4.46%
|
0.25%
|
2.09%
|
|
Bloomberg U.S. Aggregate Bond Index
|
7.30%
|
-0.36%
|
2.01%
|
After-tax returns are calculated using the historical highest individual federal marginal income tax rates and do not reflect the impact of state and local taxes. Actual after-tax returns depend on an investor’s tax situation and may differ from those shown. After-tax returns shown are not relevant to investors who hold their shares through tax-advantaged arrangements, such as 401(k) plans, qualified plans, education savings accounts, such as 529 plans, or individual retirement accounts. Index performance reflects no deduction for fees, expenses or taxes.