 |
|
| |
|
|
Summary Prospectus
May 1, 2026 |
|
| |
|
| |
T. ROWE PRICE |
| |
Equity Income Portfolio |
|
QAAHCX
QAAHAX |
Equity Income Portfolio
Equity Income Portfolio—II
Class |
| |
The fund is only available as an investment option for variable annuity
and variable life insurance contracts.
The Securities and Exchange Commission (SEC) has not approved or disapproved
these securities or passed upon the adequacy of this prospectus. Any representation to the contrary is a criminal offense.
Before you invest, you may want to review the fund’s prospectus,
which contains more information about the fund and its risks. You can find the fund’s prospectus, shareholder reports, and other
information about the fund online at troweprice.com/prospectus.
You can also get this information at no cost by calling 1-800-638-8790,
by sending an e-mail request to info@troweprice.com, or by contacting
your insurance company. This Summary Prospectus incorporates by reference the fund’s prospectus, dated May 1, 2026, as amended
or supplemented, and Statement of Additional Information, dated May 1, 2026, as amended or supplemented.
|
|
| |
|
| |
 |
| |
|
|
|
Investment Objective(s)
The fund seeks a high level of dividend income and long-term capital
growth primarily through investments in stocks.
Fees and Expenses
This table describes the fees and
expenses that you may pay if you buy, hold, and sell shares of the fund. You may pay other fees, such as brokerage commissions
or insurance contract fees and expenses, which are not reflected in the table and example below. If these additional fees and expenses
were reflected, expenses shown would be higher.
| Fees and Expenses of the Fund |
|
|
|
|
|
| |
Portfolio |
Portfolio—II Class |
|
Annual fund operating expenses
(expenses that you pay each year as a
percentage of the value of your investment) |
|
| Management fees |
0.54 |
% |
0.54 |
% |
|
| |
|
|
|
|
|
|
| Distribution and service (12b-1) fees |
— |
|
0.25 |
|
|
| |
|
|
|
|
|
|
| Other expenses |
0.20 |
|
0.20 |
|
|
| |
|
|
|
|
|
|
| Total annual fund operating expenses |
0.74 |
|
0.99 |
|
|
| |
|
|
|
|
|
|
Example This example is intended
to help you compare the cost of investing in the fund with the cost of investing in other mutual funds. The example assumes that you invest
$10,000 in the fund for the time periods indicated and then redeem all of your shares at the end of those periods, that your investment
has a 5% return each year, and that the fund’s operating expenses remain the same. Although your actual costs may be higher or lower,
based on these assumptions your costs would be:
| |
1 Year |
3 Years |
5 Years |
10 Years |
|
| Portfolio |
$ |
76 |
$ |
237 |
$ |
411 |
$ |
918 |
|
| Portfolio—II Class |
101 |
|
315 |
|
547 |
|
1,213 |
|
| |
|
|
|
|
|
|
|
|
|
Portfolio Turnover The fund
pays transaction costs, such as commissions, when it buys and sells securities (or “turns over” its portfolio). A higher portfolio
turnover rate may indicate higher transaction costs and may result in higher taxes when the fund’s shares are held in a taxable
account. These costs, which are not reflected in annual fund operating expenses or in the example, affect the fund’s performance.
During the most recent fiscal year, the fund’s portfolio turnover rate was 27.8% of the average value of its portfolio.
Investments, Risks, and Performance
Principal Investment Strategies
The fund normally invests at least 80% of its net assets (plus any
borrowings for investment purposes) in equity securities with a track record of paying dividends. The fund considers a company to have
a track record of paying dividends if the security has paid a dividend within the past 12 months. Any derivatives that provide exposure
to the investment focus suggested by the fund’s name, or to one or more market risk factors associated with the investment focus
suggested by the fund’s name, are counted (as applicable) toward compliance with the fund’s 80% investment policy.
The fund generally seeks investments in large-cap companies. The fund
typically employs a value approach in selecting investments. The adviser’s in-house research team seeks dividend-paying companies
that appear to be undervalued by various measures and may be temporarily out of favor but have good prospects for capital appreciation
and dividend growth.
At times, the fund may have a significant portion of its assets invested
in the same economic sector. While most assets are typically invested in U.S. common stocks, the fund may invest in foreign stocks in
keeping with its objective(s).
Principal Risks
As with any fund, there is no guarantee that the fund will achieve
its objective(s). The fund’s share price fluctuates, which means you could lose money by investing in the fund. The principal risks
of investing in this fund, which may be even greater in unfavorable or uncertain market conditions, are summarized as follows:
Dividend-paying
stocks: The fund’s emphasis on dividend-paying stocks could cause the fund to underperform similar funds that
invest without consideration of a company’s track record of paying dividends. Stocks of companies with a history of paying
dividends may not participate in a broad market advance to the same degree as most other stocks, and a sharp rise in interest rates
or economic downturn could cause a company to unexpectedly reduce or eliminate its dividend.
Stock investing:
Stocks generally fluctuate in value more than bonds and may decline significantly over short time periods. There is a chance that stock
prices overall will decline because stock markets tend to move in cycles, with periods of rising and falling prices. The value of stocks
held by the fund may decline due to general weakness or volatility in the stock markets in which the fund invests or because of factors
that affect a particular company or industry.
Value investing:
The fund’s value approach to investing could cause it to underperform other stock funds that employ a different investment style.
The intrinsic value of a stock with value characteristics may not be fully recognized by the market for a long time (or at all) or a stock
judged to be undervalued may actually be appropriately priced at a low level. Value stocks may fail to appreciate for long periods and
may never reach what the adviser believes are their full market values.
Market
conditions: The value of the fund’s investments may decrease, sometimes rapidly or unexpectedly, due to factors affecting
an issuer held by the fund, particular industries, or the overall securities markets. A variety of factors can increase the volatility
of the fund’s holdings and markets generally, including geopolitical developments (such as trade and tariff arrangements, sanctions,
and cybersecurity attacks), recessions, inflation, rapid interest rate changes, war, military conflict, acts of terrorism, natural disasters,
and outbreaks of infectious illnesses or other widespread public health issues (such as the coronavirus pandemic) and related governmental
and public responses. Certain events may cause instability across global markets, including reduced liquidity and disruptions in trading
markets, while some events may affect certain geographic regions, countries, sectors, and industries more significantly than others. Government
intervention in markets may impact interest rates, market volatility, and security pricing. These adverse developments may cause broad
declines in market value due to short-term market movements or for significantly longer periods during more prolonged market downturns.
Large-cap
stocks: Securities issued by large-cap companies tend to be less volatile than securities issued by small- and mid-cap companies.
However, large-cap companies may not be able to attain the high growth rates of successful small- and mid-cap companies, especially during
strong economic periods, and may be unable to respond as quickly to competitive challenges.
Sector
exposure: Issuers in the same economic sector may be similarly affected by economic or market events, making the fund more
vulnerable to unfavorable developments in that economic sector than funds that invest more broadly.
Foreign
investing: Non-U.S. securities tend to be more volatile and have lower overall liquidity
and trading volume than investments in U.S. securities and may lose value because of adverse local, political, social, or economic developments
overseas, or due to changes in the exchange rates between foreign currencies and the U.S. dollar. Further, securities of non-U.S. issuers
are subject to trading markets with potential governmental interference, varying regulatory, auditing, and accounting standards, and settlement
and clearance practices that differ from those of U.S. issuers. Investment in non-U.S. securities also carries currency risk. Any attempts
to hedge currency risk could be unsuccessful. Such investments may have higher transaction costs compared with U.S. markets. Investments
in emerging market countries are subject to greater risk and overall volatility than investments in developed markets.
Active
management: The fund’s overall investment program and holdings selected by the fund’s investment adviser may underperform
the broad markets, relevant indices, or other funds with similar objectives and investment strategies.
Cybersecurity
breaches: The fund could be harmed by intentional cyberattacks and other cybersecurity breaches, including unauthorized access
to the fund’s assets, confidential information, or other proprietary information. In addition, a cybersecurity breach could cause
one of the fund’s service providers or financial intermediaries to suffer unauthorized data access, data corruption, or loss of
operational functionality.
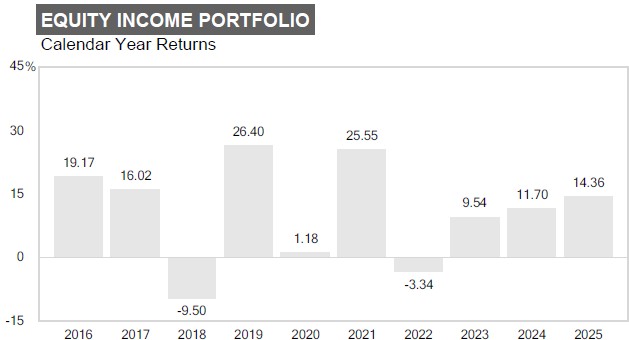
Performance
The following performance information provides some indication of the
risks of investing in the fund. The fund’s performance information represents only past performance and is not necessarily an indication
of future results. Figures shown reflect fees and expenses associated with an investment in the fund, but do not reflect insurance contract
fees and expenses. If insurance contract fees and expenses were included, results would have been lower.
The following bar chart illustrates how much returns can differ from
year to year by showing calendar year returns and the best and worst calendar quarter returns during those years
for the fund’s Portfolio Class. Returns for other share classes vary since they have different expenses.
| |
|
Quarter Ended |
Total
Return |
|
|
Quarter Ended |
Total
Return |
|
| |
Best Quarter |
12/31/20 |
20.88% |
|
Worst Quarter |
3/31/20 |
-28.38% |
|
The following table shows the average annual total returns for each
class of the fund that has been in operation for at least one full calendar year. The fund’s performance information included in
the table is compared with a regulatory required index that represents an overall securities market (Russell 3000®
Index). In addition, the table may also include one or more indexes that more closely align to the fund’s investment strategy.
Average Annual Total Returns
| |
|
|
|
| |
|
Periods ended |
|
| |
|
December 31, 2025 |
|
| |
|
|
|
|
|
|
|
|
|
|
|
| |
|
|
|
|
|
|
|
|
|
Inception |
|
| |
|
1 Year |
|
|
5 Years |
|
|
10 Years |
|
date |
|
| |
Portfolio |
14.36 |
% |
|
11.17 |
% |
|
10.51 |
% |
03/31/1994 |
|
| |
Portfolio—II Class |
14.07 |
|
|
10.89 |
|
|
10.24 |
|
04/30/2002 |
|
| |
|
|
|
|
|
|
|
|
|
|
|
| |
Russell 3000® Index (reflects no deduction for fees, expenses, or taxes) |
|
|
| |
|
17.15 |
|
|
13.15 |
|
|
14.29 |
|
|
|
| |
Russell 1000® Value Index (reflects no deduction for fees, expenses, or taxes) |
|
|
| |
|
15.91 |
|
|
11.33 |
|
|
10.53 |
|
|
|
| |
Lipper Variable Annuity Underlying Equity Income Funds Average |
|
|
| |
|
15.89 |
|
|
11.07 |
|
|
10.38 |
|
|
|
| |
|
|
|
|
|
|
|
|
|
|
|
Updated performance information is available through troweprice.com.
Management
Investment
Adviser T. Rowe Price Associates, Inc. (T. Rowe Price or Price Associates)
|
Name |
Title |
Managed
Fund
Since |
Joined
Investment
Adviser |
| John Linehan |
Portfolio Manager and Chair of Investment Advisory Committee |
2015 |
1998 |
Purchase and Sale of Fund Shares
The fund is not sold directly to the general public but is instead
offered as an underlying investment option for variable annuity or variable life insurance contracts. Although the fund does not require
a minimum amount for initial or subsequent purchases from insurance companies, your insurance company may impose investment minimums for
your purchases of the fund.
You may purchase, redeem, or exchange shares of the fund on any day
the New York Stock Exchange is open for business. You must purchase, redeem, and exchange shares through your insurance company.
Tax Information
The fund distributes any dividends and capital gains to its shareholders,
which are the insurance company separate accounts that sponsor your variable annuity or variable life insurance contract. Variable product
owners seeking to understand the tax consequences of their investment, including redemptions of fund shares and the impact of dividend
and capital gains distributions by the fund, should consult with the insurance company that issued their variable product or refer to
their variable annuity or variable life insurance contract prospectus.
Payments to Insurance Companies, Broker-Dealers, and Other Financial
Intermediaries
The fund is generally available only through variable annuity or variable
life insurance contracts. The fund and/or its related companies may make payments to a sponsoring insurance company or other financial
intermediary for the sale of fund shares and related services. These payments may create a conflict of interest by influencing the insurance
company or other financial intermediary to recommend the fund over another investment option or by influencing an insurance company to
include the fund as an underlying investment option in a variable contract. The prospectus (or other offering document) for your variable
contract may contain additional information about these payments. Ask your insurance company or financial intermediary, or visit your
insurance company’s or financial intermediary’s website, for more information.
This page intentionally left blank.
This page intentionally left blank.
 |
|
| |
|
T. Rowe Price Associates, Inc.
1307 Point Street
Baltimore, MD 21231 |
E300-045 5/1/26 |