
Touchstone Variable Series Trust
Touchstone Balanced Fund - Class I, Class SC
Touchstone Bond Fund - Class I, Class SC
Touchstone Common Stock Fund - Class I, Class SC
Touchstone Small Company Fund - Class I
Shares of each Fund described in this prospectus can be purchased by insurance company separate accounts. You can invest indirectly in the Funds through your purchase of a variable annuity contract or variable life policy. This prospectus should be read along with the prospectus for the variable annuity contract or variable life policy. That prospectus also contains information about the contract, your investment options, the sub-accounts and expenses related to purchasing a variable annuity contract or variable life policy.
The Securities and Exchange Commission has not approved or disapproved these securities or determined if this prospectus is accurate or complete. Any representation to the contrary is a criminal offense.
| |
Class I |
Class SC |
| |
|
|
| Management Fees |
|
|
| Other Expenses |
|
|
| Shareholder Service Fees |
|
|
| Other Operating Expenses |
|
|
| Total Other Expenses |
|
|
| Total Annual Fund Operating Expenses |
|
|
| Fee Waiver and/or Expense Reimbursement(1) |
( |
( |
| Total Annual Fund Operating Expenses After Fee Waiver and/or Expense Reimbursement(1) |
|
|
(1)
(2)
| |
Class I |
Class SC |
| 1 Year |
$ |
$ |
| 3 Years |
$ |
$ |
| 5 Years |
$ |
$ |
| 10 Years |
$ |
$ |
3
| |
|
| |
% |
| |
% |
The Fund’s Principal Risks
The Fund’s share price will fluctuate. You could lose money on your investment in the Fund and the Fund could also return less than other investments. Investments in the Fund are not bank guaranteed, are not deposits, and are not insured by the Federal Deposit Insurance Corporation or any other federal government agency. As with any mutual fund, there is no guarantee that the Fund will achieve its investment goal. You can find more information about the Fund’s investments and risks under the “Principal Investment Strategies and Risks” section of the Fund’s prospectus. The Fund is subject to the principal risks summarized below.
4
5
6
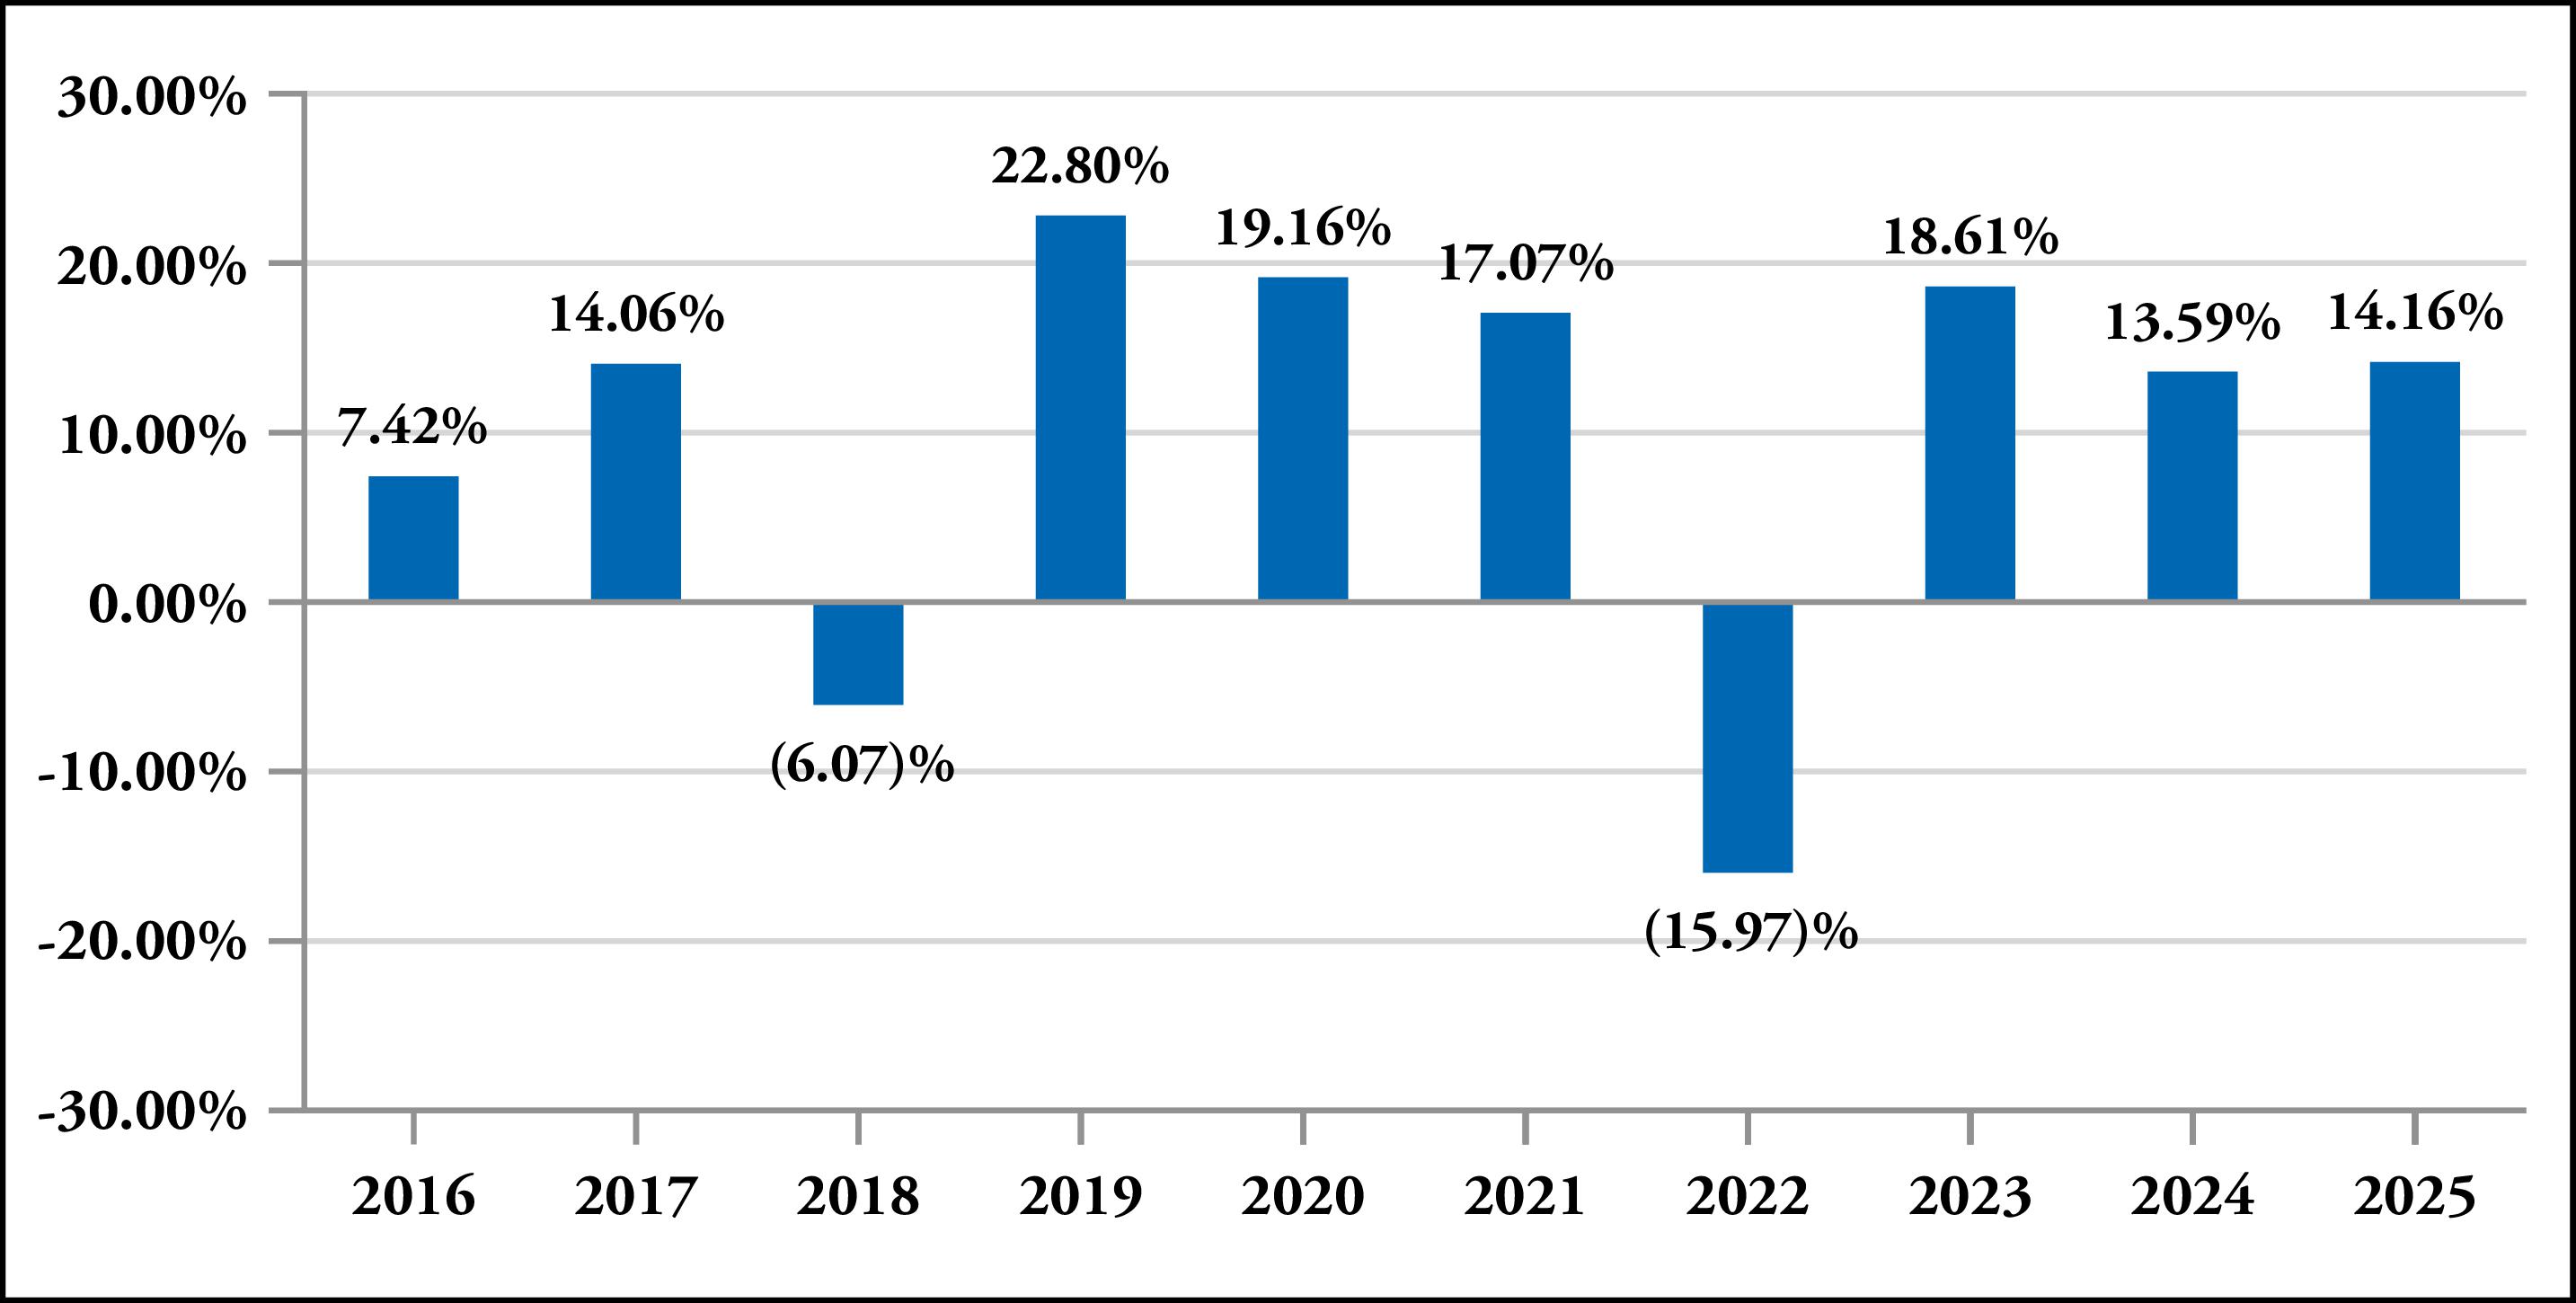
| | ||
| |
|
% |
| |
|
% |
| |
|
% |
7
| |
1 Year |
5 Years |
10 Years |
| Touchstone Balanced Fund - Class I |
% |
% |
% |
| Touchstone Balanced Fund - Class SC |
% |
% |
% |
| Bloomberg US 3000 Index(1) (reflects no deduction for fees, expenses or taxes) |
% |
% |
% |
| Bloomberg US Aggregate Bond Index (reflects no deduction for fees, expenses or taxes) |
% |
( % |
% |
| Blend comprised of 60% Bloomberg US 1000 Index and 40% Bloomberg US Aggregate Bond Index(2) (reflects no deduction for fees, expenses or taxes) |
% |
% |
% |
| Russell 3000® Index (reflects no deduction for fees, expenses or taxes) |
% |
% |
% |
| Blend comprised of 60% Russell 1000® Index and 40% Bloomberg US Aggregate Bond Index (reflects no deduction for fees, expenses or taxes) |
% |
% |
% |
(1)
(2)
The Fund’s Management
Investment Adviser
Touchstone Advisors, Inc. serves as the Fund’s investment adviser.
| Sub-Adviser |
Portfolio Managers |
Investment Experience with the Fund |
Primary Title with Sub-Adviser |
| Fort Washington Investment Advisors, Inc. |
Daniel J. Carter, CFA |
Since inception in October 2017 |
Managing Director and Senior Portfolio Manager |
| |
James E. Wilhelm, Jr. |
Since inception in October 2017 |
Managing Director and Senior Portfolio Manager |
| |
Austin R. Kummer, CFA |
Since inception in October 2017 |
Managing Director and Senior Portfolio Manager |
Buying and Selling Fund Shares
You cannot buy or sell shares of the Fund directly. You can invest indirectly in the Fund through your purchase of a variable annuity contract or variable life policy. Please see the variable contract prospectus for additional investment information.
Tax Information
The dividends and distributions paid by the Fund will consist of ordinary income, capital gains or some combination of both. Because shares of the Fund must be purchased through separate accounts used to fund variable life and variable annuity insurance contracts, such dividends and distributions will be exempt from current taxation to you if you leave such amounts to accumulate within a separate account. Please see the variable contract prospectus for additional tax information.
Payments to Sponsoring Insurance Companies and Other Financial Intermediaries
The Fund or its distributor (and related companies) may pay broker/dealers or other financial intermediaries (such as insurance companies or their related companies) for the sale and retention of variable contracts that offer Fund shares and/or for other services. These payments may create a conflict of interest for a financial intermediary, or may be a factor in the insurance company’s decision to include the Fund as an investment option in its variable contract. For more information, ask your financial adviser, visit your financial intermediary’s website, or consult the variable contract prospectus or the Fund’s prospectus.
8
| |
Class I |
Class SC |
| |
|
|
| Management Fees |
|
|
| Other Expenses |
|
|
| Shareholder Service Fees |
|
|
| Other Operating Expenses |
|
|
| Total Other Expenses |
|
|
| Acquired Fund Fees and Expenses (AFFE) |
|
|
| Total Annual Fund Operating Expenses(1) |
|
|
| Fee Waiver and/or Expense Reimbursement(2) |
( |
( |
| Total Annual Fund Operating Expenses After Fee Waiver and/or Expense Reimbursement(1)(2) |
|
|
(1)
(2)
| |
Class I |
Class SC |
| 1 Year |
$ |
$ |
| 3 Years |
$ |
$ |
| 5 Years |
$ |
$ |
| 10 Years |
$ |
$ |
9
The Fund’s Principal Risks
The Fund’s share price will fluctuate. You could lose money on your investment in the Fund and the Fund could also return less than other investments. Investments in the Fund are not bank guaranteed, are not deposits, and are not insured by the Federal Deposit Insurance Corporation or any other federal government agency. As with any mutual fund, there is no guarantee that the Fund will achieve its investment goal. You can find more information about the Fund’s investments and risks under the “Principal Investment Strategies and Risks” section of the Fund’s prospectus. The Fund is subject to the principal risks summarized below.
10
11
12
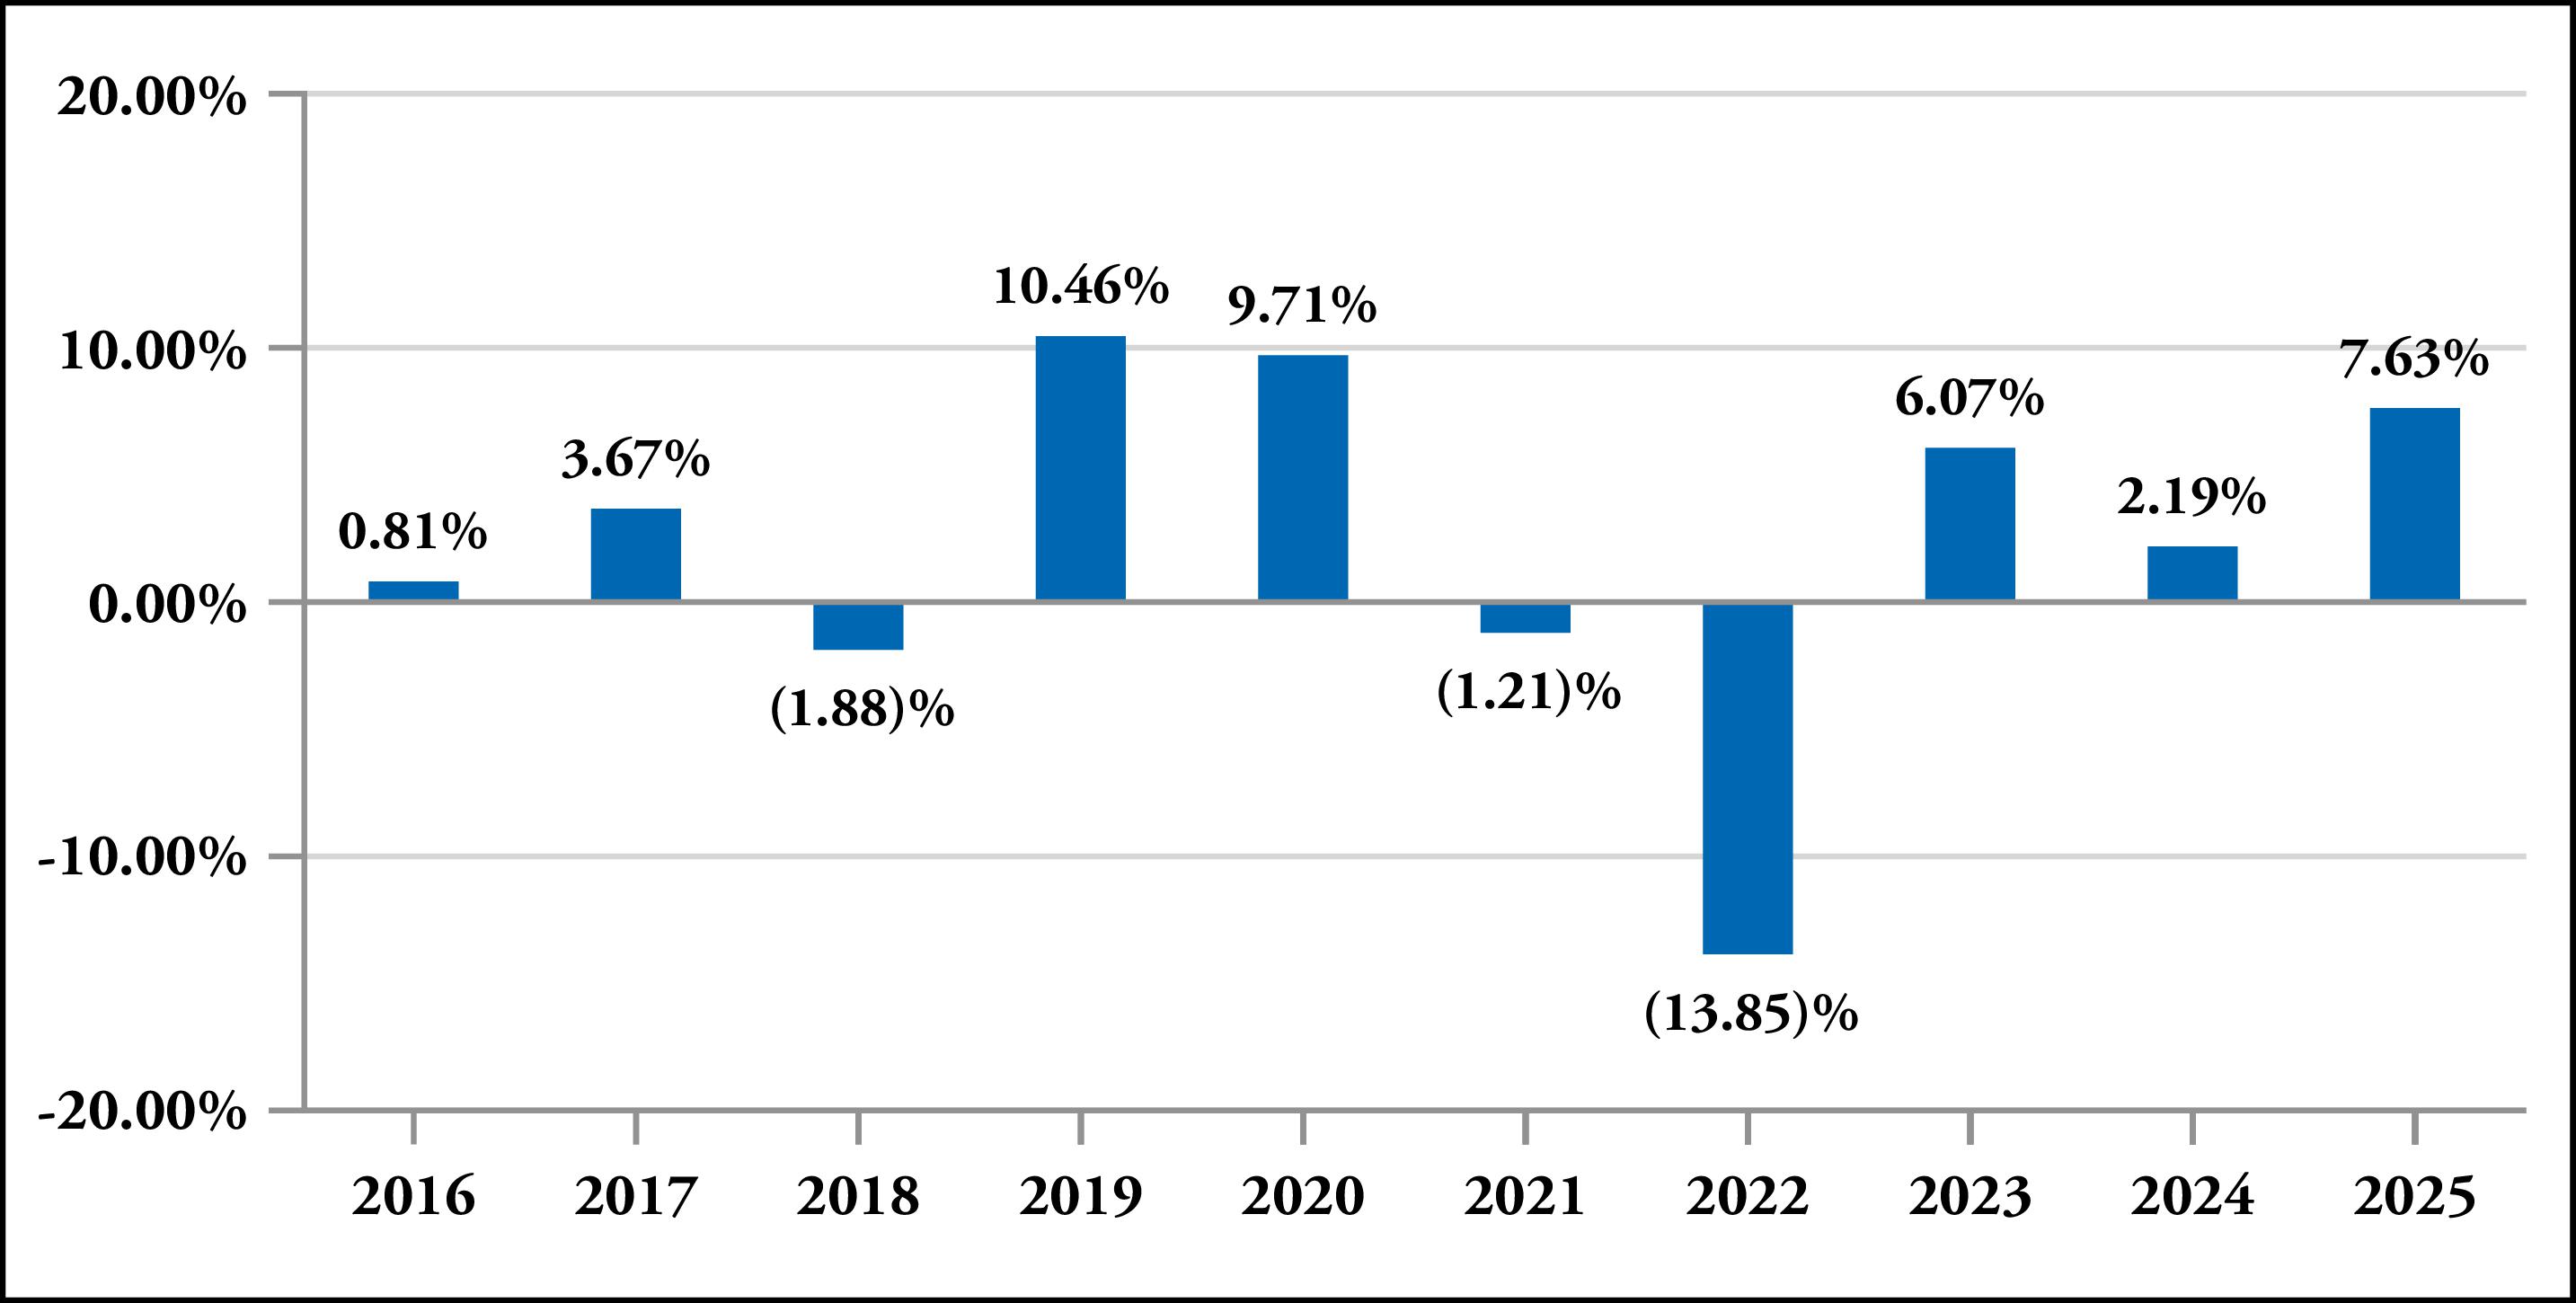
| | ||
| |
|
% |
| |
|
% |
| |
|
% |
| |
1 Year |
5 Years |
10 Years |
| Touchstone Bond Fund - Class I |
% |
( % |
% |
| Touchstone Bond Fund - Class SC |
% |
( % |
% |
| Bloomberg US Aggregate Bond Index (reflects no deduction for fees, expenses or taxes) |
% |
( % |
% |
The Fund’s Management
Investment Adviser
Touchstone Advisors, Inc. serves as the Fund’s investment adviser.
| Sub-Adviser |
Portfolio Managers |
Investment Experience with the Fund |
Primary Title with Sub-Adviser |
| Fort Washington Investment Advisors, Inc. |
Daniel J. Carter, CFA |
Since inception in October 2017 |
Managing Director and Senior Portfolio Manager |
| |
Austin R. Kummer, CFA |
Since inception in October 2017 |
Managing Director and Senior Portfolio Manager |
13
Buying and Selling Fund Shares
You cannot buy or sell shares of the Fund directly. You can invest indirectly in the Fund through your purchase of a variable annuity contract or variable life policy. Please see the variable contract prospectus for additional investment information.
Tax Information
The dividends and distributions paid by the Fund will consist of ordinary income, capital gains or some combination of both. Because shares of the Fund must be purchased through separate accounts used to fund variable life and variable annuity insurance contracts, such dividends and distributions will be exempt from current taxation to you if you leave such amounts to accumulate within a separate account. Please see the variable contract prospectus for additional tax information.
Payments to Sponsoring Insurance Companies and Other Financial Intermediaries
The Fund or its distributor (and related companies) may pay broker/dealers or other financial intermediaries (such as insurance companies or their related companies) for the sale and retention of variable contracts that offer Fund shares and/or for other services. These payments may create a conflict of interest for a financial intermediary, or may be a factor in the insurance company’s decision to include the Fund as an investment option in its variable contract. For more information, ask your financial adviser, visit your financial intermediary’s website, or consult the variable contract prospectus or the Fund’s prospectus.
14
| |
Class I |
Class SC |
| |
|
|
| Management Fees |
|
|
| Other Expenses |
|
|
| Shareholder Service Fees |
|
|
| Other Operating Expenses |
|
|
| Total Other Expenses |
|
|
| Total Annual Fund Operating Expenses |
|
|
| Fee Waiver and/or Expense Reimbursement(1) |
( |
|
| Total Annual Fund Operating Expenses After Fee Waiver and/or Expense Reimbursement(1) |
|
|
(1)
| |
Class I |
Class SC |
| 1 Year |
$ |
$ |
| 3 Years |
$ |
$ |
| 5 Years |
$ |
$ |
| 10 Years |
$ |
$ |
15
The Fund’s Principal Risks
The Fund’s share price will fluctuate. You could lose money on your investment in the Fund and the Fund could also return less than other investments. Investments in the Fund are not bank guaranteed, are not deposits, and are not insured by the Federal Deposit Insurance Corporation or any other federal government agency. As with any mutual fund, there is no guarantee that the Fund will achieve its investment goal. You can find more information about the Fund’s investments and risks under the “Principal Investment Strategies and Risks” section of the Fund’s prospectus. The Fund is subject to the principal risks summarized below.
16
17
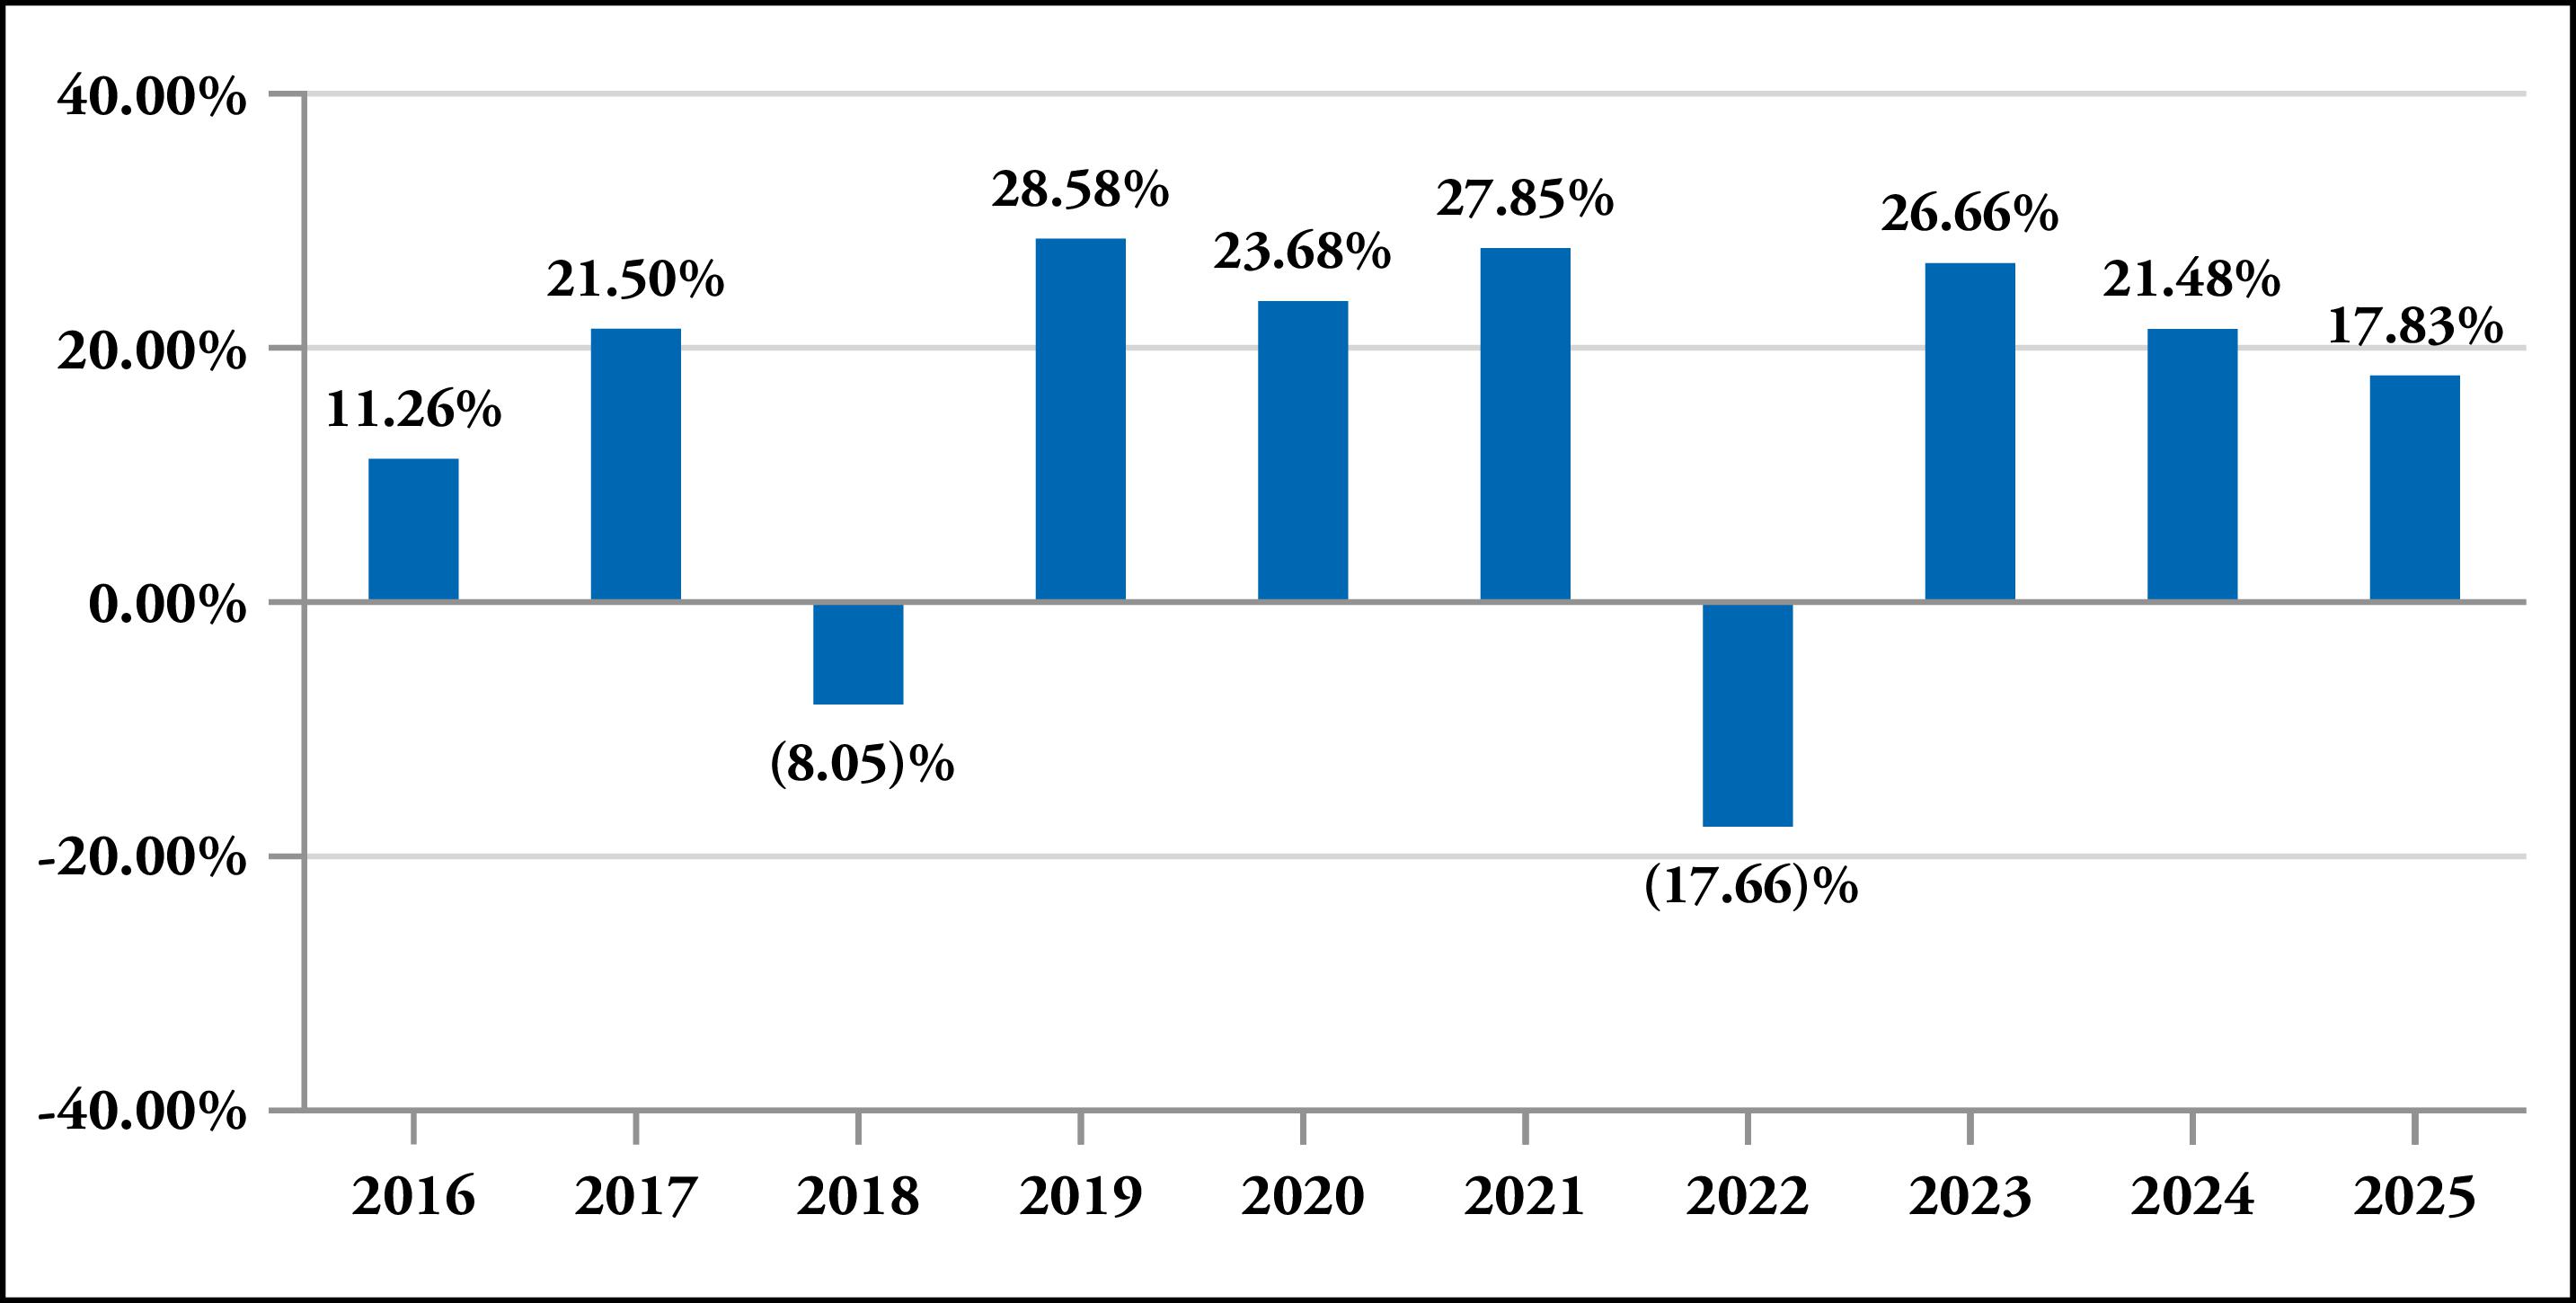
| | ||
| |
|
% |
| |
|
% |
| |
|
% |
| |
1 Year |
5 Years |
10 Years |
| Touchstone Common Stock Fund - Class I |
% |
% |
% |
| Touchstone Common Stock Fund - Class SC |
% |
% |
% |
| Bloomberg US 3000 Index(1) (reflects no deduction for fees, expenses or taxes) |
% |
% |
% |
| Bloomberg US 1000 Index(2) (reflects no deduction for fees, expenses or taxes) |
% |
% |
% |
| Russell 3000® Index (reflects no deduction for fees, expenses or taxes) |
% |
% |
% |
| Russell 1000® Index (reflects no deduction for fees, expenses or taxes) |
% |
% |
% |
(1)
(2)
The Fund’s Management
Investment Adviser
Touchstone Advisors, Inc. serves as the Fund’s investment adviser.
| Sub-Adviser |
Portfolio Manager |
Investment Experience with the Fund |
Primary Title with Sub-Adviser |
| Fort Washington Investment Advisors, Inc. |
James E. Wilhelm, Jr. |
Since inception in October 2017 |
Managing Director and Senior Portfolio Manager |
| |
Sunit Gogia |
Since 2024 |
Vice President, Portfolio Manager and Director of Equity Research |
Buying and Selling Fund Shares
You cannot buy or sell shares of the Fund directly. You can invest indirectly in the Fund through your purchase of a variable annuity contract or variable life policy. Please see the variable contract prospectus for additional investment information.
18
Tax Information
The dividends and distributions paid by the Fund will consist of ordinary income, capital gains or some combination of both. Because shares of the Fund must be purchased through separate accounts used to fund variable life and variable annuity insurance contracts, such dividends and distributions will be exempt from current taxation to you if you leave such amounts to accumulate within a separate account. Please see the variable contract prospectus for additional tax information.
Payments to Sponsoring Insurance Companies and Other Financial Intermediaries
The Fund or its distributor (and related companies) may pay broker/dealers or other financial intermediaries (such as insurance companies or their related companies) for the sale and retention of variable contracts that offer Fund shares and/or for other services. These payments may create a conflict of interest for a financial intermediary, or may be a factor in the insurance company’s decision to include the Fund as an investment option in its variable contract. For more information, ask your financial adviser, visit your financial intermediary’s website, or consult the variable contract prospectus or the Fund’s prospectus.
19
| |
Class I |
| |
|
| Management Fees |
|
| Other Expenses |
|
| Shareholder Service Fees |
|
| Other Operating Expenses |
|
| Total Other Expenses |
|
| Total Annual Fund Operating Expenses |
|
| Fee Waiver and/or Expense Reimbursement(1) |
( |
| Total Annual Fund Operating Expenses After Fee Waiver and/or Expense Reimbursement(1) |
|
(1)
| |
Class I |
| 1 Year |
$ |
| 3 Years |
$ |
| 5 Years |
$ |
| 10 Years |
$ |
20
The Fund’s Principal Risks
The Fund’s share price will fluctuate. You could lose money on your investment in the Fund and the Fund could also return less than other investments. Investments in the Fund are not bank guaranteed, are not deposits, and are not insured by the Federal Deposit Insurance Corporation or any other federal government agency. As with any mutual fund, there is no guarantee that the Fund will achieve its investment goal. You can find more information about the Fund’s investments and risks under the “Principal Investment Strategies and Risks” section of the Fund’s prospectus. The Fund is subject to the principal risks summarized below.
21
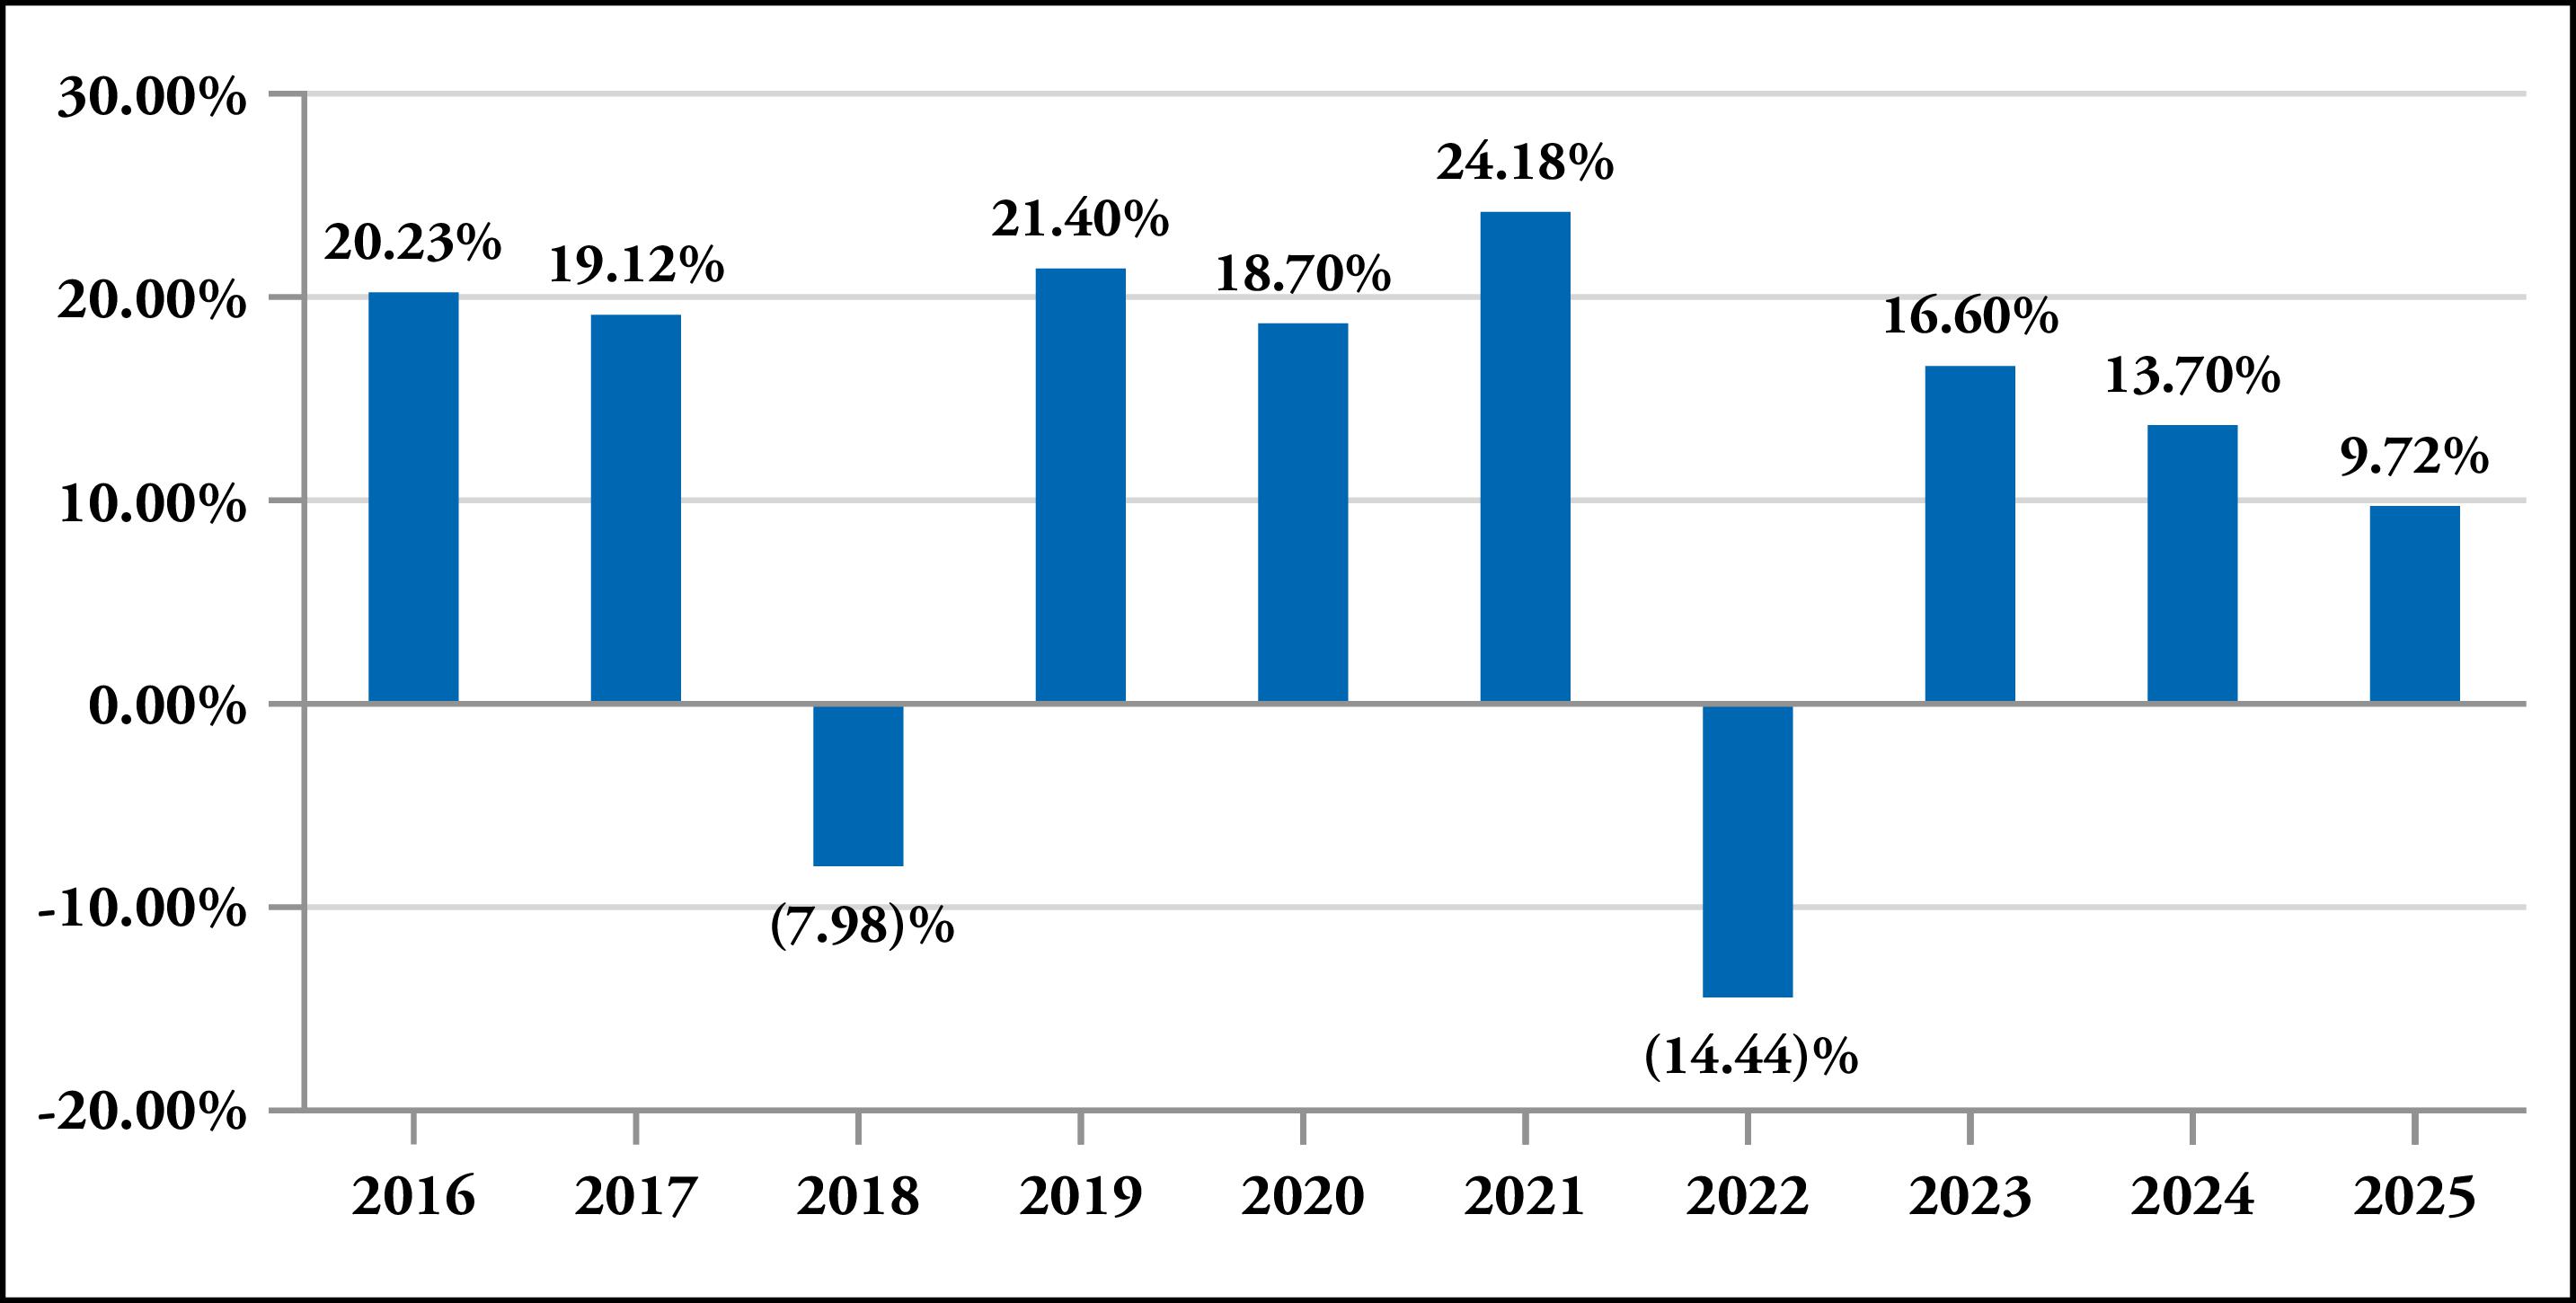
| | ||
| |
|
% |
| |
|
% |
| |
|
% |
22
| |
1 Year |
5 Years |
10 Years |
| Touchstone Small Company Fund - Class I |
% |
% |
% |
| Bloomberg US 3000 Index(1) (reflects no deduction for fees, expenses or taxes) |
% |
% |
% |
| Bloomberg US 2000 Index(2) (reflects no deduction for fees, expenses or taxes) |
% |
% |
% |
| Russell 3000® Index (reflects no deduction for fees, expenses or taxes) |
% |
% |
% |
| Russell 2000® Index (reflects no deduction for fees, expenses or taxes) |
% |
% |
% |
(1)
(2)
The Fund’s Management
Investment Adviser
Touchstone Advisors, Inc. serves as the Fund’s investment adviser.
| Sub-Adviser |
Portfolio Manager |
Investment Experience with the Fund |
Primary Title with Sub-Adviser |
| Fort Washington Investment Advisors, Inc. |
Jason Ronovech, CFA |
Since inception in October 2017; managed the Predecessor Fund from 2013 to 2017 |
Vice President and Senior Portfolio Manager |
Buying and Selling Fund Shares
You cannot buy or sell shares of the Fund directly. You can invest indirectly in the Fund through your purchase of a variable annuity contract or variable life policy. Please see the variable contract prospectus for additional investment information.
Tax Information
The dividends and distributions paid by the Fund will consist of ordinary income, capital gains or some combination of both. Because shares of the Fund must be purchased through separate accounts used to fund variable life and variable annuity insurance contracts, such dividends and distributions will be exempt from current taxation to you if you leave such amounts to accumulate within a separate account. Please see the variable contract prospectus for additional tax information.
Payments to Sponsoring Insurance Companies and Other Financial Intermediaries
The Fund or its distributor (and related companies) may pay broker/dealers or other financial intermediaries (such as insurance companies or their related companies) for the sale and retention of variable contracts that offer Fund shares and/or for other services. These payments may create a conflict of interest for a financial intermediary, or may be a factor in the insurance company’s decision to include the Fund as an investment option in its variable contract. For more information, ask your financial adviser, visit your financial intermediary’s website, or consult the variable contract prospectus or the Fund’s prospectus.
23
Prospectus
Shares of each Fund described in this prospectus can be purchased by insurance company separate accounts. You can invest indirectly in the Funds through your purchase of a variable annuity contract or variable life policy. When you purchase a variable annuity contract or variable life policy, you decide how to invest your purchase payments by selecting from the available investment options. The investment options may include sub-accounts that invest in the Funds of the Touchstone Variable Series Trust (the “Trust”).
Because the Trust offers shares to both variable annuity and variable life separate accounts of insurance companies, there may be conflicts of interest between the variable annuity and variable life contract holders. The Board of Trustees of the Trust (the “Board”) monitors for the existence of any potential conflicts of interest. If a conflict arises between the holders of variable annuity contracts and variable life insurance policies of participating insurance companies, a participating insurance company may be required to withdraw the assets allocable to some or all of the separate accounts from one or more of the Funds. Any withdrawal could disrupt orderly portfolio management to the potential detriment of shareholders.
You should read the prospectus for the variable annuity contract or variable life policy that you want to purchase to learn about purchasing a contract and selecting your investment options. That prospectus also contains information about the contract, your investment options, the sub-accounts and expenses related to purchasing a variable annuity contract or variable life policy.
24
Principal Investment Strategies and Risks
How Do The Funds Implement Their Investment Goal?
The investment goal(s) and principal investment strategies of Touchstone Balanced Fund (“Balanced Fund”), Touchstone Bond Fund (“Bond Fund”), Touchstone Common Stock Fund (“Common Stock Fund”), and Touchstone Small Company Fund (“Small Company Fund”) (each a “Fund” and collectively, the “Funds”) are described in the “Principal Investment Strategies” section in each Fund’s summary above.
Balanced Fund. With respect to equity securities, the Fund invests primarily in issuers having a market capitalization, at the time of purchase, above $5 billion. Equity securities include common stock and preferred stock. These securities may be listed on an exchange or traded over-the-counter. Up to 35% of the Fund’s equity sleeve may be invested in securities of foreign issuers through the use of ordinary shares or depositary receipts such as American Depositary Receipts (“ADRs”). The Fund may also invest in equity securities of emerging market countries. Emerging market countries are generally countries that are included in the Morgan Stanley Capital International (“MSCI”) Emerging Markets Index. As of March 31, 2026, the countries in the MSCI Emerging Markets Index included: Brazil, Chile, China, Colombia, Czech Republic, Egypt, Greece, Hungary, India, Indonesia, Korea, Kuwait, Malaysia, Mexico, Peru, Philippines, Poland, Qatar, Saudi Arabia, South Africa, Taiwan, Thailand, Turkey and United Arab Emirates. The country composition of the MSCI Emerging Markets Index can change over time.
With respect to fixed-income securities, the Fund will invest primarily in bonds, including mortgage-related securities, asset-backed securities, government securities (both U.S. government securities and foreign sovereign debt), and corporate debt securities. The Fund’s sub-adviser, Fort Washington, primarily invests in investment-grade debt securities, but may invest up to 30% of the Fund’s fixed-income sleeve in non-investment-grade debt securities rated as low as B by a NRSRO. Non-investment-grade debt securities are often referred to as “junk bonds” and are considered speculative. The Fund’s investment policies are based on credit ratings at the time of purchase.
The Fund may engage in frequent and active trading as part of its principal investment strategies. Additionally, in order to implement its investment strategy, the Fund may invest in mortgage dollar-roll transactions and in derivatives, including forwards, futures contracts, interest rate and credit default swap agreements, and options. Mortgage “dollar rolls” are transactions in which mortgage-backed securities are sold for delivery in the current month and the seller simultaneously contracts to repurchase substantially similar securities on a specified future date. These investments may be used to gain or hedge market exposure, to adjust the Fund’s duration, to manage interest rate risk, and for any other purposes consistent with the Fund’s investment strategies and limitations.
Bond Fund. In deciding which securities to buy and sell for the Fund, the Fund’s sub-adviser, Fort Washington, analyzes the overall investment opportunities and risks in different sectors of the debt securities markets by focusing on maximizing total return while reducing volatility of the Fund’s portfolio. Fort Washington follows a disciplined sector allocation process in order to build a broadly diversified portfolio of investments.
In building the Fund’s portfolio, Fort Washington primarily invests in investment-grade debt securities, but may invest up to 30% of the Fund’s total assets in non-investment-grade debt securities rated as low as B by a NRSRO. Non-investment-grade debt securities are often referred to as “junk bonds” and are considered speculative. The Fund’s investment policies are based on credit ratings at the time of purchase. The Fund may also invest up to 20% of its total assets in foreign-issued debt denominated in either the U.S. dollar or a foreign currency. Foreign-issued debt may include debt securities of emerging market countries. Emerging markets countries consist of countries in the JP Morgan Emerging Markets Bond Index (EMBI) Global. Foreign-issued debt securities are issued by non-U.S. companies of any size that are tied economically to foreign markets. The Fund will generally consider qualifying investments to be companies that are organized under the laws of, or maintain their principal place of business in, a foreign country; have securities that are principally traded in such countries; or derive at least 50% of revenues or profits from, or have at least 50% of their assets in, such countries.
Additionally, in order to implement its investment strategy, the Fund may invest in collateralized loan obligations, mortgage dollar-roll transactions and reverse repurchase agreements, and in derivatives including forwards and futures contracts, interest rate and credit default swap agreements, and options. These investments may be used for both gaining and hedging market exposure, to adjust the Fund’s duration, to manage interest rate risk, and for any other purposes consistent with its investment strategies and limitations. Mortgage “dollar rolls” are transactions in which mortgage-backed securities are sold for delivery in the current month and the seller simultaneously contracts to repurchase substantially similar securities on a specified future date. The Fund may engage in frequent and active trading as part of its principal investment strategy.
Common Stock Fund. In selecting securities for the Fund, the Fund’s sub-adviser, Fort Washington, seeks to invest in companies that:
●
Are trading below its estimate of the companies’ intrinsic value; and
25
●
Have a sustainable competitive advantage or a high barrier to entry in place. The barrier(s) to entry can be created through a cost advantage, economies of scale, high customer loyalty, or a government barrier (e.g., license or subsidy). Fort Washington believes that the strongest barrier to entry is the combination of economies of scale and higher customer loyalty.
The Fund will generally hold 25 to 45 companies, with residual cash and equivalents expected to represent less than 10% of the Fund’s net assets. The Fund may, at times, hold fewer securities and a higher percentage of cash and equivalents when, among other reasons, Fort Washington cannot find a sufficient number of securities that meets its purchase requirements. Although the Fund may invest in any economic sector, at times it may emphasize one or more particular sectors.
The Fund may invest up to 35% of its assets in securities of foreign issuers through the use of ordinary shares or depositary receipts such as ADRs. The Fund may also invest in securities of emerging market countries. Emerging market countries are generally countries that are included in the MSCI Emerging Markets Index. As of March 31, 2026, the countries in the MSCI Emerging Markets Index included: Brazil, Chile, China, Colombia, Czech Republic, Egypt, Greece, Hungary, India, Indonesia, Korea, Kuwait, Malaysia, Mexico, Peru, Philippines, Poland, Qatar, Saudi Arabia, South Africa, Taiwan, Thailand, Turkey and United Arab Emirates. The country composition of the MSCI Emerging Markets Index can change over time.
The Fund will generally sell a security if it reaches Fort Washington’s estimate of fair value, if a more attractive investment opportunity is available, or if a structural change has taken place and Fort Washington cannot reliably estimate the impact of the change on the business fundamentals.
Small Company Fund. The Fund seeks to invest primarily in common stocks of small companies that Fort Washington, the Fund’s sub-adviser, believes are high quality, have superior business models, solid management teams, sustainable growth potential and are attractively valued. For these purposes, an issuer’s market cap is determined at the time of purchase. The Fund may invest without limitation in foreign securities, although only where the securities are trading in the U.S. or Canada and only where trading is denominated in U.S. or Canadian dollars. Up to 25% of the Fund’s assets may be invested in securities within a single industry. Although the Fund may invest in any economic sector, at times it may emphasize one or more particular sectors. At times the Fund may have less than 80% of its investments in companies within the market cap range of the Russell 2000® Index due to market appreciation.
The Fund typically sells a security if the portfolio manager believes it is overvalued, if the original investment premise is no longer true, if the holding size exceeds the portfolio manager’s company or sector weighting guidelines and/or to take advantage of a more attractive investment opportunity. The Fund may also sell a partial position in a security in order to manage the size of the position. A security may also be sold to meet redemptions.
Can a Fund Depart From its Principal Investment Strategies?
In addition to the investments and strategies described in this prospectus, each Fund may invest in other securities, use other strategies and engage in other investment practices. These permitted investments and strategies are described in detail in the Funds’ Statement of Additional Information (“SAI”).
Each Fund’s investment goal is non-fundamental and may be changed by the Board of Trustees (the “Board”) without shareholder approval. Shareholders will be notified in writing at least 60 days before any change takes effect.
The investments and strategies described throughout this prospectus are those that the Funds use under normal circumstances. During unusual economic or market conditions, or for temporary defensive purposes, each Fund may invest up to 100% of its assets in cash, repurchase agreements, and short-term obligations (i.e., fixed and variable rate securities and high-quality debt securities of corporate and government issuers) that would not ordinarily be consistent with each Fund’s investment strategy. This defensive investing may increase a Fund’s taxable income, and when a Fund is invested defensively, it may not achieve its investment goal. A Fund will do so only if the Fund’s sub-adviser believes that the risk of loss in using the Fund’s normal strategies and investments outweighs the opportunity for gains. Of course, there can be no guarantee that any Fund will achieve its investment goal.
80% Investment Policy. The Bond Fund, the Common Stock Fund and the Small Company Fund have each adopted policies to invest, under normal conditions, at least 80% of the value of the Fund’s “assets” in certain types of investments suggested by its name (the “80% Policy”). For purposes of these 80% Policies, the term “assets” means net assets plus the amount of borrowings for investment purposes. A Fund must comply with its 80% Policy at the time the Fund invests its assets. Accordingly, when a Fund no longer meets the 80% requirement as a result of circumstances beyond its control, such as changes in the value of portfolio holdings, it would not have to sell its holdings but would have to make any new investments in such a way as to comply with the 80% Policy. A Fund’s 80% Policy is a non-fundamental investment policy that may be changed by the Fund upon 60 days’ prior written notice to the Fund’s shareholders.
Change in Market Capitalization. A Fund may specify in its principal investment strategy a market capitalization range for acquiring portfolio securities. If a security that is within the range for a Fund at the time of purchase later falls outside the range, which is most likely to happen because of market fluctuation, the Fund may continue to hold the security if, in the sub-adviser’s judgment, the security remains otherwise consistent with the Fund’s investment goal and strategies. However, this change in market capitalization could affect the Fund’s flexibility in making new investments.
26
The Balanced Fund, the Common Stock Fund and the Small Company Fund each have specified a market capitalization range with respect to equity securities.
Other Investment Companies. A Fund may invest in securities issued by other investment companies to the extent permitted by the Investment Company Act of 1940, as amended (the “1940 Act”) the rules thereunder and applicable Securities and Exchange Commission (“SEC”) staff interpretations thereof, or applicable exemptive relief granted by the SEC.
Lending of Portfolio Securities. The Funds may lend their portfolio securities to brokers, dealers, and financial institutions under guidelines adopted by the Board, including a requirement that a Fund must receive collateral equal to no less than 100% of the market value of the securities loaned. The risk in lending portfolio securities, as with other extensions of credit, consists of possible loss of rights in the collateral should the borrower fail financially. In determining whether to lend securities, the Adviser will consider all relevant facts and circumstances, including the creditworthiness of the borrower. More information on securities lending is available in the SAI.
What are the Principal Risks of Investing in the Funds?
The following is a list of principal risks that may apply to your investment in a Fund. Unless otherwise noted, in this section, references to a single Fund apply equally to all of the Funds. Further information about investment risks is available in the Funds’ SAI:
| Risks |
Balanced Fund |
Bond Fund |
Common Stock Fund |
Small Company Fund |
| Asset-Backed Securities Risk |
X |
X |
|
|
| Cash and Cash Equivalents Risk |
|
|
X |
|
| Collateralized Loan Obligations Risk |
|
X |
|
|
| Counterparty Risk |
|
X |
|
|
| Credit Risk |
X |
X |
|
|
| Cybersecurity Risk |
X |
X |
X |
X |
| Depositary Receipts Risk |
X |
|
X |
|
| Derivatives Risk |
X |
X |
|
|
| Economic and Market Events Risk |
X |
X |
X |
X |
| Emerging Markets Risk |
X |
X |
X |
|
| Equity Securities Risk |
X |
|
X |
X |
| Fixed-Income Risk |
X |
X |
|
|
| Foreign Securities Risk |
X |
X |
X |
X |
| Forward Foreign Currency Exchange Contract Risk |
X |
X |
|
|
| Futures Contracts Risk |
X |
X |
|
|
| Interest Rate Risk |
X |
X |
|
|
| Investment-Grade Debt Securities Risk |
X |
X |
|
|
| Large-Cap Risk |
X |
|
X |
|
| Leverage Risk |
X |
X |
|
|
| Management Risk |
X |
X |
X |
X |
| Mid-Cap Risk |
X |
|
X |
|
| Mortgage-Backed Securities Risk |
X |
X |
|
|
| Mortgage Dollar Roll Risk |
X |
X |
|
|
| Non-Diversification Risk |
|
|
X |
|
| Non-Investment-Grade Debt Securities Risk |
X |
X |
|
|
| Options Risk |
X |
X |
|
|
| Portfolio Turnover Risk |
X |
X |
|
|
| Preferred Stock Risk |
X |
|
X |
|
| Prepayment Risk |
X |
X |
|
|
| Rating Agency Risk |
X |
X |
|
|
| Reverse Repurchase Agreement Risk |
|
X |
|
|
| Sector and Industry Focus Risk |
|
|
X |
X |
| Small-Cap Risk |
|
|
|
X |
| Sovereign Debt Risk |
X |
X |
|
|
27
| Risks |
Balanced Fund |
Bond Fund |
Common Stock Fund |
Small Company Fund |
| Swap Agreements Risk |
X |
X |
|
|
| U.S. Government Securities Risk |
X |
X |
|
|
Cash and Cash Equivalents Risk: Under certain market conditions, such as during a rising stock market, rising interest rates or rising credit spread markets, the use of cash and/or cash equivalents, including money market instruments, could have a negative effect on the Fund’s ability to achieve its investment objective and may negatively impact the Fund’s performance. Holding cash or cash equivalents may cause the Fund to risk losing opportunities to participate in market appreciation and may cause the Fund to experience potentially lower returns than the Fund’s benchmark or other funds that remain fully invested. In rising markets, holding cash or cash equivalents may negatively affect the Fund’s performance relative to its benchmark, and there is a possibility that these holdings may not be able to keep pace with inflation. Cash equivalents are not guaranteed as to principal or interest, and the Fund could lose money through these investments.
Counterparty Risk: The issuer or guarantor of a fixed-income security, a counterparty (the other party to a transaction or an agreement) to a transaction with the Fund, or a borrower of the Fund’s securities may be unable or unwilling to make timely principal, interest or settlement payments, or otherwise honor its obligations.
Collateralized Loan Obligations Risk: A collateralized loan obligation (“CLO”) is a type of asset-backed security that is an obligation of a trust typically collateralized by pools of loans, which may include domestic and foreign senior secured and unsecured loans and subordinate corporate loans, including loans that may be rated below investment grade, or equivalent unrated loans. The cash flows from the trust are split into two or more portions, called tranches, which vary in risk and yield. The riskier portion is the residual, or “equity,” tranche, which bears some or all of the risk of default by the loans in the trust. The risks of an investment in a CLO largely depend on the type of underlying collateral securities and the tranche in which a Fund invests. Typically, CLOs are privately offered and sold, and thus are not registered under the securities laws. As a result, a Fund may in certain circumstances characterize its investments in CLOs as illiquid. In assessing liquidity, a Fund will consider various factors including whether the CLO may be purchased and sold in Rule 144A transactions and whether an active dealer market exists. CLOs are subject to the typical risks associated with debt instruments (i.e., interest rate risk and credit risk). Additional risks of CLOs include the possibility that distributions from collateral securities will be insufficient to make interest or other payments, the potential for a decline in the quality of the collateral, and the possibility that a Fund may invest in a subordinate tranche of a CLO. In addition, due to the complex nature of a CLO, an investment in a CLO may not perform as expected. An investment in a CLO also is subject to the risk that the issuer and the investors may interpret the terms of the instrument differently, giving rise to disputes.
Cybersecurity Risk: With the increased use of technologies, such as mobile devices and cloud-based service offerings and the dependence on the Internet and computer systems to perform necessary business functions, the Funds' service providers are susceptible to operational and information or cybersecurity risks that could result in losses to a Fund and its shareholders. Cybersecurity breaches are either intentional or unintentional events that allow an unauthorized party to gain access to Fund assets, customer data, or proprietary information, or cause a Fund or Fund service provider to suffer data corruption or lose operational functionality. Intentional cybersecurity incidents include: unauthorized access to systems, networks, or devices (such as through “hacking” activity or “phishing”); infection from computer viruses or other malicious software code; and attacks that shut down, disable, slow, or otherwise disrupt operations, business processes, or website access or functionality. Cyber-attacks can also be carried out in a manner that does not require gaining unauthorized access, such as causing denial-of-service attacks on the Funds' service providers’ systems or websites rendering them unavailable to intended users or via “ransomware” that renders the systems inoperable until appropriate actions are taken. In addition, unintentional incidents can occur, such as the inadvertent release of confidential information (possibly resulting in the violation of applicable privacy laws).
A cybersecurity breach could result in the loss or theft of customer data or funds, loss or theft of proprietary information or corporate data, physical damage to a computer or network system, or costs associated with system repairs, any of which could have a substantial impact on the Funds. For example, in a denial of service, Fund shareholders could lose access to their electronic accounts indefinitely, and employees of the Adviser, a Sub-Adviser, or the Funds' other service providers may not be able to access electronic systems to perform critical duties for the Fund, such as trading, NAV calculation, shareholder accounting, or fulfillment of Fund share purchases and redemptions. Cybersecurity incidents could cause a Fund, the Adviser, a Sub-Adviser, or other service provider to incur regulatory penalties, reputational damage, compliance costs associated with corrective measures, litigation costs, or financial loss. They may also result in violations of applicable privacy and other laws. In addition, such incidents could affect issuers in which a Fund invests, thereby causing the Fund’s investments to lose value.
Cyber-events have the potential to materially affect the Funds', the Adviser’s and the Sub-Adviser’s relationships with accounts, shareholders, clients, customers, employees, products, and service providers. The Funds have established risk management systems reasonably designed to seek to reduce the risks associated with cyber-events. There is no guarantee that the Funds will be able to prevent or mitigate the impact of any or all cyber-events.
28
The Funds are exposed to operational risk arising from a number of factors, including, but not limited to, human error, processing and communication errors, errors of the Funds' service providers, counterparties, or other third parties, failed or inadequate processes, and technology or system failures.
The Adviser, Sub-Advisers, and their affiliates have established risk management systems that seek to reduce cybersecurity and operational risks, and business continuity plans in the event of a cybersecurity breach or operational failure. However, there are inherent limitations in such plans, including that certain risks have not been identified, and there is no guarantee that such efforts will succeed, especially since none of the Adviser, the Sub-Advisers, or their affiliates controls the cybersecurity or operations systems of the Funds' third party service providers (including the Funds' custodian), or those of the issuers of securities in which a Fund invests.
In addition, other disruptive events, including (but not limited to) natural disasters and public health crises, may adversely affect a Fund’s ability to conduct business, in particular if the Fund’s employees or the employees of its service providers are unable or unwilling to perform their responsibilities as a result of any such event. Even if the Fund’s employees and the employees of its service providers are able to work remotely, those remote work arrangements could result in the Fund’s business operations being less efficient than under normal circumstances, could lead to delays in its processing of transactions, and could increase the risk of cyber-events.
Derivatives Risk: The use of derivatives may expose a Fund to additional risks that it would not be subject to if it invested directly in the securities underlying those derivatives. Risks associated with derivatives may include correlation risk, which is the risk that the derivative does not correlate well with the security, index, or currency to which it relates. Other risks include liquidity risk, which is the risk that a Fund may be unable to sell or close out the derivative due to an illiquid market, counterparty risk, which is the risk that the counterparty to a derivative instrument may be unwilling or unable to make required payments or otherwise meet its obligations, and leverage risk, which is the risk that a derivative could expose a Fund to magnified losses resulting from leverage. The use of derivatives for hedging purposes may result in losses that partially or completely offset gains in portfolio positions. Using derivatives can increase the volatility of a Fund’s share price. For some derivatives, it is possible for a Fund to lose more than the amount invested in the derivative instrument. Derivatives may, for federal income tax purposes, affect the character of gain and loss realized by a Fund , accelerate recognition of income to a Fund , affect the holding periods for certain of a Fund ’s assets and defer recognition of certain of a Fund ’s losses. A Fund ’s ability to invest in derivatives may be restricted by certain provisions of the federal income tax laws relating to a Fund ’s qualification as a regulated investment company (“RIC”). These additional risks could cause a Fund to experience losses to which it would otherwise not be subject. Regulatory changes in derivatives markets could impact the cost of or a Fund ’s ability to engage in derivative transactions.
To limit risks associated with leverage, a fund is required to comply with Rule 18f-4 under the Investment Company Act of 1940, as amended (the “Derivatives Rule”). The Derivatives Rule mandates that a fund adopt and/or implement: (i) value-at-risk limitations (“VaR”); (ii) a written derivatives risk management program; (iii) new Board oversight responsibilities; and (iv) new reporting and recordkeeping requirements. In the event that a Fund's derivative exposure is 10% or less of its net assets, excluding certain currency and interest rate hedging transactions, it can elect to be classified as a limited derivatives user (“Limited Derivatives User”) under the Derivatives Rule, in which case a fund is not subject to the full requirements of the Derivatives Rule. Limited Derivatives Users are excepted from VaR testing, implementing a derivatives risk management program, and certain Board oversight and reporting requirements mandated by the Derivatives Rule. However, a Limited Derivatives User is still required to implement written compliance policies and procedures reasonably designed to manage its derivatives risks.
The Derivatives Rule also provides special treatment for reverse repurchase agreements, similar financing transactions and unfunded commitment agreements. Specifically, a fund may elect whether to treat reverse repurchase agreements and similar financing transactions as “derivatives transactions” subject to the requirements of the Derivatives Rule or as senior securities equivalent to bank borrowings for purposes of Section 18 of the 1940 Act. In addition, when-issued or forward settling securities transactions that physically settle within 35 days are deemed not to involve a senior security.
●
Forward Foreign Currency Exchange Contract Risk: A forward foreign currency exchange contract is an agreement to buy or sell a specific currency at a future date and at a price set at the time of the contract. Forward foreign currency exchange contracts may reduce the risk of loss from a change in value of a currency, but they also limit any potential gains and do not protect against fluctuations in the value of the underlying position and are subject to counterparty risk. The forecasting of currency market movement is extremely difficult, and whether any hedging strategy will be successful is highly uncertain. Moreover, it is impossible to forecast with precision the market value of portfolio securities at the expiration of a forward foreign currency contract. Accordingly, a Fund may be required to buy or sell additional currency on the spot market (and bear the expense of such transaction) if the sub-adviser’s predictions regarding the movement of foreign currency or securities markets prove inaccurate. Because foreign currency forward contracts are privately negotiated transactions, there can be no assurance that a Fund will have flexibility to rollover a forward foreign currency contract upon its expiration if it desires to do so. Additionally, there can be no assurance that the other party to the contract will perform its services under the contract.
●
Futures Contracts Risk: Futures contracts provide for the future sale by one party and purchase by another party of a specified amount of a specific security at a specified future time and at a specified price. An option on a futures contract gives the purchaser the right, in exchange for a premium, to assume a position in a futures contract at a specified exercise price during the term of the option. There are risks associated with these activities, including the following: (1) the success of a hedging strategy may depend on an ability to predict movements in the prices of individual securities, fluctuations in markets and movements in interest rates; (2) there may be
29
an imperfect or no correlation between the changes in market value of the securities held by a Fund and the prices of futures and options on futures; (3) there may not be a liquid secondary market for a futures contract or option; (4) trading restrictions or limitations may be imposed by an exchange; and (5) government regulations may restrict trading in futures contracts and futures options.
●
Leverage Risk: Leverage occurs when a Fund uses derivatives or similar instruments or techniques to gain exposure to investments in an amount that exceeds a Fund’s initial investment. The use of leverage magnifies changes in a Fund’s net asset value and thus results in increased portfolio volatility and increased risk of loss. Leverage can also create an interest expense that may lower a Fund’s overall returns. There can be no guarantee that a leveraging strategy will be successful.
●
Options Risk: Options trading is a highly specialized activity that involves investment techniques and risks different from those associated with ordinary portfolio securities transactions. The value of options can be highly volatile, and their use can result in loss if the Sub-Adviser is incorrect in its expectation of price fluctuations. The successful use of options for hedging purposes also depends in part on the ability of the Sub-Adviser to predict future price fluctuations and the degree of correlation between the options and securities markets. When options are purchased over the counter, a Fund bears counterparty risk, which is the risk that the counterparty that wrote the option will be unable or unwilling to perform its obligations under the option contract. Such options may also be illiquid, and in such cases, a Fund may have difficulty closing out its position.
●
Swap Agreements Risk: Swap agreements (“swaps”) are individually negotiated and structured to include exposure to a variety of different types of investments or market factors, such as interest rates, foreign currency rates, mortgage securities, corporate borrowing rates, security prices, indexes or inflation rates. Swaps may increase or decrease the overall volatility of the investments of a Fund and its share price. The performance of swaps may be affected by a change in the specific interest rate, currency, or other factors that determine the amounts of payments due to and from a Fund. If a swap calls for payments by a Fund, a Fund must be prepared to make such payments when due. Additionally, if the counterparty’s creditworthiness declines, the value of a swap may decline. If the counterparty is unable to meet its obligations under the contract, declares bankruptcy, defaults, or becomes insolvent, a Fund may not be able to recoup the money it expected to receive under the contract. Finally, a swap can be a form of leverage, which can magnify a Fund’s gains or losses.
Economic and Market Events Risk: Events in certain sectors historically have resulted, and may in the future result, in an unusually high degree of volatility in the financial markets, both domestic and foreign. These events have included, but are not limited to: bankruptcies, corporate restructurings, bank failures, and other similar events; governmental efforts to limit short selling and high frequency trading; measures to address U.S. federal and state budget deficits; social, political, and economic instability in Europe; economic stimulus by the Japanese central bank; dramatic changes in energy prices and currency exchange rates; and China’s economic slowdown. Interconnected global economies and financial markets increase the possibility that conditions in one country or region might adversely impact issuers in a different country or region. Both domestic and foreign equity markets have experienced increased volatility and turmoil, with issuers that have exposure to the real estate, mortgage, and credit markets particularly affected. Financial institutions could suffer losses as interest rates rise or economic conditions deteriorate. In addition, relatively high market volatility and reduced liquidity in credit and fixed-income markets may adversely affect many issuers worldwide.
Government Actions. Actions taken by the U.S. Federal Reserve (“Fed”) or foreign central banks to stimulate or stabilize economic growth, such as interventions in currency markets, could cause high volatility in the equity and fixed-income markets. Reduced liquidity may result in less money being available to purchase raw materials, goods, and services from emerging markets, which may, in turn, bring down the prices of these economic staples. It may also result in emerging-market issuers having more difficulty obtaining financing, which may, in turn, cause a decline in their securities prices.
In response to certain economic conditions, including periods of high inflation, governmental authorities and regulators may respond with significant fiscal and monetary policy changes such as raising interest rates. A Fund may be subject to heightened interest rate risk when the Fed raises interest rates. Recent and potential future changes in government monetary policy may affect interest rates. It is difficult to accurately predict the timing, frequency, or magnitude of potential interest rate increases or decreases by the Fed, and the evaluation of macro-economic and other conditions could cause a change in approach in the future. If the Fed and other central banks increase the federal funds rate and equivalent rates, such increases generally will cause market interest rates to rise and could cause the value of a Fund’s investments, and a Fund’s NAV, to decline, potentially suddenly and significantly. As a result, a Fund may experience high redemptions and, as a result, increased portfolio turnover, which could increase the costs that a Fund incurs and may negatively impact a Fund’s performance.
In addition, if the Fed increases the target Fed funds rate, any such rate increases, among other factors, could cause markets to experience continuing high volatility. A significant increase in interest rates may cause a decline in the market for equity securities. These events and the possible resulting market volatility may have an adverse effect on a Fund.
Health Crises. A widespread health crisis such as a global pandemic could cause substantial market volatility, exchange trading suspensions and closures, which may lead to less liquidity in certain instruments, industries, sectors or the markets generally, and may ultimately affect Fund performance. For example, the coronavirus (“COVID-19”) pandemic resulted and may continue to result in significant disruptions to global business activity and market volatility due to disruptions in market access, resource availability, facilities operations, imposition of tariffs, export controls and supply chain disruption, among others. The impact of a health crisis and other epidemics and pandemics that
30
may arise in the future could affect the global economy in ways that cannot necessarily be foreseen at the present time. A health crisis may exacerbate other pre-existing political, social and economic risks. Any such impact could adversely affect a Fund’s performance, resulting in losses to your investment.
Foreign Market Disruptions. Uncertainties surrounding the sovereign debt of a number of European Union (EU) countries and the viability of the EU have disrupted and may in the future disrupt markets in the United States and around the world. If one or more countries leave the EU, as the United Kingdom did in January of 2020 (commonly referred to as “Brexit”), or the EU dissolves, the global securities markets likely will be significantly disrupted. See “Foreign Securities Risk” for additional risks associated with investments in foreign securities.
Political Turmoil and Military Events. Political turmoil within the United States and abroad may also impact a Fund. Although the U.S. government has honored its credit obligations, it remains possible that the United States could default on its obligations. While it is impossible to predict the consequences of such an unprecedented event, it is likely that a default by the United States would be highly disruptive to the U.S. and global securities markets and could significantly impair the value of a Fund’s investments. Similarly, political events within the United States at times have resulted, and may in the future result, in a shutdown of government services, which could negatively affect the U.S. economy, decrease the value of a Fund’s investments, and increase uncertainty in or impair the operation of the U.S. or other securities markets. The imposition by the U.S. of import tariffs on goods from foreign countries and the reciprocal tariffs levied on U.S. goods may lead to price volatility and instability in U.S. and global investment markets. Among other effects, tariffs may increase the cost of production for certain goods or reduce demand for products, which could affect the performance of a Fund’s investments. It is not known whether, or to what extent, any tariff or other trade protections may affect a Fund or its investments.
Political and military events, including in North Korea, Venezuela, Russia, Ukraine, Iran, Syria, and other areas of the Middle East, and nationalist unrest in Europe and South America, also may cause market disruptions. As a result of continued political tensions and armed conflicts, including the Russian invasion of Ukraine commencing in February of 2022, the extent and ultimate result of which are unknown at this time, the United States and the EU, along with the regulatory bodies of a number of countries, have imposed economic sanctions on certain Russian corporate entities and individuals, and certain sectors of Russia’s economy, which may result in, among other things, the continued devaluation of Russian currency, a downgrade in the country’s credit rating, and/or a decline in the value and liquidity of Russian securities, property or interests. These sanctions could also result in the immediate freeze of Russian securities and/or funds invested in prohibited assets, impairing the ability of a Fund to buy, sell, receive or deliver those securities and/or assets. These sanctions or the threat of additional sanctions could also result in Russia taking counter measures or retaliatory actions, which may further impair the value and liquidity of Russian securities. The United States and other nations or international organizations may also impose additional economic sanctions or take other actions that may adversely affect Russia exposed issuers and companies in various sectors of the Russian economy. Any or all of these potential results could lead Russia’s economy into a recession. Economic sanctions and other actions against Russian institutions, companies, and individuals resulting from the ongoing conflict may also have a substantial negative impact on other economies and securities markets both regionally and globally, as well as on companies with operations in the conflict region, the extent to which is unknown at this time. The United States and the EU have also imposed similar sanctions on Belarus for its support of Russia’s invasion of Ukraine. Additional sanctions may be imposed on Belarus and other countries that support Russia. Any such sanctions could present substantially similar risks as those resulting from the sanctions imposed on Russia, including substantial negative impacts on the regional and global economies and securities markets.
Inflation/Deflation. In addition, there is a risk that the prices of goods and services in the United States and many foreign economies may decline over time, known as deflation. Deflation may have an adverse effect on stock prices and creditworthiness and may make defaults on debt more likely. If a country’s economy slips into a deflationary pattern, it could last for a prolonged period and may be difficult to reverse. Further, there is a risk that the present value of assets or income from investments will be less in the future, known as inflation. Inflation rates may change frequently and drastically as a result of various factors, including unexpected shifts in the domestic or global economy, and a Fund’s investments may be affected, which may reduce a Fund’s performance. Further, inflation may lead to the rise in interest rates, which may negatively affect the value of debt instruments held by a Fund, resulting in a negative impact on a Fund’s performance. Generally, securities issued in emerging markets are subject to a greater risk of inflationary or deflationary forces, and more developed markets are better able to use monetary policy to normalize markets.
Equity Securities Risk: A Fund is subject to the risk that stock prices will fall over short or extended periods of time. Individual companies may report poor results or be negatively affected by industry and/or economic trends and developments, or as a result of irregular and/or unexpected trading activity among retail investors. The prices of securities issued by these companies may decline in response to such developments, which could result in a decline in the value of a Fund’s shares. These factors contribute to price volatility. In addition, common stocks represent a share of ownership in a company, and rank after bonds and preferred stock in their claim on the company’s assets in the event of liquidation.
●
Large-Cap Risk: A Fund is subject to the risk that stocks of larger companies may underperform relative to those of small and mid-sized companies. Large-cap companies may be unable to respond quickly to new competitive challenges, such as changes in technology and consumer tastes, and also may not be able to attain the high growth rate of successful smaller companies, especially during extended periods of economic expansion.
31
●
Mid-Cap Risk: A Fund is subject to the risk that medium capitalization stocks may underperform other types of stocks or the equity markets as a whole. Stocks of mid-sized companies may be subject to more abrupt or erratic market movements than stocks of larger, more established companies. Mid-sized companies may have limited product lines or financial resources, and may be dependent upon a particular niche of the market.
●
Preferred Stock Risk: Preferred stock represents an equity interest in an issuer that pays dividends at a specified rate and that has precedence over common stock in the payment of dividends. In the event an issuer is liquidated or declares bankruptcy, the claims of owners of bonds take precedence over the claims of those who own preferred and common stock. If interest rates rise, the fixed dividend on preferred stocks may be less attractive, causing the price of preferred stocks to decline. Preferred stock may have mandatory sinking fund provisions, as well as provisions allowing the stock to be called or redeemed prior to its maturity, both of which can have a negative impact on the stock’s price when interest rates decline.
●
Small-Cap Risk: A Fund is subject to the risk that small capitalization stocks may underperform other types of stocks or the equity markets as a whole. Stocks of smaller companies may be subject to more abrupt or erratic market movements than stocks of larger, more established companies. Small companies may have limited product lines or financial resources, or may be dependent upon a small or inexperienced management group. In addition, small-cap stocks typically are traded in lower volume, and their issuers typically are subject to greater degrees of changes in their earnings and prospects.
Fixed Income Risk: The market value of a Fund’s fixed-income securities responds to economic developments, particularly interest rate changes, as well as to perceptions about the creditworthiness of individual issuers, including governments. Generally, a Fund’s fixed-income securities will decrease in value if interest rates rise and increase in value if interest rates fall. Normally, the longer the maturity or duration of the fixed-income securities a Fund owns, the more sensitive the value of a Fund’s shares will be to changes in interest rates. In response to certain economic disruptions, governmental authorities and regulators typically respond to this crisis with significant fiscal and monetary policy changes, including considerably lowering interest rates, which, in some cases could result in negative interest rates. These actions, including their reversal or potential ineffectiveness, could further increase volatility in securities and other financial markets and reduce market liquidity. To the extent a Fund has a bank deposit or holds a debt instrument with a negative interest rate to maturity, a Fund would generate a negative return on that investment. Similarly, negative rates on investments by money market funds and similar cash management products could lead to losses on investments, including on investments of a Fund's uninvested cash. In response to certain economic conditions, including periods of high inflation, governmental authorities and regulators may respond with significant fiscal and monetary policy changes such as raising interest rates. A Fund may be subject to heightened interest rate risk when the Fed raises interest rates. Recent and potential future changes in government monetary policy may affect interest rates. It is difficult to accurately predict the timing, frequency, or magnitude of potential interest rate increases or decreases by the Fed, and the evaluation of macro-economic and other conditions could cause a change in approach in the future. If the Fed and other central banks increase the federal funds rate and equivalent rates, such increases generally will cause market interest rates to rise and could cause the value of a Fund’s investments, and a Fund’s NAV, to decline, potentially suddenly and significantly. As a result, a Fund may experience high redemptions and, as a result, increased portfolio turnover, which could increase the costs that a Fund incurs and may negatively impact a Fund's performance.
●
Asset-Backed Securities Risk: Asset-backed securities are fixed income securities backed by other assets such as credit card, automobile or consumer loan receivables, retail installment loans, or participations in pools of leases. Credit support for these securities may be based on the structural features such as subordination or overcollateralization and/or provided through credit enhancements by a third party. Even with a credit enhancement by a third party, there is still risk of loss. There could be inadequate collateral or no collateral for asset-backed securities. The values of these securities are sensitive to changes in the credit quality of the underlying collateral, the credit strength of the credit enhancement, changes in interest rates, and, at times, the financial condition of the issuer. Some asset-backed securities also may receive prepayments that can change the securities’ effective durations.
●
Credit Risk: The fixed-income securities in a Fund’s portfolio are subject to the possibility that a deterioration, whether sudden or gradual, in the financial condition of an issuer, or a deterioration in general economic conditions, could cause an issuer to fail to make timely payments of principal or interest when due. This may cause the issuer’s securities to decline in value. Credit risk is particularly relevant to those portfolios that invest a significant amount of their assets in non-investment grade (or “junk”) bonds or lower-rated securities.
●
Interest Rate Risk: The market price of debt securities is generally linked to the prevailing market interest rates. In general, when interest rates rise, the prices of debt securities fall, and when interest rates fall, the prices of debt securities rise. The price volatility of a debt security also depends on its maturity. Longer-term securities are generally more volatile, so the longer the average maturity or duration of these securities, the greater their price risk. Duration is a measure used to determine the sensitivity of a security’s price to changes in interest rates that incorporates a security’s yield, coupon, final maturity, and call features, among other characteristics. The longer a fixed-income security’s duration, the more sensitive it will be to changes in interest rates. Specifically, duration is the change in the value of a fixed-income security that will result from a 1% change in interest rates, and generally is stated in years. For example, as a general rule a 1% rise in interest rates means a 1% fall in value for every year of duration. Maturity, on the other hand, is the date on which a fixed-income security becomes due for payment of principal. There may be less governmental intervention in the securities markets in the near future. An increase in interest rates could negatively impact a Fund’s net asset value. Recent and potential future changes in government monetary policy may affect interest rates.
32
●
Investment-Grade Debt Securities Risk: Investment-grade debt securities may be downgraded by a NRSRO to below-investment-grade status, which would increase the risk of holding these securities. Investment-grade debt securities rated in the lowest rating category by a NRSRO involve a higher degree of risk than fixed-income securities with higher credit ratings. While such securities are considered investment-grade quality and are deemed to have adequate capacity for payment of principal and interest, such securities lack outstanding investment characteristics and may share certain speculative characteristics with non-investment-grade securities.
●
Mortgage-Backed Securities Risk: Mortgage-backed securities are fixed income securities representing an interest in a pool of underlying mortgage loans. Mortgage-backed securities are sensitive to changes in interest rates, but may respond to these changes differently from other fixed income securities due to the possibility of prepayment of the underlying mortgage loans. As a result, it may not be possible to determine in advance the actual maturity date or average life of a mortgage-backed security. Rising interest rates tend to discourage re-financings, with the result that the average life and volatility of the security will increase, exacerbating its decrease in market price. When interest rates fall, however, mortgage-backed securities may not gain as much in market value because of the expectation of additional mortgage prepayments that must be reinvested at lower interest rates. Prepayment risk may make it difficult to calculate the average duration of a Fund’s mortgage-backed securities and, therefore, to fully assess the interest rate risk of a Fund. An unexpectedly high rate of defaults on the mortgages held by a mortgage pool may adversely affect the value of mortgage-backed securities and could result in losses to a Fund. The risk of such defaults is generally higher in the cases of mortgage pools that include subprime mortgages. Subprime mortgages refer to loans made to borrowers with weakened credit histories or with lower capacity to make timely payments on their mortgages. In addition, mortgage-backed securities may fluctuate in price based on deterioration in the perceived or actual value of the collateral underlying the pool of mortgage loans, typically residential or commercial real estate, which may result in negative amortization or negative equity meaning that the value of the collateral would be worth less than the remaining principal amount owed on the mortgages in the pool.
●
Non-Investment-Grade Debt Securities Risk: Non-investment-grade debt securities are sometimes referred to as “junk bonds” and are considered speculative with respect to their issuers’ ability to make payments of interest and principal. There is a high risk that a Fund could suffer a loss from investments in non-investment-grade debt securities caused by the default of an issuer of such securities. Part of the reason for this high risk is that non-investment-grade debt securities are generally unsecured and therefore, in the event of a default or bankruptcy, holders of non-investment-grade debt securities generally will not receive payments until the holders of all other debt have been paid. Non-investment-grade debt securities may also be less liquid than investment-grade debt securities.
●
Prepayment Risk: Prepayment risk is the risk that a debt security may be paid off and proceeds invested earlier than anticipated. Prepayment risk is more prevalent during periods of falling interest rates. Prepayment impacts both the interest rate sensitivity of the underlying asset, such as an asset-backed or mortgage-backed security, and its cash flow projections. Therefore, prepayment risk may make it difficult to calculate the average duration of a Fund’s asset- or mortgage-backed securities which in turn would make it difficult to assess the interest rate risk of the Fund.
●
Rating Agency Risk: Ratings represent a NRSRO opinion regarding the quality of the security and are not a guarantee of quality. NRSROs may fail to timely update credit ratings in response to subsequent events. In addition, NRSROs are subject to an inherent conflict of interest because they are often compensated by the same issuers whose securities they grade.
●
U.S. Government Securities Risk: Certain U.S. government securities are backed by the right of the issuer to borrow from the U.S. Treasury while others are supported only by the credit of the issuer or instrumentality. While the U.S. government is able to provide financial support to U.S. government-sponsored agencies or instrumentalities, no assurance can be given that it will always do so. Such securities are neither issued nor guaranteed by the U.S. Treasury.
Foreign Securities Risk: Investing in foreign securities poses additional risks since political and economic events unique in a country or region will affect those markets and their issuers, while such events may not necessarily affect the U.S. economy or issuers located in the United States. In addition, investments in foreign securities are generally denominated in foreign currency. As a result, changes in the value of those currencies compared to the U.S. dollar may affect the value of a Fund’s investments. These currency movements may happen separately from, or in response to, events that do not otherwise affect the value of the security in the issuer’s home country. There is a risk that issuers of foreign securities may not be subject to accounting standards or governmental supervision comparable to those to which U.S. companies are subject and that less public information about their operations may exist. There is risk associated with the clearance and settlement procedures in non-U.S. markets, which may be unable to keep pace with the volume of securities transactions and may cause delays. Foreign markets may be less liquid and more volatile than U.S. markets and offer less protection to investors. Over-the-counter securities may also be less liquid than exchange-traded securities. Investments in securities of foreign issuers may be subject to foreign withholding and other taxes. In addition, it may be more difficult and costly for a Fund to seek recovery from an issuer located outside the United States in the event of a default on a portfolio security or an issuer’s insolvency proceeding. To the extent a Fund focuses its investments in a single country or only a few countries in a particular geographic region, economic, political, regulatory or other conditions affecting such country or region may have a greater impact on Fund performance relative to a more geographically diversified fund.
While a Fund’s net assets are valued in U.S. dollars, the securities of foreign companies are frequently denominated in foreign currencies. Thus, a change in the value of a foreign currency against the U.S. dollar will result in a corresponding change in value of securities denominated in that currency. Some of the factors that may impair the investments denominated in a foreign currency are: (1) it may be expensive to convert foreign currencies into U.S. dollars and vice versa; (2) complex political and economic factors may significantly affect the values of various currencies, including U.S. dollars, and their exchange rates; (3) government intervention may increase risks involved
33
in purchasing or selling foreign currency options, forward contracts and futures contracts, since exchange rates may not be free to fluctuate in response to other market forces; (4) there may be no systematic reporting of last sale information for foreign currencies or regulatory requirement that quotations available through dealers or other market sources be firm or revised on a timely basis; (5) available quotation information is generally representative of very large round-lot transactions in the inter-bank market and thus may not reflect exchange rates for smaller odd-lot transactions (less than $1 million) where rates may be less favorable; and (6) the inter-bank market in foreign currencies is a global, around-the-clock market. To the extent that a market is closed while the markets for the underlying currencies remain open, certain markets may not always reflect significant price and rate movements.
Political events in foreign countries may cause market disruptions. Uncertainties surrounding the sovereign debt of a number of European Union (“EU”) countries and the viability of the EU have disrupted and may in the future disrupt markets in the United States and around the world. If one or more countries leave the EU, as the United Kingdom did in January of 2020 (commonly referred to as “Brexit”), or the EU dissolves, the global securities markets likely will be significantly disrupted.
●
Depositary Receipts Risk: Foreign receipts, which include American Depository Receipts (“ADRs”), Global Depositary Receipts (“GDRs”), and European Depositary Receipts (“EDRs”), are securities that evidence ownership interests in a security or a pool of securities issued by a foreign issuer. The risks of depositary receipts include many risks associated with investing directly in foreign securities, such as individual country risk and liquidity risk. Unsponsored ADRs, which are issued by a depositary bank without the participation or consent of the issuer, involve additional risks because U.S. reporting requirements do not apply, and the issuing bank will recover shareholder distribution costs from movement of share prices and payment of dividends. Additionally, the Holding Foreign Companies Accountable Act “HFCAA” could cause securities of foreign companies, including ADRs, to be delisted from U.S. stock exchanges if the companies do not allow the U.S. government to oversee the auditing of their financial information. Although the requirements of the HFCAA apply to securities of all foreign issuers, the SEC has thus far limited its enforcement efforts to securities of Chinese companies. If securities are delisted, a Fund’s ability to transact in such securities will be impaired, and the liquidity and market price of the securities may decline. The Fund may also need to seek other markets in which to transact in such securities, which could increase the Fund’s costs.
●
Emerging Markets Risk: Investments in the securities of issuers based in countries with emerging-market economies are subject to greater levels of risk and uncertainty than investments in more-developed foreign markets. This is as a result of the fact that emerging-market securities may present market, credit, currency, liquidity, legal, political, and other risks greater than, or in addition to, the risks of investing in developed foreign countries. These risks include: (i) high currency exchange-rate fluctuations; (ii) increased risk of default (including both government and private issuers); (iii) greater social, economic, and political uncertainty and instability (including the risk of war); (iv) more substantial governmental involvement in the economy; (v) less governmental supervision and regulation of the securities markets and participants in those markets; (vi) controls on foreign investment and limitations on repatriation of invested capital and on a fund’s ability to exchange local currencies for U.S. dollars; (vii) unavailability of currency hedging techniques in certain emerging-market countries; (viii) the fact that companies in emerging-market countries may be newly organized, smaller, and less seasoned; (ix) the difference in, or lack of, auditing and financial reporting requirements or standards, which may result in the unavailability of material information about issuers; (x) different clearance and settlement procedures, which may be unable to keep pace with the volume of securities transactions or otherwise make it difficult to engage in such transactions; (xi) difficulties in obtaining and/or enforcing legal judgments against non-U.S. companies and non-U.S. persons, including company directors and officers, in foreign jurisdictions; and (xii) significantly smaller market capitalizations of emerging-market issuers. In addition, shareholders of emerging market issuers, such as the Fund, often have limited rights and few practical remedies in emerging markets. Finally, the risks associated with investments in emerging markets often are significant, and vary from jurisdiction to jurisdiction and company to company.
●
Sovereign Debt Risk: The actions of foreign governments concerning their respective economies could have an important effect on their ability or willingness to service their sovereign debt. Such actions could have significant effects on market conditions and on the prices of securities and instruments held by a Fund, including the securities and instruments of foreign private issuers. Factors which may influence the ability or willingness of foreign sovereigns to service debt include, but are not limited to: the availability of sufficient foreign exchange on the date payment is due; the relative size of its debt service burden to the economy as a whole; its balance of payments (including export performance) and cash flow situation; its access to international credits and investments; fluctuations in interest and currency rates and reserves; and its government’s policies towards the International Monetary Fund, the World Bank, and other international agencies. If a foreign sovereign defaults on all or a portion of its foreign debt, a Fund may have limited legal recourse against the issuer and/or guarantor. In some cases, remedies must be pursued in the courts of the defaulting party itself, and the ability of the holder of foreign sovereign debt securities to obtain recourse may be subject to the political climate in the prevailing country, which could substantially delay or defeat any recovery.
Management Risk: In managing a Fund’s portfolio, the Adviser may engage one or more sub-advisers to make investment decisions on a portion of or the entire portfolio. There is a risk that the Adviser may be unable to identify and retain sub-advisers who achieve superior investment returns relative to other similar sub-advisers. The value of your investment may decrease if the Sub-Adviser incorrectly judges the attractiveness, value, or market trends affecting a particular security, issuer, industry, or sector.
34
Mortgage Dollar Roll Risk: Mortgage “dollar rolls” are transactions in which mortgage-backed securities are sold for delivery in the current month and the seller simultaneously contracts to repurchase substantially similar securities on a specified future date. The difference between the sale price and the purchase price (plus any interest earned on the cash proceeds of the sale) is netted against the interest income foregone on the securities sold to arrive at an implied borrowing rate. Alternatively, the sale and purchase transactions can be executed at the same price, with the Fund being paid a fee as consideration for entering into the commitment to purchase. If the broker-dealer to whom the Fund sells the security becomes insolvent, the Fund’s right to repurchase the security may be restricted. Other risks involved in entering into mortgage dollar rolls include the risk that the value of the security may change adversely over the term of the mortgage dollar roll and that the security the Fund is required to repurchase may be worth less than the security that the Fund originally held.
Non-Diversification Risk: A non-diversified Fund may invest a significant percentage of its assets in the securities of a limited number of issuers, subject to federal income tax restrictions relating to the Fund’s qualification as a regulated investment company. Because a higher percentage of a non-diversified Fund’s holdings may be invested in the securities of a limited number of issuers, the Fund may be more susceptible to risks associated with a single economic, business, political or regulatory event than a diversified fund.
Portfolio Turnover Risk: Each Fund may sell its portfolio securities, regardless of the length of time that they have been held, if the sub-adviser determines that it would be in the Fund’s best interest to do so. It may be appropriate to buy or sell portfolio securities due to economic, market, or other factors that are not within the sub-adviser’s control. These transactions will increase a Fund’s “portfolio turnover.” A 100% portfolio turnover rate would occur if all of the securities in the Fund were replaced during a given period. Frequent and active trading may result in greater expenses to a Fund, which may lower the Fund’s performance and may result in the realization of substantial capital gains, including net short-term capital gainsalthough owners of variable annuity contracts or variable life policies are not expected to be subject to federal income tax on distributions of capital gains by the Fund.. As a result, high portfolio turnover may reduce the Fund’s returns.
Reverse Repurchase Agreement Risk: A reverse repurchase agreement involves the sale of a portfolio security by a Fund, coupled with its agreement to repurchase the instrument at a specified time and price. Reverse repurchase agreements involve the risk that the value of securities that a Fund is obligated to repurchase under the agreement may decline below the repurchase price. When a Fund enters into a reverse repurchase agreement, it is subject to the risk that the buyer (counterparty) may default on its obligations to the Fund, potentially resulting in delays, costs, and losses to the Fund. Reverse repurchase agreements involve leverage risk; a Fund may lose money as a result of declines in the values both of the security subject to the reverse repurchase agreement and the instruments in which the Fund invested the proceeds of the reverse repurchase agreement. Use of reverse repurchase agreements by a Fund will increase the volatility and potential losses of the Fund.
Sector and Industry Focus Risk: Each Fund may invest a high percentage of its assets in specific sectors and/or industries of the market in order to achieve a potentially greater investment return. As a result, the Fund may be more susceptible to economic, political, and regulatory developments in a particular sector or industry of the market, positive or negative, and may experience increased volatility of the Fund’s net asset value with a magnified effect on the total return.
Where Can I Find Information About the Funds’ Portfolio Holdings Disclosure Policies?
A description of the Funds' policies and procedures for disclosing portfolio securities to any person is available in the SAI and can also be found on the Funds’ website at TouchstoneInvestments.com.
35
THE FUNDS’ MANAGEMENT
Investment Adviser
Touchstone Advisors, Inc. (“Touchstone Advisors” or the “Adviser”)
303 Broadway, Suite 1100, Cincinnati, Ohio 45202
303 Broadway, Suite 1100, Cincinnati, Ohio 45202
Touchstone Advisors has been a registered investment adviser since 1994. As of March 31, 2026, Touchstone Advisors had approximately $29.6 billion in assets under management. As the Funds’ investment adviser, Touchstone Advisors reviews, supervises, and administers the Funds’ investment programs and also ensures compliance with the Funds’ investment policies and guidelines.
Touchstone Advisors is responsible for selecting each Fund’s sub-adviser(s), subject to approval by the Board. Touchstone Advisors selects a sub-adviser that has shown good investment performance in its areas of expertise. Touchstone Advisors considers various factors in evaluating a sub-adviser, including:
●
Level of knowledge and skill;
●
Performance as compared to its peers or benchmark;
●
Consistency of performance over 5 years or more;
●
Level of compliance with investment rules and strategies;
●
Employees, facilities and financial strength; and
●
Quality of service.
Touchstone Advisors will also continually monitor each sub-adviser’s performance through various analyses and through in-person, telephone, and written consultations with a sub-adviser. Touchstone Advisors discusses its expectations for performance with each sub-adviser and provides evaluations and recommendations to the Board of Trustees, including whether or not a sub-adviser’s contract should be renewed, modified, or terminated.
The SEC has granted an exemptive order that permits Touchstone Variable Series Trust (the “Trust”) or Touchstone Advisors, under certain conditions, to select or change sub-advisers, enter into new sub-advisory agreements, or amend existing sub-advisory agreements, regardless of whether the sub-adviser is affiliated or unaffiliated, without first obtaining shareholder approval. Shareholders of a Fund will be notified of any changes to its sub-adviser.
Two or more sub-advisers may manage a Fund, from time to time, with each managing a portion of the Fund’s assets. If a Fund has more than one sub-adviser, Touchstone Advisors allocates how much of a Fund’s assets are managed by each sub-adviser. Touchstone Advisors may change these allocations from time to time, often based upon the results of its evaluations of the sub-advisers.
Touchstone Advisors is also responsible for running all of the operations of the Funds, except those that are subcontracted to a sub-adviser, custodian, transfer agent, sub-administrative agent or other parties. For its services, Touchstone Advisors is entitled to receive an investment advisory fee from each Fund at an annualized rate, based on the average daily net assets of the Fund. The Annual Fee Rate below is the fee paid to Touchstone Advisors by each Fund, net of any advisory fee waivers and/or expense reimbursements, for the fiscal year ended December 31, 2025. Touchstone Advisors pays sub-advisory fees to each sub-adviser from its advisory fee.
| Fund |
Net Annual Fee Rate as a % of average daily net assets(1) |
| Balanced Fund |
0.26 %(2) |
| Bond Fund |
0.21 %(2) |
| Common Stock Fund |
0.48 %(2) |
| Small Company Fund |
0.43 % |
(1)
The Net Annual Fee Rate is the fee paid to Touchstone Advisors by each Fund, net of any advisory fee waivers and/or expense reimbursements, for the fiscal year ended December 31, 2025. These advisory fee waivers and/or expense reimbursements are described in the “Annual Fund Operating Expenses” table and the related footnotes in each Fund’s summary above.
(2)
Touchstone Advisors pays Integrity Life Insurance Company, and National Integrity Life Insurance Company (the “Integrity Companies”), Columbus Life Insurance Company, and certain other affiliates a shareholder servicing fee of up to 0.15% annually on Class SC shares of each Fund. In exchange for the shareholder servicing fee, these entities provide services including (but not limited to) prospectus, financial report, and statement delivery; telephone and Internet services for contract owners; and recordkeeping and similar administrative services. Touchstone Advisors, at its expense, may also provide additional compensation to certain unaffiliated dealers, financial intermediaries, or service providers for administrative and/or shareholder servicing activities.
36
Additional Information
The Trustees of the Trust oversee generally the operations of each Fund and the Trust. The Trust enters into contractual arrangements with various parties, including, among others, the Funds’ investment adviser, custodian, transfer agent, accountants and distributor, who provide services to each Fund. Shareholders and insurance company separate account investors are not parties to, or intended (or “third-party”) beneficiaries of, any of those contractual arrangements, and those contractual arrangements are not intended to create in any such individual shareholder or group of shareholders or investors any right to enforce the terms of the contractual arrangements against the service providers or to seek any remedy under the contractual arrangements against the service providers, either directly or on behalf of the Trust.
This prospectus provides information concerning the Trust and the Funds that you should consider in determining whether to purchase shares of a Fund. The Funds may make changes to this information from time to time. Neither this prospectus, the SAI or any document filed as an exhibit to the Trust’s registration statement, is intended to, nor does it, give rise to an agreement or contract between the Trust or a Fund and its shareholders or investors, or give rise to any contract or other rights in any such individual shareholder, group of shareholders or investors or other person other than any rights conferred explicitly by federal or state securities laws that may not be waived.
Advisory and Sub-Advisory Agreement Approval. A discussion of the basis for the Board’s approval of the Funds’ advisory and sub-advisory agreements can be found in the Trust’s December 31, 2025 annual financial statements.
Fort Washington is an affiliate of Touchstone Advisors and serves as sub-adviser to the Funds. Therefore, Touchstone Advisors may have a conflict of interest when making decisions to keep Fort Washington as the sub-adviser to the Funds. The Board of Trustees reviews Touchstone Advisors’ decisions, with respect to the retention of Fort Washington, to reduce the possibility of a conflict of interest.
Sub-Advisers and Portfolio Managers
Listed below are the sub-advisers and their respective portfolio managers that have responsibility for the day-to-day management of each Fund. A brief biographical description of each portfolio manager is also provided. The SAI provides additional information about the portfolio managers’ investments in the Fund or Funds that they manage, a description of their compensation structure, and information regarding other accounts that they manage.
Fort Washington Investment Advisors, Inc. (“Fort Washington”), located at 303 Broadway, Suite 1200, Cincinnati, Ohio 45202, has been an SEC–registered investment adviser since 1990 and serves as the sub-adviser to the Funds. As the sub-adviser, Fort Washington makes investment decisions for each Fund and also ensures compliance with the Funds’ investment policies and guidelines. As of December 31, 2025, Fort Washington had approximately $95.0 billion in assets under management (includes assets under management by Fort Washington of $89.4 billion and $5.5 billion in commitments managed by Fort Washington Capital Partners Group, a division of Fort Washington). Each Fort Washington portfolio manager listed below is primarily or jointly and primarily responsible for the management of the applicable Fund.
Balanced Fund
Daniel J. Carter, CFA, Managing Director and Senior Portfolio Manager, joined Fort Washington in 2000. Mr. Carter has co-managed the Fund since its inception in October 2017.
James E. Wilhelm, Jr., Managing Director and Senior Portfolio Manager, joined Fort Washington in 2002. Mr. Wilhelm has investment experience dating back to 1993. He has co-managed the Fund since its inception in October 2017.
Austin R. Kummer, CFA, Managing Director and Senior Portfolio Manager. Mr. Kummer has worked at Fort Washington since 2013, and has co-managed the Fund since its inception in October 2017.
Bond Fund
Daniel J. Carter, CFA, Managing Director and Senior Portfolio Manager, joined Fort Washington in 2000. Mr. Carter has managed the Fund since its inception in October 2017.
Austin R. Kummer, CFA, Managing Director and Senior Portfolio Manager. Mr. Kummer has worked at Fort Washington since 2013. Mr. Kummer has managed the Fund since its inception in October 2017.
Common Stock Fund
James E. Wilhelm, Jr., Managing Director and Senior Portfolio Manager, joined Fort Washington in 2002. He has investment experience dating back to 1993. He has managed the Fund since its inception in October 2017.
37
Sunit Gogia, Vice President, Portfolio Manager and Director of Equity Research joined Fort Washington in 2012. He has investment experience dating back to 2003. He began as a Senior Equity Analyst with Fort Washington in 2012 covering the technology and telecom sectors. He was named Associate Portfolio Manager and Director of Equity Research in 2017. Prior to joining Fort Washington, Sunit was a Senior Equity Analyst with Morningstar, Inc. following the enterprise software industry. Prior to that he was a Software Developer and Program Manager at Microsoft.
Small Company Fund
Jason Ronovech, CFA, Vice President and Senior Portfolio Manager is lead portfolio manager of the Small Company Fund and joined Fort Washington in 2017. Mr. Ronovech served as the portfolio manager of the Predecessor Fund to the Small Company Fund, which was managed by Sentinel Asset Management, Inc. (“Sentinel”), from 2013 to 2017. Prior to joining Sentinel, Mr. Ronovech was a portfolio manager with Paradigm Capital Management, where he co-managed the firm’s flagship Small Cap and Mid Cap portfolios.
38
SHAREHOLDER SERVICING ARRANGEMENTS
Shareholder Servicing Plan - Class SC shares only. The Trust has adopted a shareholder services plan (the “Plan”) with respect to Class SC shares of the Balanced Fund, Bond Fund and Common Stock Fund, providing that the Trust may obtain the services of Touchstone Advisors and other qualified financial intermediaries to act as shareholder servicing agents for their customers. Under the Plan, the Trust (or the Trust’s agents) may enter into agreements pursuant to which the shareholder servicing agent performs certain shareholder services not otherwise provided by the transfer agent. For these services, the Trust pays the shareholder servicing agent a fee of up to 0.25% of the average daily net assets attributable to the Class SC shares owned by investors for which the shareholder servicing agent maintains a servicing relationship.
The Trust may use payments under this aspect of the Plan to provide or enter into agreements with organizations (“Service Providers”) who will provide one or more of the following shareholder services to a Fund’s Class SC shareholders: (i) establishing and maintaining customer accounts and records; (ii) aggregating and processing purchase and redemption requests from customers and placing net purchase and redemptions with Touchstone Securities, LLC, the Trust's distributor; (iii) automatically investing customer account cash balances; (iv) providing periodic statements to their customers; (v) arranging for bank wires; (vi) answering routine customer inquiries concerning the investments in the shares offered in connection with this Plan and related distribution agreement; (vii) assisting customers in changing dividend options, account designations and addresses; (viii) performing sub-accounting functions; (ix) processing dividend payments from the Fund on behalf of customers; (x) forwarding certain shareholder communications from the Fund (such as proxies, shareholder reports and dividend, distribution and tax notices) to customers; and (xi) providing such other similar services as may be reasonably requested to the extent they are permitted to do so under applicable statutes, rules and regulations. Because these fees are paid out of the Fund’s Class SC share assets on an on-going basis, over time these fees will increase the cost of your investment.
39
INVESTING WITH TOUCHSTONE
Choosing the Appropriate Investments to Match Your Goals. Investing well requires a plan. We recommend that you meet with your financial adviser to plan a strategy that will best meet your financial goals.
Purchasing Shares
You cannot buy shares of the Funds directly. You can invest indirectly in the Funds through your purchase of a variable annuity contract or variable life policy. You should read this prospectus and the prospectus of the variable annuity contract or variable life policy carefully before you choose your investment options.
Selling Shares
To meet various obligations under the variable annuity contracts or variable life policies through which Fund shares are purchased, the insurance company separate accounts which directly hold the Funds’ shares may sell Fund shares to generate cash. For example, a separate account may sell Fund shares and use the proceeds to pay a contract owner who requested a partial withdrawal or who canceled a contract. Proceeds from the sale are usually sent to the separate account on the next business day.
The Funds may suspend sales of shares or postpone payment dates when the New York Stock Exchange (“NYSE”) is closed (other than weekends or holidays), when trading on the NYSE is restricted, or as otherwise permitted by the SEC. Under normal conditions, each Fund typically expects to meet redemption requests through the use of the Fund’s holdings of cash or cash equivalents, lines of credit, an interfund loan (as discussed in the SAI) or by selling other Fund assets. A redemption-in-kind may be used under unusual circumstances.
Redemption in-Kind. Under certain circumstances (such as a market emergency), when the Board of Trustees deems it appropriate, a Fund may make payment for shares redeemed in portfolio securities of the Fund taken at current value in order to meet redemption requests. Shareholders may incur transaction and brokerage costs when they sell these portfolio securities. Until such time as the shareholder sells the securities they receive in-kind, the securities are subject to market risk. Redemptions in- kind are taxable for federal income tax purposes in the same manner as redemptions for cash.
Market Timing Policy
Shares of the Funds are held by insurance companies who make the Funds available to investors through separate accounts. These separate accounts are available to investors through a variable annuity contract or variable life policy sold by the insurance company. As a result, market timing or excessive trading in accounts that an investor owns or controls may disrupt portfolio investment strategies, may increase brokerage and administrative costs, and may negatively impact investment returns for all investors, including long-term investors who do not generate these costs. The Funds will take reasonable steps to discourage excessive short-term trading and will not knowingly accommodate frequent purchases and redemptions of Fund shares by investors. The Board has adopted the following policies and procedures with respect to market timing of the Funds by investors. The Funds will monitor selected trades on a daily basis in an effort to deter excessive short-term trading. If a Fund has reason to believe that an investor has engaged in excessive short-term trading, the Funds may ask the insurance companies to stop such activities or restrict or refuse to process purchases or exchanges in the investor's accounts. While the Funds cannot assure the prevention of all excessive trading and market timing, by making these judgments the Fund believes it is acting in a manner that is in the best interests of its investors. However, because the Funds cannot prevent all market timing, investors may be subject to the risks described above.
The Trust expects the insurance company separate accounts that invest in the Funds to have in place policies and procedures reasonably designed to deter market timing in the separate accounts by contract or policy holders. Separate accounts often establish omnibus accounts in the Funds for their contract or policy holders through which transactions are placed. In accordance with Rule 22c-2 under the 1940 Act, the Funds have entered into information sharing agreements with the insurance companies that use the Funds as underlying investment vehicles for their separate accounts. Under these agreements, an insurance company is obligated to: (1) adopt and enforce during the term of the agreement, a market-timing policy, the terms of which are acceptable to the Funds; (2) furnish the Funds, upon their request, with information regarding contract or policy holder trading activities in shares of the Funds; and (3) enforce its market-timing policy with respect to contract or policy holders identified by the Funds as having engaged in market timing. When information regarding transactions in the Funds' shares is requested by a Fund and such information is in the possession of a person that is itself a financial intermediary to an insurance company (an “indirect intermediary”), any insurance company with whom the Funds have an information sharing agreement is obligated to obtain transaction information from the indirect intermediary or, if directed by the Funds, to restrict or prohibit the indirect intermediary from purchasing shares of the Funds on behalf of contract or policy holders or any other persons.
Investors in the Funds should be aware that the right of an owner of a variable insurance product to transfer among sub-accounts is governed by a contract between the insurance company and the owner. Many of these contracts do not limit the number of transfers that a contract owner may make among the underlying funds. The terms of these contracts, the presence of financial intermediaries (including
40
the insurance companies) between the Funds and the contract and policy holders and other factors such as state insurance laws may limit a Fund's ability to deter market timing. Multiple tiers of such financial intermediaries may further compound the Funds' difficulty in deterring such market timing activities.
The Funds apply these policies and procedures uniformly to all investors believed to be engaged in market timing or excessive trading. The Funds have no arrangements to permit any investor to trade frequently in shares of the Funds, nor will they enter into any such arrangements in the future.
Pricing of Fund Shares
Each Fund’s share price (also called “NAV”) and public offering price (NAV plus a sales charge, if applicable) is determined as of the close of regular trading (typically 4:00 p.m., Eastern time or at such other time that the NYSE establishes official closing prices) every day the NYSE is open. Each Fund calculates its NAV per share, for each class, generally using market prices, by dividing the total value of its net assets attributable to that class by the number of shares outstanding attributable to that class. Shares are purchased or sold at the NAV determined after a purchase or sale order is received in proper form by Touchstone Securities, LLC or its authorized agent.
The Funds’ equity investments are valued based on market value or, if no market value is available, based on fair value as determined by the Adviser, which has been designated by the Board as the valuation designee for the Funds pursuant to Rule 2a-5 under the 1940 Act. The Adviser as the valuation designee may use pricing services to determine market value for investments. Some specific pricing strategies follow:
●
All short-term dollar-denominated investments that mature in 60 days or less may be valued on the basis of amortized cost which the Adviser as the valuation designee has determined as fair value.
●
Securities mainly traded on a U.S. exchange are valued at the last sale price on that exchange or, if no sales occurred during the day, at the last quoted bid price.
Any foreign securities held by a Fund will be priced as follows:
●
All assets and liabilities initially expressed in foreign currency values will be converted into U.S. dollar values.
●
Securities mainly traded on a non-U.S. exchange are generally valued according to the preceding closing values on that exchange. However, if an event that may change the value of a security occurs after the time that the closing value on the non-U.S. exchange was determined, but before the close of regular trading on the NYSE, the security may be priced based on fair value. This may cause the value of the security on the books of the Fund to be significantly different from the closing value on the non-U.S. exchange and may affect the calculation of the NAV.
●
Because portfolio securities that are primarily listed on a non-U.S. exchange may trade on weekends or other days when a Fund does not price its shares, a Fund’s NAV may change on days when shareholders will not be able to buy or sell shares.
●
Securities held by a Fund that do not have readily available market quotations are priced at their fair value using procedures established by the Adviser and adopted by the Board. Any debt securities held by a Fund for which market quotations are not readily available are generally priced at their most recent bid prices as obtained from one or more of the major market makers for such securities. The Funds may use fair value pricing under the following circumstances, among others:
●
If the validity of market quotations is deemed to be not reliable.
●
If the value of a security has been materially affected by events occurring before the Fund’s pricing time but after the close of the primary markets on which the security is traded.
●
If a security is so thinly traded that reliable market quotations are unavailable due to infrequent trading.
●
If the exchange on which a portfolio security is principally traded closes early or if trading in a particular portfolio security was halted during the day and did not resume prior to the Fund’s NAV calculation.
The use of fair value pricing has the effect of valuing a security based upon the price a Fund might reasonably expect to receive if it sold that security but does not guarantee that the security can be sold at the fair value price. The Funds have established fair value policies and procedures that delegate fair value responsibilities to the Adviser, as the Fund’s valuation designee. These policies and procedures outline the fair value method for the Adviser. The Adviser’s determination of a security’s fair value price often involves the consideration of a number of subjective factors and is therefore subject to the unavoidable risk that the value that is assigned to a security may be higher or lower than the security’s value would be if a reliable market quotation for the security was readily available. With respect to any portion of a Fund’s assets that is invested in other mutual funds, that portion of the Fund’s NAV is calculated based on the NAV of that mutual fund. The prospectus for the other mutual fund explains the circumstances and effects of fair value pricing for that mutual fund.
41
DISTRIBUTIONS AND TAXES
Each Fund intends to distribute to its shareholders substantially all of its net investment income and capital gains. The table below outlines when net investment income dividends are declared and paid by each Fund. Each Fund makes distributions of capital gains, if any, at least annually.
| Fund |
Dividends Declared |
Dividends Paid |
| Touchstone Balanced Fund |
Annually |
Annually |
| Touchstone Bond Fund |
Annually |
Annually |
| Touchstone Common Stock Fund |
Annually |
Annually |
| Touchstone Small Company Fund |
Annually |
Annually |
For more information about dividends and other Fund distributions in connection with any investment in a variable annuity contract or variable life policy, see the prospectus for your variable annuity contract or variable life policy.
Federal Income Tax Information
Shares of the Funds must be purchased through separate accounts used to fund variable insurance contracts. As a result, it is anticipated that any income dividends or capital gains distributed by the Funds will be exempt from current taxation by contract holders if left to accumulate within a separate account. Withdrawals from such contracts may be subject to ordinary income tax plus, if the withdrawal is made before the contract holder reaches age 59 1/2, a 10% penalty tax. Investors are advised to consult their own tax advisers for more information on their tax situation, including possible state or local taxes.
For more information about the tax consequences of an investment in a variable annuity contract or variable life policy, see the prospectus for your variable annuity contract or variable life policy.
This section is only a summary of some important federal income tax considerations that may affect your investment in a Fund. More information regarding these considerations is included in the Funds’ SAI. You are advised to consult your own tax adviser regarding the effects of an investment in a variable insurance contract that invests in a Fund on your tax situation.
42
FINANCIAL HIGHLIGHTS
The financial highlights tables are intended to help you understand each Fund’s financial performance for the past five years, or if shorter, the period of each Fund’s operations. Certain information reflects financial results for a single Fund share. The total returns in the tables represent the rate an investor would have earned (or lost) on an investment in a Fund, assuming reinvestment of all dividends and distributions. The total returns do not reflect fees that are paid by the separate accounts through which shares of the Funds are sold. Inclusion of these fees would reduce the total return figures for all periods. The financial highlights for each Fund were audited by Ernst & Young LLP, an independent registered public accounting firm, whose report, along with each Fund’s financial statements and related notes, are included in the Funds' December 31, 2025 Form N-CSR.
You can obtain a Fund's most recent annual report, semi-annual report or Form N-CSR at no charge by calling 1.800.543.0407 or by downloading a copy from the Touchstone Investments website at: TouchstoneInvestments.com/Resources. The Form N-CSR has been incorporated by reference into the SAI.
43
| Touchstone Balanced Fund | ||||||||||||||
| Period ended |
Net asset value at beginning of period |
Net investment income(1) |
Net realized and unrealized gains (losses) on investments |
Total from investment operations |
Distributions from net investment income |
Distributions from realized capital gains |
Total distributions |
Net asset value at end of period |
Total return(2) |
Net assets at end of period (000's) |
Ratio of net expenses to average net assets |
Ratio of gross expenses to average net assets |
Ratio of net investment income (loss) to average net assets |
Portfolio turnover rate |
| Class SC | ||||||||||||||
| 12/31/21(3) |
$14.67 (4) |
$0.05 |
$1.18 |
$1.23 |
$(0.03 ) |
$ (0.17 ) |
$(0.20 ) |
$15.70 |
8.45 % (5) |
$52,471 |
0.79 % (6) |
1.13 % (6) |
0.46 %(6) |
132 % (7) |
| 12/31/22 |
15.70 |
0.14 |
(2.60 ) |
(2.46 ) |
(0.05 ) |
(3.25 ) |
(3.30 ) |
9.94 |
(15.95 ) |
39,940 |
0.79 |
1.23 |
1.03 |
61 |
| 12/31/23 |
9.94 |
0.18 |
1.67 |
1.85 |
(0.15 ) |
— |
(0.15 ) |
11.64 |
18.57 |
34,400 |
0.79 |
1.24 |
1.66 |
49 |
| 12/31/24 |
11.64 |
0.20 |
1.39 |
1.59 |
(0.24 ) |
— |
(0.24 ) |
12.99 |
13.62 |
33,149 |
0.79 |
1.25 |
1.62 |
81 |
| 12/31/25 |
12.99 |
0.22 |
1.62 |
1.84 |
(0.27 ) |
(0.38 ) |
(0.65 ) |
14.18 |
14.18 |
30,645 |
0.79 |
1.29 |
1.64 |
77 |
| Class I | ||||||||||||||
| 12/31/21 |
$13.59 |
$0.07 |
$2.24 |
$2.31 |
$(0.03 ) |
$ (0.17 ) |
$(0.20 ) |
$15.70 |
17.07 % |
$19,771 |
0.81 % |
1.05 % |
0.48 % |
132 % (7) |
| 12/31/22 |
15.70 |
0.14 |
(2.60 ) |
(2.46 ) |
(0.05 ) |
(3.25 ) |
(3.30 ) |
9.94 |
(15.97 ) |
15,050 |
0.79 |
0.96 |
1.03 |
61 |
| 12/31/23 |
9.94 |
0.18 |
1.67 |
1.85 |
(0.15 ) |
— |
(0.15 ) |
11.64 |
18.61 |
16,454 |
0.79 |
0.99 |
1.66 |
49 |
| 12/31/24 |
11.64 |
0.20 |
1.38 |
1.58 |
(0.23 ) |
— |
(0.23 ) |
12.99 |
13.59 |
16,215 |
0.79 |
1.06 |
1.62 |
81 |
| 12/31/25 |
12.99 |
0.22 |
1.62 |
1.84 |
(0.27 ) |
(0.38 ) |
(0.65 ) |
14.18 |
14.16 |
16,691 |
0.79 |
1.07 |
1.64 |
77 |
| |
|
|
|
|
|
|
|
|
|
|
|
|
|
|
| | |
| (1) |
The net investment income (loss) per share was based on average shares outstanding for the period. |
| (2) |
Total returns do not include any insurance, sales or administrative charges of variable annuity or life insurance contracts. If these charges were included, the returns would be lower. |
| (3) |
Represents the period from commencement of operations (April 13, 2021) through December 31, 2021. |
| (4) |
Net asset value at the beginning of period is based on the net asset value of Class I shares on April 13, 2021. |
| (5) |
Not annualized. |
| (6) |
Annualized. |
| (7) |
Portfolio turnover excludes the purchases and sales of securities of the Aggressive ETF Fund, the Conservative ETF Fund and the Moderate ETF Fund acquired on April 16, 2021. If these transactions were included, portfolio turnover would have been higher. |
44
| Touchstone Bond Fund | ||||||||||||||
| Period ended |
Net asset value at beginning of period |
Net investment income |
Net realized and unrealized gains (losses) on investments |
Total from investment operations |
Distributions from net investment income |
Distributions from realized capital gains |
Total distributions |
Net asset value at end of period |
Total return(1) |
Net assets at end of period (000's) |
Ratio of net expenses to average net assets |
Ratio of gross expenses to average net assets |
Ratio of net investment income (loss) to average net assets |
Portfolio turnover rate |
| Class SC | ||||||||||||||
| 12/31/21 |
$10.79 |
$0.16 |
$(0.30 ) |
$(0.14 ) |
$(0.25 ) |
$ (0.06 ) |
$(0.31 ) |
$10.34 |
(1.30 )% |
$65,530 |
0.79 % |
0.79 % |
1.47 % |
142 % |
| 12/31/22 |
10.34 |
0.23 |
(1.67 ) |
(1.44 ) |
(0.17 ) |
(0.07 ) |
(0.24 ) |
8.66 |
(13.90 ) |
54,930 |
0.78 |
0.78 |
2.49 |
163 |
| 12/31/23 |
8.66 |
0.31 (2) |
0.19 |
0.50 |
(0.44 ) |
— |
(0.44 ) |
8.72 |
5.77 |
20,072 |
0.81 |
0.81 |
3.51 |
138 |
| 12/31/24 |
8.72 |
0.32 (2) |
(0.16 ) |
0.16 |
(0.45 ) |
— |
(0.45 ) |
8.43 |
1.96 |
18,476 |
0.91 |
0.95 |
3.66 |
181 |
| 12/31/25 |
8.43 |
0.32 (2) |
0.30 |
0.62 |
(0.34 ) |
— |
(0.34 ) |
8.71 |
7.34 |
18,683 |
0.91 |
0.96 |
3.71 |
212 |
| Class I | ||||||||||||||
| 12/31/21 |
$10.81 |
$0.12 |
$(0.25 ) |
$(0.13 ) |
$(0.26 ) |
$ (0.06 ) |
$(0.32 ) |
$10.36 |
(1.21 )% |
$41,221 |
0.67 % |
0.77 % |
1.60 % |
142 % |
| 12/31/22 |
10.36 |
0.28 |
(1.72 ) |
(1.44 ) |
(0.19 ) |
(0.07 ) |
(0.26 ) |
8.66 |
(13.85 ) |
32,670 |
0.67 |
0.76 |
2.60 |
163 |
| 12/31/23 |
8.66 |
0.33 (2) |
0.20 |
0.53 |
(0.42 ) |
— |
(0.42 ) |
8.77 |
6.07 |
32,878 |
0.61 |
0.87 |
3.72 |
138 |
| 12/31/24 |
8.77 |
0.35 (2) |
(0.16 ) |
0.19 |
(0.48 ) |
— |
(0.48 ) |
8.48 |
2.19 |
28,741 |
0.61 |
0.95 |
3.96 |
181 |
| 12/31/25 |
8.48 |
0.35 (2) |
0.30 |
0.65 |
(0.37 ) |
— |
(0.37 ) |
8.76 |
7.63 |
29,838 |
0.61 |
0.99 |
4.01 |
212 |
| |
|
|
|
|
|
|
|
|
|
|
|
|
|
|
| | |
| (1) |
Total returns do not include any insurance, sales or administrative charges of variable annuity or life insurance contracts. If these charges were included, the returns would be lower. |
| (2) |
The net investment income (loss) per share was based on average shares outstanding for the period. |
45
| Touchstone Common Stock Fund | ||||||||||||||
| Period ended |
Net asset value at beginning of period |
Net investment income |
Net realized and unrealized gains (losses) on investments |
Total from investment operations |
Distributions from net investment income |
Distributions from realized capital gains |
Total distributions |
Net asset value at end of period |
Total return(1) |
Net assets at end of period (000's) |
Ratio of net expenses to average net assets |
Ratio of gross expenses to average net assets |
Ratio of net investment income (loss) to average net assets |
Portfolio turnover rate |
| Class SC | ||||||||||||||
| 12/31/21 |
$10.98 |
$0.01 |
$3.01 |
$3.02 |
$(0.05 ) |
$ (0.44 ) |
$(0.49 ) |
$13.51 |
27.57 % |
$93,121 |
0.91 % |
0.91 % |
0.16 % |
6 % |
| 12/31/22 |
13.51 |
0.04 |
(2.42 ) |
(2.38 ) |
(0.02 ) |
(1.60 ) |
(1.62 ) |
9.51 |
(17.79 ) |
68,199 |
0.91 |
0.91 |
0.35 |
7 |
| 12/31/23 |
9.51 |
0.04 |
2.46 |
2.50 |
(0.07 ) |
(0.73 ) |
(0.80 ) |
11.21 |
26.35 |
74,476 |
0.95 |
0.95 |
0.42 |
4 |
| 12/31/24 |
11.21 |
0.04 (2) |
2.37 |
2.41 |
(0.05 ) |
(0.93 ) |
(0.98 ) |
12.64 |
21.26 |
77,314 |
0.92 |
0.92 |
0.31 |
9 |
| 12/31/25 |
12.64 |
0.02 (2) |
2.20 |
2.22 |
(0.04 ) |
(2.05 ) |
(2.09 ) |
12.77 |
17.65 |
77,993 |
0.92 |
0.92 |
0.19 |
5 |
| Class I | ||||||||||||||
| 12/31/21 |
$11.01 |
$0.06 |
$3.00 |
$3.06 |
$(0.07 ) |
$ (0.44 ) |
$(0.51 ) |
$13.56 |
27.85 % |
$164,195 |
0.73 % |
0.76 % |
0.34 % |
6 % |
| 12/31/22 |
13.56 |
0.05 |
(2.42 ) |
(2.37 ) |
(0.04 ) |
(1.60 ) |
(1.64 ) |
9.55 |
(17.66 ) |
120,406 |
0.73 |
0.77 |
0.53 |
7 |
| 12/31/23 |
9.55 |
0.08 |
2.46 |
2.54 |
(0.05 ) |
(0.73 ) |
(0.78 ) |
11.31 |
26.66 |
134,712 |
0.73 |
0.79 |
0.64 |
4 |
| 12/31/24 |
11.31 |
0.06 (2) |
2.40 |
2.46 |
(0.08 ) |
(0.93 ) |
(1.01 ) |
12.76 |
21.48 |
129,113 |
0.73 |
0.78 |
0.50 |
9 |
| 12/31/25 |
12.76 |
0.05 (2) |
2.22 |
2.27 |
(0.07 ) |
(2.05 ) |
(2.12 ) |
12.91 |
17.83 |
128,610 |
0.73 |
0.77 |
0.38 |
5 |
| |
|
|
|
|
|
|
|
|
|
|
|
|
|
|
| | |
| (1) |
Total returns do not include any insurance, sales or administrative charges of variable annuity or life insurance contracts. If these charges were included, the returns would be lower. |
| (2) |
The net investment income (loss) per share was based on average shares outstanding for the period. |
46
| Touchstone Small Company Fund | ||||||||||||||
| Period ended |
Net asset value at beginning of period |
Net investment income |
Net realized and unrealized gains (losses) on investments |
Total from investment operations |
Distributions from net investment income |
Distributions from realized capital gains |
Total distributions |
Net asset value at end of period |
Total return(1) |
Net assets at end of period (000's) |
Ratio of net expenses to average net assets |
Ratio of gross expenses to average net assets |
Ratio of net investment income (loss) to average net assets |
Portfolio turnover rate |
| Class I | ||||||||||||||
| 12/31/21 |
$15.71 |
$— (2)(3) |
$3.79 |
$3.79 |
$(0.01 ) |
$ (0.36 ) |
$(0.37 ) |
$19.13 |
24.18 % |
$75,241 |
0.76 % |
0.79 % |
0.01 % |
67 % |
| 12/31/22 |
19.13 |
0.03 |
(2.73 ) |
(2.70 ) |
(— )(2) |
(4.76 ) |
(4.76 ) |
11.67 |
(14.44 ) |
59,221 |
0.76 |
0.80 |
0.23 |
75 |
| 12/31/23 |
11.67 |
0.06 |
1.88 |
1.94 |
(0.03 ) |
(0.06 ) |
(0.09 ) |
13.52 |
16.60 |
63,974 |
0.76 |
0.85 |
0.43 |
65 |
| 12/31/24 |
13.52 |
0.03 (3) |
1.85 |
1.88 |
(0.06 ) |
(0.51 ) |
(0.57 ) |
14.83 |
13.70 |
63,978 |
0.76 |
0.85 |
0.19 |
59 |
| 12/31/25 |
14.83 |
0.01 (3) |
1.49 |
1.50 |
(0.03 ) |
(2.12 ) |
(2.15 ) |
14.18 |
9.72 |
60,701 |
0.76 |
0.86 |
0.07 |
49 |
| |
|
|
|
|
|
|
|
|
|
|
|
|
|
|
| | |
| (1) |
Total returns do not include any insurance, sales or administrative charges of variable annuity or life insurance contracts. If these charges were included, the returns would be lower. |
| (2) |
Less than $0.005 per share. |
| (3) |
The net investment income (loss) per share was based on average shares outstanding for the period. |
47
For investors who want more information about the Funds, the following documents are available free upon request:
Statement of Additional Information (“SAI”): The SAI provides more detailed information about the Funds and is incorporated herein by reference, which means it is legally a part of this prospectus.
Annual/Semiannual Reports and Form N-CSR (“Financial Reports”): Additional information about a Fund’s investments is available in the Fund’s Financial Reports to shareholders. In a Fund’s annual report, you will find a discussion of the market conditions and investment strategies that significantly affected the Fund’s performance during its last fiscal year. In Form N-CSR, you will find the Fund's annual and semiannual financial statements.
You can get free copies of the current SAI, Financial Reports, other information such as Fund financial statements that the Fund files on Form N-CSR, and answers to your questions about the Funds by contacting your financial adviser, or the Funds at:
Touchstone Service Center
400 Broadway
Cincinnati, Ohio 45202
800.669.2796
400 Broadway
Cincinnati, Ohio 45202
800.669.2796
The current Financial Reports, Form N-CSR, other information such as Fund financial statements that the Fund files on Form N-CSR, prospectus, or SAI and other information about the Funds are also available without charge on the Touchstone Investments website at www.TouchstoneInvestments.com/Resources.
The current Financial Reports, Form N-CSR, other information such as Fund financial statements that the Fund files on Form N-CSR, prospectus or SAI and other information about the Funds are available on the EDGAR database of the SEC’s Internet site at http://www.sec.gov. You may obtain copies of these documents and other information, after paying a duplicating fee, by sending an e-mail request to: publicinfo@sec.gov.
Investment Company Act File No. 811–08416
TSF-TVST-STATPRO-2604
48