Pay vs Performance Disclosure - USD ($)
|
12 Months Ended |
Dec. 31, 2025 |
Dec. 31, 2024 |
Dec. 31, 2023 |
Dec. 31, 2022 |
Dec. 31, 2021 |
| Pay vs Performance Disclosure |
|
|
|
|
|
| Pay vs Performance Disclosure, Table |
| | | | | | | | | | | | | | | | | | | | | | | | | | | | Year | Summary Compensation Table Total for PEO(1) | Compensation Actually Paid ("CAP") to PEO(2) | Average Summary Compensation Table Total for Non-PEO NEOs(1) | Average Compensation Actually Paid to Non-PEO NEOs(2) | Value of Initial Fixed $100 Investment Based On: | Net Income (Loss) (millions)(4) | Total Adjusted EBITDA (millions)(5) | | | | | | TSR | Peer Group TSR(3) | | | | 2025 | $8,655,929 | $21,460,615 | $2,321,421 | $4,530,276 | $205.1 | $65.8 | $34.9 | $184.9 | | 2024 | $7,981,811 | $20,436,937 | $2,140,666 | $3,899,727 | $142.1 | $74.6 | $26.1 | $138.9 | | 2023 | $8,728,635 | $9,444,922 | $2,285,243 | $2,378,593 | $83.4 | $71.0 | $25.3 | $144.0 | | 2022 | $8,038,004 | $5,845,194 | $2,065,369 | $1,578,025 | $81.4 | $108.1 | $(22.8) | $95.7 | | 2021 | $9,081,442 | $9,581,484 | $2,623,371 | $1,838,719 | $99.0 | $131.5 | $(22.3) | $88.7 |
|
|
|
|
|
| Company Selected Measure Name |
Adjusted EBITDA
|
|
|
|
|
| Named Executive Officers, Footnote |
The PEO for the covered years is Richard L. Gelfond. Our non-PEO NEOs for the covered years are as follows: | | | | | | | | | | | | | | | | 2021 | 2022 | 2023 | 2024 | 2025 | | Patrick McClymont | Natasha Fernandes | Natasha Fernandes | Natasha Fernandes | Natasha Fernandes | | Joseph Sparacio | Joseph Sparacio | Daniel Manwaring | Anne Globe | Anne Globe | | Megan Colligan | Megan Colligan | Robert D. Lister | Robert D. Lister | Robert D. Lister | | Robert D. Lister | Robert D. Lister | Mark Welton | Mark Welton | Mark Welton | | Mark Welton | | | |
|
|
|
|
|
| Peer Group Issuers, Footnote |
Represents the total cumulative shareholder return for $100 invested on December 31, 2020 (assuming that all dividends were reinvested) in common shares of the Company against the cumulative total return of the IMAX Peer Group to the end of the most recently completed fiscal year. The 2025 IMAX Peer Group consists of Ambarella, Inc., Cinemark Holdings, Inc., Cineplex Inc., Corsair Gaming, Inc., Dolby Laboratories, Inc., fuboTV Inc., Harmonic Inc., Knowles Corporation, The Marcus Corporation, WildBrain Ltd., and Xperi Inc. (the “2025 Peer Group”). IMAX’s 2024 peer group consists of Ambarella, Inc., Cinemark Holdings, Inc., Cineplex Inc., Corsair Gaming Inc., Dolby Laboratories, Inc., fuboTV Inc, Harmonic Inc., Knowles Corporation, Lions Gate Entertainment Corp., The Marcus Corporation, WildBrain Ltd., and Xperi Holding Corporation (the “2024 Peer Group”), which is consistent from the peer group used in 2023. IMAX’s 2022 peer group consisted of Ambarella, Inc., Avid Technologies, Inc., Cinemark Holdings, Inc., Cineplex Inc., Dolby Laboratories, Inc., Harmonic Inc., Lions Gate Entertainment Corp., The Marcus Corporation, and World Wrestling Entertainment, Inc. (the “2022 Peer Group”). IMAX’s 2021 peer group consisted of the 2022 Peer Group and Zynga Inc. Avid Technologies, Inc. and World Wrestling Entertainment, Inc. were excluded starting 2023 due to their acquisitions.
|
|
|
|
|
| PEO Total Compensation Amount |
$ 8,655,929
|
$ 7,981,811
|
$ 8,728,635
|
$ 8,038,004
|
$ 9,081,442
|
| PEO Actually Paid Compensation Amount |
$ 21,460,615
|
20,436,937
|
9,444,922
|
5,845,194
|
9,581,484
|
| Adjustment To PEO Compensation, Footnote |
The following adjustments relating to equity awards were made to total compensation for each year to determine CAP: | | | | | | | | | | | | | | | | | | | | | | Year | Value of Equity Awards Disclosed in the Summary Compensation Table | Year End Value of Equity Awards Granted During the Covered Year | Change in Fair Value of Outstanding and Unvested Equity Awards | Change in Fair Value of Awards Granted in Prior Years Vesting During the Covered Year | Value of Awards Granted in Prior Years that Fail to Meet Applicable Vesting Conditions During the Covered Year | Total Equity Award Adjustments | | 2025 | | | | | | | | PEO | $(5,499,951) | $10,273,849 | $8,227,636 | $(196,848) | $0 | $12,804,686 | Average non-PEO NEO | $(1,143,743) | $2,127,170 | $1,244,870 | $(19,442) | $0 | $2,208,855 | | | | | | | | | | | | | | | | | | | | | | | | | | | | | | | | | | | | | | | | | | | | | | | | | | | | | | | | | | | | | | | | | | | | | | | | | | | | | | | | | | | | |
Fair values of equity awards set forth in the table above are computed in accordance with FASB ASC Topic 718 as of the end of the respective fiscal year, other than fair values of equity awards that vest in the covered year, which are valued as of the applicable vesting date. The amounts in the “Year End Value of Equity Awards Granted During the Covered Year” and “Change in Fair Value of Outstanding and Unvested Equity Awards” reflect the 44.4% increase in the Company’s total shareholder return in 2025.
|
|
|
|
|
| Non-PEO NEO Average Total Compensation Amount |
$ 2,321,421
|
2,140,666
|
2,285,243
|
2,065,369
|
2,623,371
|
| Non-PEO NEO Average Compensation Actually Paid Amount |
$ 4,530,276
|
3,899,727
|
2,378,593
|
1,578,025
|
1,838,719
|
| Adjustment to Non-PEO NEO Compensation Footnote |
The following adjustments relating to equity awards were made to total compensation for each year to determine CAP: | | | | | | | | | | | | | | | | | | | | | | Year | Value of Equity Awards Disclosed in the Summary Compensation Table | Year End Value of Equity Awards Granted During the Covered Year | Change in Fair Value of Outstanding and Unvested Equity Awards | Change in Fair Value of Awards Granted in Prior Years Vesting During the Covered Year | Value of Awards Granted in Prior Years that Fail to Meet Applicable Vesting Conditions During the Covered Year | Total Equity Award Adjustments | | 2025 | | | | | | | | PEO | $(5,499,951) | $10,273,849 | $8,227,636 | $(196,848) | $0 | $12,804,686 | Average non-PEO NEO | $(1,143,743) | $2,127,170 | $1,244,870 | $(19,442) | $0 | $2,208,855 | | | | | | | | | | | | | | | | | | | | | | | | | | | | | | | | | | | | | | | | | | | | | | | | | | | | | | | | | | | | | | | | | | | | | | | | | | | | | | | | | | | | |
|
|
|
|
|
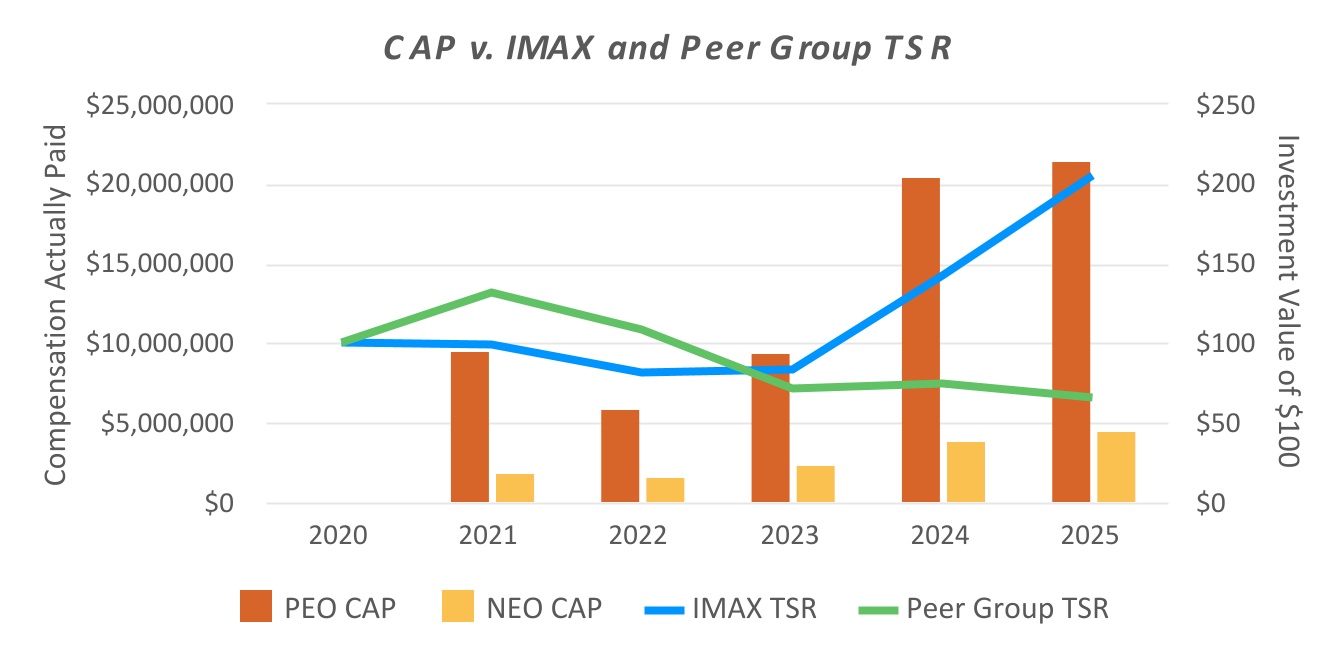
| Compensation Actually Paid vs. Total Shareholder Return |
The following graphs depict the relationship between CAP and IMAX TSR, Peer Group TSR, Total Adjusted EBITDA(1), and Net Income.
|
|
|
|
|
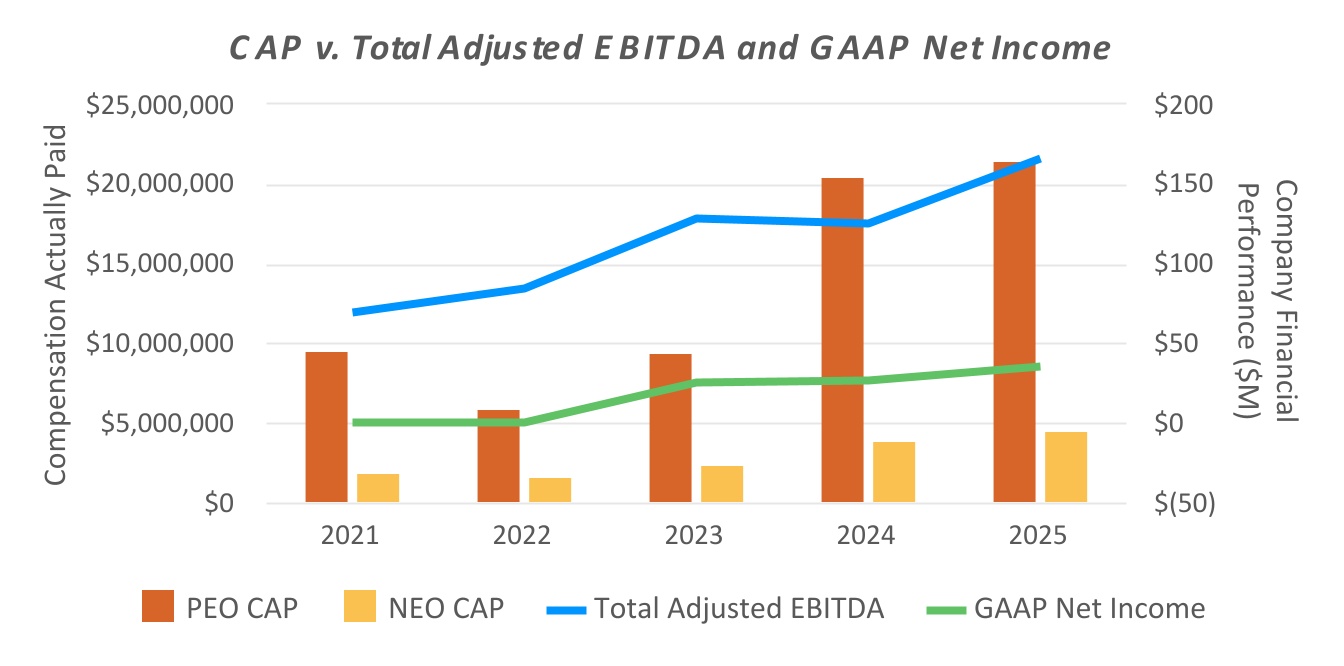
| Compensation Actually Paid vs. Net Income |
(1)Total Adjusted EBITDA is a non-GAAP financial measure. Please see “Non-GAAP Measures” on page 76 for a reconciliation of all non-GAAP measures to the most directly comparable GAAP measure and a description of how the non-GAAP numbers are calculated from our audited financial statements.
|
|
|
|
|
| Total Shareholder Return Vs Peer Group |
The following graphs depict the relationship between CAP and IMAX TSR, Peer Group TSR, Total Adjusted EBITDA(1), and Net Income.
|
|
|
|
|
| Tabular List, Table |
Adjusted EPS •Installations
•Signings
•Total Adjusted EBITDA Growth
•Total Adjusted EBITDA Margin
•Total Revenue
|
|
|
|
|
| Total Shareholder Return Amount |
$ 205.1
|
142.1
|
83.4
|
81.4
|
99.0
|
| Peer Group Total Shareholder Return Amount |
65.8
|
74.6
|
71.0
|
108.1
|
131.5
|
| Net Income (Loss) |
34,900,000
|
26,100,000
|
25,300,000
|
(22,800,000)
|
(22,300,000)
|
| Adjustment to Compensation, Amount |
$ 184,900,000
|
$ 138,900,000
|
$ 144,000,000.0
|
$ 95,700,000
|
$ 88,700,000
|
| PEO Name |
Richard L. Gelfond
|
|
|
|
|
| Additional 402(v) Disclosure |
The dollar amounts reported represent the amount of net income attributable to common shareholders reflected in the Company’s audited financial statements for the applicable year (GAAP Net Income).
|
|
|
|
|
| Measure:: 1 |
|
|
|
|
|
| Pay vs Performance Disclosure |
|
|
|
|
|
| Name |
•Adjusted EPS
|
|
|
|
|
| Non-GAAP Measure Description |
Based on the Company assessment, Total Adjusted EBITDA is the financial performance measure most closely linked to the calculation of CAP. Total Adjusted EBITDA is a non-GAAP Financial Measure. See “Non-GAAP Financial Measures” on page 76 for a reconciliation of all non-GAAP measurements to the most directly comparable GAAP measure and a description of how the non-GAAP numbers are calculated from our audited financial statements.
|
|
|
|
|
| Measure:: 2 |
|
|
|
|
|
| Pay vs Performance Disclosure |
|
|
|
|
|
| Name |
Installations
|
|
|
|
|
| Measure:: 3 |
|
|
|
|
|
| Pay vs Performance Disclosure |
|
|
|
|
|
| Name |
Signings
|
|
|
|
|
| Measure:: 4 |
|
|
|
|
|
| Pay vs Performance Disclosure |
|
|
|
|
|
| Name |
Total Adjusted EBITDA Growth
|
|
|
|
|
| Measure:: 5 |
|
|
|
|
|
| Pay vs Performance Disclosure |
|
|
|
|
|
| Name |
Total Adjusted EBITDA Margin
|
|
|
|
|
| Measure:: 6 |
|
|
|
|
|
| Pay vs Performance Disclosure |
|
|
|
|
|
| Name |
Total Revenue
|
|
|
|
|
| PEO |
|
|
|
|
|
| Pay vs Performance Disclosure |
|
|
|
|
|
| Adjustment to Compensation, Amount |
$ 12,804,686
|
|
|
|
|
| PEO | Aggregate Grant Date Fair Value of Equity Award Amounts Reported in Summary Compensation Table |
|
|
|
|
|
| Pay vs Performance Disclosure |
|
|
|
|
|
| Adjustment to Compensation, Amount |
(5,499,951)
|
|
|
|
|
| PEO | Year-end Fair Value of Equity Awards Granted in Covered Year that are Outstanding and Unvested |
|
|
|
|
|
| Pay vs Performance Disclosure |
|
|
|
|
|
| Adjustment to Compensation, Amount |
10,273,849
|
|
|
|
|
| PEO | Year-over-Year Change in Fair Value of Equity Awards Granted in Prior Years That are Outstanding and Unvested |
|
|
|
|
|
| Pay vs Performance Disclosure |
|
|
|
|
|
| Adjustment to Compensation, Amount |
8,227,636
|
|
|
|
|
| PEO | Change in Fair Value as of Vesting Date of Prior Year Equity Awards Vested in Covered Year |
|
|
|
|
|
| Pay vs Performance Disclosure |
|
|
|
|
|
| Adjustment to Compensation, Amount |
(196,848)
|
|
|
|
|
| PEO | Prior Year End Fair Value of Equity Awards Granted in Any Prior Year that Fail to Meet Applicable Vesting Conditions During Covered Year |
|
|
|
|
|
| Pay vs Performance Disclosure |
|
|
|
|
|
| Adjustment to Compensation, Amount |
0
|
|
|
|
|
| Non-PEO NEO |
|
|
|
|
|
| Pay vs Performance Disclosure |
|
|
|
|
|
| Adjustment to Compensation, Amount |
2,208,855
|
|
|
|
|
| Non-PEO NEO | Aggregate Grant Date Fair Value of Equity Award Amounts Reported in Summary Compensation Table |
|
|
|
|
|
| Pay vs Performance Disclosure |
|
|
|
|
|
| Adjustment to Compensation, Amount |
(1,143,743)
|
|
|
|
|
| Non-PEO NEO | Year-end Fair Value of Equity Awards Granted in Covered Year that are Outstanding and Unvested |
|
|
|
|
|
| Pay vs Performance Disclosure |
|
|
|
|
|
| Adjustment to Compensation, Amount |
2,127,170
|
|
|
|
|
| Non-PEO NEO | Year-over-Year Change in Fair Value of Equity Awards Granted in Prior Years That are Outstanding and Unvested |
|
|
|
|
|
| Pay vs Performance Disclosure |
|
|
|
|
|
| Adjustment to Compensation, Amount |
1,244,870
|
|
|
|
|
| Non-PEO NEO | Change in Fair Value as of Vesting Date of Prior Year Equity Awards Vested in Covered Year |
|
|
|
|
|
| Pay vs Performance Disclosure |
|
|
|
|
|
| Adjustment to Compensation, Amount |
(19,442)
|
|
|
|
|
| Non-PEO NEO | Prior Year End Fair Value of Equity Awards Granted in Any Prior Year that Fail to Meet Applicable Vesting Conditions During Covered Year |
|
|
|
|
|
| Pay vs Performance Disclosure |
|
|
|
|
|
| Adjustment to Compensation, Amount |
$ 0
|
|
|
|
|