Pay vs Performance Disclosure - USD ($)
Dec. 31, 2025
Dec. 31, 2024
Dec. 31, 2023
Dec. 31, 2022
Dec. 31, 2021
Pay Versus Performance
As required by Section 953(a) of the Dodd-Frank Wall Street Reform and Consumer Protection Act and Item 402(v) of Regulation S-K, we are providing the following information about the relationship between executive compensation actually paid to our Principal Executive Officer (“PEO”) and other named executive officers, and certain financial performance measures for the Company. Refer to the CD&A above for further information concerning the Company’s variable pay-for-performance philosophy, the metrics used by the Company to align executive compensation with Company performance, and how the Compensation Committee makes its decisions.
Pay Versus Performance Table
Year | Summary Compensation Table Total for PEO(1) | Compensation Actually Paid to PEO(2) | Average Summary Compensation Table Total For Non-PEO NEOs(3) | Average Compensation Actually Paid To Non-PEO NEOs(4) | Value Of Initial Fixed $100 Investment Based On: | Net Income (in thousands)(7) | Constant- Currency EBITDA (in thousands)(8) | |||||||||||||||||
Total Shareholder Return(5) | S&P 500 Computer & Electronics Retail IndexTotal Shareholder Return(6) | |||||||||||||||||||||||
2025 | $2,147,758 | $1,120,669 | $857,330 | $463,462 | $565.69 | $83.94 | $21,330 | $36,676 | ||||||||||||||||
2024 | $1,884,260 | $3,352,674 | $818,575 | $1,589,515 | $693.32 | $102.11 | $18,610 | $29,895 | ||||||||||||||||
2023 | $3,223,774 | $1,706,585 | $684,612 | $812,018 | $291.98 | $88.15 | $12,323 | $20,479 | ||||||||||||||||
2022 | $1,482,930 | $673,899 | $843,401 | $457,582 | $172.81 | $86.19 | $12,497 | $19,598 | ||||||||||||||||
2021 | $1,031,203 | $1,222,437 | $822,226 | $653,774 | $188.44 | $104.47 | $9,198 | $14,007 | ||||||||||||||||
(1) | Our principal executive officer for each of the years shown was Mr. Foster, Chief Executive Officer. The dollar amounts set forth in this column (b) represent the amounts of total compensation reported for Mr. Foster in the “Total” column of Summary Compensation Table for each applicable year. |
(2) | The amounts set forth in this column (c) represent the amount of “compensation actually paid” to Mr. Foster, as computed in accordance with Item 402(v) of Regulation S-K. These amounts do not reflect the actual amount of compensation paid to or earned by Mr. Foster during fiscal years 2025, 2024, 2023, 2022 and 2021; rather, they reflect Mr. Foster’s total compensation, as reported in the “Total” column of the Summary Compensation Table for each applicable year, after the following adjustments: |
Adjustments to Determine Compensation “Actually Paid” to PEO | 2025 ($) | ||
Amounts reported under the “Stock Awards” column in the Summary Compensation Table | (600,008) | ||
Fair value of stock awards granted during year that remain unvested as of year end | (27,622) | ||
Fair value of stock awards granted during year that vest during year | — | ||
Change in fair value of stock awards from prior year-end to current year-end of awards granted prior to year that were outstanding and unvested as of year end | (297,137) | ||
Change in fair value of stock awards from prior year-end to vesting date of awards granted prior to year that vested during year | (102,322) | ||
Fair value of awards granted prior to that year that were forfeited during year | — | ||
Total Adjustments: | (1,027,090) | ||
(3) | The non-PEO NEOs for 2025 are Matthew Sullivan, Chief Financial Officer, Charles Bass, Chief Alliances Officer, Timothy Popovich, Chief Operating Officer, Vito Legrottaglie, former Chief Information Officer, and Andrew Clark, former Chief Financial Officer. The non-PEO NEOs for 2024, 2023, 2022, and 2021 were Andrew Clark, Chief Financial Officer, Charles Bass, Chief Alliances Officer, and Vito Legrottaglie, Chief Information Officer. The amounts set forth in this column (d) represent the average of the amounts reported for our NEOs as a group (excluding Mr. Foster) in the “Total” column of Summary Compensation Table for each applicable year. |
(4) | The amounts set forth in this column (e) represent the amount of “compensation actually paid” to our non-PEO NEOs, as computed in accordance with Item 402(v) of Regulation S-K. These amounts do not reflect the actual amount of compensation paid to or earned by our non-PEO NEOs during fiscal years 2025, 2024, 2023, 2022 and 2021; rather, they reflect the average total compensation of our non-PEO NEOs, as reported in the “Total” column of the Summary Compensation Table for each applicable year, after the following adjustments: |
Adjustments to Determine Compensation “Actually Paid” to Non-PEO NEOs | 2025 ($) | ||
Amounts reported under the “Stock Awards” column in the Summary Compensation Table | (244,704) | ||
Fair value of stock awards granted during year that remain unvested as of year end | (7,425) | ||
Fair value of stock awards granted during year that vest during year | (3,073) | ||
Change in fair value of stock awards from prior year-end to current year-end of awards granted prior to year that were outstanding and unvested as of year end | (89,633) | ||
Change in fair value of stock awards from prior year-end to vesting date of awards granted prior to year that vested during year | (49,033) | ||
Fair value of stock awards granted prior to that year that were forfeited during that year | — | ||
Total Adjustments: | (393,868) | ||
(5) | TSR is cumulative for the measurement periods beginning on December 31, 2021, and ending on December 31 of each of 2025, 2024, 2023, 2022, and 2021, respectively, calculated in accordance with Item 201(e) of Regulation S-K. |
(6) | “Peer Group” represents the S&P 500 Computer and Electronics Retail Index, which is used by the Company for purposes of compliance with Item 201(e) of Regulation S-K. |
(7) | Reflects “Net Income” in our consolidated statements of income included in our Annual Reports on Form 10-K for each of the years ended December 31, 2025, 2024, 2023, 2022 and 2021. |
(8) | While we use numerous financial and non-financial performance measures to evaluate performance under our compensation programs, constant-currency EBITDA is our Company Selected Measure, which is the financial performance measure that, in our assessment, represents the most important performance measure used to link compensation actually paid to our NEOs to Company performance for fiscal year 2025. See Appendix A for a reconciliation of constant-currency EBITDA, a non-GAAP financial measure, to the most directly comparable GAAP measure and a description of how this measure is calculated from our audited financial statements. |
(1) | Our principal executive officer for each of the years shown was Mr. Foster, Chief Executive Officer. The dollar amounts set forth in this column (b) represent the amounts of total compensation reported for Mr. Foster in the “Total” column of Summary Compensation Table for each applicable year. |
(3) | The non-PEO NEOs for 2025 are Matthew Sullivan, Chief Financial Officer, Charles Bass, Chief Alliances Officer, Timothy Popovich, Chief Operating Officer, Vito Legrottaglie, former Chief Information Officer, and Andrew Clark, former Chief Financial Officer. The non-PEO NEOs for 2024, 2023, 2022, and 2021 were Andrew Clark, Chief Financial Officer, Charles Bass, Chief Alliances Officer, and Vito Legrottaglie, Chief Information Officer. The amounts set forth in this column (d) represent the average of the amounts reported for our NEOs as a group (excluding Mr. Foster) in the “Total” column of Summary Compensation Table for each applicable year. |
(6) | “Peer Group” represents the S&P 500 Computer and Electronics Retail Index, which is used by the Company for purposes of compliance with Item 201(e) of Regulation S-K. |
(2) | The amounts set forth in this column (c) represent the amount of “compensation actually paid” to Mr. Foster, as computed in accordance with Item 402(v) of Regulation S-K. These amounts do not reflect the actual amount of compensation paid to or earned by Mr. Foster during fiscal years 2025, 2024, 2023, 2022 and 2021; rather, they reflect Mr. Foster’s total compensation, as reported in the “Total” column of the Summary Compensation Table for each applicable year, after the following adjustments: |
Adjustments to Determine Compensation “Actually Paid” to PEO | 2025 ($) | ||
Amounts reported under the “Stock Awards” column in the Summary Compensation Table | (600,008) | ||
Fair value of stock awards granted during year that remain unvested as of year end | (27,622) | ||
Fair value of stock awards granted during year that vest during year | — | ||
Change in fair value of stock awards from prior year-end to current year-end of awards granted prior to year that were outstanding and unvested as of year end | (297,137) | ||
Change in fair value of stock awards from prior year-end to vesting date of awards granted prior to year that vested during year | (102,322) | ||
Fair value of awards granted prior to that year that were forfeited during year | — | ||
Total Adjustments: | (1,027,090) | ||
(4) | The amounts set forth in this column (e) represent the amount of “compensation actually paid” to our non-PEO NEOs, as computed in accordance with Item 402(v) of Regulation S-K. These amounts do not reflect the actual amount of compensation paid to or earned by our non-PEO NEOs during fiscal years 2025, 2024, 2023, 2022 and 2021; rather, they reflect the average total compensation of our non-PEO NEOs, as reported in the “Total” column of the Summary Compensation Table for each applicable year, after the following adjustments: |
Adjustments to Determine Compensation “Actually Paid” to Non-PEO NEOs | 2025 ($) | ||
Amounts reported under the “Stock Awards” column in the Summary Compensation Table | (244,704) | ||
Fair value of stock awards granted during year that remain unvested as of year end | (7,425) | ||
Fair value of stock awards granted during year that vest during year | (3,073) | ||
Change in fair value of stock awards from prior year-end to current year-end of awards granted prior to year that were outstanding and unvested as of year end | (89,633) | ||
Change in fair value of stock awards from prior year-end to vesting date of awards granted prior to year that vested during year | (49,033) | ||
Fair value of stock awards granted prior to that year that were forfeited during that year | — | ||
Total Adjustments: | (393,868) | ||
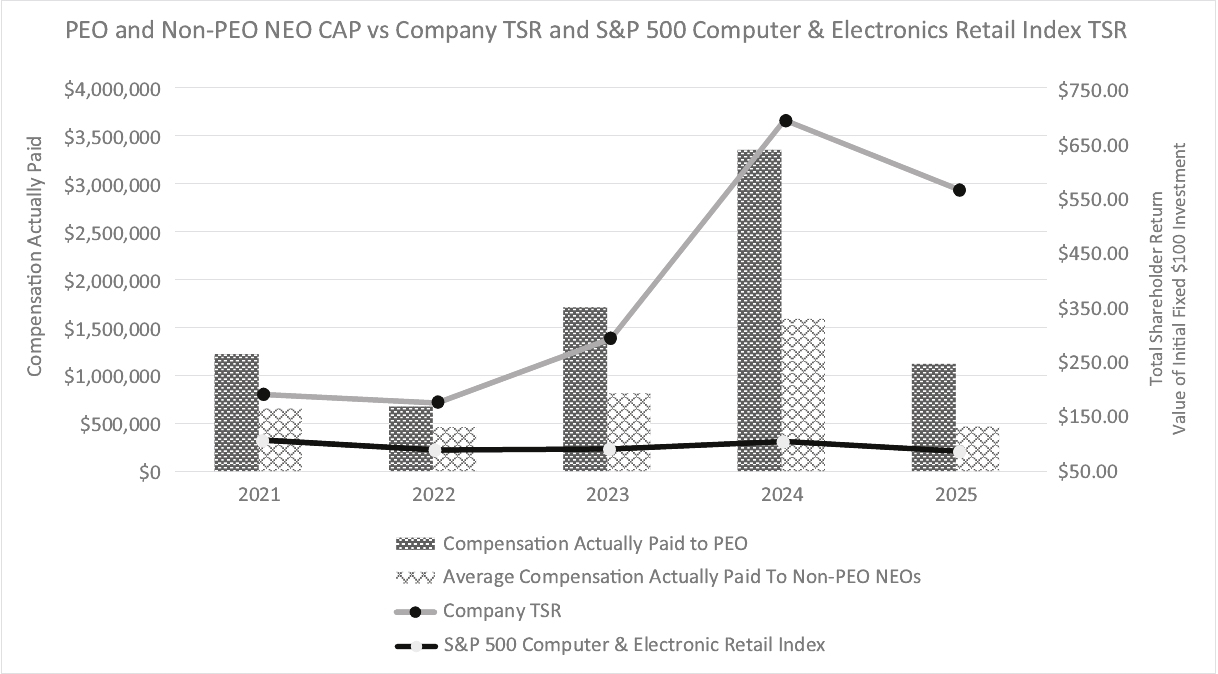
Relationship Between PEO and NEO Compensation Actually Paid, Company TSR, and S&P 500 Computer and Electronics Retail Index TSR
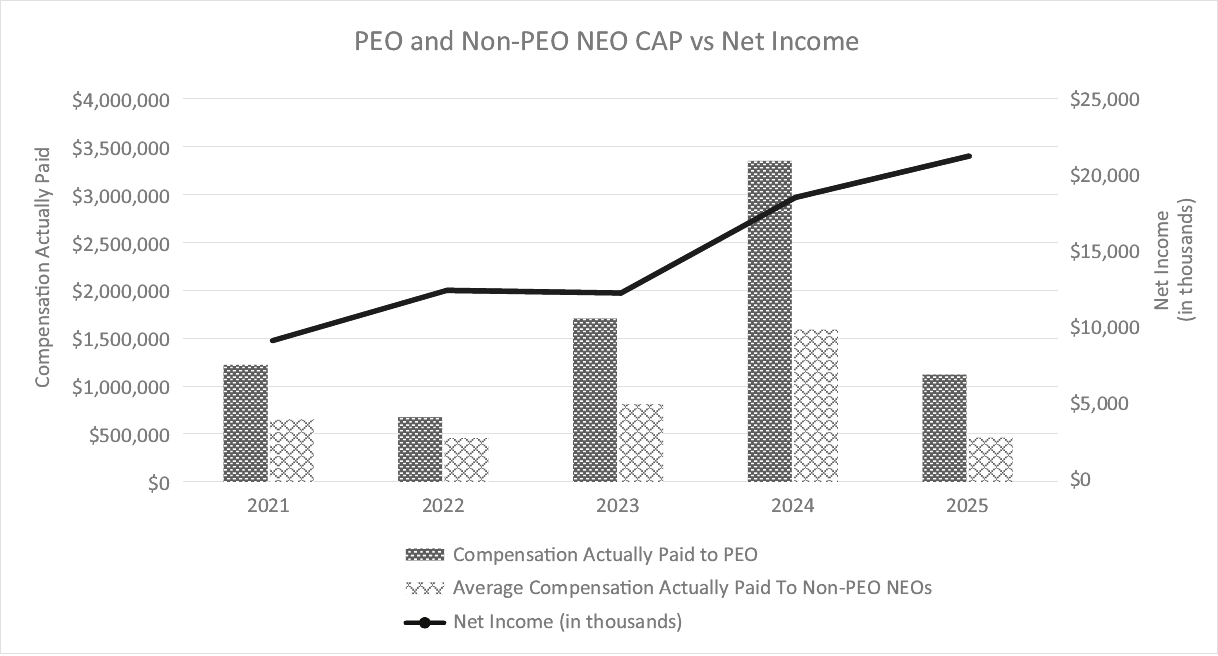
Relationship Between PEO and NEO Compensation Actually Paid and Net Income
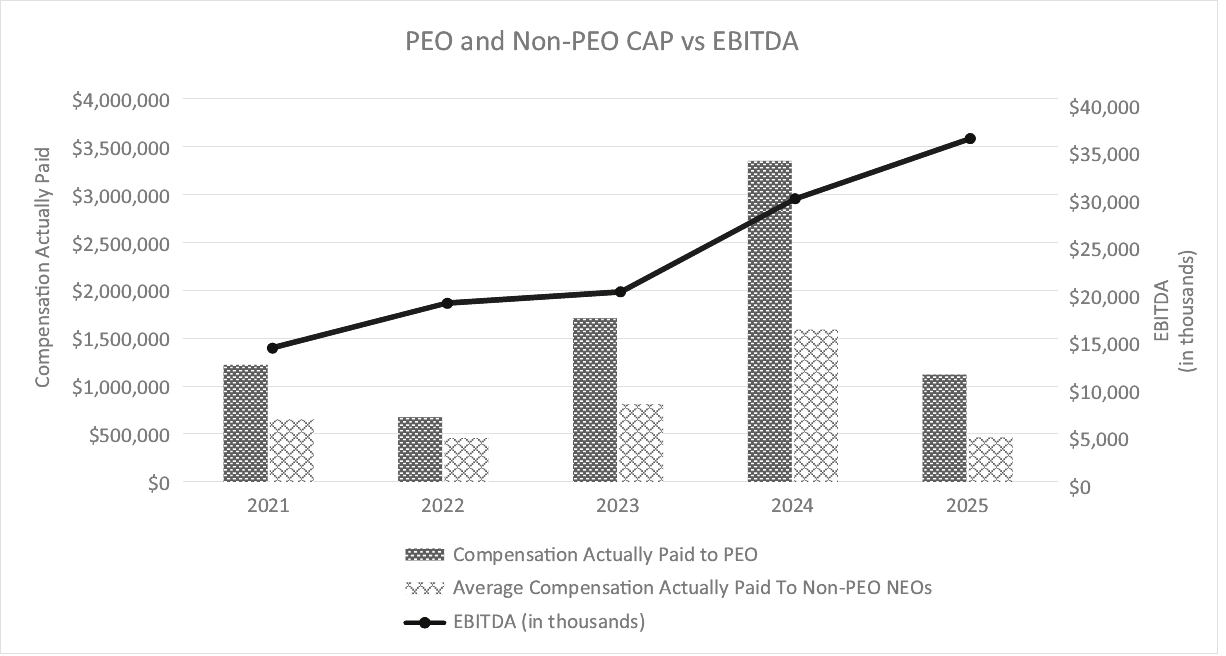
Relationship Between PEO and NEO Compensation Actually Paid and Constant-Currency EBITDA (Company Selected Measure)
Relationship Between PEO and NEO Compensation Actually Paid, Company TSR, and S&P 500 Computer and Electronics Retail Index TSR
Tabular List of Financial Performance Measures
The following table identifies the financial performance measures that, in our assessment, represented the most important financial performance measures used to link the compensation actually paid to our PEO and the other NEOs in 2025 to Company performance. The role of each of these performance measures in our executive compensation programs is more thoroughly discussed in the “Executive Compensation” section in the CD&A along with a description of how executive compensation relates to Company performance and how the Compensation Committee makes its decisions.
Financial Performance Measures |
Constant-Currency EBITDA |
Earnings Per Share (EPS) |
Return on Equity (ROE) |
(8) | While we use numerous financial and non-financial performance measures to evaluate performance under our compensation programs, constant-currency EBITDA is our Company Selected Measure, which is the financial performance measure that, in our assessment, represents the most important performance measure used to link compensation actually paid to our NEOs to Company performance for fiscal year 2025. See Appendix A for a reconciliation of constant-currency EBITDA, a non-GAAP financial measure, to the most directly comparable GAAP measure and a description of how this measure is calculated from our audited financial statements. |