Pay vs Performance Disclosure
|
12 Months Ended |
|
Dec. 31, 2025
USD ($)
|
Dec. 31, 2024
USD ($)
|
Dec. 31, 2023
USD ($)
|
Dec. 31, 2022
USD ($)
|
Dec. 31, 2021
USD ($)
|
| Pay vs Performance Disclosure |
|
|
|
|
|
| Pay vs Performance Disclosure, Table |
| | | | | | | | | | | | | | | | | | | | | | | | | | | | | | | | | | Year | Summary Compensation Table Total for First PEO1 | Summary Compensation Table Total for Second PEO1 | Compensation Actually Paid (“CAP”) to First PEO1,2 | Compensation Actually Paid (“CAP”) to Second PEO1,2 | Average Summary Compensation Table Total for Non-PEO NEOs1 | Average Compensation Actually Paid (“CAP”) to Non-PEO NEOs1,2 | Value of Initial Fixed $100 Investment Based On:3 | Net Income ($MM) | ROIC4 | | TSR | Peer Group TSR | | 2025 | $— | $7,294,990 | $— | $9,546,329 | $2,388,603 | $2,876,076 | $163 | $160 | $221 | 11.6% | | 2024 | $— | $6,619,371 | $— | $4,045,537 | $2,015,680 | $755,552 | $139 | $147 | $336 | 21.1% | | 2023 | $10,208,430 | $— | $21,648,207 | $— | $3,012,548 | $4,371,853 | $171 | $132 | $518 | 28.9% | | 2022 | $9,778,425 | $— | $10,488,051 | $— | $2,155,049 | $2,295,919 | $125 | $105 | $300 | 21.7% | | 2021 | $9,540,015 | $— | $15,777,895 | $— | $2,426,224 | $3,531,383 | $127 | $123 | $221 | 18.8% |
|
|
|
|
|
| Company Selected Measure Name |
ROIC
|
|
|
|
|
| Named Executive Officers, Footnote |
The PEO(s) for whom compensation figures are shown in this table are: for the 2021, 2022 and 2023 fiscal years, John L. Garrison, Jr. (“First PEO”); and for the 2024 and 2025 fiscal years, Simon Meester (“Second PEO”). Mr. Garrison retired as Chairman and Chief Executive Officer, and Mr. Meester was appointed as President and Chief Executive Officer, effective as of January 1, 2024. The Non-PEO NEOs for whom the average compensation is presented in this table are: for the 2025 fiscal year, Jennifer Kong-Picarello, Julie Beck, Scott Posner, Kieran Hegarty and Patrick Carroll, for the 2024 fiscal year, Julie Beck, Kieran Hegarty, Scott Posner and Joshua Gross; for the 2023 fiscal year, Julie Beck, Kieran Hegarty, Simon Meester and Scott Posner; for the 2022 fiscal year, Julie Beck, Kieran Hegarty, Simon Meester and Scott Posner; and for the 2021 fiscal year, John D. Sheehan, Kieran Hegarty, Scott Posner and Amy George.
|
|
|
|
|
| Peer Group Issuers, Footnote |
For purposes of this disclosure, the peer group is the S&P 500 Industrial Machinery & Supplies & Components Index. Dollar values assume $100 was invested for the cumulative period from December 31, 2020 through the end of the listed year in either the Company or the S&P 500 Industrial Machinery & Supplies & Components Index, and reinvestment of the pre-tax value of dividends paid. Historical stock performance is not necessarily indicative of future stock performance.
|
|
|
|
|
| PEO Total Compensation Amount |
$ 7,294,990
|
$ 6,619,371
|
$ 10,208,430
|
$ 9,778,425
|
$ 9,540,015
|
| PEO Actually Paid Compensation Amount |
$ 9,546,329
|
4,045,537
|
21,648,207
|
10,488,051
|
15,777,895
|
| Adjustment To PEO Compensation, Footnote |
The amounts shown for CAP have been calculated in accordance with Item 402(v) of Regulation S K and do not reflect compensation actually realized or received by the Company’s NEOs. These amounts reflect total compensation as set forth in the Summary Compensation Table with the following deductions (grant date fair value of all equity awards granted during the fiscal year) and additions (the fair value as of the end of the fiscal year of awards granted in that fiscal year that remain outstanding and unvested as of fiscal year-end; the change in fair value from the prior fiscal year-end to that fiscal year-end of equity awards granted in prior years that remained outstanding and unvested at fiscal year-end; and the change in fair value from the prior fiscal year-end through the vesting date of equity awards granted in prior years that vested during that fiscal year), as detailed in the table below. Fair value of time-based awards is based on the price of our common stock at year-end date or, in the case of vesting date, the actual vesting price. The fair value of performance-based awards, except for awards based on a market condition, is based on the same valuation methodology, except year-end values are multiplied by the probability of achievement as of the year-end date or, in the case of vesting date, the vesting date values are multiplied by actual shares earned based on performance. For awards based on a market condition, fair value is based on the Monte Carlo method as of the year-end date or, in the case of vesting date, the actual vesting price and actual shares earned. | | | | | | | | | | | | | | | | | | | | | | | | | | | | | | | | | | 2021 | 2022 | 2023 | 2024 | 2025 | First
PEO | Average of Non-PEO NEOs | First
PEO | Average of Non-PEO NEOs | First
PEO | Average of Non-PEO NEOs | Second PEO | Average of Non-PEO NEOs | Second PEO | Average of Non-PEO NEOs | | Compensation Total for covered fiscal year (“FY”) from Summary Compensation Table (“SCT”) | $9,540,015 | $2,426,224 | $9,778,425 | $2,155,049 | $10,208,430 | $3,012,548 | $6,619,371 | $2,015,680 | $7,294,990 | $2,388,603 | DEDUCT: grant date fair value (“GDFV”) of awards granted during FY, reported under the Stock Awards column in the SCT | $6,005,749 | $1,128,010 | $5,956,740 | $1,023,006 | $6,543,682 | $1,686,898 | $4,923,294 | $1,111,648 | $5,203,318 | $1,265,023 | ADD: FY-end fair value of awards granted during year that remain outstanding and unvested as of FY-end | $6,575,896 | $1,286,783 | $6,808,043 | $1,169,208 | $7,975,223 | $1,869,372 | $3,174,022 | $722,596 | $7,151,484 | $1,683,113 | ADD: change in fair value from prior FY-end to current FY-end of awards granted in any prior year that are outstanding and unvested as of FY-end | $4,552,701 | $779,463 | $638,536 | $52,017 | $5,861,498 | $817,301 | $(822,209) | $(866,562) | $466,850 | $175,231 | ADD: change in fair value from prior FY-end to vesting date for any awards granted in any prior year that vested during the FY. | $1,115,032 | $166,923 | $(780,213) | $(57,349) | $4,146,738 | $359,530 | $(2,353) | $(4,514) | $(163,677) | $(105,848) | | Total: Compensation Actually Paid (CAP) | $15,777,895 | $3,531,383 | $10,488,051 | $2,295,919 | $21,648,207 | $4,371,853 | $4,045,537 | $755,552 | $9,546,329 | $2,876,076 |
|
|
|
|
|
| Non-PEO NEO Average Total Compensation Amount |
$ 2,388,603
|
2,015,680
|
3,012,548
|
2,155,049
|
2,426,224
|
| Non-PEO NEO Average Compensation Actually Paid Amount |
$ 2,876,076
|
755,552
|
4,371,853
|
2,295,919
|
3,531,383
|
| Adjustment to Non-PEO NEO Compensation Footnote |
The amounts shown for CAP have been calculated in accordance with Item 402(v) of Regulation S K and do not reflect compensation actually realized or received by the Company’s NEOs. These amounts reflect total compensation as set forth in the Summary Compensation Table with the following deductions (grant date fair value of all equity awards granted during the fiscal year) and additions (the fair value as of the end of the fiscal year of awards granted in that fiscal year that remain outstanding and unvested as of fiscal year-end; the change in fair value from the prior fiscal year-end to that fiscal year-end of equity awards granted in prior years that remained outstanding and unvested at fiscal year-end; and the change in fair value from the prior fiscal year-end through the vesting date of equity awards granted in prior years that vested during that fiscal year), as detailed in the table below. Fair value of time-based awards is based on the price of our common stock at year-end date or, in the case of vesting date, the actual vesting price. The fair value of performance-based awards, except for awards based on a market condition, is based on the same valuation methodology, except year-end values are multiplied by the probability of achievement as of the year-end date or, in the case of vesting date, the vesting date values are multiplied by actual shares earned based on performance. For awards based on a market condition, fair value is based on the Monte Carlo method as of the year-end date or, in the case of vesting date, the actual vesting price and actual shares earned. | | | | | | | | | | | | | | | | | | | | | | | | | | | | | | | | | | 2021 | 2022 | 2023 | 2024 | 2025 | First
PEO | Average of Non-PEO NEOs | First
PEO | Average of Non-PEO NEOs | First
PEO | Average of Non-PEO NEOs | Second PEO | Average of Non-PEO NEOs | Second PEO | Average of Non-PEO NEOs | | Compensation Total for covered fiscal year (“FY”) from Summary Compensation Table (“SCT”) | $9,540,015 | $2,426,224 | $9,778,425 | $2,155,049 | $10,208,430 | $3,012,548 | $6,619,371 | $2,015,680 | $7,294,990 | $2,388,603 | DEDUCT: grant date fair value (“GDFV”) of awards granted during FY, reported under the Stock Awards column in the SCT | $6,005,749 | $1,128,010 | $5,956,740 | $1,023,006 | $6,543,682 | $1,686,898 | $4,923,294 | $1,111,648 | $5,203,318 | $1,265,023 | ADD: FY-end fair value of awards granted during year that remain outstanding and unvested as of FY-end | $6,575,896 | $1,286,783 | $6,808,043 | $1,169,208 | $7,975,223 | $1,869,372 | $3,174,022 | $722,596 | $7,151,484 | $1,683,113 | ADD: change in fair value from prior FY-end to current FY-end of awards granted in any prior year that are outstanding and unvested as of FY-end | $4,552,701 | $779,463 | $638,536 | $52,017 | $5,861,498 | $817,301 | $(822,209) | $(866,562) | $466,850 | $175,231 | ADD: change in fair value from prior FY-end to vesting date for any awards granted in any prior year that vested during the FY. | $1,115,032 | $166,923 | $(780,213) | $(57,349) | $4,146,738 | $359,530 | $(2,353) | $(4,514) | $(163,677) | $(105,848) | | Total: Compensation Actually Paid (CAP) | $15,777,895 | $3,531,383 | $10,488,051 | $2,295,919 | $21,648,207 | $4,371,853 | $4,045,537 | $755,552 | $9,546,329 | $2,876,076 |
|
|
|
|
|
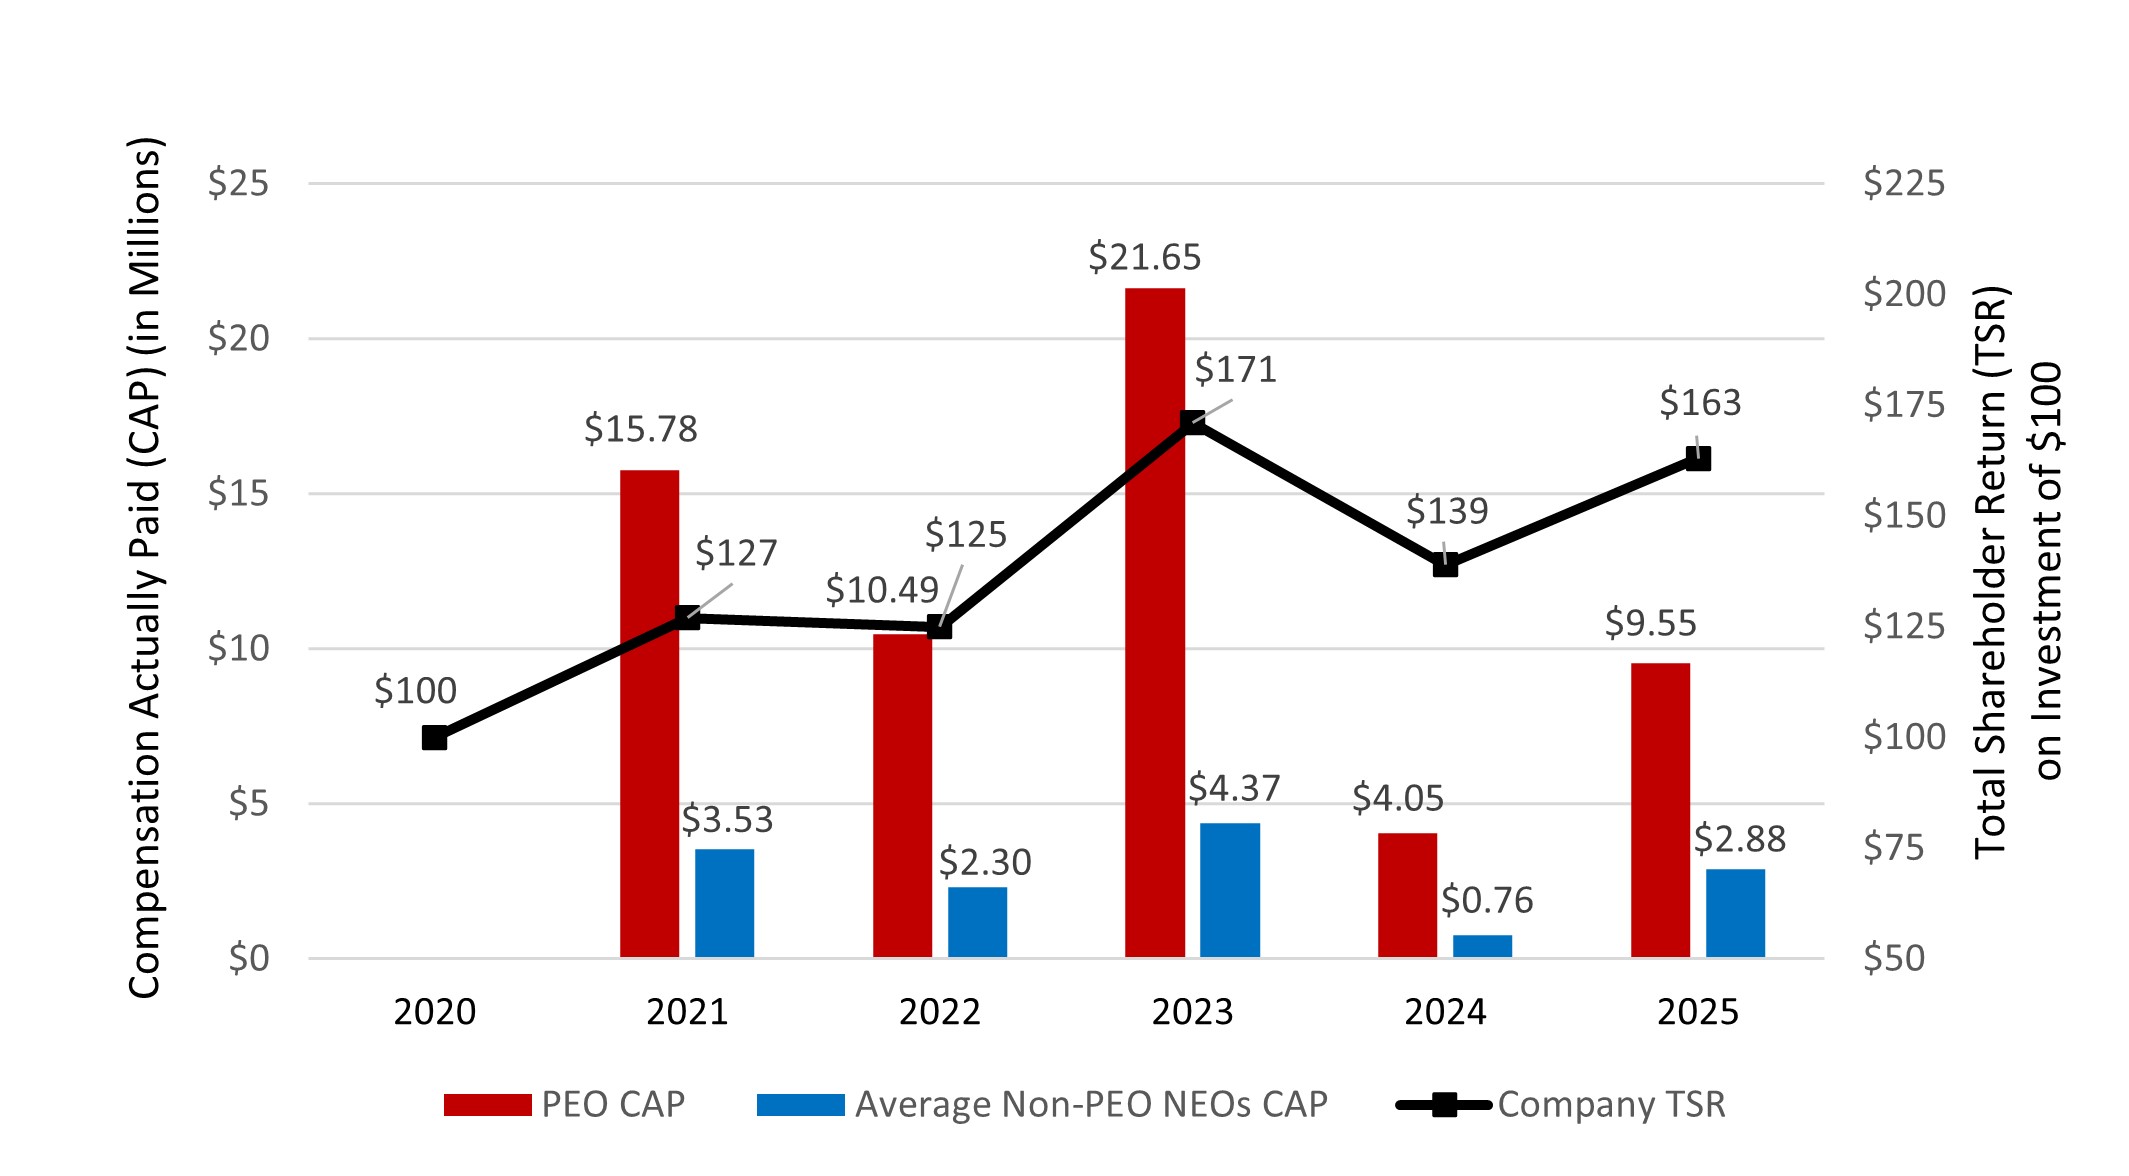
| Compensation Actually Paid vs. Total Shareholder Return |
| | | | Description of Relationship Between CAP and Company TSR |
The following chart sets forth the relationship between CAP to our PEO, the average of CAP to our other Non-PEO NEOs, and the Company’s cumulative TSR over the five most recently completed fiscal years. |
|
|
|
|
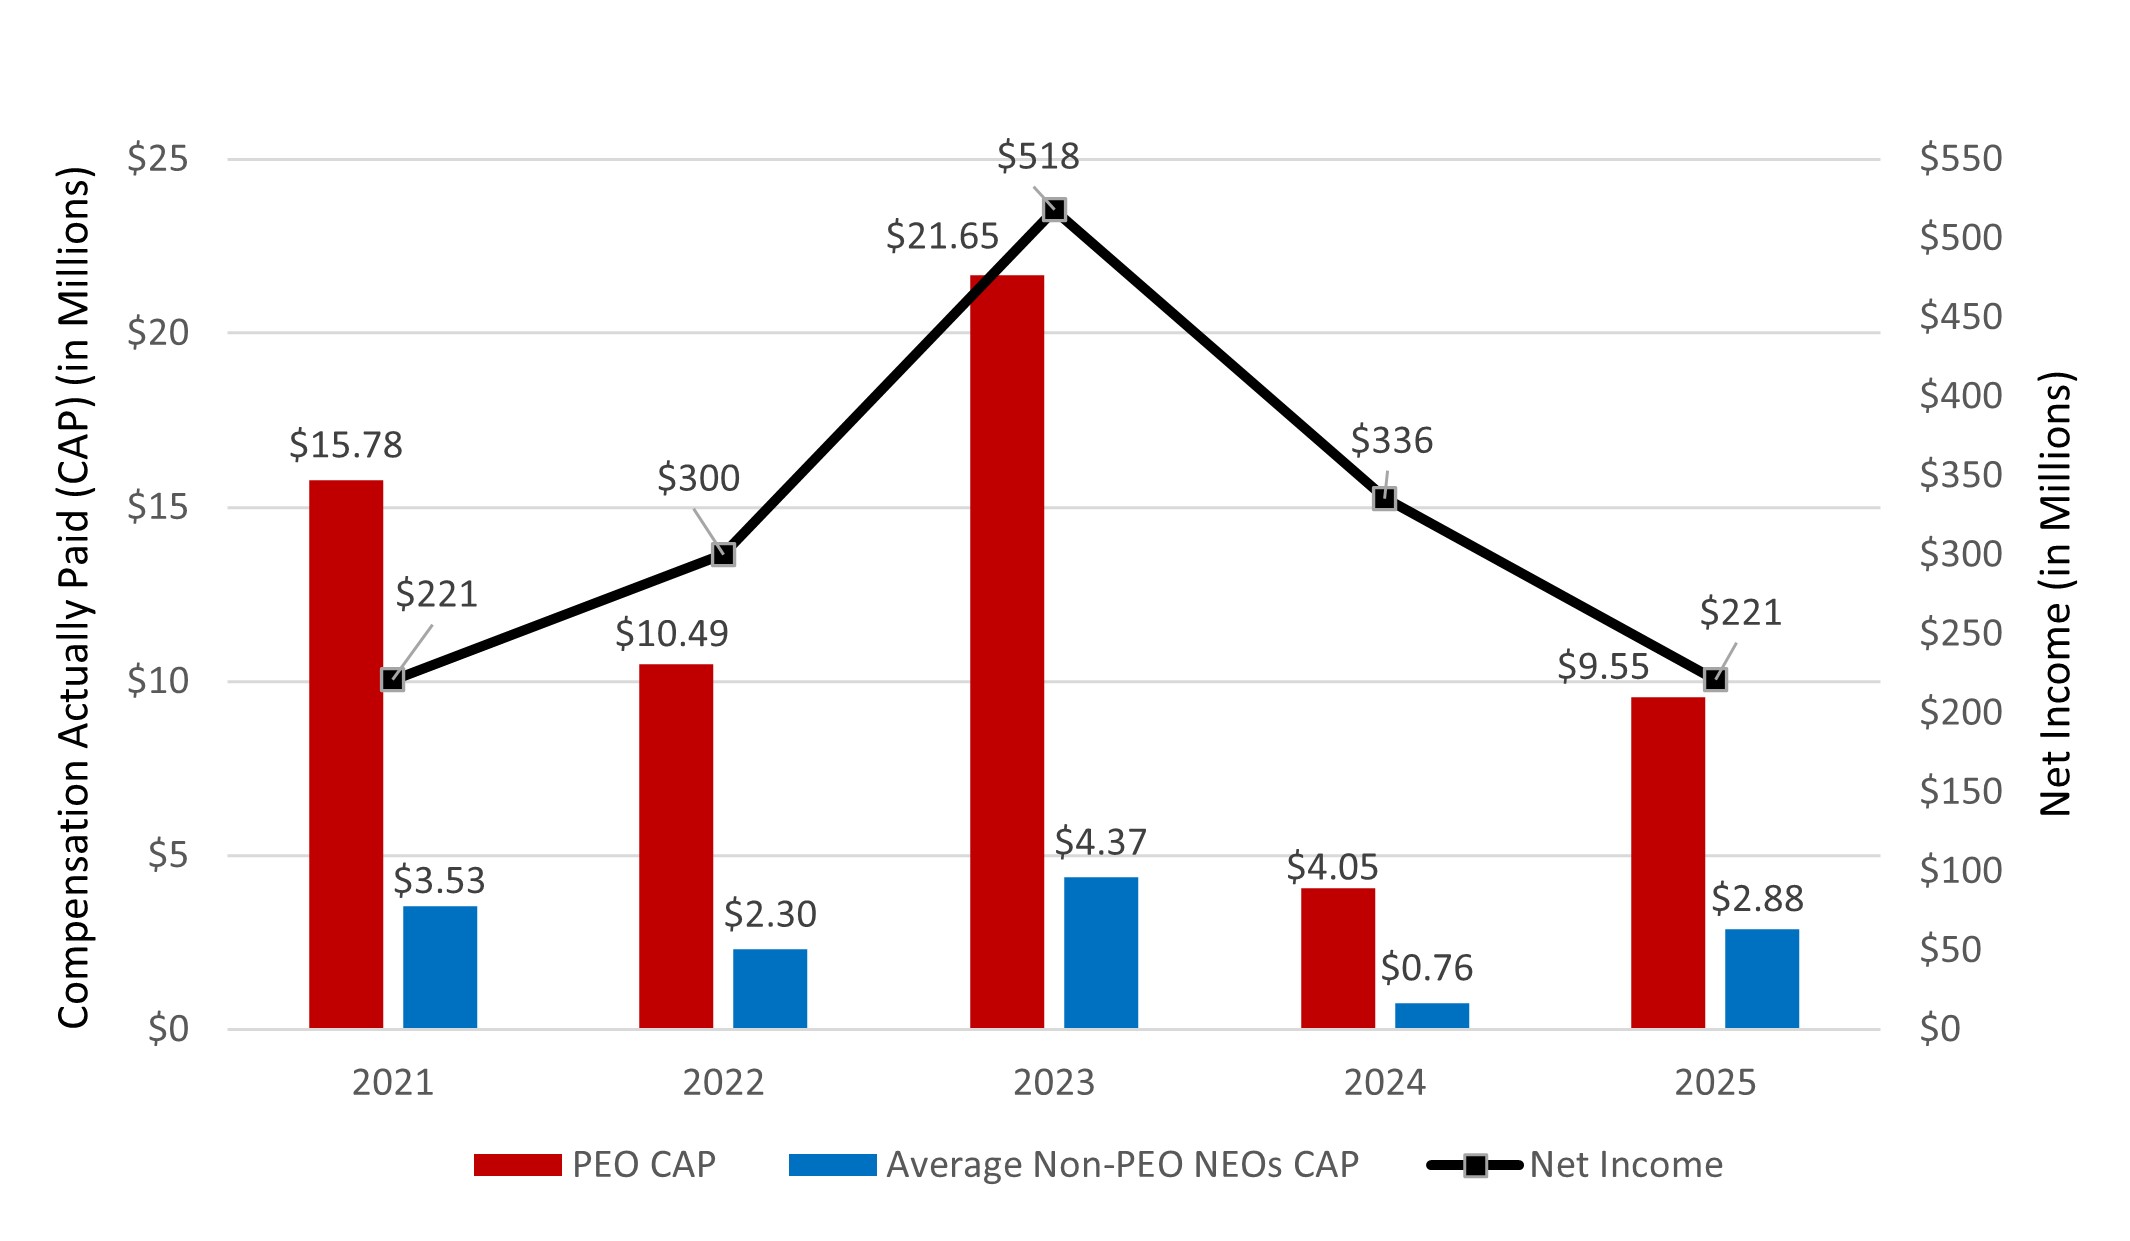
| Compensation Actually Paid vs. Net Income |
| | | | Description of Relationship Between CAP and Net Income |
The following chart sets forth the relationship between CAP to our PEO, the average of CAP to our other Non-PEO NEOs, and our Net Income during the five most recently completed fiscal years. |
|
|
|
|
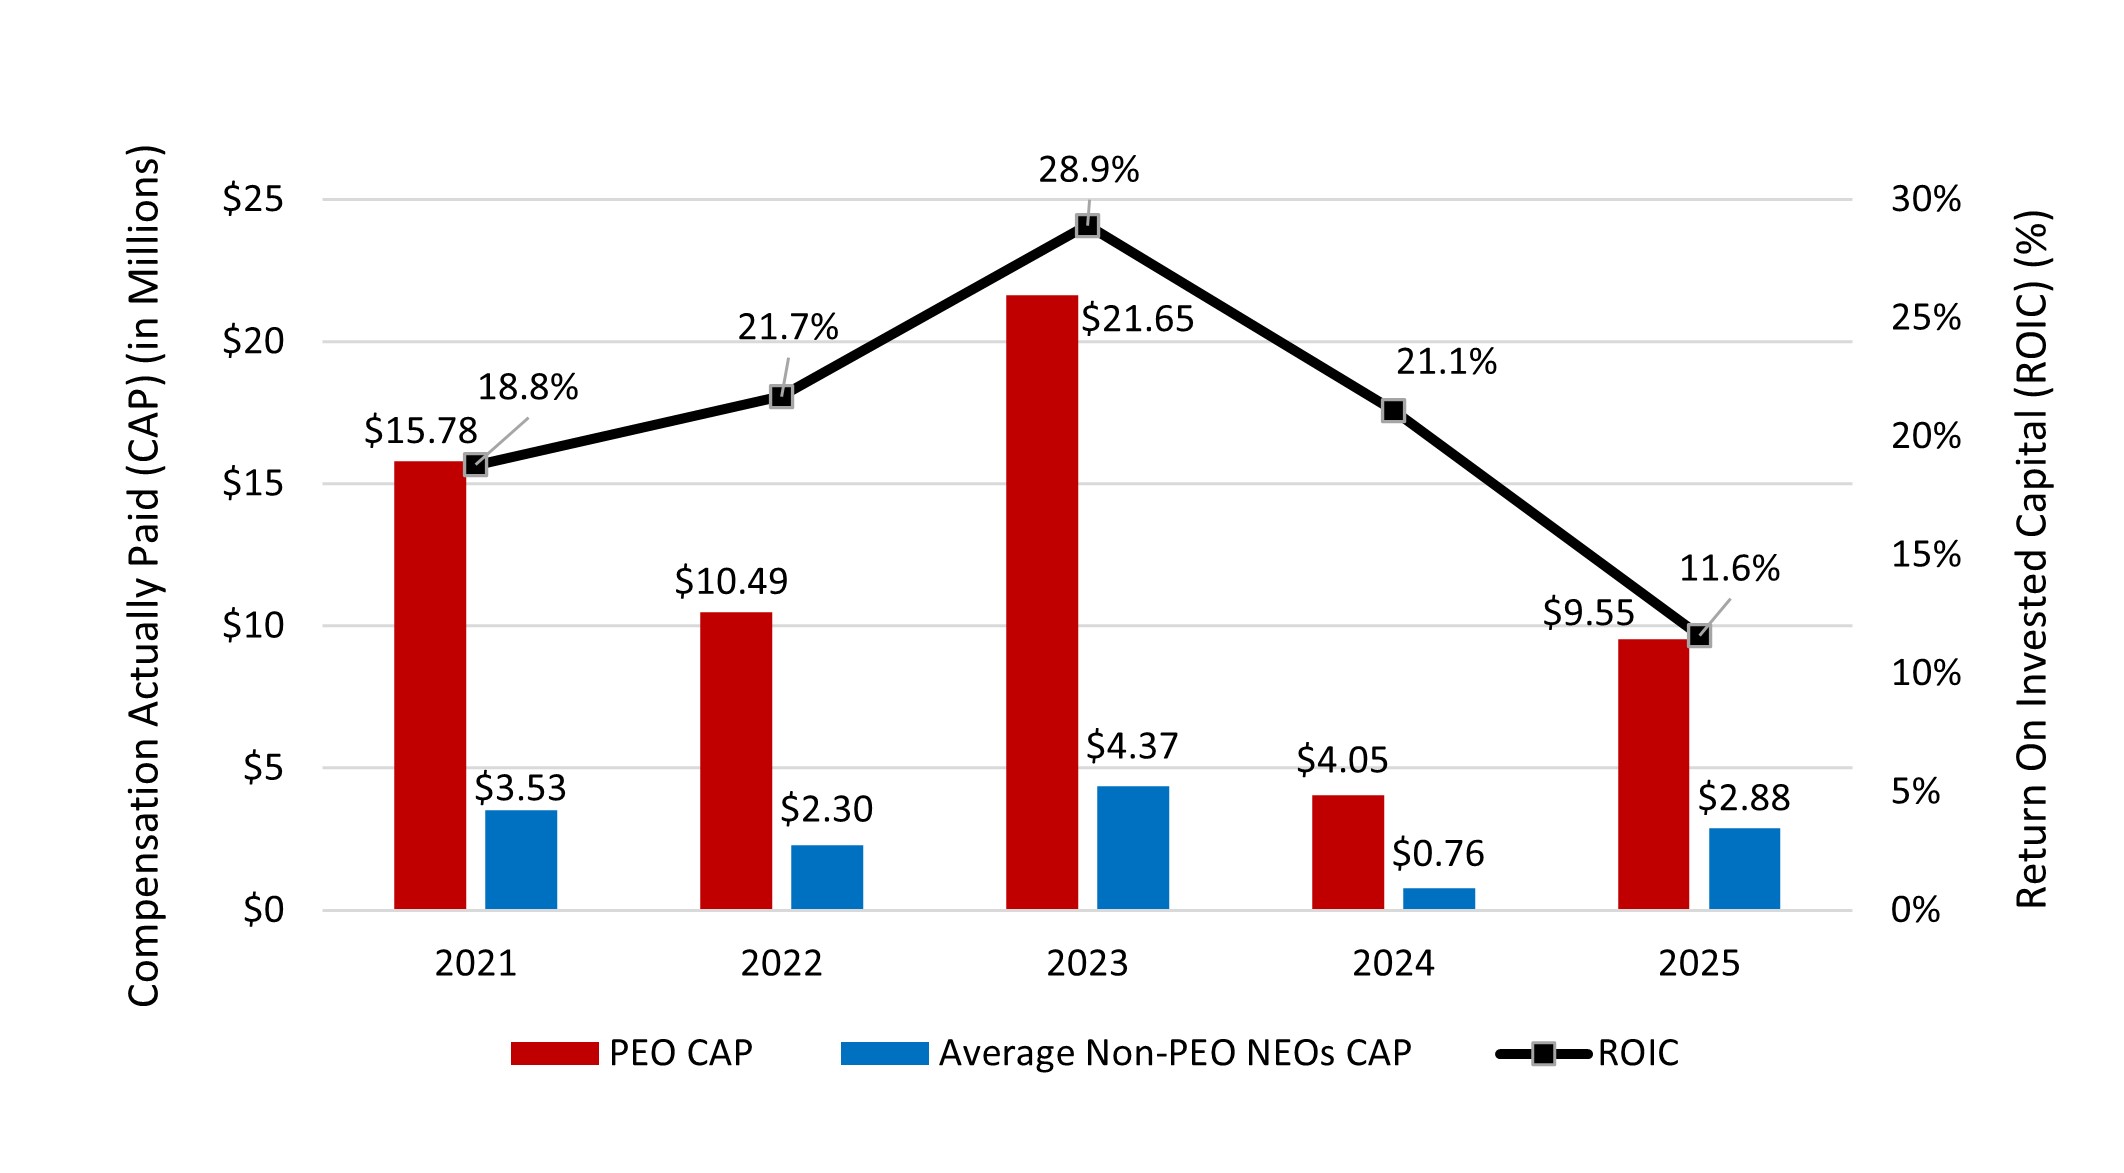
| Compensation Actually Paid vs. Company Selected Measure |
| | | | Description of Relationship Between CAP and ROIC |
The following chart sets forth the relationship between CAP to our PEO, the average of CAP to our other Non-PEO NEOs, and our ROIC during the five most recently completed fiscal years. |
|
|
|
|
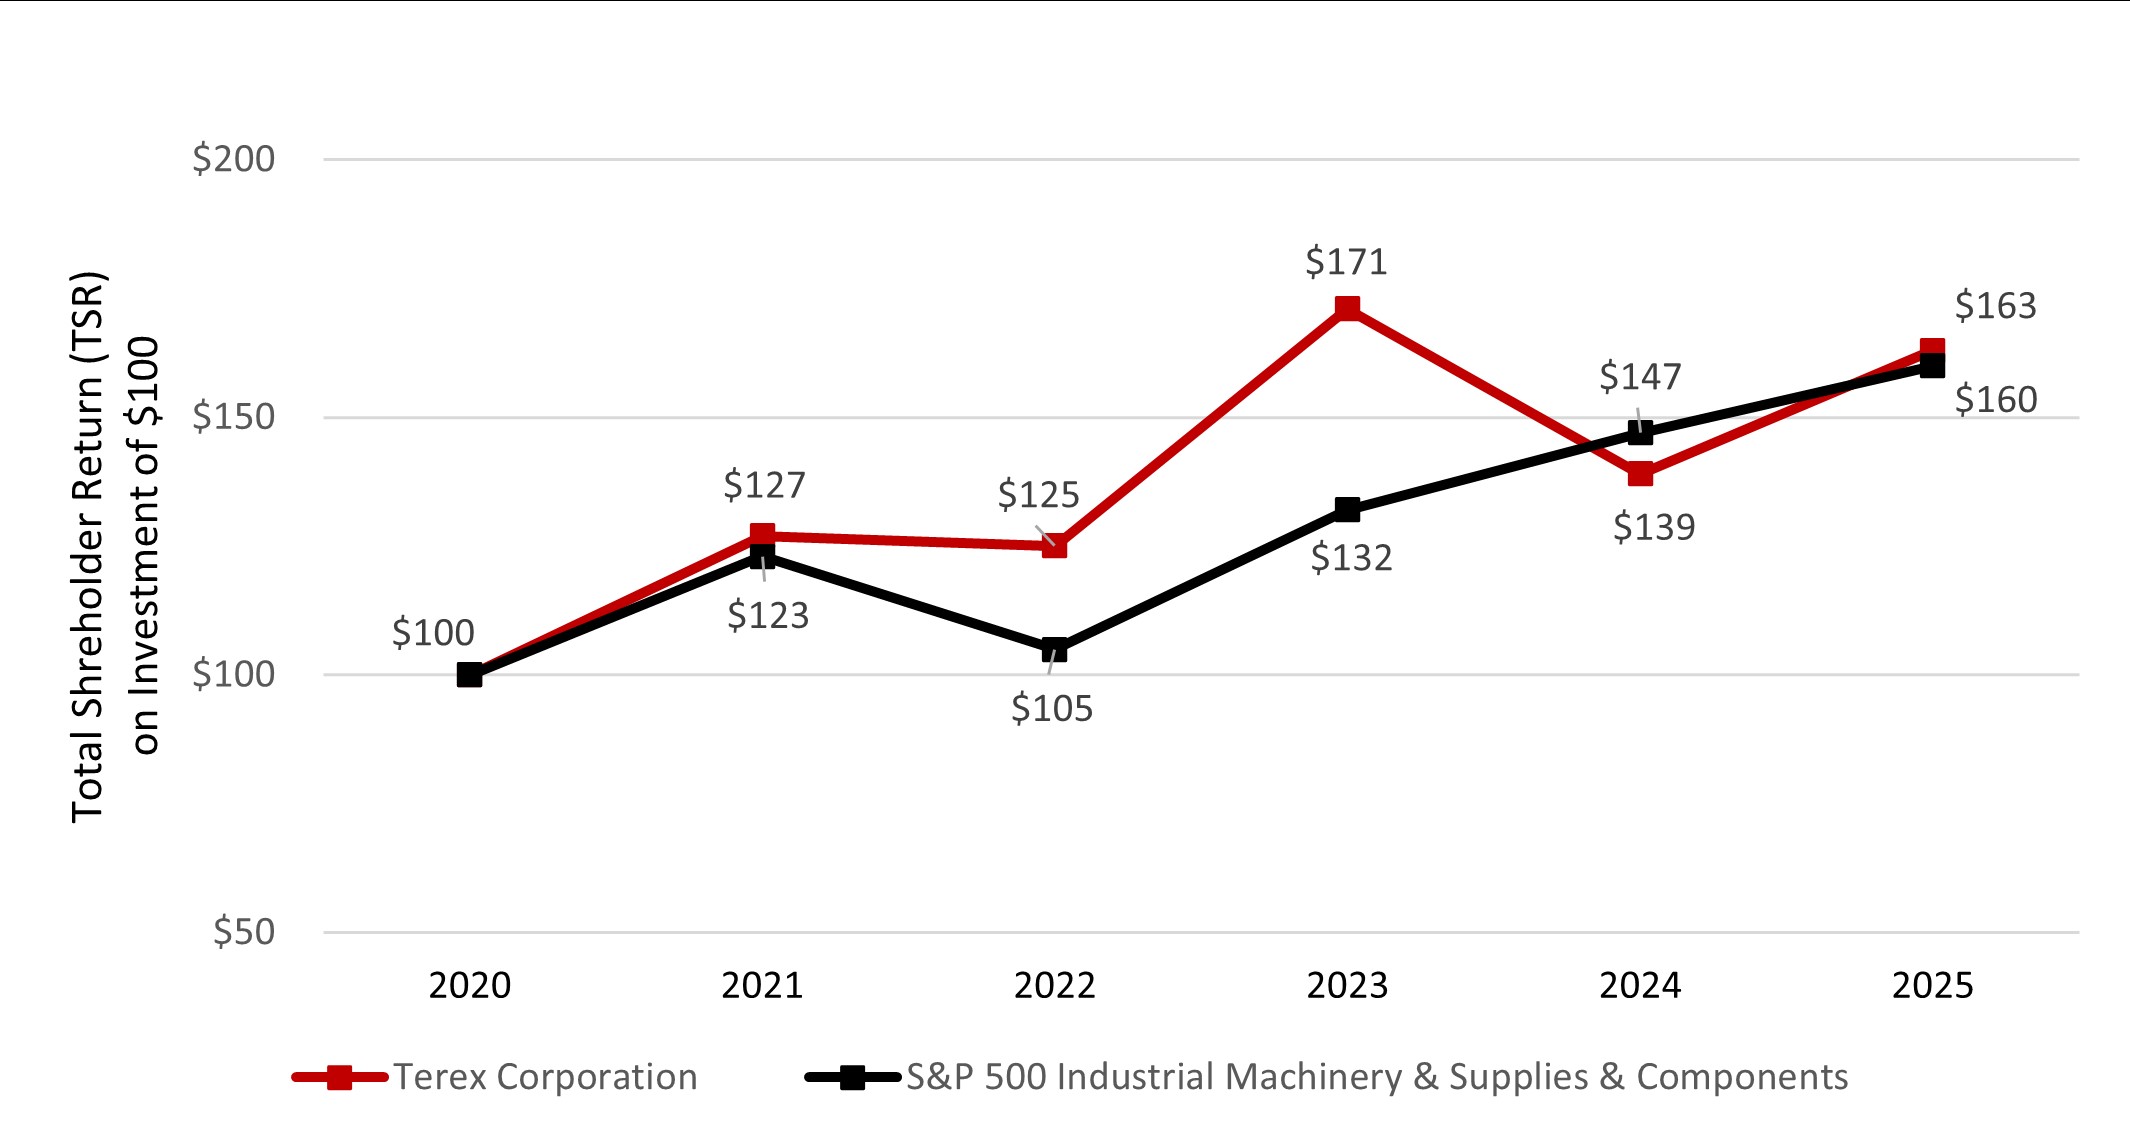
| Total Shareholder Return Vs Peer Group |
| | | | Description of Relationship Between Company TSR and Peer Group TSR |
The following chart compares our cumulative TSR over the five most recently completed fiscal years to that of the S&P 500 Industrial Machinery & Supplies & Components Index over the same period. |
|
|
|
|
| Tabular List, Table |
| | | | | | | 2025 Most Important Measures (Unranked) | | ROIC | Relative TSR compared to Benchmark Companies | Operating Profit | NWC |
|
|
|
|
|
| Total Shareholder Return Amount |
$ 163
|
139
|
171
|
125
|
127
|
| Peer Group Total Shareholder Return Amount |
160
|
147
|
132
|
105
|
123
|
| Net Income (Loss), Including Portion Attributable to Noncontrolling Interest |
$ 221,000,000
|
$ 336,000,000
|
$ 518,000,000
|
$ 300,000,000
|
$ 221,000,000
|
| Company Selected Measure Amount |
0.116
|
0.211
|
0.289
|
0.217
|
0.188
|
| PEO Name |
Simon Meester
|
John L. Garrison, Jr.
|
John L. Garrison, Jr.
|
John L. Garrison, Jr.
|
John L. Garrison, Jr.
|
| Additional 402(v) Disclosure |
As required by Section 953(a) of the Dodd-Frank Wall Street Reform and Consumer Protection Act and Item 402(v) of Regulation S-K, we are providing the following information about the relationship between executive compensation actually paid and the Company’s financial performance for the fiscal years listed below. For further information concerning our pay-for-performance philosophy and how we align executive compensation with Company financial performance, refer to the “Compensation Discussion and Analysis” section, beginning on page 25. The following table discloses information on “Compensation Actually Paid” (“CAP”) (as defined by SEC rule and further described below) to our principal executive officer (“PEO”) (also referred to as our CEO) and to our other Named Executive Officers (“NEOs”), on an average basis, during the specified years, alongside total shareholder return (“TSR”) and net income metrics, as well as the Company selected performance measure of ROIC, as defined and described in the “Compensation Discussion and Analysis” section beginning on page 25. In reviewing this information, it is important to consider that the amounts included in the tables below are described as “compensation actually paid” in accordance with the SEC rules, but such amounts do not necessarily represent compensation actually earned or realized by our PEO and NEOs in such years, as the below calculations are influenced by numerous factors, including, but not limited to, fluctuations in the stock price of outstanding unvested stock award grants.
|
|
|
|
|
| Measure:: 1 |
|
|
|
|
|
| Pay vs Performance Disclosure |
|
|
|
|
|
| Name |
ROIC
|
|
|
|
|
| Non-GAAP Measure Description |
We determined ROIC to be the “most important” financial performance measure used to link performance to Compensation Actually Paid to our PEO and other NEOs in the 2025 fiscal year, in accordance with Item 402(v) of Regulation S-K. For the definition and further description of ROIC, please refer to the “Compensation Discussion and Analysis” section beginning on page 25.
|
|
|
|
|
| Measure:: 2 |
|
|
|
|
|
| Pay vs Performance Disclosure |
|
|
|
|
|
| Name |
Operating Profit
|
|
|
|
|
| Measure:: 3 |
|
|
|
|
|
| Pay vs Performance Disclosure |
|
|
|
|
|
| Name |
Relative TSR compared to Benchmark Companies
|
|
|
|
|
| Measure:: 4 |
|
|
|
|
|
| Pay vs Performance Disclosure |
|
|
|
|
|
| Name |
NWC
|
|
|
|
|
| Simon Meester [Member] |
|
|
|
|
|
| Pay vs Performance Disclosure |
|
|
|
|
|
| PEO Total Compensation Amount |
$ 7,294,990
|
$ 6,619,371
|
|
|
|
| PEO Actually Paid Compensation Amount |
9,546,329
|
4,045,537
|
|
|
|
| John L. Garrison Jr. [Member] |
|
|
|
|
|
| Pay vs Performance Disclosure |
|
|
|
|
|
| PEO Total Compensation Amount |
|
|
$ 10,208,430
|
$ 9,778,425
|
$ 9,540,015
|
| PEO Actually Paid Compensation Amount |
|
|
21,648,207
|
10,488,051
|
15,777,895
|
| PEO | Aggregate Grant Date Fair Value of Equity Award Amounts Reported in Summary Compensation Table |
|
|
|
|
|
| Pay vs Performance Disclosure |
|
|
|
|
|
| Adjustment to Compensation, Amount |
(5,203,318)
|
(4,923,294)
|
(6,543,682)
|
(5,956,740)
|
(6,005,749)
|
| PEO | Year-end Fair Value of Equity Awards Granted in Covered Year that are Outstanding and Unvested |
|
|
|
|
|
| Pay vs Performance Disclosure |
|
|
|
|
|
| Adjustment to Compensation, Amount |
7,151,484
|
3,174,022
|
7,975,223
|
6,808,043
|
6,575,896
|
| PEO | Year-over-Year Change in Fair Value of Equity Awards Granted in Prior Years That are Outstanding and Unvested |
|
|
|
|
|
| Pay vs Performance Disclosure |
|
|
|
|
|
| Adjustment to Compensation, Amount |
466,850
|
(822,209)
|
5,861,498
|
638,536
|
4,552,701
|
| PEO | Change in Fair Value as of Vesting Date of Prior Year Equity Awards Vested in Covered Year |
|
|
|
|
|
| Pay vs Performance Disclosure |
|
|
|
|
|
| Adjustment to Compensation, Amount |
(163,677)
|
(2,353)
|
4,146,738
|
(780,213)
|
1,115,032
|
| Non-PEO NEO | Aggregate Grant Date Fair Value of Equity Award Amounts Reported in Summary Compensation Table |
|
|
|
|
|
| Pay vs Performance Disclosure |
|
|
|
|
|
| Adjustment to Compensation, Amount |
(1,265,023)
|
(1,111,648)
|
(1,686,898)
|
(1,023,006)
|
(1,128,010)
|
| Non-PEO NEO | Year-end Fair Value of Equity Awards Granted in Covered Year that are Outstanding and Unvested |
|
|
|
|
|
| Pay vs Performance Disclosure |
|
|
|
|
|
| Adjustment to Compensation, Amount |
1,683,113
|
722,596
|
1,869,372
|
1,169,208
|
1,286,783
|
| Non-PEO NEO | Year-over-Year Change in Fair Value of Equity Awards Granted in Prior Years That are Outstanding and Unvested |
|
|
|
|
|
| Pay vs Performance Disclosure |
|
|
|
|
|
| Adjustment to Compensation, Amount |
175,231
|
(866,562)
|
817,301
|
52,017
|
779,463
|
| Non-PEO NEO | Change in Fair Value as of Vesting Date of Prior Year Equity Awards Vested in Covered Year |
|
|
|
|
|
| Pay vs Performance Disclosure |
|
|
|
|
|
| Adjustment to Compensation, Amount |
$ (105,848)
|
$ (4,514)
|
$ 359,530
|
$ (57,349)
|
$ 166,923
|