UNITED STATES
SECURITIES AND EXCHANGE COMMISSION
Washington, D.C. 20549
FORM
CURRENT REPORT
Pursuant to Section 13 or 15(d) of the
Securities Exchange Act of 1934
Date of Report (Date of earliest event reported):
(Exact name of registrant as specified in its charter)
|
(State or other jurisdiction of |
(Commission |
(I.R.S. Employer |
(Address of principal executive offices) |
(zip code) |
Registrant's telephone number, including area code:
(Former name or former address, if changed since last report)
Check the appropriate box below if the Form 8-K filing is intended to simultaneously satisfy the filing obligation of the registrant under any of the following provisions:
| Written communications pursuant to Rule 425 under the Securities Act (17 CFR 230.425) |
| Soliciting material pursuant to Rule 14a-12 under the Exchange Act (17 CFR 240.14a-12) |
| Pre-commencement communications pursuant to Rule 14d-2(b) under the Exchange Act (17 CFR 240.14d-2(b)) |
| Pre-commencement communications pursuant to Rule 13e-4(c) under the Exchange Act (17 CFR 240.13e-4(c)) |
Securities registered pursuant to Section 12(b) of the Act:
| Title of each class | Trading Symbol | Name of each exchange on which registered |
Indicate by check mark whether the Registrant is an emerging growth company as defined in Rule 405 of the Securities Act of 1933 (§230.405 of this chapter) or Rule 12b-2 of the Securities Exchange Act of 1934 (§240.12b-2 of this chapter).
Emerging growth company
If an emerging growth company, indicate by check mark if the Registrant has elected not to use the extended transition period for complying with any new or revised financial accounting standards provided pursuant to Section 13(a) of the Exchange Act. ☐
| Item 2.02. | Results of Operations and Financial Condition. |
On April 28, 2026, Western New England Bancorp, Inc. (the “Company”) issued a press release announcing its financial results for the quarter ended March 31, 2026. A copy of the press release is furnished as Exhibit 99.1 hereto and is hereby incorporated by reference into this Item 2.02.
| Item 7.01. | Regulation FD Disclosure. |
On April 28, 2026, the Company made available an investor presentation to be used during investor meetings. The slide show for the investor presentation is attached to this report as Exhibit 99.2.
The information contained in this Item 7.01 and Exhibits 99.1 and 99.2 attached hereto, is being furnished and shall not be deemed “filed” for purposes of Section 18 of the Securities Exchange Act of 1934, as amended (the “Exchange Act”), or otherwise subject to the liabilities of that section, nor will such information or exhibits be deemed incorporated by reference into any filing made by the Company under the Exchange Act or the Securities Act of 1933, as amended, whether made before or after the date hereof and regardless of any general incorporation language in such filings, except to the extent expressly set forth by specific reference in such filing. The furnishing of the information included in Item 7.01 of this Current Report on Form 8-K shall not be deemed an admission as to the materiality of any information herein that is required to be disclosed solely by reason of Regulation FD.
| Item 9.01. | Financial Statements and Exhibits. |
(a) Not applicable.
(b) Not applicable.
(c) Not applicable.
(d) Exhibits.
The exhibits required by this item are set forth on the Exhibit Index attached hereto.
|
Exhibit Number |
Description | |
| 99.1 | Press Release of Western New England Bancorp, Inc. dated April 28, 2026. | |
| 99.2 | Investor Presentation dated April 28, 2026 for Western New England Bancorp, Inc. | |
| 104 | Cover Page Interactive Data File (embedded within the Inline XBRL document). |
SIGNATURES
Pursuant to the requirements of the Securities Exchange Act of 1934, the registrant has duly caused this report to be signed on its behalf by the undersigned hereunto duly authorized.
| WESTERN NEW ENGLAND BANCORP, INC. | ||
| By: | /s/ Guida R. Sajdak | |
| Guida R. Sajdak | ||
| Chief Financial Officer | ||
Dated: April 28, 2026
Western New England Bancorp, Inc. 8-K
Exhibit 99.1
For further information contact: James C. Hagan, President and CEO Guida R. Sajdak, Executive Vice President and CFO Meghan Hibner, First Vice President and Investor Relations Officer 413-568-1911 |
WESTERN NEW ENGLAND BANCORP, INC. REPORTS RESULTS FOR THREE MONTHS ENDED
MARCH 31, 2026 AND DECLARES QUARTERLY CASH DIVIDEND
Westfield, Massachusetts, April 28, 2026: Western New England Bancorp, Inc. (the “Company” or “WNEB”) (NasdaqGS: WNEB), the holding company for Westfield Bank (the “Bank”), announced today the unaudited results of operations for the three months ended March 31, 2026. The Company reported net income of $4.8 million, or $0.24 per diluted share, for the three months ended March 31, 2026, compared to net income of $2.3 million, or $0.11 per diluted share, for the three months ended March 31, 2025. On a linked quarter basis, net income was $4.8 million, or $0.24 per diluted share, compared to net income of $5.2 million, or $0.26 per diluted share, for the three months ended December 31, 2025.
The Company also announced that its Board of Directors declared a quarterly cash dividend of $0.07 per share on the Company’s common stock. The dividend will be payable on or about May 27, 2026 to shareholders of record on May 13, 2026.
James C. Hagan, President and Chief Executive Officer, commented, “I am pleased to report the results for the first quarter of 2026. Our loan growth, strong and diversified core deposit base, along with our disciplined approach to managing funding costs resulted in an increase in the net interest margin to 2.95%. In the first quarter, core deposits and non-interest bearing deposits represented 70.2% and 25.1% of total deposits, respectively, while the average cost of deposits decreased to 1.72%.
We continue to focus on extending credit within our markets and servicing the needs of our existing customer base while ensuring new opportunities present the appropriate levels of risk and return. Consistent with our prudent credit culture, we continue to proactively identify and manage credit risk within the loan portfolio. At March 31, 2026, our asset quality remained strong, with total delinquency at 0.14% of total loans, and total nonaccrual loans at 0.21% of total loans.”
Hagan concluded, “We remain disciplined in our capital management strategies. During the three months ended March 31, 2026, we repurchased 186,000 shares of common stock and have 686,465 shares of common stock available for repurchase under the 2025 Repurchase Plan.
We are pleased with our first quarter results and are committed to delivering long-term value to shareholders through capital management strategies, which include continued loan growth, share repurchases and quarterly cash dividends.”
Key Highlights:
Loans and Deposits
At March 31, 2026, total loans increased $17.2 million, or 0.8%, from $2.2 billion, or 79.7% of total assets, at December 31, 2025 to $2.2 billion, or 79.5% of total assets. The increase was primarily driven by an increase in residential real estate loans, including home equity loans, of $9.6 million, or 1.1%, an increase in commercial and industrial loans of $6.0 million, or 2.7%, and an increase in commercial real estate loans of $2.1 million, or 0.2%. At March 31, 2026, total deposits of $2.4 billion, increased $20.9 million, or 0.9%, from December 31, 2025, primarily due to a $19.9 million, or 2.9%, increase in time deposits.
1
Allowance for Credit Losses and Credit Quality
At March 31, 2026, the allowance for credit losses was $20.5 million, or 0.93% of total loans, compared to $20.3 million, or 0.93% of total loans, at December 31, 2025. The allowance for credit losses, as a percentage of nonaccrual loans, was 436.9% and 393.2% at March 31, 2026 and December 31, 2025, respectively. At March 31, 2026, nonaccrual loans totaled $4.7 million, or 0.21% of total loans, compared to $5.2 million, or 0.24% of total loans, at December 31, 2025. Total delinquent loans increased from $3.1 million, or 0.14% of total loans, at December 31, 2025 to $3.2 million, or 0.14% of total loans, at March 31, 2026. At March 31, 2026 and December 31, 2025, the Company did not have any other real estate owned.
Net Interest Margin
The net interest margin increased six basis points from 2.89% for the three months ended December 31, 2025 to 2.95% for the three months ended March 31, 2026. The net interest margin, on a tax-equivalent basis, increased six basis points from 2.91% for the three months ended December 31, 2025 to 2.97% for the three months ended March 31, 2026.
Stock Repurchase Program
On April 22, 2025, the Board of Directors authorized the 2025 Repurchase Plan (the “2025 Plan”), pursuant to which the Company may repurchase up to 1.0 million shares of its common stock, or approximately 4.8%, of the Company’s then-outstanding shares of common stock beginning in June of 2025.
During the three months ended March 31, 2026, the Company repurchased 186,000 shares of its common stock at an average price per share of $13.48. As of March 31, 2026, there were 686,465 shares of common stock available for repurchase under the 2025 Plan.
The repurchase of shares under the 2025 Plan is administered through an independent broker. The shares of common stock repurchased under the 2025 Plan have been and will continue to be purchased from time to time at prevailing market prices, through open market or privately negotiated transactions, or otherwise, depending upon market conditions. There is no guarantee as to the exact number, or value, of shares that will be repurchased by the Company, and the Company may discontinue repurchases at any time that the Company’s management (“Management”) determines additional repurchases are not warranted. The timing and amount of additional share repurchases under the 2025 Plan will depend on a number of factors, including the Company’s stock price performance, ongoing capital planning considerations, general market conditions, and applicable legal requirements.
Book Value and Tangible Book Value
The Company’s book value per share was $12.26 at March 31, 2026, compared to $12.16 at December 31, 2025, while tangible book value per share, a non-GAAP financial measure, increased $0.10, or 0.9%, from $11.49 at December 31, 2025 to $11.59 at March 31, 2026. See pages 16-17 for the related tangible book value calculation and a reconciliation of GAAP to non-GAAP financial measures.
Net Income for the Three Months Ended March 31, 2026 Compared to the Three Months Ended December 31, 2025
For the three months ended March 31, 2026, the Company reported net income of $4.8 million, or $0.24 per diluted share, compared to $5.2 million, or $0.26 per diluted share, for the three months ended December 31, 2025. Net interest income totaled $18.8 million for the three months ended March 31, 2026 and the three months ended December 31, 2025. The provision for credit losses increased $560,000, non-interest income increased $260,000, or 8.2%, and non-interest expense increased $138,000 or 0.9%. Return on average assets and return on average equity were 0.71% and 7.77%, respectively, for the three months ended March 31, 2026, compared to 0.75% and 8.40%, respectively, for the three months ended December 31, 2025.
2
Net Interest Income and Net Interest Margin
Net interest income, our primary driver of revenues, totaled $18.8 million for the three months ended March 31, 2026 and the three months ended December 31, 2025. During the three months ended March 31, 2026, interest and dividend income decreased $256,000, or 0.8%, which was offset by a decrease in interest expense of $252,000, or 2.2%.
The net interest margin was 2.95% for the three months ended March 31, 2026, compared to 2.89% for the three months ended December 31, 2025. The net interest margin, on a tax-equivalent basis, was 2.97% for the three months ended March 31, 2026, compared to 2.91% for the three months ended December 31, 2025. The average yield on interest-earning assets, without the impact of tax-equivalent adjustments, increased five basis points from 4.69% for the three months ended December 31, 2025 to 4.74% for the three months ended March 31, 2026. The average loan yield, without the impact of tax-equivalent adjustments, increased six basis points from 5.03% for the three months ended December 31, 2025, to 5.09% for the three months ended March 31, 2026. During the same period, average loans increased $19.7 million, or 0.9%, average securities decreased $6.2 million, or 1.7%, and average short-term investments decreased $7.7 million, or 23.7%.
For the three months ended March 31, 2026 and the three months ended December 31, 2025, the average cost of total funds, including non-interest bearing accounts and borrowings, was 1.88%. For the three months ended March 31, 2026 and the three months ended December 31, 2025, the average cost of core deposits, which the Company defines as all deposits except time deposits, was 1.02%. The average cost of time deposits decreased five basis points from 3.46% for the three months ended December 31, 2025, to 3.41% for the three months ended March 31, 2026.
The average cost of borrowings, including subordinated debt, decreased 21 basis points from 4.96% for the three months ended December 31, 2025 to 4.75% for the three months ended March 31, 2026. Average demand deposits, an interest-free source of funds, decreased $8.0 million, or 1.3%, from $596.5 million, or 25.3%, of total average deposits, for the three months ended December 31, 2025, to $588.5 million, or 25.1% of total average deposits, for the three months ended March 31, 2026.
Provision for (Reversal of) Credit Losses
During the three months ended March 31, 2026, the Company recorded a provision for credit losses of $75,000, compared to a reversal of credit losses of $485,000 during the three months ended December 31, 2025. The provision for credit losses was determined by a number of factors, including, Management’s consideration of existing economic conditions and the economic outlook, the continued strong credit performance of the Company’s loan portfolio, and changes in the loan portfolio mix. Management continues to monitor macroeconomic variables related to the current interest rate environment, tariffs, global unrest resulting from conflicts, inflation and concerns of an economic downturn, and believes it is appropriately reserved for the current economic environment and supportable forecast.
During the three months ended March 31, 2026, the Company recorded net charge-offs of $55,000, compared to net charge-offs of $41,000 for the three months ended December 31, 2025.
Non-Interest Income
Non-interest income increased $260,000, or 8.2%, from $3.2 million for the three months ended December 31, 2025 to $3.4 million for the three months ended March 31, 2026. During the three months ended March 31, 2026, non-interest income included the recognition of $449,000 in bank-owned life insurance (“BOLI”) death benefits. Service charges and fees on deposits decreased $103,000, or 4.6%, from $2.2 million for the three months ended December 31, 2025 to $2.1 million for the three months ended March 31, 2026. For the three months ended March 31, 2026, wealth management income totaled $390,000, compared to $319,000 for the three months ended December 31, 2025. During the same period, assets under management increased from $234.0 million at December 31, 2025 to $235.6 million at March 31, 2026, reflecting net investment appreciation and assets acquired.
Income from BOLI decreased $16,000, or 3.3%, from the three months ended December 31, 2025 to $476,000 for the three months ended March 31, 2026. During the three months ended December 31, 2025, the Company reported $135,000 in income from loan-level swap fees on commercial loans and did not report comparable income during the three months ended March 31, 2026. During the three months ended March 31, 2026 and the three months ended December 31, 2025, the Company reported unrealized losses on marketable equity securities of $13,000 and $7,000, respectively.
3
Non-Interest Expense
For the three months ended March 31, 2026, non-interest expense increased $138,000, or 0.9%, to $16.0 million from the three months ended December 31, 2025. Occupancy expense increased $250,000, or 19.1%, primarily due to snow removal costs of $255,000 during the three months ended March 31, 2026, compared to $53,000 during the three months ended December 31, 2025. Professional fees increased $121,000, or 31.2%, advertising expense increased $93,000, or 26.6%, debit card processing and ATM network costs increased $64,000, or 10.7%, and software related expenses increased $2,000, or 0.3%. These increases were partially offset by a decrease in other non-interest expense of $160,000, or 11.2%, a decrease in salaries and employee benefits of $144,000, or 1.5%, a decrease in data processing of $78,000, or 8.7%, a decrease in FDIC insurance expense of $6,000, or 1.5%, and a decrease in furniture and equipment expense of $4,000, or 0.9%. For the three months ended March 31, 2026 and the three months ended December 31, 2025, the efficiency ratio was 71.9% and 72.1%, respectively. For the three months ended March 31, 2026, the adjusted efficiency ratio, a non-GAAP financial measure, was 73.4% compared to 72.1% for the three months ended December 31, 2025. See pages 16-17 for the related efficiency ratio and adjusted efficiency ratio calculations and a reconciliation of GAAP to non-GAAP financial measures.
Income Tax Provision
Income tax expense for the three months ended March 31, 2026 was $1.4 million, with an effective tax rate of 22.6%, compared to $1.4 million, with an effective tax rate of 21.3%, for the three months ended December 31, 2025.
Net Income for the Three Months Ended March 31, 2026 Compared to the Three Months Ended March 31, 2025
The Company reported an increase in net income of $2.5 million, or 107.4%, from $2.3 million, or $0.11 per diluted share, for the three months ended March 31, 2025, to $4.8 million, or $0.24 per diluted share, for the three months ended March 31, 2026. Net interest income increased $3.3 million, or 21.2%, provision for credit losses decreased $67,000, or 47.2%, non-interest income increased $674,000, or 24.4%, and non-interest expense increased $824,000, or 5.4%, during the same period. Return on average assets and return on average equity were 0.71% and 7.77%, respectively, for the three months ended March 31, 2026, compared to 0.35% and 3.94%, respectively, for the three months ended March 31, 2025.
Net Interest Income and Net Interest Margin
Net interest income increased $3.3 million, or 21.2%, to $18.8 million, for the three months ended March 31, 2026, from $15.5 million for the three months ended March 31, 2025. The increase in net interest income of $3.3 million was due to an increase in interest and dividend income of $1.8 million, or 6.5%, and a decrease in interest expense of $1.4 million, or 11.2%. The decrease in interest expense was primarily due to a decrease in the average cost of interest-bearing liabilities of 36 basis points, from 2.82% for the three months ended March 31, 2025 to 2.46% for the three months ended March 31, 2026. As a result, the net interest margin increased from 2.49% for the three months ended March 31, 2025, to 2.95% for the three months ended March 31, 2026. The net interest margin, on a tax-equivalent basis, increased 46 basis points from 2.51% for the three months ended March 31, 2025 to 2.97% for the three months ended March 31, 2026.
The average yield on interest-earning assets, without the impact of tax-equivalent adjustments, increased 18 basis points from 4.56% for the three months ended March 31, 2025 to 4.74% for the three months ended March 31, 2026. The average loan yield, without the impact of tax-equivalent adjustments, increased 19 basis points, from 4.90% for the three months ended March 31, 2025, to 5.09% for the three months ended March 31, 2026. During the three months ended March 31, 2026, average interest-earning assets increased $61.2 million, or 2.4%, to $2.6 billion, primarily due to an increase in average loans of $113.0 million, or 5.5%, partially offset by a decrease in average short-term investments, consisting of cash and cash equivalents, of $51.2 million, or 67.3%.
4
The average cost of total funds, including non-interest bearing accounts and borrowings, decreased 28 basis points from 2.16% for the three months ended March 31, 2025, to 1.88% for the three months ended March 31, 2026. The average cost of core deposits, which the Company defines as all deposits except time deposits, decreased six basis points from 1.08% for the three months ended March 31, 2025 to 1.02% for the three months ended March 31, 2026. The average cost of time deposits decreased 70 basis points from 4.11% for the three months ended March 31, 2025 to 3.41% for the three months ended March 31, 2026. The average cost of borrowings, including subordinated debt, decreased 29 basis points from 5.04% for the three months ended March 31, 2025 to 4.75% for the three months ended March 31, 2026. Average demand deposits, an interest-free source of funds, increased $18.9 million, or 3.3%, from $569.6 million, or 24.8% of total average deposits, for the three months ended March 31, 2025, to $588.5 million, or 25.1% of total average deposits, for the three months ended March 31, 2026.
Provision for Credit Losses
During the three months ended March 31, 2026, the Company recorded a decrease in the provision for credit losses of $67,000, or 47.2%, from $142,000 for the three months ended March 31, 2025 to $75,000. The decrease was primarily due to a decrease in unfunded commitments. The provision for credit losses was determined by a number of factors, including, the continued strong credit performance of the Company’s loan portfolio, changes in the loan portfolio mix and Management’s consideration of existing economic conditions. Management will continue to monitor macroeconomic variables related to the current interest rate environment, tariffs, global unrest resulting from conflicts, and the concerns of an economic downturn. Management believes it is appropriately reserved for the current economic environment and supportable forecast.
During the three months ended March 31, 2026, the Company recorded net charge-offs of $55,000, compared to net charge-offs of $29,000 for the three months ended March 31, 2025.
Non-Interest Income
Non-interest income increased $674,000, or 24.4%, from $2.8 million, for the three months ended March 31, 2025 to $3.4 million for the three months ended March 31, 2026. During the three months ended March 31, 2026, non-interest income included the recognition of $449,000 in BOLI death benefits. During the same period, service charges and fees on deposits increased $108,000, or 5.3%, and wealth management income increased $129,000, or 49.4%, from $261,000 for the three months ended March 31, 2025 to $390,000 for the three months ended March 31, 2026. Income from BOLI increased $3,000, or 0.6%, from $473,000 for the three months ended March 31, 2025 to $476,000 for the three months ended March 31, 2026.
During the three months ended March 31, 2026 and the three months ended March 31, 2025, the Company reported unrealized losses on marketable equity securities of $13,000 and $5,000, respectively. During the three months ended March 31, 2025, the Company reported a gain of $7,000 from mortgage banking activities and did not have a comparable gain or loss during the three months ended March 31, 2026.
Non-Interest Expense
Non-interest expense increased $824,000, or 5.4%, from $15.2 million for the three months ended March 31, 2025 to $16.0 million for the three months ended March 31, 2026. The increase in non-interest expense was primarily due to an increase of $816,000, or 9.7%, in salaries and benefits due to increases in health insurance benefits and annual merit increases. Occupancy expense increased $150,000, or 10.6%, due to $255,000 in snow removal costs during the three months ended March 31, 2026 compared to $143,000 for the three months ended March 31, 2025. Debit card processing and ATM network costs increased $86,000, or 14.9%, software related expenses increased $30,000, or 4.6%, and advertising expense increased $13,000, or 3.0%. These expenses were partially offset by a decrease in other non-interest expense of $80,000, or 5.9%, a decrease in data processing expense of $61,000, or 6.9%, a decrease in furniture and equipment expense of $54,000, or 11.1%, a decrease in FDIC insurance expense of $39,000, or 9.0%, and a decrease in professional fees of $37,000, or 6.8%.
For the three months ended March 31, 2026 and the three months ended March 31, 2025, the efficiency ratio was 71.9% and 83.0%, respectively. For the three months ended March 31, 2026, the adjusted efficiency ratio, a non-GAAP financial measure, was 73.4% compared to 83.0% for the three months ended March 31, 2025. The decreases in both the efficiency ratio and the adjusted efficiency ratio were driven by a $4.0 million, or 21.7%, increase in total revenues from the three months ended March 31, 2025 to the three months ended March 31, 2026, while expenses increased $824,000, or 5.4%, during the same period. See pages 16-17 for the efficiency ratio and adjusted efficiency ratio calculations and a reconciliation of GAAP to non-GAAP financial measures.
5
Income Tax Provision
For the three months ended March 31, 2026, income tax expense was $1.4 million, with an effective tax rate of 22.6%, compared to $664,000, with an effective tax rate of 22.4%, for the three months ended March 31, 2025.
Balance Sheet
At March 31, 2026, total assets of $2.8 billion increased $28.0 million, or 1.0%, from December 31, 2025. The increase in total assets was primarily due to an increase in total loans of $17.2 million, or 0.8%, and an increase in cash and cash equivalents of $15.8 million, or 39.0%.
Investments
At March 31, 2026, the investment securities portfolio totaled $359.2 million, or 13.0% of total assets, compared to $365.2 million, or 13.3% of total assets, at December 31, 2025. At March 31, 2026, the Company’s available-for-sale securities portfolio, recorded at fair market value, decreased $2.6 million, or 1.5%, from $175.8 million at December 31, 2025 to $173.2 million. The held-to-maturity securities portfolio, recorded at amortized cost, decreased $3.4 million, or 1.8%, from $188.8 million at December 31, 2025 to $185.4 million at March 31, 2026.
At March 31, 2026, the Company reported unrealized losses on the available-for-sale securities portfolio of $23.0 million, or 11.7% of the amortized cost basis of the available-for-sale securities portfolio, compared to unrealized losses of $22.4 million, or 11.3% of the amortized cost basis of the available-for-sale securities at December 31, 2025. At March 31, 2026, the Company reported unrealized losses on the held-to-maturity securities portfolio of $30.6 million, or 16.5% of the amortized cost basis of the held-to-maturity securities portfolio, compared to $30.3 million, or 16.1% of the amortized cost basis of the held-to-maturity securities portfolio at December 31, 2025.
The securities in which the Company may invest are limited by regulation. Federally chartered savings banks have authority to invest in various types of assets, including U.S. Treasury obligations, securities of various government-sponsored enterprises, mortgage-backed securities, certain certificates of deposit of insured financial institutions, repurchase agreements, overnight and short-term loans to other banks, corporate debt instruments and marketable equity securities. The securities, with the exception of $11.0 million in corporate bonds, are issued by the United States government or government-sponsored enterprises and are therefore either explicitly or implicitly guaranteed as to the timely payment of contractual principal and interest. These positions are deemed to have no credit impairment, therefore, the disclosed unrealized losses with the securities portfolio relate primarily to changes in prevailing interest rates. In all cases, price improvement in future periods will be realized as the issuances approach maturity.
Management regularly reviews the portfolio for securities in an unrealized loss position. At March 31, 2026 and December 31, 2025, the Company did not record any credit impairment charges on its securities portfolio and attributed the unrealized losses primarily due to fluctuations in general interest rates or changes in expected prepayments and not due to credit quality. The primary objective of the Company’s investment portfolio is to provide liquidity and to secure municipal deposit accounts while preserving the safety of principal. The available-for-sale and held-to-maturity portfolios are both eligible for pledging to the Federal Home Loan Bank (“FHLB”) and Federal Reserve Bank (“FRB”) as collateral for borrowings. The portfolios are comprised of high-credit quality investments and both portfolios generated cash flows monthly from interest, principal amortization and payoffs, which supports the Bank’s objective to provide liquidity.
Total Loans
Total loans increased $17.2 million, or 0.8%, from $2.2 billion, or 79.7% of total assets, at December 31, 2025 to $2.2 billion, or 79.5% of total assets, at March 31, 2026. The increase in total loans was primarily driven by an increase in residential real estate loans, including home equity loans, of $9.6 million, or 1.1%, an increase in commercial and industrial loans of $6.0 million, or 2.7%, and an increase in commercial real estate loans of $2.1 million, or 0.2%.
6
The following table presents a summary of the loan portfolio by the major classification of loans at the periods indicated:
| March 31, 2026 | December 31, 2025 | |||||||
| (Dollars in thousands) | ||||||||
| Commercial real estate loans: | ||||||||
| Non-owner occupied | $ | 918,219 | $ | 910,239 | ||||
| Owner occupied | 182,909 | 188,824 | ||||||
| Total commercial real estate loans | 1,101,128 | 1,099,063 | ||||||
| Residential real estate loans: | ||||||||
| Residential one-to-four family | 727,882 | 719,070 | ||||||
| Home equity | 138,565 | 137,801 | ||||||
| Total residential real estate loans | 866,447 | 856,871 | ||||||
| Commercial and industrial loans | 227,765 | 221,790 | ||||||
| Consumer loans | 2,550 | 2,929 | ||||||
| Total loans | 2,197,890 | 2,180,653 | ||||||
| Unamortized premiums and net deferred loan fees and costs | 3,066 | 2,939 | ||||||
| Total loans, including unamortized premiums and net deferred loan fees and costs | $ | 2,200,956 | $ | 2,183,592 | ||||
Credit Quality
Management continues to closely monitor the loan portfolio for any signs of deterioration in borrowers’ financial condition and also in light of speculation that commercial real estate values may deteriorate as the market continues to adjust to higher vacancies and interest rates. We continue to proactively take steps to mitigate risk in our loan portfolio.
Total delinquency was $3.2 million, or 0.14% of total loans, at March 31, 2026, compared to $3.1 million, or 0.14% of total loans at December 31, 2025. At March 31, 2026, nonaccrual loans totaled $4.7 million, or 0.21% of total loans, compared to $5.2 million, or 0.24% of total loans, at December 31, 2025. At March 31, 2026 and December 31, 2025, there were no loans 90 or more days past-due and still accruing interest. Total nonperforming assets, defined as nonaccrual loans and other real estate owned, totaled $4.7 million, or 0.17% of total assets, at March 31, 2026, compared to $5.2 million, or 0.19% of total assets, at December 31, 2025. At March 31, 2026 and December 31, 2025, the Company did not have any other real estate owned.
At March 31, 2026, the allowance for credit losses was $20.5 million, or 0.93% of total loans and 436.9% of nonaccrual loans, compared to $20.3 million, or 0.93% of total loans and 393.2% of nonaccrual loans, at December 31, 2025.
At March 31, 2026, total criticized loans, defined as special mention and substandard loans, totaled $58.7 million, or 2.7% of total loans, compared to $39.7 million, or 1.8% of total loans, at December 31, 2025. Loans designated special mention, which are not considered classified, increased $20.5 million, from $17.2 million, or 0.8% of total loans, at December 31, 2025 to $37.6 million, or 1.7% of total loans, at March 31, 2026. During the same period, substandard loans decreased $1.4 million, or 6.1%, to $21.1 million, or 1.0% of total loans.
7
Of the $37.6 million in loans designated special mention at March 31, 2026, $14.7 million, or 39.1%, are commercial and industrial loans, and $22.9 million, or 60.9%, are commercial real estate loans. Of the $21.1 million in loans categorized substandard at March 31, 2026, $7.3 million, or 34.4%, are commercial and industrial loans, $9.5 million, or 44.8%, are commercial real estate loans, and $4.4 million, or 20.8%, are residential real estate loans. Of the total $58.7 million in criticized loans at March 31, 2026, 96.1% are current and paying as agreed.
The increase in special mention loans from December 31, 2025 to March 31, 2026 resulted from the downgrade of two commercial relationships totaling $21.5 million, from “pass” risk ratings to special mention. The two relationships are paying as agreed and are being monitored closely by Management.
Our commercial real estate portfolio is comprised of diversified property types and primarily within our geographic footprint. At March 31, 2026, the commercial real estate portfolio totaled $1.1 billion and represented 50.1% of total loans. Of the $1.1 billion, $918.2 million, or 83.4%, was categorized as non-owner occupied commercial real estate and represented 329.8% of the Bank’s total risk-based capital. More details on the diversification of the loan portfolio are available in the supplementary earnings presentation.
Deposits
At March 31, 2026, total deposits were $2.4 billion and increased $20.9 million, or 0.9%, from December 31, 2025. Core deposits, which the Company defines as all deposits except time deposits, increased $1.0 million, or 0.1%, from $1.7 billion, or 70.8% of total deposits, at December 31, 2025, to $1.7 billion, or 70.2% of total deposits, at March 31, 2026. Non-interest-bearing deposits increased $3.2 million, or 0.5%, to $597.7 million, and represented 25.1% of total deposits, money market accounts increased $18.1 million, or 2.5%, to $733.7 million, and savings accounts increased $10.5 million, or 5.6%, to $197.1 million. These increases were partially offset by a decrease in interest-bearing checking accounts of $30.8 million, or 17.7%, to $143.5 million.
Time deposits increased $19.9 million, or 2.9%, from $689.9 million at December 31, 2025 to $709.8 million at March 31, 2026. The Company did not have brokered time deposits at March 31, 2026 and December 31, 2025. We continue our disciplined and focused approach to core relationship management and customer outreach to meet funding requirements and liquidity needs, with an emphasis on retaining a long-term core customer relationship base by competing for and retaining deposits in our local market. At March 31, 2026, the Bank’s uninsured deposits totaled $706.2 million, or 29.6% of total deposits, compared to $697.6 million, or 29.5% of total deposits, at December 31, 2025. At March 31, 2026, there was one deposit relationship, which is our largest deposit relationship, with a household concentration comprising 5.7% of total deposits, compared to 5.0% of total deposits at December 31, 2025. The next largest deposit relationship is to a local municipality with a concentration of 1.5% of total deposits at March 31, 2026 and 1.9% at December 31, 2025.
The table below is a summary of our deposit balances for the periods noted:
| At March 31, 2026 | At December 31, 2025 | |||||||||||||||
| Balance | % of Total Deposits | Balance | % of Total Deposits | |||||||||||||
| (Dollars in thousands) | ||||||||||||||||
| Demand and interest-bearing checking: | ||||||||||||||||
| Demand deposit accounts | $ | 597,738 | 25.1 | % | $ | 594,516 | 25.2 | % | ||||||||
| Interest-bearing checking accounts | 143,459 | 6.0 | % | 174,227 | 7.4 | % | ||||||||||
| Savings: | ||||||||||||||||
| Regular savings accounts | 197,100 | 8.3 | % | 186,597 | 7.9 | % | ||||||||||
| Money market accounts | 733,696 | 30.8 | % | 715,620 | 30.3 | % | ||||||||||
| Total core deposits | 1,671,993 | 70.2 | % | 1,670,960 | 70.8 | % | ||||||||||
| Time deposits | 709,799 | 29.8 | % | 689,948 | 29.2 | % | ||||||||||
| Total deposits | $ | 2,381,792 | 100.0 | % | $ | 2,360,908 | 100.0 | % | ||||||||
8
FHLB and Subordinated Debt
At March 31, 2026, total borrowings increased $10.5 million, or 9.9%, from $106.1 million at December 31, 2025 to $116.6 million. At March 31, 2026, short-term borrowings increased $10.5 million, or 79.4%, to $23.8 million, compared to $13.3 million at December 31, 2025. At March 31, 2026 and December 31, 2025, long-term borrowings totaled $73.0 million. At March 31, 2026 and December 31, 2025, borrowings also consisted of $19.8 million in fixed-to-floating rate subordinated notes.
As of March 31, 2026, the Company had $485.1 million of additional borrowing capacity at the FHLB, $337.3 million of additional borrowing capacity under the FRB Discount Window and $25.0 million of other unsecured lines of credit with correspondent banks.
Capital
At March 31, 2026, shareholders’ equity was $248.1 million, or 9.0% of total assets, compared to $247.6 million, or 9.1% of total assets, at December 31, 2025. The change was primarily attributable to net income of $4.8 million, partially offset by an increase in accumulated other comprehensive loss of $458,000, cash dividends paid of $1.4 million and the repurchase of 186,000 shares at a cost of $2.5 million. At March 31, 2026, total shares outstanding were 20,240,872. The Company’s regulatory capital ratios continue to be strong and in excess of regulatory minimum requirements to be considered well-capitalized as defined by regulators and internal Company targets.
| March 31, 2026 | December 31, 2025 | |||||||||||||||
| Company | Bank | Company | Bank | |||||||||||||
| Total Capital (to Risk Weighted Assets) | 14.14 | % | 13.46 | % | 14.19 | % | 13.48 | % | ||||||||
| Tier 1 Capital (to Risk Weighted Assets) | 12.17 | % | 12.44 | % | 12.21 | % | 12.46 | % | ||||||||
| Common Equity Tier 1 Capital (to Risk Weighted Assets) | 12.17 | % | 12.44 | % | 12.21 | % | 12.46 | % | ||||||||
| Tier 1 Leverage Ratio (to Adjusted Average Assets) | 9.16 | % | 9.36 | % | 9.13 | % | 9.32 | % | ||||||||
Dividends
Although the Company has historically paid quarterly dividends on its common stock and currently intends to continue to pay such dividends, the Company’s ability to pay such dividends depends on a number of factors, including restrictions under federal laws and regulations on the Company’s ability to pay dividends, and as a result, there can be no assurance that dividends will continue to be paid in the future.
About Western New England Bancorp, Inc.
Western New England Bancorp, Inc. is a Massachusetts-chartered stock holding company and the parent company of Westfield Bank, CSB Colts, Inc., Elm Street Securities Corporation, WFD Securities, Inc. and WB Real Estate Holdings, LLC. Western New England Bancorp, Inc. and its subsidiaries are headquartered in Westfield, Massachusetts and operate 25 banking offices throughout western Massachusetts and the Capital Region in Connecticut. To learn more, visit our website at www.westfieldbank.com.
Forward-Looking Statements
This press release contains “forward-looking statements” within the meaning of Section 27A of the Securities Act of 1933, as amended, and Section 21E of the Securities Exchange Act of 1934, as amended, with respect to the Company’s financial condition, liquidity, results of operations, future performance, and business. Forward-looking statements may be identified by the use of such words as “believe,” “expect,” “anticipate,” “should,” “planned,” “estimated,” and “potential.” Examples of forward-looking statements include, but are not limited to, estimates with respect to our financial condition, results of operations and business that are subject to various factors which could cause actual results to differ materially from these estimates. These factors include, but are not limited to:
9
| ● | unpredictable changes in general economic or political conditions, financial markets, fiscal, monetary and regulatory policies, including actual or potential stress in the banking industry; |
| ● | the possibility that future credit losses, loan defaults and charge-off rates are higher than expected due to changes in economic assumptions or adverse economic developments; |
| ● | general business and economic conditions on a national basis and in the local markets in which we operate, including those impacting credit quality; |
| ● | unstable political and economic conditions, including changes in tariff policies, which could materially impact credit quality trends and the ability to generate loans and gather deposits; |
| ● | inflation and governmental responses to inflation, including potential future increases in interest rates that reduce net interest margins; |
| ● | the effect on our operations of governmental legislation and regulation, including changes in accounting regulation or standards, the nature and timing of the adoption and effectiveness of new requirements under the Dodd-Frank Wall Street Reform and Consumer Protection Act of 2010, Basel guidelines, capital requirements and other applicable laws and regulations; |
| ● | changes in regulation, regulatory policy, legislation, accounting standards and practices, and fiscal monetary policy, particularly in light of the shift in presidential administrations and the potential for related shifts in agency policy and leadership; |
| ● | operational risks or risk management failures by us or critical third parties, including without limitation with respect to data processing, information systems, cybersecurity incidents, technological integration, including AI, vendor issues, business interruption, and fraud risks; |
| ● | significant changes in accounting, tax or regulatory practices or requirements; |
| ● | new legal obligations or liabilities or unfavorable resolutions or litigation; |
| ● | disruptive technologies in payment systems and other services traditionally provided by financial institutions; |
| ● | severe weather, natural disasters, acts of war or terrorism and other external events which could significantly impact our business; |
| ● | declines in real estate values in the Company’s market area, which may adversely affect our loan production; |
| ● | decreases in the value of securities and other assets, or changes in the securities markets which affect investment management revenue; |
| ● | decreases in deposit levels necessitating increased borrowing to fund loans, investments and other needs; |
| ● | competitive pressures from other financial institutions; |
| ● | the soundness of other financial services institutions which may adversely affect our credit risk; |
| ● | failure or circumvention of our internal controls or procedures; |
| ● | the risk that goodwill and intangibles recorded in our financial statements will become impaired; |
| ● | the risk that we may not be successful in the implementation of our business strategy; |
| ● | increases in Federal Deposit Insurance Corporation deposit insurance premiums and assessments; |
| ● | introduction of new lines of business or new products and services, which may subject us to additional risks; |
| ● | changes in key management personnel which may adversely impact our operations; and |
| ● | other risks and uncertainties detailed in Part 1A “Risk Factors” of the Company’s 2025 Annual Report on Form 10-K. |
Although we believe that the expectations reflected in such forward-looking statements are reasonable, actual results may differ materially from the results discussed in these forward-looking statements. You are cautioned not to place undue reliance on these forward-looking statements, which speak only as of the date hereof. We do not undertake any obligation to republish revised forward-looking statements to reflect events or circumstances after the date hereof or to reflect the occurrence of unanticipated events, except to the extent required by law.
10
WESTERN NEW ENGLAND BANCORP, INC. AND SUBSIDIARIES
Consolidated Statements of Net Income and Other Data
(Dollars in thousands, except per share data)
(Unaudited)
| Three Months Ended | ||||||||||||||||||||
| March 31, | December 31, | September 30, | June 30, | March 31, | ||||||||||||||||
| 2026 | 2025 | 2025 | 2025 | 2025 | ||||||||||||||||
| INTEREST AND DIVIDEND INCOME: | ||||||||||||||||||||
| Loans | $ | 27,440 | $ | 27,491 | $ | 26,690 | $ | 26,214 | $ | 24,984 | ||||||||||
| Securities | 2,505 | 2,588 | 2,617 | 2,588 | 2,422 | |||||||||||||||
| Other investments | 147 | 164 | 166 | 169 | 191 | |||||||||||||||
| Short-term investments | 189 | 294 | 560 | 641 | 840 | |||||||||||||||
| Total interest and dividend income | 30,281 | 30,537 | 30,033 | 29,612 | 28,437 | |||||||||||||||
| INTEREST EXPENSE: | ||||||||||||||||||||
| Deposits | 9,978 | 10,296 | 10,403 | 10,437 | 11,376 | |||||||||||||||
| Short-term borrowings | 322 | 85 | 39 | 47 | 54 | |||||||||||||||
| Long-term debt | 902 | 1,073 | 1,245 | 1,232 | 1,219 | |||||||||||||||
| Subordinated debt | 254 | 254 | 254 | 254 | 254 | |||||||||||||||
| Total interest expense | 11,456 | 11,708 | 11,941 | 11,970 | 12,903 | |||||||||||||||
| Net interest and dividend income | 18,825 | 18,829 | 18,092 | 17,642 | 15,534 | |||||||||||||||
| PROVISION FOR (REVERSAL OF) CREDIT LOSSES | 75 | (485 | ) | 1,293 | (615 | ) | 142 | |||||||||||||
| Net interest and dividend income after provision for (reversal of) credit losses | 18,750 | 19,314 | 16,799 | 18,257 | 15,392 | |||||||||||||||
| NON-INTEREST INCOME: | ||||||||||||||||||||
| Service charges and fees on deposits | 2,131 | 2,234 | 2,199 | 2,235 | 2,023 | |||||||||||||||
| Wealth management income | 390 | 319 | 353 | 293 | 261 | |||||||||||||||
| Income from bank-owned life insurance | 476 | 492 | 482 | 516 | 473 | |||||||||||||||
| Gain on bank-owned life insurance death benefits | 449 | — | — | — | — | |||||||||||||||
| Unrealized (loss) gain on marketable equity securities | (13 | ) | (7 | ) | 22 | 25 | (5 | ) | ||||||||||||
| Gain on mortgage banking activity | — | — | — | 4 | 7 | |||||||||||||||
| Gain on non-marketable equity investments | — | — | — | 243 | — | |||||||||||||||
| Other income | — | 135 | 117 | 95 | — | |||||||||||||||
| Total non-interest income | 3,433 | 3,173 | 3,173 | 3,411 | 2,759 | |||||||||||||||
| NON-INTEREST EXPENSE: | ||||||||||||||||||||
| Salaries and employees’ benefits | 9,229 | 9,373 | 9,209 | 8,831 | 8,413 | |||||||||||||||
| Occupancy | 1,562 | 1,312 | 1,237 | 1,265 | 1,412 | |||||||||||||||
| Furniture and equipment | 433 | 437 | 453 | 491 | 487 | |||||||||||||||
| Data processing | 821 | 899 | 916 | 933 | 882 | |||||||||||||||
| Software | 689 | 687 | 652 | 645 | 659 | |||||||||||||||
| Debit/ATM card processing expense | 663 | 599 | 633 | 674 | 577 | |||||||||||||||
| Professional fees | 509 | 388 | 460 | 623 | 546 | |||||||||||||||
| FDIC insurance | 392 | 398 | 376 | 399 | 431 | |||||||||||||||
| Advertising | 442 | 349 | 433 | 443 | 429 | |||||||||||||||
| Other | 1,268 | 1,428 | 1,409 | 1,352 | 1,348 | |||||||||||||||
| Total non-interest expense | 16,008 | 15,870 | 15,778 | 15,656 | 15,184 | |||||||||||||||
| INCOME BEFORE INCOME TAXES | 6,175 | 6,617 | 4,194 | 6,012 | 2,967 | |||||||||||||||
| INCOME TAX PROVISION | 1,398 | 1,408 | 1,027 | 1,422 | 664 | |||||||||||||||
| NET INCOME | $ | 4,777 | $ | 5,209 | $ | 3,167 | $ | 4,590 | $ | 2,303 | ||||||||||
| Basic earnings per share | $ | 0.24 | $ | 0.26 | $ | 0.16 | $ | 0.23 | $ | 0.11 | ||||||||||
| Weighted average shares outstanding | 19,996,682 | 20,060,358 | 20,110,492 | 20,210,650 | 20,385,481 | |||||||||||||||
| Diluted earnings per share | $ | 0.24 | $ | 0.26 | $ | 0.16 | $ | 0.23 | $ | 0.11 | ||||||||||
| Weighted average diluted shares outstanding | 20,065,067 | 20,206,539 | 20,240,975 | 20,312,881 | 20,514,098 | |||||||||||||||
| Other Data: | ||||||||||||||||||||
| Return on average assets (1) | 0.71 | % | 0.75 | % | 0.46 | % | 0.69 | % | 0.35 | % | ||||||||||
| Return on average equity (1) | 7.77 | % | 8.40 | % | 5.20 | % | 7.76 | % | 3.94 | % | ||||||||||
| Efficiency ratio | 71.92 | % | 72.13 | % | 74.20 | % | 74.36 | % | 83.00 | % | ||||||||||
| Adjusted efficiency ratio (2) | 73.36 | % | 72.11 | % | 74.27 | % | 75.32 | % | 82.98 | % | ||||||||||
| Net interest margin (1) | 2.95 | % | 2.89 | % | 2.81 | % | 2.80 | % | 2.49 | % | ||||||||||
| Net interest margin, on a fully tax-equivalent basis (1) | 2.97 | % | 2.91 | % | 2.83 | % | 2.82 | % | 2.51 | % | ||||||||||
| (1) | Annualized. |
| (2) | The adjusted efficiency ratio (non-GAAP) represents the ratio of operating expenses divided by the sum of net interest and dividend income and non-interest income, excluding realized and unrealized gains and losses on securities, gain on non-marketable equity investments, and gain on bank-owned life insurance death benefits. |
11
WESTERN NEW ENGLAND BANCORP, INC. AND SUBSIDIARIES
Consolidated Balance Sheets
(Dollars in thousands)
(Unaudited)
| March 31, | December 31, | September 30, | June 30, | March 31, | ||||||||||||||||
| 2026 | 2025 | 2025 | 2025 | 2025 | ||||||||||||||||
| Cash and cash equivalents | $ | 56,137 | $ | 40,381 | $ | 82,942 | $ | 93,308 | $ | 110,579 | ||||||||||
| Securities available-for-sale, at fair value | 173,215 | 175,800 | 179,234 | 178,785 | 167,800 | |||||||||||||||
| Securities held to maturity, at amortized cost | 185,392 | 188,800 | 193,446 | 197,671 | 201,557 | |||||||||||||||
| Marketable equity securities, at fair value | 610 | 632 | 471 | 444 | 414 | |||||||||||||||
| Federal Home Loan Bank of Boston and other restricted stock - at cost | 5,736 | 5,359 | 5,818 | 5,818 | 5,818 | |||||||||||||||
| Loans | 2,200,956 | 2,183,592 | 2,131,308 | 2,092,631 | 2,079,561 | |||||||||||||||
| Allowance for credit losses | (20,451 | ) | (20,297 | ) | (20,542 | ) | (19,733 | ) | (19,669 | ) | ||||||||||
| Net loans | 2,180,505 | 2,163,295 | 2,110,766 | 2,072,898 | 2,059,892 | |||||||||||||||
| Bank-owned life insurance | 77,679 | 79,019 | 78,527 | 78,045 | 77,529 | |||||||||||||||
| Goodwill | 12,487 | 12,487 | 12,487 | 12,487 | 12,487 | |||||||||||||||
| Core deposit intangible | 969 | 1,063 | 1,156 | 1,250 | 1,344 | |||||||||||||||
| Other assets | 71,807 | 69,644 | 70,683 | 70,443 | 71,864 | |||||||||||||||
| TOTAL ASSETS | $ | 2,764,537 | $ | 2,736,480 | $ | 2,735,530 | $ | 2,711,149 | $ | 2,709,284 | ||||||||||
| Total deposits | $ | 2,381,792 | $ | 2,360,908 | $ | 2,349,875 | $ | 2,330,113 | $ | 2,328,593 | ||||||||||
| Short-term borrowings | 23,810 | 13,270 | 2,980 | 4,040 | 4,520 | |||||||||||||||
| Long-term debt | 73,000 | 73,000 | 98,000 | 98,000 | 98,000 | |||||||||||||||
| Subordinated debt | 19,800 | 19,790 | 19,781 | 19,771 | 19,761 | |||||||||||||||
| Securities pending settlement | — | 242 | — | — | 2,093 | |||||||||||||||
| Other liabilities | 18,039 | 21,633 | 21,254 | 19,797 | 18,641 | |||||||||||||||
| TOTAL LIABILITIES | 2,516,441 | 2,488,843 | 2,491,890 | 2,471,721 | 2,471,608 | |||||||||||||||
| TOTAL SHAREHOLDERS’ EQUITY | 248,096 | 247,637 | 243,640 | 239,428 | 237,676 | |||||||||||||||
| TOTAL LIABILITIES AND SHAREHOLDERS’ EQUITY | $ | 2,764,537 | $ | 2,736,480 | $ | 2,735,530 | $ | 2,711,149 | $ | 2,709,284 | ||||||||||
12
WESTERN NEW ENGLAND BANCORP, INC. AND SUBSIDIARIES
Other Data
(Dollars in thousands, except per share data)
(Unaudited)
| Three Months Ended | ||||||||||||||||||||
| March 31, | December 31, | September 30, | June 30, | March 31, | ||||||||||||||||
| 2026 | 2025 | 2025 | 2025 | 2025 | ||||||||||||||||
| Shares outstanding at end of period | 20,240,872 | 20,372,786 | 20,491,966 | 20,494,501 | 20,774,319 | |||||||||||||||
| Operating results: | ||||||||||||||||||||
| Net interest income | $ | 18,825 | $ | 18,829 | $ | 18,092 | $ | 17,642 | $ | 15,534 | ||||||||||
| Provision for (reversal of) credit losses | 75 | (485 | ) | 1,293 | (615 | ) | 142 | |||||||||||||
| Non-interest income | 3,433 | 3,173 | 3,173 | 3,411 | 2,759 | |||||||||||||||
| Non-interest expense | 16,008 | 15,870 | 15,778 | 15,656 | 15,184 | |||||||||||||||
| Income before income provision for income taxes | 6,175 | 6,617 | 4,194 | 6,012 | 2,967 | |||||||||||||||
| Income tax provision | 1,398 | 1,408 | 1,027 | 1,422 | 664 | |||||||||||||||
| Net income | 4,777 | 5,209 | 3,167 | 4,590 | 2,303 | |||||||||||||||
| Performance Ratios: | ||||||||||||||||||||
| Net interest margin | 2.95 | % | 2.89 | % | 2.81 | % | 2.80 | % | 2.49 | % | ||||||||||
| Net interest margin, on a fully tax-equivalent basis | 2.97 | % | 2.91 | % | 2.83 | % | 2.82 | % | 2.51 | % | ||||||||||
| Interest rate spread | 2.28 | % | 2.21 | % | 2.13 | % | 2.10 | % | 1.74 | % | ||||||||||
| Interest rate spread, on a fully tax-equivalent basis | 2.30 | % | 2.23 | % | 2.14 | % | 2.12 | % | 1.76 | % | ||||||||||
| Return on average assets | 0.71 | % | 0.75 | % | 0.46 | % | 0.69 | % | 0.35 | % | ||||||||||
| Return on average equity | 7.77 | % | 8.40 | % | 5.20 | % | 7.76 | % | 3.94 | % | ||||||||||
| Efficiency ratio (GAAP) | 71.92 | % | 72.13 | % | 74.20 | % | 74.36 | % | 83.00 | % | ||||||||||
| Adjusted efficiency ratio (non-GAAP) (1) | 73.36 | % | 72.11 | % | 74.27 | % | 75.32 | % | 82.98 | % | ||||||||||
| Per Common Share Data: | ||||||||||||||||||||
| Basic earnings per share | $ | 0.24 | $ | 0.26 | $ | 0.16 | $ | 0.23 | $ | 0.11 | ||||||||||
| Earnings per diluted share | 0.24 | 0.26 | 0.16 | 0.23 | 0.11 | |||||||||||||||
| Cash dividend declared | 0.07 | 0.07 | 0.07 | 0.07 | 0.07 | |||||||||||||||
| Book value per share | 12.26 | 12.16 | 11.89 | 11.68 | 11.44 | |||||||||||||||
| Tangible book value per share (non-GAAP) (2) | 11.59 | 11.49 | 11.22 | 11.01 | 10.78 | |||||||||||||||
| Asset Quality: | ||||||||||||||||||||
| 30-89 day delinquent loans | $ | 2,317 | $ | 2,098 | $ | 3,123 | $ | 2,525 | $ | 2,459 | ||||||||||
| 90 days or more delinquent loans | 840 | 1,047 | 1,425 | 1,328 | 2,027 | |||||||||||||||
| Total delinquent loans | 3,157 | 3,145 | 4,548 | 3,853 | 4,486 | |||||||||||||||
| Total delinquent loans as a percentage of total loans | 0.14 | % | 0.14 | % | 0.21 | % | 0.18 | % | 0.22 | % | ||||||||||
| Nonaccrual loans | $ | 4,681 | $ | 5,162 | $ | 5,649 | $ | 5,752 | $ | 6,014 | ||||||||||
| Nonaccrual loans as a percentage of total loans | 0.21 | % | 0.24 | % | 0.27 | % | 0.27 | % | 0.29 | % | ||||||||||
| Nonaccrual assets as a percentage of total assets | 0.17 | % | 0.19 | % | 0.21 | % | 0.21 | % | 0.22 | % | ||||||||||
| Allowance for credit losses as a percentage of nonaccrual loans | 436.89 | % | 393.20 | % | 363.64 | % | 343.06 | % | 327.05 | % | ||||||||||
| Allowance for credit losses as a percentage of total loans | 0.93 | % | 0.93 | % | 0.96 | % | 0.94 | % | 0.95 | % | ||||||||||
| Net loan charge-offs (recoveries) | $ | 55 | $ | 41 | $ | 43 | $ | (585 | ) | $ | 29 | |||||||||
| Net loan charge-offs (recoveries) as a percentage of average loans | 0.00 | % | 0.00 | % | 0.00 | % | (0.03 | )% | 0.00 | % | ||||||||||
| (1) | The adjusted efficiency ratio (non-GAAP) represents the ratio of operating expenses divided by the sum of net interest and dividend income and non-interest income, excluding realized and unrealized gains and losses on securities, gains on non-marketable equity investments, and gain on bank-owned life insurance death benefits. |
| (2) | Tangible book value per share (non-GAAP) represents the value of the Company’s tangible assets divided by its current outstanding shares. |
13
The following table sets forth the information relating to our average balances and net interest income for the three months ended March 31, 2026, December 31, 2025 and March 31, 2025 and reflects the average yield on interest-earning assets and average cost of interest-bearing liabilities for the periods indicated.
| Three Months Ended | ||||||||||||||||||||||||||||||||||||
| March 31, 2026 | December 31, 2025 | March 31, 2025 | ||||||||||||||||||||||||||||||||||
| Average | Average Yield/ | Average | Average Yield/ | Average | Average Yield/ | |||||||||||||||||||||||||||||||
| Balance | Interest | Cost(8) | Balance | Interest | Cost(8) | Balance | Interest | Cost(8) | ||||||||||||||||||||||||||||
| (Dollars in thousands) | ||||||||||||||||||||||||||||||||||||
| ASSETS: | ||||||||||||||||||||||||||||||||||||
| Interest-earning assets | ||||||||||||||||||||||||||||||||||||
| Loans(1)(2) | $ | 2,186,529 | $ | 27,559 | 5.11 | % | $ | 2,166,804 | $ | 27,616 | 5.06 | % | $ | 2,073,486 | $ | 25,105 | 4.91 | % | ||||||||||||||||||
| Securities(2) | 363,983 | 2,505 | 2.79 | 370,210 | 2,588 | 2.77 | 365,371 | 2,422 | 2.69 | |||||||||||||||||||||||||||
| Other investments | 15,585 | 147 | 3.83 | 14,752 | 164 | 4.41 | 14,819 | 191 | 5.23 | |||||||||||||||||||||||||||
| Short-term investments(3) | 24,831 | 189 | 3.09 | 32,544 | 294 | 3.58 | 76,039 | 840 | 4.48 | |||||||||||||||||||||||||||
| Total interest-earning assets | 2,590,928 | 30,400 | 4.76 | 2,584,310 | 30,662 | 4.71 | 2,529,715 | 28,558 | 4.58 | |||||||||||||||||||||||||||
| Total non-interest-earning assets | 153,783 | 156,258 | 156,733 | |||||||||||||||||||||||||||||||||
| Total assets | $ | 2,744,711 | $ | 2,740,568 | $ | 2,686,448 | ||||||||||||||||||||||||||||||
| LIABILITIES AND EQUITY: | ||||||||||||||||||||||||||||||||||||
| Interest-bearing liabilities | ||||||||||||||||||||||||||||||||||||
| Interest-bearing checking accounts | $ | 148,869 | 300 | 0.82 | $ | 163,174 | 371 | 0.90 | $ | 140,960 | 250 | 0.72 | ||||||||||||||||||||||||
| Savings accounts | 190,080 | 43 | 0.09 | 187,428 | 43 | 0.09 | 183,869 | 40 | 0.09 | |||||||||||||||||||||||||||
| Money market accounts | 728,590 | 3,822 | 2.13 | 723,501 | 3,889 | 2.13 | 704,215 | 3,968 | 2.29 | |||||||||||||||||||||||||||
| Time deposit accounts | 691,612 | 5,813 | 3.41 | 686,966 | 5,993 | 3.46 | 702,748 | 7,118 | 4.11 | |||||||||||||||||||||||||||
| Total interest-bearing deposits | 1,759,151 | 9,978 | 2.30 | 1,761,069 | 10,296 | 2.32 | 1,731,792 | 11,376 | 2.66 | |||||||||||||||||||||||||||
| Short-term borrowings and long-term debt | 126,193 | 1,478 | 4.75 | 112,904 | 1,412 | 4.96 | 122,786 | 1,527 | 5.04 | |||||||||||||||||||||||||||
| Interest-bearing liabilities | 1,885,344 | 11,456 | 2.46 | 1,873,973 | 11,708 | 2.48 | 1,854,578 | 12,903 | 2.82 | |||||||||||||||||||||||||||
| Non-interest-bearing deposits | 588,503 | 596,462 | 569,638 | |||||||||||||||||||||||||||||||||
| Other non-interest-bearing liabilities | 21,413 | 24,231 | 25,464 | |||||||||||||||||||||||||||||||||
| Total non-interest-bearing liabilities | 609,916 | 620,693 | 595,102 | |||||||||||||||||||||||||||||||||
| Total liabilities | 2,495,260 | 2,494,666 | 2,449,680 | |||||||||||||||||||||||||||||||||
| Total equity | 249,451 | 245,902 | 236,768 | |||||||||||||||||||||||||||||||||
| Total liabilities and equity | $ | 2,744,711 | $ | 2,740,568 | $ | 2,686,448 | ||||||||||||||||||||||||||||||
| Less: Tax-equivalent adjustment(2) | (119 | ) | (125 | ) | (121 | ) | ||||||||||||||||||||||||||||||
| Net interest and dividend income | $ | 18,825 | $ | 18,829 | $ | 15,534 | ||||||||||||||||||||||||||||||
| Net interest rate spread(4) | 2.28 | % | 2.21 | % | 1.74 | % | ||||||||||||||||||||||||||||||
| Net interest rate spread, on a tax-equivalent basis(5) | 2.30 | % | 2.23 | % | 1.76 | % | ||||||||||||||||||||||||||||||
| Net interest margin(6) | 2.95 | % | 2.89 | % | 2.49 | % | ||||||||||||||||||||||||||||||
| Net interest margin, on a tax-equivalent basis(7) | 2.97 | % | 2.91 | % | 2.51 | % | ||||||||||||||||||||||||||||||
| Ratio of average interest-earning | ||||||||||||||||||||||||||||||||||||
| assets to average interest-bearing liabilities | 137.42 | % | 137.91 | % | 136.40 | % | ||||||||||||||||||||||||||||||
14
| (1) | Loans, including nonaccrual loans, are net of deferred loan origination costs and unadvanced funds. |
| (2) | Loan and securities income are presented on a tax-equivalent basis using a tax rate of 21%. The tax-equivalent adjustment is deducted from tax-equivalent net interest and dividend income to agree to the amount reported on the consolidated statements of net income. |
| (3) | Short-term investments include federal funds sold. |
| (4) | Net interest rate spread represents the difference between the weighted average yield on interest-earning assets and the weighted average cost of interest-bearing liabilities. |
| (5) | Net interest rate spread, on a tax-equivalent basis, represents the difference between the tax-equivalent weighted average yield on interest-earning assets and the tax-equivalent weighted average cost of interest-bearing liabilities. |
| (6) | Net interest margin represents net interest and dividend income as a percentage of average interest-earning assets. |
| (7) | Net interest margin, on a tax-equivalent basis, represents tax-equivalent net interest and dividend income as a percentage of average interest-earning assets. |
| (8) | Annualized. |
15
Reconciliation of Non-GAAP to GAAP Financial Measures
The Company believes that certain non-GAAP financial measures provide information to investors that is useful in understanding its results of operations and financial condition. Because not all companies use the same calculation, this presentation may not be comparable to other similarly titled measures calculated by other companies. A reconciliation of these non-GAAP financial measures is provided below.
| For the quarter ended | ||||||||||||||||||||
| 3/31/2026 | 12/31/2025 | 9/30/2025 | 6/30/2025 | 3/31/2025 | ||||||||||||||||
| (Dollars in thousands) | ||||||||||||||||||||
| Loan interest (no tax adjustment) | $ | 27,440 | $ | 27,491 | $ | 26,690 | $ | 26,214 | $ | 24,984 | ||||||||||
| Tax-equivalent adjustment | 119 | 125 | 120 | 121 | 121 | |||||||||||||||
| Loan interest (tax-equivalent basis) | $ | 27,559 | $ | 27,616 | $ | 26,810 | $ | 26,335 | $ | 25,105 | ||||||||||
| Loan interest (tax-equivalent basis) | $ | 27,559 | $ | 27,616 | $ | 26,810 | $ | 26,335 | $ | 25,105 | ||||||||||
| Less: | ||||||||||||||||||||
| Prepayment penalties and fees | — | — | 34 | 425 | — | |||||||||||||||
| Adjusted loan income, excluding prepayment penalties (tax-equivalent basis) (non-GAAP) | $ | 27,559 | $ | 27,616 | $ | 26,776 | $ | 25,910 | $ | 25,105 | ||||||||||
| Average loans | $ | 2,186,529 | $ | 2,166,804 | $ | 2,112,394 | $ | 2,081,319 | $ | 2,073,486 | ||||||||||
| Average loan yield (no tax adjustment) | 5.09 | % | 5.03 | % | 5.01 | % | 5.05 | % | 4.89 | % | ||||||||||
| Average loan yield (no tax adjustment), excluding prepayment penalties (non-GAAP) | 5.09 | % | 5.03 | % | 5.01 | % | 4.97 | % | 4.89 | % | ||||||||||
| Average loan yield (tax-equivalent) | 5.11 | % | 5.06 | % | 5.04 | % | 5.08 | % | 4.91 | % | ||||||||||
| Average loan yield (tax-equivalent basis), excluding prepayment penalties (non-GAAP) | 5.11 | % | 5.06 | % | 5.03 | % | 4.99 | % | 4.91 | % | ||||||||||
| Net interest income (no tax adjustment) | $ | 18,825 | $ | 18,829 | $ | 18,092 | $ | 17,642 | $ | 15,534 | ||||||||||
| Tax equivalent adjustment | 119 | 125 | 120 | 121 | 121 | |||||||||||||||
| Net interest income (tax-equivalent basis) | $ | 18,944 | $ | 18,954 | $ | 18,212 | $ | 17,763 | $ | 15,655 | ||||||||||
| Net interest income (no tax adjustment) | $ | 18,825 | $ | 18,829 | $ | 18,092 | $ | 17,642 | $ | 15,534 | ||||||||||
| Less: | ||||||||||||||||||||
| Prepayment penalties | — | — | 34 | 425 | — | |||||||||||||||
| Adjusted net interest income (non-GAAP) | $ | 18,825 | $ | 18,829 | $ | 18,058 | $ | 17,217 | $ | 15,534 | ||||||||||
| Average interest-earning assets | $ | 2,590,928 | $ | 2,584,310 | $ | 2,553,849 | $ | 2,530,077 | $ | 2,529,715 | ||||||||||
| Net interest margin (no tax adjustment) | 2.95 | % | 2.89 | % | 2.81 | % | 2.80 | % | 2.49 | % | ||||||||||
| Net interest margin (tax-equivalent basis) | 2.97 | % | 2.91 | % | 2.83 | % | 2.82 | % | 2.51 | % | ||||||||||
| Adjusted net interest margin, excluding prepayment penalties (no tax adjustment) (non-GAAP) | 2.95 | % | 2.89 | % | 2.81 | % | 2.73 | % | 2.49 | % | ||||||||||
16
| At or for the quarter ended | ||||||||||||||||||||
| 3/31/2026 | 12/31/2025 | 9/30/2025 | 6/30/2025 | 3/31/2025 | ||||||||||||||||
| (Dollars in thousands, except per share data) | ||||||||||||||||||||
| Book Value per Share (GAAP) | $ | 12.26 | $ | 12.16 | $ | 11.89 | $ | 11.68 | $ | 11.44 | ||||||||||
| Non-GAAP adjustments: | ||||||||||||||||||||
| Goodwill | (0.62 | ) | (0.61 | ) | (0.61 | ) | (0.61 | ) | (0.60 | ) | ||||||||||
| Core deposit intangible | (0.05 | ) | (0.06 | ) | (0.06 | ) | (0.06 | ) | (0.06 | ) | ||||||||||
| Tangible Book Value per Share (non-GAAP) | $ | 11.59 | $ | 11.49 | $ | 11.22 | $ | 11.01 | $ | 10.78 | ||||||||||
| Efficiency Ratio: | ||||||||||||||||||||
| Non-interest Expense (GAAP) | $ | 16,008 | $ | 15,870 | $ | 15,778 | $ | 15,656 | $ | 15,184 | ||||||||||
| Net Interest Income (GAAP) | $ | 18,825 | $ | 18,829 | $ | 18,092 | $ | 17,642 | $ | 15,534 | ||||||||||
| Non-interest Income (GAAP) | $ | 3,433 | $ | 3,173 | $ | 3,173 | $ | 3,411 | $ | 2,759 | ||||||||||
| Non-GAAP adjustments: | ||||||||||||||||||||
| Unrealized losses (gains) on marketable equity securities | 13 | 7 | (22 | ) | (25 | ) | 5 | |||||||||||||
| Gain on non-marketable equity investments | — | — | — | (243 | ) | — | ||||||||||||||
| Gain on bank-owned life insurance death benefits | (449 | ) | — | — | — | — | ||||||||||||||
| Non-interest Income for Adjusted Efficiency Ratio (non-GAAP) | $ | 2,997 | $ | 3,180 | $ | 3,151 | $ | 3,143 | $ | 2,764 | ||||||||||
| Total Revenue for Adjusted Efficiency Ratio (non-GAAP) | $ | 21,822 | $ | 22,009 | $ | 21,243 | $ | 20,785 | $ | 18,298 | ||||||||||
| Efficiency Ratio (GAAP) | 71.92 | % | 72.13 | % | 74.20 | % | 74.36 | % | 83.00 | % | ||||||||||
| Adjusted Efficiency Ratio (Non-interest Expense (GAAP)/Total Revenue for Adjusted Efficiency Ratio (non-GAAP)) | 73.36 | % | 72.11 | % | 74.27 | % | 75.32 | % | 82.98 | % | ||||||||||
17
Western New England Bancorp, Inc. 8-K
Exhibit 99.2

Local banking is better than ever. INVESTOR PRESENTATION 1ST QUARTER 2026

FORWARD - LOOKING STATEMENTS 2 We may, from time to time, make written or oral “forward - looking statements” within the meaning of the Private Securities Litigation Reform Act of 1995 , including statements contained in our filings with the Securities and Exchange Commission (the “SEC”), our reports to shareholders and in other communications by us . This Investor Presentation contains “forward - looking statements” with respect to the Company’s financial condition, liquidity, results of operations, future performance, and business . Forward - looking statements may be identified by the use of such words as “believe,” “expect,” “anticipate,” “should,” “planned,” “estimated,” and “potential . ” Examples of forward - looking statements include, but are not limited to, estimates with respect to our financial condition, results of operations and business that are subject to various factors which could cause actual results to differ materially from these estimates . These factors include, but are not limited to : unpredictable changes in general economic or political conditions, financial markets, fiscal, monetary and regulatory policies, including actual or potential stress in the banking industry ; the possibility that future credit losses, loan defaults and charge - off rates are higher than expected due to changes in economic assumptions or adverse economic developments ; general business and economic conditions on a national basis and in the local markets in which we operate, including those impacting credit quality ; unstable political and economic conditions, including changes in tariff policies, which could materially impact credit quality trends and the ability to generate loans and gather deposits ; inflation and governmental responses to inflation, including potential future increases in interest rates that reduce net interest margins ; the effect on our operations of governmental legislation and regulation, including changes in accounting regulation or standards, the nature and timing of the adoption and effectiveness of new requirements under the Dodd - Frank Wall Street Reform and Consumer Protection Act of 2010 , Basel guidelines, capital requirements and other applicable laws and regulations ; changes in regulation, regulatory policy, legislation, accounting standards and practices, and fiscal monetary policy, particularly in light of the shift in presidential administrations and the potential for related shifts in agency policy and leadership ; operational risks or risk management failures by us or critical third parties, including without limitation with respect to data processing, information systems, cybersecurity incidents, technological integration, including AI, vendor issues, business interruption, and fraud risks ; significant changes in accounting, tax or regulatory practices or requirements ; new legal obligations or liabilities or unfavorable resolutions or litigation ; disruptive technologies in payment systems and other services traditionally provided by financial institutions ;

FORWARD - LOOKING STATEMENTS 3 severe weather, natural disasters, acts of war or terrorism and other external events which could significantly impact our business ; declines in real estate values in the Company’s market area, which may adversely affect our loan production ; decreases in the value of securities and other assets, or changes in the securities markets which affect investment management revenue ; decreases in deposit levels necessitating increased borrowing to fund loans, investments and other needs ; competitive pressures from other financial institutions ; the soundness of other financial services institutions which may adversely affect our credit risk ; failure or circumvention of our internal controls or procedures ; the risk that goodwill and intangibles recorded in our financial statements will become impaired ; the risk that we may not be successful in the implementation of our business strategy ; increases in Federal Deposit Insurance Corporation deposit insurance premiums and assessments ; introduction of new lines of business or new products and services, which may subject us to additional risks ; changes in key management personnel which may adversely impact our operations ; and other risks and uncertainties detailed in Part 1 A “Risk Factors” of the Company’s 2025 Annual Report on Form 10 - K . Although we believe that the expectations reflected in such forward - looking statements are reasonable, actual results may differ materially from the results discussed in these forward - looking statements. You are cautioned not to place undue reliance on the se forward - looking statements, which speak only as of the date hereof. We do not undertake any obligation to republish revised for ward - looking statements to reflect events or circumstances after the date hereof or to reflect the occurrence of unanticipated events, except to the extent required by law.

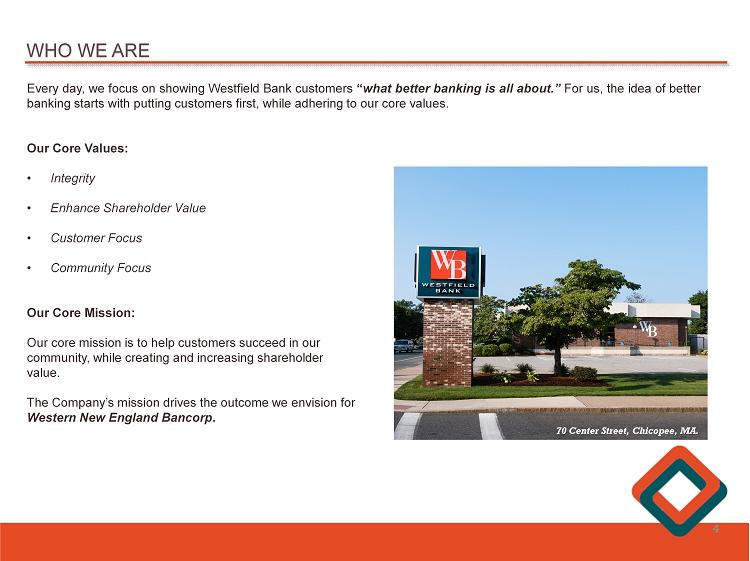
WHO WE ARE Every day, we focus on showing Westfield Bank customers “ what better banking is all about . ” For us, the idea of better banking starts with putting customers first, while adhering to our core values . Our Core Values : • Integrity • Enhance Shareholder Value • Customer Focus • Community Focus Our Core Mission : Our core mission is to help customers succeed in our community, while creating and increasing shareholder value . The Company’s mission drives the outcome we envision for Western New England Bancorp . 4 70 Center Street, Chicopee, MA.

SENIOR MANAGEMENT TEAM James C . Hagan, President & Chief Executive Officer Guida R . Sajdak, Executive Vice President, Chief Financial Officer & Treasurer Allen J . Miles III, Executive Vice President & Chief Lending Officer Kevin C . O’Connor, Executive Vice President & Chief Operating Officer John E . Bonini , Senior Vice President & General Counsel Filipe Goncalves, Senior Vice President & Chief Credit Officer Darlene Libiszewski , Senior Vice President & Chief Information Officer Christine Phillips , Senior Vice President, Chief Human Resources Officer Leo R . Sagan, Jr . , Senior Vice President & Chief Risk Officer 5

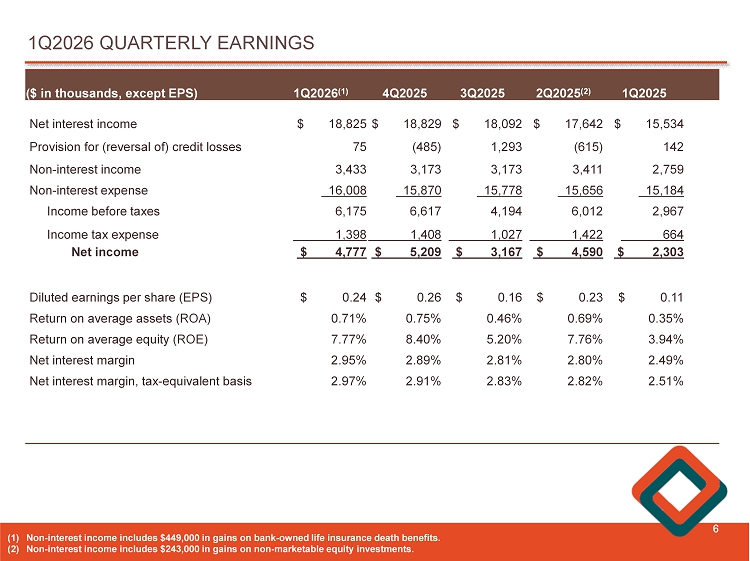
1Q2026 QUARTERLY EARNINGS 6 1Q2025 2Q2025 (2) 3Q2025 4Q2025 1Q2026 (1) ($ in thousands, except EPS) $ 15,534 $ 17,642 $ 18,092 $ 18,829 $ 18,825 Net interest income 142 (615) 1,293 (485) 75 Provision for (reversal of) credit losses 2,759 3,411 3,173 3,173 3,433 Non - interest income 15,184 15,656 15,778 15,870 16,008 Non - interest expense 2,967 6,012 4,194 6,617 6,175 Income before taxes 664 1,422 1,027 1,408 1,398 Income tax expense $ 2,303 $ 4,590 $ 3,167 $ 5,209 $ 4,777 Net income $ 0.11 $ 0.23 $ 0.16 $ 0.26 $ 0.24 Diluted earnings per share (EPS) 0.35% 0.69% 0.46% 0.75% 0.71% Return on average assets (ROA) 3.94% 7.76% 5.20% 8.40% 7.77% Return on average equity (ROE) 2.49% 2.80% 2.81% 2.89% 2.95% Net interest margin 2.51% 2.82% 2.83% 2.91% 2.97% Net interest margin, tax - equivalent basis (1) Non - interest income includes $449,000 in gains on bank - owned life insurance death benefits. (2) Non - interest income includes $243,000 in gains on non - marketable equity investments.

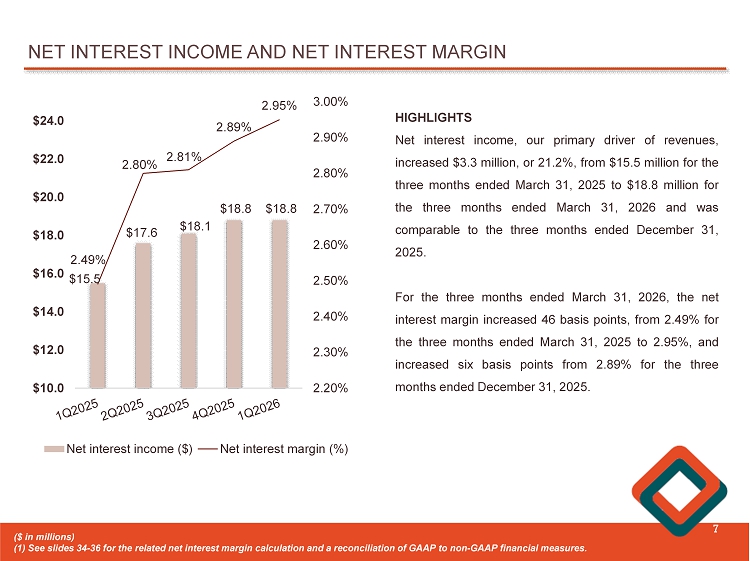
NET INTEREST INCOME AND NET INTEREST MARGIN 7 $15.5 $17.6 $18.1 $18.8 $18.8 2.49% 2.80% 2.81% 2.89% 2.95% 2.20% 2.30% 2.40% 2.50% 2.60% 2.70% 2.80% 2.90% 3.00% $10.0 $12.0 $14.0 $16.0 $18.0 $20.0 $22.0 $24.0 Net interest income ($) Net interest margin (%) ($ in millions) (1) See slides 34 - 36 for the related net interest margin calculation and a reconciliation of GAAP to non - GAAP financial measures . HIGHLIGHTS Net interest income, our primary driver of revenues, increased $ 3 . 3 million, or 21 . 2 % , from $ 15 . 5 million for the three months ended March 31 , 2025 to $ 18 . 8 million for the three months ended March 31 , 2026 and was comparable to the three months ended December 31 , 2025 . For the three months ended March 31 , 2026 , the net interest margin increased 46 basis points, from 2 . 49 % for the three months ended March 31 , 2025 to 2 . 95 % , and increased six basis points from 2 . 89 % for the three months ended December 31 , 2025 .

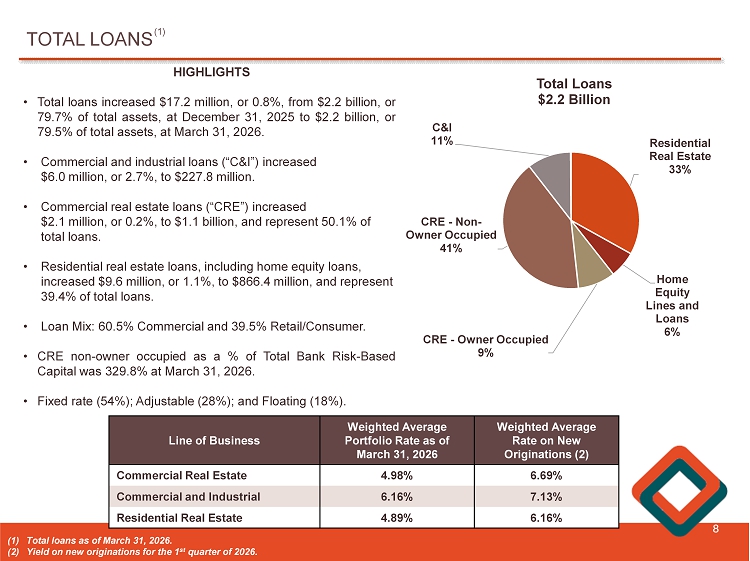
TOTAL LOANS 8 Residential Real Estate 33% Home Equity Lines and Loans 6% CRE - Owner Occupied 9% CRE - Non - Owner Occupied 41% C&I 11% Total Loans $2.2 Billion HIGHLIGHTS • Total loans increased $ 17 . 2 million, or 0 . 8 % , from $ 2 . 2 billion, or 79 . 7 % of total assets, at December 31 , 2025 to $ 2 . 2 billion, or 79 . 5 % of total assets, at March 31 , 2026 . • Commercial and industrial loans (“C&I”) increased $ 6 . 0 million, or 2 . 7 % , to $ 227 . 8 million . • Commercial real estate loans (“CRE”) increased $ 2 . 1 million, or 0 . 2 % , to $ 1 . 1 billion, and represent 50 . 1 % of total loans . • Residential real estate loans, including home equity loans, increased $ 9 . 6 million, or 1 . 1 % , to $ 866 . 4 million, and represent 39 . 4 % of total loans . • Loan Mix : 60 . 5 % Commercial and 39 . 5 % Retail/Consumer . • CRE non - owner occupied as a % of Total Bank Risk - Based Capital was 329 . 8 % at March 31 , 2026 . • Fixed rate ( 54 % ) ; Adjustable ( 28 % ) ; and Floating ( 18 % ) . Weighted Average Rate on New Originations (2) Weighted Average Portfolio Rate as of March 31, 2026 Line of Business 6.69% 4.98% Commercial Real Estate 7.13% 6.16% Commercial and Industrial 6.16% 4.89% Residential Real Estate (1) Total loans as of March 31, 2026. (2) Yield on new originations for the 1 st quarter of 2026. (1)

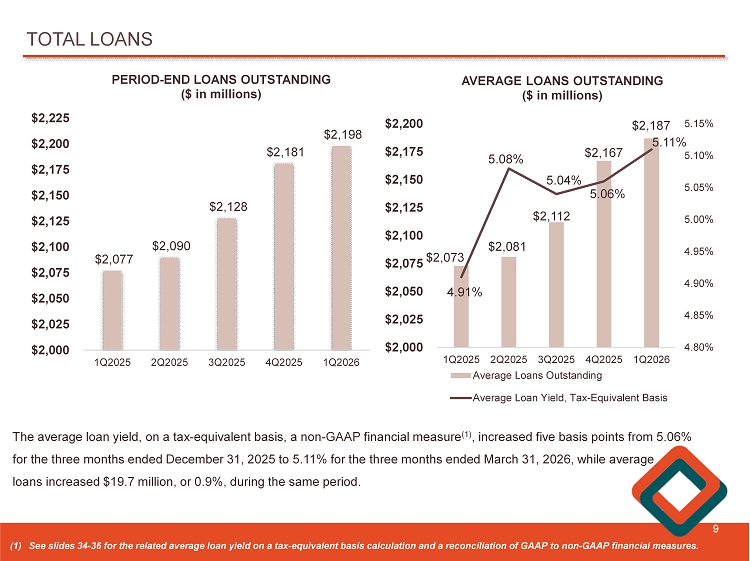
TOTAL LOANS 9 $2,073 $2,081 $2,112 $2,167 $2,187 4.91% 5.08% 5.04% 5.06% 5.11% 4.80% 4.85% 4.90% 4.95% 5.00% 5.05% 5.10% 5.15% 1Q2025 2Q2025 3Q2025 4Q2025 1Q2026 $2,000 $2,025 $2,050 $2,075 $2,100 $2,125 $2,150 $2,175 $2,200 AVERAGE LOANS OUTSTANDING ($ in millions) Average Loans Outstanding Average Loan Yield, Tax-Equivalent Basis (1) See slides 34 - 36 for the related average loan yield on a tax - equivalent basis calculation and a reconciliation of GAAP to non - GA AP financial measures. $2,077 $2,090 $2,128 $2,181 $2,198 1Q2025 2Q2025 3Q2025 4Q2025 1Q2026 $2,000 $2,025 $2,050 $2,075 $2,100 $2,125 $2,150 $2,175 $2,200 $2,225 PERIOD - END LOANS OUTSTANDING ($ in millions) The average loan yield, on a tax - equivalent basis, a non - GAAP financial measure (1) , increased five basis points from 5.06% for the three months ended December 31, 2025 to 5.11% for the three months ended March 31, 2026, while average loans increased $19.7 million, or 0.9%, during the same period.

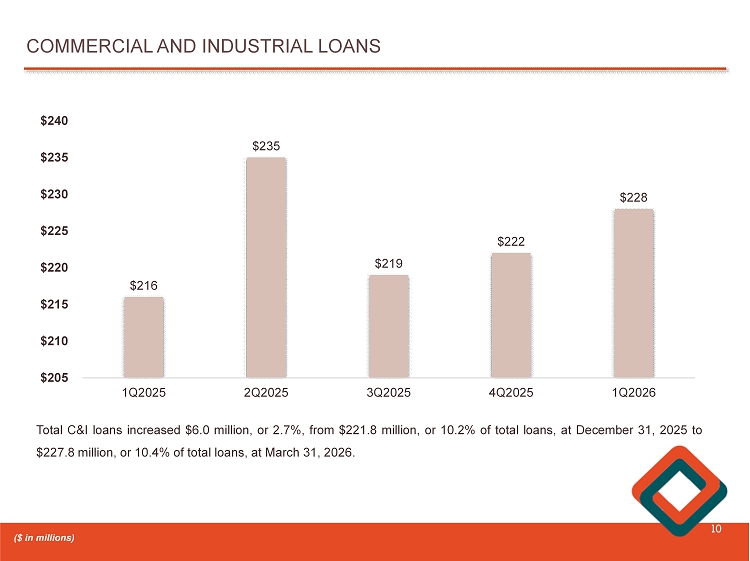
COMMERCIAL AND INDUSTRIAL LOANS 10 $216 $235 $219 $222 $228 1Q2025 2Q2025 3Q2025 4Q2025 1Q2026 $205 $210 $215 $220 $225 $230 $235 $240 Total C&I loans increased $ 6 . 0 million, or 2 . 7 % , from $ 221 . 8 million, or 10 . 2 % of total loans, at December 31 , 2025 to $ 227 . 8 million, or 10 . 4 % of total loans, at March 31 , 2026 . ($ in millions)

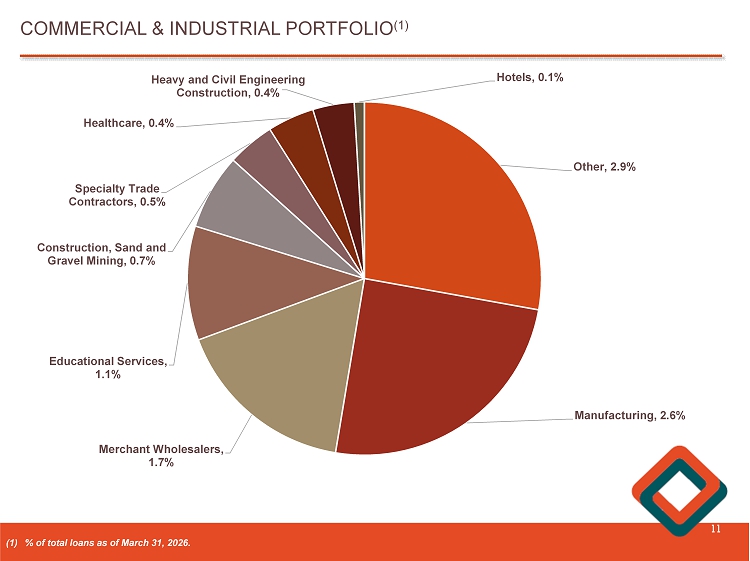
COMMERCIAL & INDUSTRIAL PORTFOLIO (1) 11 (1) % of total loans as of March 31, 2026. Other , 2.9% Manufacturing , 2.6% Merchant Wholesalers , 1.7% Educational Services , 1.1% Construction, Sand and Gravel Mining , 0.7% Specialty Trade Contractors , 0.5% Healthcare , 0.4% Heavy and Civil Engineering Construction , 0.4% Hotels , 0.1%

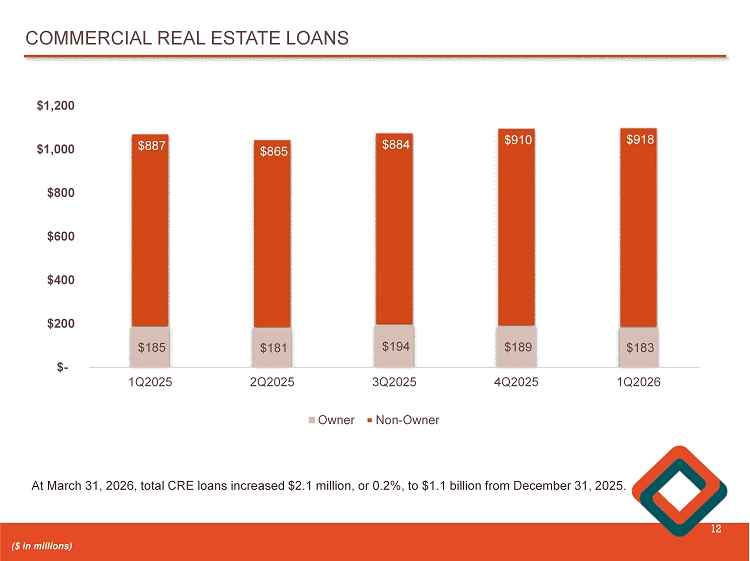
COMMERCIAL REAL ESTATE LOANS 12 $185 $181 $194 $189 $183 $887 $865 $884 $910 $918 1Q2025 2Q2025 3Q2025 4Q2025 1Q2026 $- $200 $400 $600 $800 $1,000 $1,200 Owner Non-Owner At March 31 , 2026 , total CRE loans increased $ 2 . 1 million, or 0 . 2 % , to $ 1 . 1 billion from December 31 , 2025 . ($ in millions)

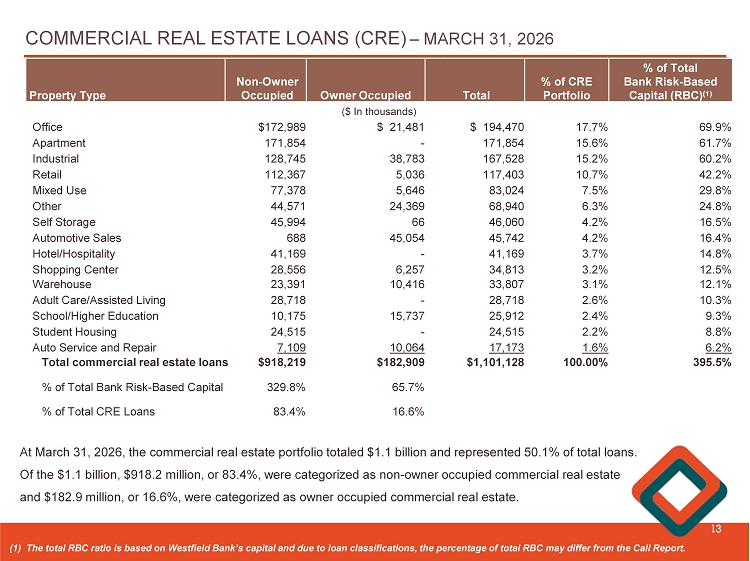
COMMERCIAL REAL ESTATE LOANS (CRE) – MARCH 31, 2026 13 (1) The total RBC ratio is based on Westfield Bank’s capital and due to loan classifications, the percentage of total RBC ma y d iffer from the Call Report. At March 31 , 2026 , the commercial real estate portfolio totaled $ 1 . 1 billion and represented 50 . 1 % of total loans . Of the $ 1 . 1 billion, $ 918 . 2 million, or 83 . 4 % , were categorized as non - owner occupied commercial real estate and $ 182 . 9 million, or 16 . 6 % , were categorized as owner occupied commercial real estate . % of Total Bank Risk - Based Capital (RBC) (1) % of CRE Portfolio Total Owner Occupied Non - Owner Occupied Property Type ($ In thousands) 69.9% 17.7% $ 194,470 $ 21,481 $172,989 Office 61.7% 15.6% 171,854 - 171,854 Apartment 60.2% 15.2% 167,528 38,783 128,745 Industrial 42.2% 10.7% 117,403 5,036 112,367 Retail 29.8% 7.5% 83,024 5,646 77,378 Mixed Use 24.8% 6.3% 68,940 24,369 44,571 Other 16.5% 4.2% 46,060 66 45,994 Self Storage 16.4% 4.2% 45,742 45,054 688 Automotive Sales 14.8% 3.7% 41,169 - 41,169 Hotel/Hospitality 12.5% 3.2% 34,813 6,257 28,556 Shopping Center 12.1% 3.1% 33,807 10,416 23,391 Warehouse 10.3% 2.6% 28,718 - 28,718 Adult Care/Assisted Living 9.3% 2.4% 25,912 15,737 10,175 School/Higher Education 8.8% 2.2% 24,515 - 24,515 Student Housing 6.2% 1.6% 17,173 10,064 7,109 Auto Service and Repair 395.5% 100.00% $1,101,128 $182,909 $918,219 Total commercial real estate loans 65.7% 329.8% % of Total Bank Risk - Based Capital 16.6% 83.4% % of Total CRE Loans

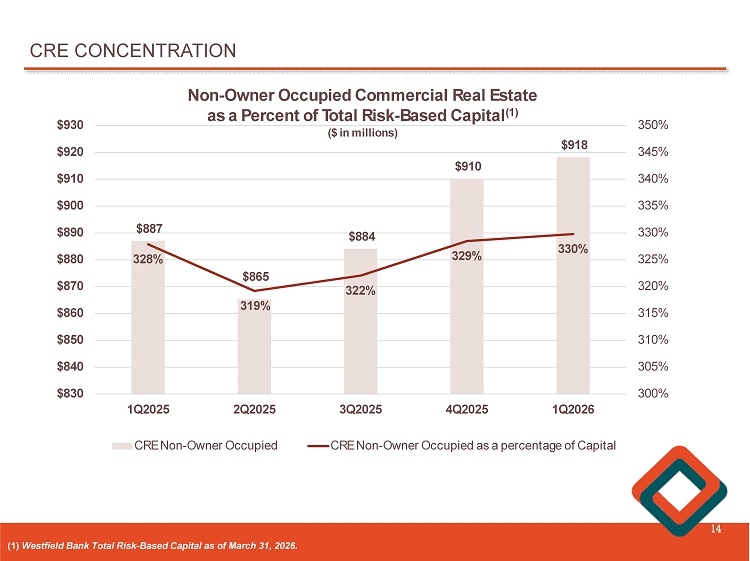
CRE CONCENTRATION 14 (1) Westfield Bank Total Risk - Based Capital as of March 31, 2026. $887 $865 $884 $910 $918 328% 319% 322% 329% 330% 300% 305% 310% 315% 320% 325% 330% 335% 340% 345% 350% $830 $840 $850 $860 $870 $880 $890 $900 $910 $920 $930 1Q2025 2Q2025 3Q2025 4Q2025 1Q2026 Non - Owner Occupied Commercial Real Estate as a Percent of Total Risk - Based Capital (1) ($ in millions) CRE Non-Owner Occupied CRE Non-Owner Occupied as a percentage of Capital

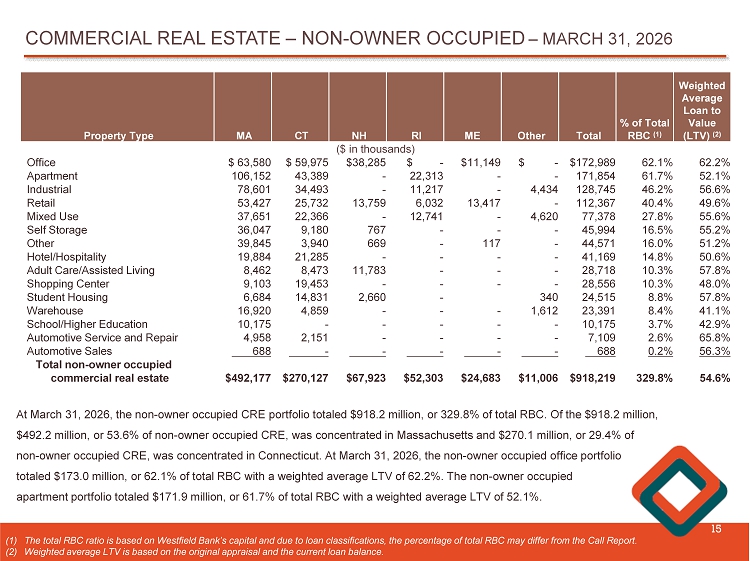
COMMERCIAL REAL ESTATE – NON - OWNER OCCUPIED – MARCH 31, 2026 15 At March 31 , 2026 , the non - owner occupied CRE portfolio totaled $ 918 . 2 million, or 329 . 8 % of total RBC . Of the $ 918 . 2 million, $ 492 . 2 million, or 53 . 6 % of non - owner occupied CRE, was concentrated in Massachusetts and $ 270 . 1 million, or 29 . 4 % of non - owner occupied CRE, was concentrated in Connecticut . At March 31 , 2026 , the non - owner occupied office portfolio totaled $ 173 . 0 million, or 62 . 1 % of total RBC with a weighted average LTV of 62 . 2 % . The non - owner occupied apartment portfolio totaled $ 171 . 9 million, or 61 . 7 % of total RBC with a weighted average LTV of 52 . 1 % . (1) The total RBC ratio is based on Westfield Bank’s capital and due to loan classifications, the percentage of total RBC may dif fer from the Call Report. (2) Weighted average LTV is based on the original appraisal and the current loan balance. Weighted Average Loan to Value % of Total Total Other ME RI NH CT MA Property Type (LTV) (2) RBC (1) ($ in thousands) 62.2% 62.1% $172,989 $ - $11,149 $ - $38,285 $ 59,975 $ 63,580 Office 52.1% 61.7% 171,854 - - 22,313 - 43,389 106,152 Apartment 56.6% 46.2% 128,745 4,434 - 11,217 - 34,493 78,601 Industrial 49.6% 40.4% 112,367 - 13,417 6,032 13,759 25,732 53,427 Retail 55.6% 27.8% 77,378 4,620 - 12,741 - 22,366 37,651 Mixed Use 55.2% 16.5% 45,994 - - - 767 9,180 36,047 Self Storage 51.2% 16.0% 44,571 - 117 - 669 3,940 39,845 Other 50.6% 14.8% 41,169 - - - - 21,285 19,884 Hotel/Hospitality 57.8% 10.3% 28,718 - - - 11,783 8,473 8,462 Adult Care/Assisted Living 48.0% 10.3% 28,556 - - - - 19,453 9,103 Shopping Center 57.8% 8.8% 24,515 340 - 2,660 14,831 6,684 Student Housing 41.1% 8.4% 23,391 1,612 - - - 4,859 16,920 Warehouse 42.9% 3.7% 10,175 - - - - - 10,175 School/Higher Education 65.8% 2.6% 7,109 - - - - 2,151 4,958 Automotive Service and Repair 56.3% 0.2% 688 - - - - - 688 Automotive Sales 54.6% 329.8% $918,219 $11,006 $24,683 $52,303 $67,923 $270,127 $492,177 Total non - owner occupied commercial real estate

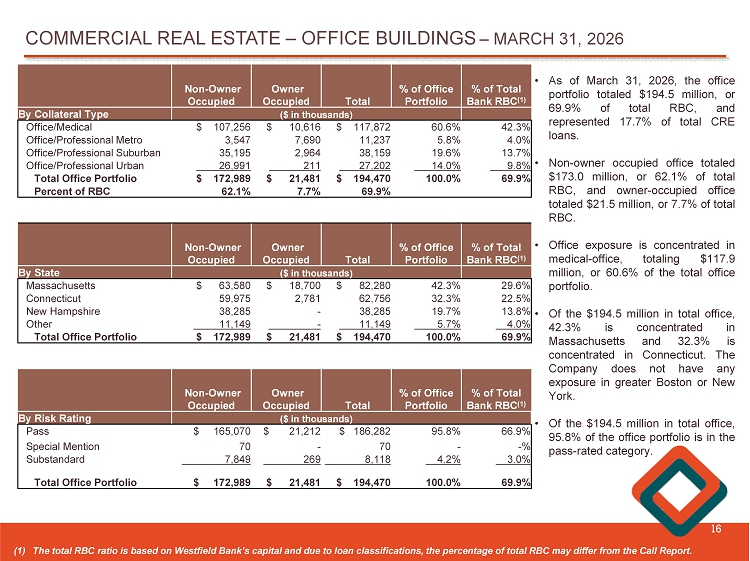
COMMERCIAL REAL ESTATE – OFFICE BUILDINGS – MARCH 31, 2026 16 (1) The total RBC ratio is based on Westfield Bank’s capital and due to loan classifications, the percentage of total RBC may dif fer from the Call Report. % of Total Bank RBC (1) % of Office Portfolio Total Owner Occupied Non - Owner Occupied ($ in thousands) By Collateral Type 42.3% 60.6% $ 117,872 $ 10,616 $ 107,256 Office/Medical 4.0% 5.8% 11,237 7,690 3,547 Office/Professional Metro 13.7% 19.6% 38,159 2,964 35,195 Office/Professional Suburban 9.8% 14.0% 27,202 211 26,991 Office/Professional Urban 69.9% 100.0% $ 194,470 $ 21,481 $ 172,989 Total Office Portfolio 69.9% 7.7% 62.1% Percent of RBC % of Total Bank RBC (1) % of Office Portfolio Total Owner Occupied Non - Owner Occupied ($ in thousands) By State 29.6% 42.3% $ 82,280 $ 18,700 $ 63,580 Massachusetts 22.5% 32.3% 62,756 2,781 59,975 Connecticut 13.8% 19.7% 38,285 - 38,285 New Hampshire 4.0% 5.7% 11,149 - 11,149 Other 69.9% 100.0% $ 194,470 $ 21,481 $ 172,989 Total Office Portfolio % of Total Bank RBC (1) % of Office Portfolio Total Owner Occupied Non - Owner Occupied ($ in thousands) By Risk Rating 66.9% 95.8% $ 186,282 $ 21,212 $ 165,070 Pass - % - 70 - 70 Special Mention 3.0% 4.2% 8,118 269 7,849 Substandard 69.9% 100.0% $ 194,470 $ 21,481 $ 172,989 Total Office Portfolio • As of March 31 , 2026 , the office portfolio totaled $ 194 . 5 million, or 69 . 9 % of total RBC, and represented 17 . 7 % of total CRE loans . • Non - owner occupied office totaled $ 173 . 0 million, or 62 . 1 % of total RBC, and owner - occupied office totaled $ 21 . 5 million, or 7 . 7 % of total RBC . • Office exposure is concentrated in medical - office, totaling $ 117 . 9 million, or 60 . 6 % of the total office portfolio . • Of the $ 194 . 5 million in total office, 42 . 3 % is concentrated in Massachusetts and 32 . 3 % is concentrated in Connecticut . The Company does not have any exposure in greater Boston or New York . • Of the $ 194 . 5 million in total office, 95 . 8 % of the office portfolio is in the pass - rated category .

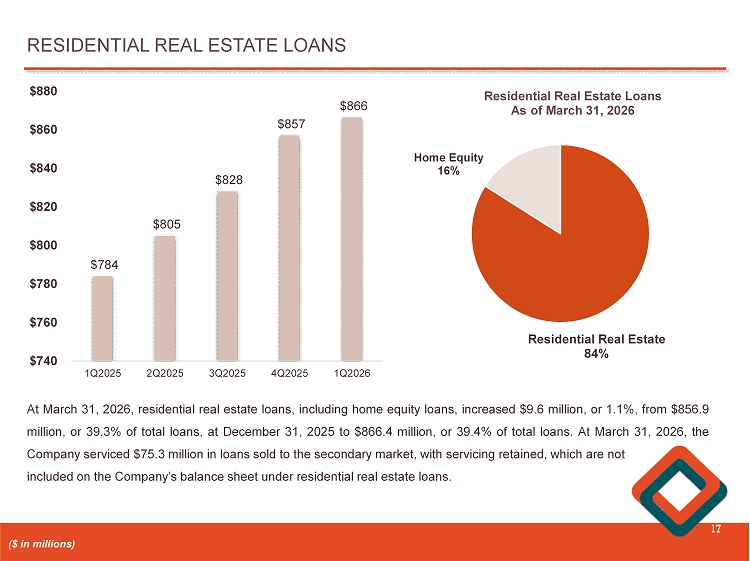
RESIDENTIAL REAL ESTATE LOANS 17 $784 $805 $828 $857 $866 1Q2025 2Q2025 3Q2025 4Q2025 1Q2026 $740 $760 $780 $800 $820 $840 $860 $880 At March 31 , 2026 , residential real estate loans, including home equity loans, increased $ 9 . 6 million, or 1 . 1 % , from $ 856 . 9 million, or 39 . 3 % of total loans, at December 31 , 2025 to $ 866 . 4 million, or 39 . 4 % of total loans . At March 31 , 2026 , the Company serviced $ 75 . 3 million in loans sold to the secondary market, with servicing retained, which are not included on the Company’s balance sheet under residential real estate loans . ($ in millions) Residential Real Estate 84% Home Equity 16% Residential Real Estate Loans As of March 31, 2026

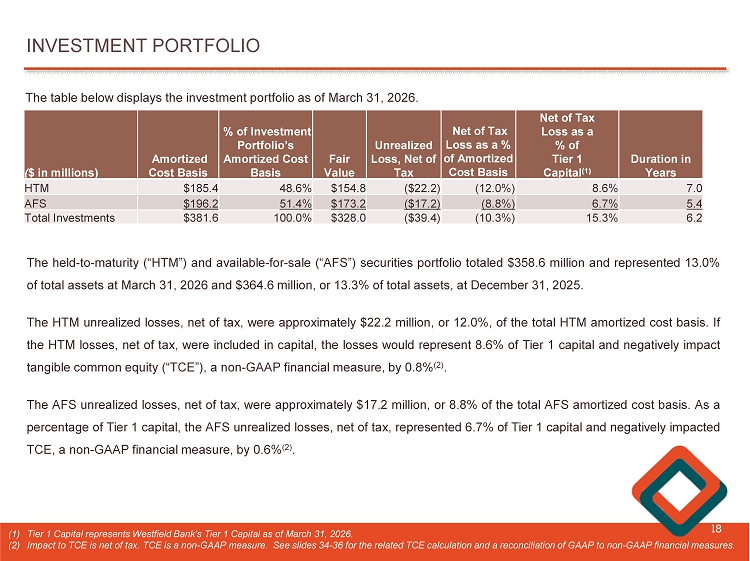
INVESTMENT PORTFOLIO 18 The held - to - maturity (“HTM”) and available - for - sale (“AFS”) securities portfolio totaled $ 358 . 6 million and represented 13 . 0 % of total assets at March 31 , 2026 and $ 364 . 6 million, or 13 . 3 % of total assets, at December 31 , 2025 . The HTM unrealized losses, net of tax, were approximately $ 22 . 2 million, or 12 . 0 % , of the total HTM amortized cost basis . If the HTM losses, net of tax, were included in capital, the losses would represent 8 . 6 % of Tier 1 capital and negatively impact tangible common equity (“TCE”), a non - GAAP financial measure, by 0 . 8 % ( 2 ) . The AFS unrealized losses, net of tax, were approximately $ 17 . 2 million, or 8 . 8 % of the total AFS amortized cost basis . As a percentage of Tier 1 capital, the AFS unrealized losses, net of tax, represented 6 . 7 % of Tier 1 capital and negatively impacted TCE, a non - GAAP financial measure, by 0 . 6 % ( 2 ) . (1) Tier 1 Capital represents Westfield Bank’s Tier 1 Capital as of March 31, 2026. (2) Impact to TCE is net of tax. TCE is a non - GAAP measure. See slides 34 - 36 for the related TCE calculation and a reconciliation o f GAAP to non - GAAP financial measures. The table below displays the investment portfolio as of March 31 , 2026 . Duration in Years Net of Tax Loss as a % of Tier 1 Capital (1) Net of Tax Loss as a % of Amortized Cost Basis Unrealized Loss, Net of Tax Fair Value % of Investment Portfolio’s Amortized Cost Basis Amortized Cost Basis ( $ in millions) 7.0 8.6% (12.0%) ($22.2) $154.8 48.6% $185.4 HTM 5.4 6.7% (8.8%) ($17.2) $173.2 51.4% $196.2 AFS 6.2 15.3% (10.3%) ($39.4) $328.0 100.0% $381.6 Total Investments

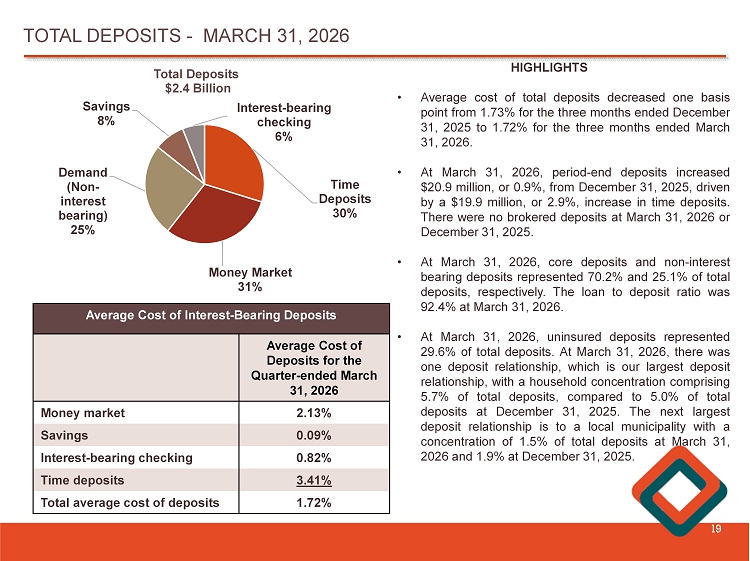
TOTAL DEPOSITS - MARCH 31, 2026 19 Time Deposits 30% Money Market 31% Demand (Non - interest bearing) 25% Savings 8% Interest - bearing checking 6% Total Deposits $2.4 Billion HIGHLIGHTS • Average cost of total deposits decreased one basis point from 1 . 73 % for the three months ended December 31 , 2025 to 1 . 72 % for the three months ended March 31 , 2026 . • At March 31 , 2026 , period - end deposits increased $ 20 . 9 million, or 0 . 9 % , from December 31 , 2025 , driven by a $ 19 . 9 million, or 2 . 9 % , increase in time deposits . There were no brokered deposits at March 31 , 2026 or December 31 , 2025 . • At March 31 , 2026 , core deposits and non - interest bearing deposits represented 70 . 2 % and 25 . 1 % of total deposits, respectively . The loan to deposit ratio was 92 . 4 % at March 31 , 2026 . • At March 31 , 2026 , uninsured deposits represented 29 . 6 % of total deposits . At March 31 , 2026 , there was one deposit relationship, which is our largest deposit relationship, with a household concentration comprising 5 . 7 % of total deposits, compared to 5 . 0 % of total deposits at December 31 , 2025 . The next largest deposit relationship is to a local municipality with a concentration of 1 . 5 % of total deposits at March 31 , 2026 and 1 . 9 % at December 31 , 2025 . Average Cost of Interest - Bearing Deposits Average Cost of Deposits for the Quarter - ended March 31, 2026 2.13% Money market 0.09% Savings 0.82% Interest - bearing checking 3.41% Time deposits 1.72% Total average cost of deposits

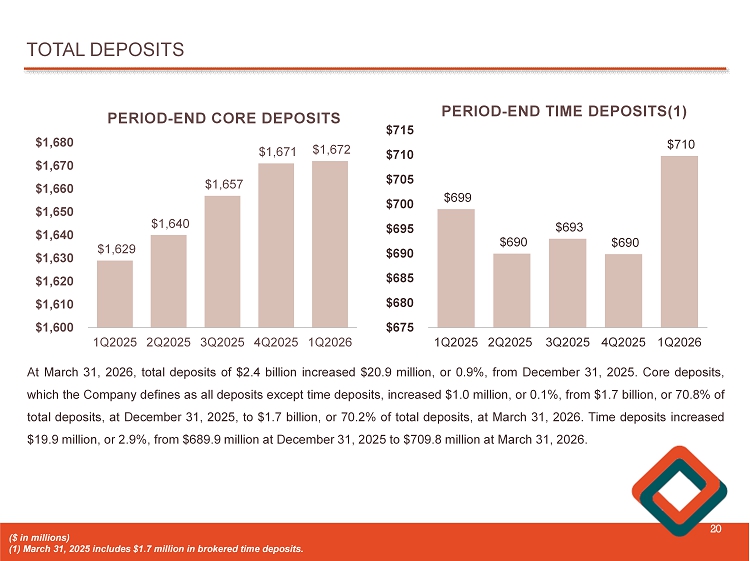
TOTAL DEPOSITS 20 $1,629 $1,640 $1,657 $1,671 $1,672 1Q2025 2Q2025 3Q2025 4Q2025 1Q2026 $1,600 $1,610 $1,620 $1,630 $1,640 $1,650 $1,660 $1,670 $1,680 PERIOD - END CORE DEPOSITS At March 31 , 2026 , total deposits of $ 2 . 4 billion increased $ 20 . 9 million, or 0 . 9 % , from December 31 , 2025 . Core deposits, which the Company defines as all deposits except time deposits, increased $ 1 . 0 million, or 0 . 1 % , from $ 1 . 7 billion, or 70 . 8 % of total deposits, at December 31 , 2025 , to $ 1 . 7 billion, or 70 . 2 % of total deposits, at March 31 , 2026 . Time deposits increased $ 19 . 9 million, or 2 . 9 % , from $ 689 . 9 million at December 31 , 2025 to $ 709 . 8 million at March 31 , 2026 . $699 $690 $693 $690 $710 1Q2025 2Q2025 3Q2025 4Q2025 1Q2026 $675 $680 $685 $690 $695 $700 $705 $710 $715 PERIOD - END TIME DEPOSITS(1) ($ in millions) (1) March 31, 2025 includes $1.7 million in brokered time deposits.

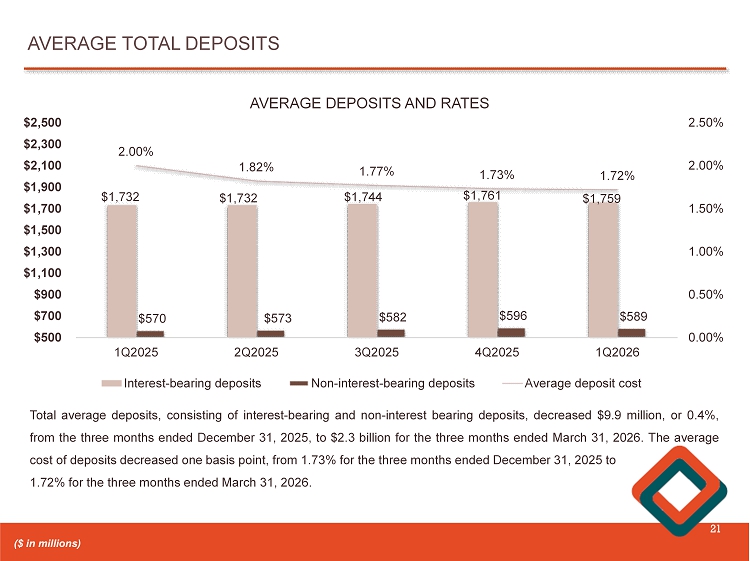
AVERAGE TOTAL DEPOSITS 21 $1,732 $1,732 $1,744 $1,761 $1,759 $570 $573 $582 $596 $589 2.00% 1.82% 1.77% 1.73% 1.72% 0.00% 0.50% 1.00% 1.50% 2.00% 2.50% 1Q2025 2Q2025 3Q2025 4Q2025 1Q2026 $500 $700 $900 $1,100 $1,300 $1,500 $1,700 $1,900 $2,100 $2,300 $2,500 AVERAGE DEPOSITS AND RATES Interest-bearing deposits Non-interest-bearing deposits Average deposit cost Total average deposits, consisting of interest - bearing and non - interest bearing deposits, decreased $ 9 . 9 million, or 0 . 4 % , from the three months ended December 31 , 2025 , to $ 2 . 3 billion for the three months ended March 31 , 2026 . The average cost of deposits decreased one basis point, from 1 . 73 % for the three months ended December 31 , 2025 to 1 . 72 % for the three months ended March 31 , 2026 . ($ in millions)

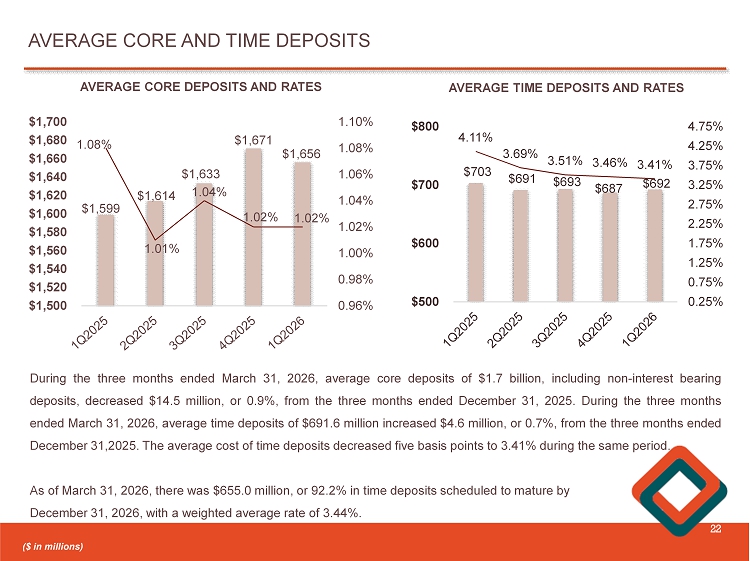
AVERAGE CORE AND TIME DEPOSITS 22 $1,599 $1,614 $1,633 $1,671 $1,656 1.08% 1.01% 1.04% 1.02% 1.02% 0.96% 0.98% 1.00% 1.02% 1.04% 1.06% 1.08% 1.10% $1,500 $1,520 $1,540 $1,560 $1,580 $1,600 $1,620 $1,640 $1,660 $1,680 $1,700 AVERAGE CORE DEPOSITS AND RATES During the three months ended March 31 , 2026 , average core deposits of $ 1 . 7 billion, including non - interest bearing deposits, decreased $ 14 . 5 million, or 0 . 9 % , from the three months ended December 31 , 2025 . During the three months ended March 31 , 2026 , average time deposits of $ 691 . 6 million increased $ 4 . 6 million, or 0 . 7 % , from the three months ended December 31 , 2025 . The average cost of time deposits decreased five basis points to 3 . 41 % during the same period . As of March 31 , 2026 , there was $ 655 . 0 million, or 92 . 2 % in time deposits scheduled to mature by December 31 , 2026 , with a weighted average rate of 3 . 44 % . ($ in millions) $703 $691 $693 $687 $692 4.11% 3.69% 3.51% 3.46% 3.41% 0.25% 0.75% 1.25% 1.75% 2.25% 2.75% 3.25% 3.75% 4.25% 4.75% $500 $600 $700 $800 AVERAGE TIME DEPOSITS AND RATES

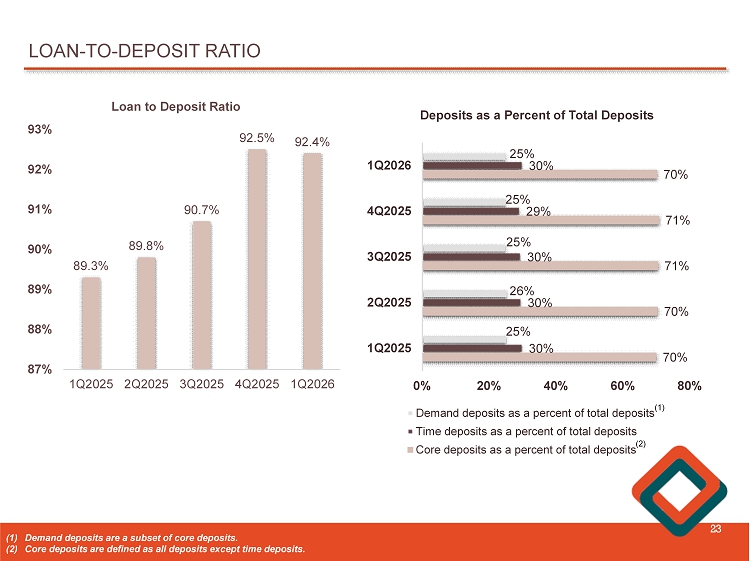
LOAN - TO - DEPOSIT RATIO 23 89.3% 89.8% 90.7% 92.5% 92.4% 1Q2025 2Q2025 3Q2025 4Q2025 1Q2026 87% 88% 89% 90% 91% 92% 93% Loan to Deposit Ratio 70% 70% 71% 71% 70% 30% 30% 30% 29% 30% 25% 26% 25% 25% 25% 1Q2025 2Q2025 3Q2025 4Q2025 1Q2026 0% 20% 40% 60% 80% Deposits as a Percent of Total Deposits Demand deposits as a percent of total deposits Time deposits as a percent of total deposits Core deposits as a percent of total deposits (1) Demand deposits are a subset of core deposits . (2) Core deposits are defined as all deposits except time deposits . (1) (2)

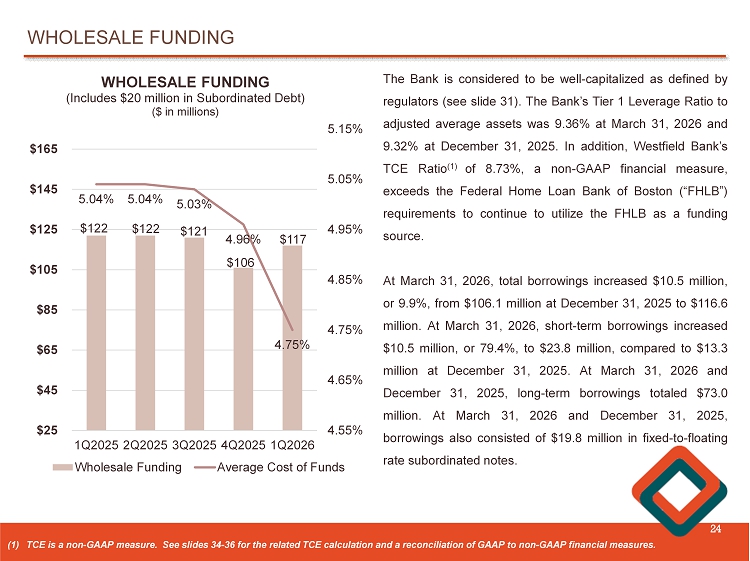
WHOLESALE FUNDING 24 $122 $122 $121 $106 $117 5.04% 5.04% 5.03% 4.96% 4.75% 4.55% 4.65% 4.75% 4.85% 4.95% 5.05% 5.15% 1Q2025 2Q2025 3Q2025 4Q2025 1Q2026 $25 $45 $65 $85 $105 $125 $145 $165 WHOLESALE FUNDING (Includes $20 million in Subordinated Debt) ($ in millions) Wholesale Funding Average Cost of Funds The Bank is considered to be well - capitalized as defined by regulators (see slide 31 ) . The Bank’s Tier 1 Leverage Ratio to adjusted average assets was 9 . 36 % at March 31 , 2026 and 9 . 32 % at December 31 , 2025 . In addition, Westfield Bank’s TCE Ratio ( 1 ) of 8 . 73 % , a non - GAAP financial measure, exceeds the Federal Home Loan Bank of Boston (“FHLB”) requirements to continue to utilize the FHLB as a funding source . At March 31 , 2026 , total borrowings increased $ 10 . 5 million, or 9 . 9 % , from $ 106 . 1 million at December 31 , 2025 to $ 116 . 6 million . At March 31 , 2026 , short - term borrowings increased $ 10 . 5 million, or 79 . 4 % , to $ 23 . 8 million, compared to $ 13 . 3 million at December 31 , 2025 . At March 31 , 2026 and December 31 , 2025 , long - term borrowings totaled $ 73 . 0 million . At March 31 , 2026 and December 31 , 2025 , borrowings also consisted of $ 19 . 8 million in fixed - to - floating rate subordinated notes . (1) TCE is a non - GAAP measure. See slides 34 - 36 for the related TCE calculation and a reconciliation of GAAP to non - GAAP financial measures.

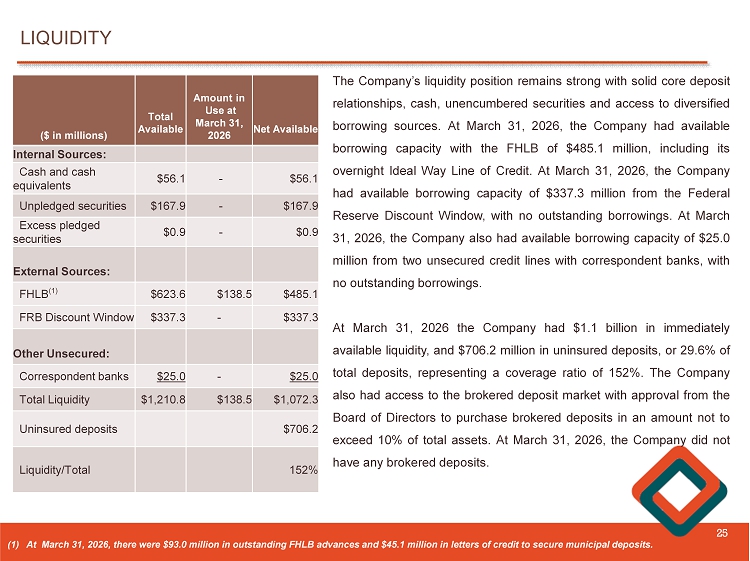
25 The Company’s liquidity position remains strong with solid core deposit relationships, cash, unencumbered securities and access to diversified borrowing sources . At March 31 , 2026 , the Company had available borrowing capacity with the FHLB of $ 485 . 1 million, including its overnight Ideal Way Line of Credit . At March 31 , 2026 , the Company had available borrowing capacity of $ 337 . 3 million from the Federal Reserve Discount Window, with no outstanding borrowings . At March 31 , 2026 , the Company also had available borrowing capacity of $ 25 . 0 million from two unsecured credit lines with correspondent banks, with no outstanding borrowings . At March 31 , 2026 the Company had $ 1 . 1 billion in immediately available liquidity, and $ 706 . 2 million in uninsured deposits, or 29 . 6 % of total deposits, representing a coverage ratio of 152 % . The Company also had access to the brokered deposit market with approval from the Board of Directors to purchase brokered deposits in an amount not to exceed 10 % of total assets . At March 31 , 2026 , the Company did not have any brokered deposits . LIQUIDITY Net Available Amount in Use at March 31, 2026 Total Available ($ in millions) Internal Sources: $56.1 - $56.1 Cash and cash equivalents $167.9 - $167.9 Unpledged securities $0.9 - $0.9 Excess pledged securities External Sources: $485.1 $138.5 $623.6 FHLB (1) $337.3 - $337.3 FRB Discount Window Other Unsecured: $25.0 - $25.0 Correspondent banks $1,072.3 $138.5 $1,210.8 Total Liquidity $706.2 Uninsured deposits 152% Liquidity/Total (1) At March 31 , 2026 , there were $ 93 . 0 million in outstanding FHLB advances and $ 45 . 1 million in letters of credit to secure municipal deposits .

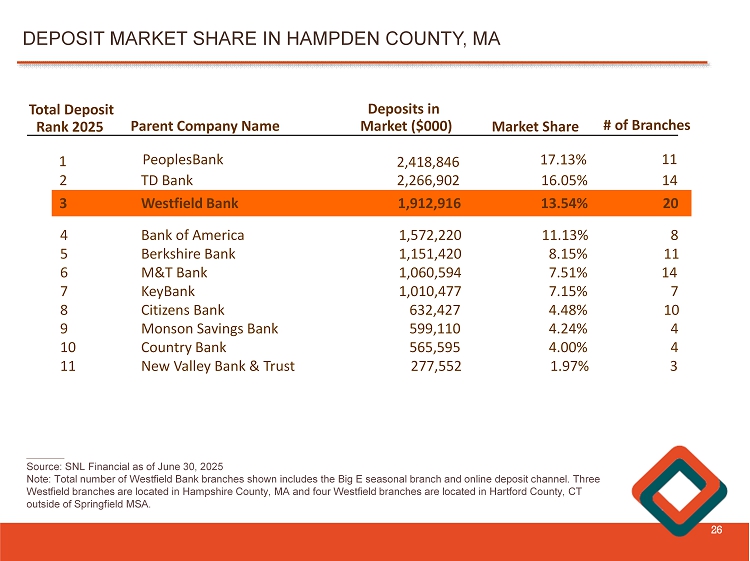
________ Source: SNL Financial as of June 30, 2025 Note: Total number of Westfield Bank branches shown includes the Big E seasonal branch and online deposit channel. Three Westfield branches are located in Hampshire County, MA and four Westfield branches are located in Hartford County, CT outside of Springfield MSA. DEPOSIT MARKET SHARE IN HAMPDEN COUNTY, MA 26 Total Deposit Rank 2025 Parent Company Name Deposits in Market ($000) Market Share # of Branches 1 PeoplesBank 2,418,846 17.13% 11 1,762,519 13.1% 20 3 Westfield Bank 1,912,916 13.54% 20 2 TD Bank 2,266,902 16.05% 14 4 Bank of America 1,572,220 11.13% 8 5 Berkshire Bank 1,151,420 8.15% 11 6 M&T Bank 1,060,594 7.51% 14 7 KeyBank 1,010,477 7.15% 7 8 Citizens Bank 632,427 4.48% 10 9 Monson Savings Bank 599,110 4.24% 4 10 Country Bank 565,595 4.00% 4 11 New Valley Bank & Trust 277,552 1.97% 3

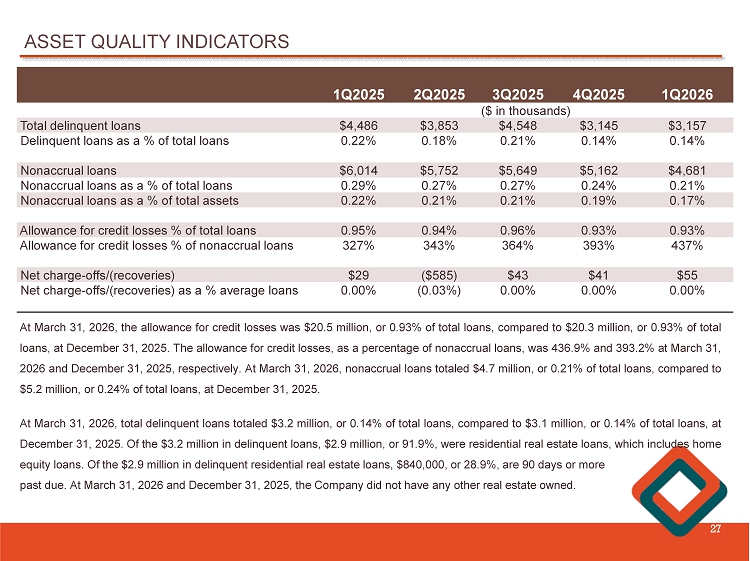
ASSET QUALITY INDICATORS 27 1Q2026 4Q2025 3Q2025 2Q2025 1Q2025 ($ in thousands) $3,157 $3,145 $4,548 $3,853 $4,486 Total delinquent loans 0.14% 0.14% 0.21% 0.18% 0.22% Delinquent loans as a % of total loans $4,681 $5,162 $5,649 $5,752 $6,014 Nonaccrual loans 0.21% 0.24% 0.27% 0.27% 0.29% Nonaccrual loans as a % of total loans 0.17% 0.19% 0.21% 0.21% 0.22% Nonaccrual loans as a % of total assets 0.93% 0.93% 0.96% 0.94% 0.95% Allowance for credit losses % of total loans 437% 393% 364% 343% 327% Allowance for credit losses % of nonaccrual loans $55 $41 $43 ($585) $29 Net charge - offs/(recoveries) 0.00% 0.00% 0.00% (0.03%) 0.00% Net charge - offs/(recoveries) as a % average loans At March 31 , 2026 , the allowance for credit losses was $ 20 . 5 million, or 0 . 93 % of total loans, compared to $ 20 . 3 million, or 0 . 93 % of total loans, at December 31 , 2025 . The allowance for credit losses, as a percentage of nonaccrual loans, was 436 . 9 % and 393 . 2 % at March 31 , 2026 and December 31 , 2025 , respectively . At March 31 , 2026 , nonaccrual loans totaled $ 4 . 7 million, or 0 . 21 % of total loans, compared to $ 5 . 2 million, or 0 . 24 % of total loans, at December 31 , 2025 . At March 31 , 2026 , total delinquent loans totaled $ 3 . 2 million, or 0 . 14 % of total loans, compared to $ 3 . 1 million, or 0 . 14 % of total loans, at December 31 , 2025 . Of the $ 3 . 2 million in delinquent loans, $ 2 . 9 million, or 91 . 9 % , were residential real estate loans, which includes home equity loans . Of the $ 2 . 9 million in delinquent residential real estate loans, $ 840 , 000 , or 28 . 9 % , are 90 days or more past due . At March 31 , 2026 and December 31 , 2025 , the Company did not have any other real estate owned .

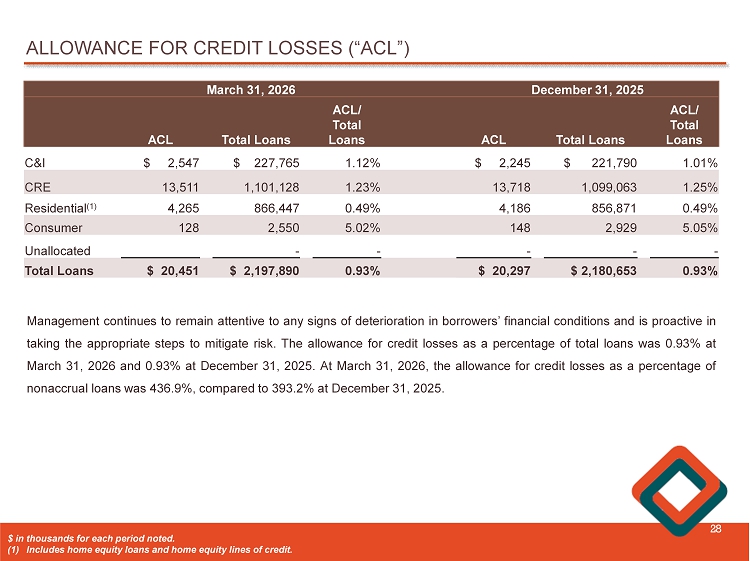
ALLOWANCE FOR CREDIT LOSSES (“ACL”) 28 Management continues to remain attentive to any signs of deterioration in borrowers’ financial conditions and is proactive in taking the appropriate steps to mitigate risk . The allowance for credit losses as a percentage of total loans was 0 . 93 % at March 31 , 2026 and 0 . 93 % at December 31 , 2025 . At March 31 , 2026 , the allowance for credit losses as a percentage of nonaccrual loans was 436 . 9 % , compared to 393 . 2 % at December 31 , 2025 . December 31, 2025 March 31, 2026 ACL/ Total Loans Total Loans ACL ACL/ Total Loans Total Loans ACL 1.01% $ 221,790 $ 2,245 1.12% $ 227,765 $ 2,547 C&I 1.25% 1,099,063 13,718 1.23% 1,101,128 13,511 CRE 0.49% 856,871 4,186 0.49% 866,447 4,265 Residential (1) 5.05% 2,929 148 5.02% 2,550 128 Consumer - - - - - Unallocated 0.93% $ 2,180,653 $ 20,297 0.93% $ 2,197,890 $ 20,451 Total Loans $ in thousands for each period noted . (1) Includes home equity loans and home equity lines of credit .

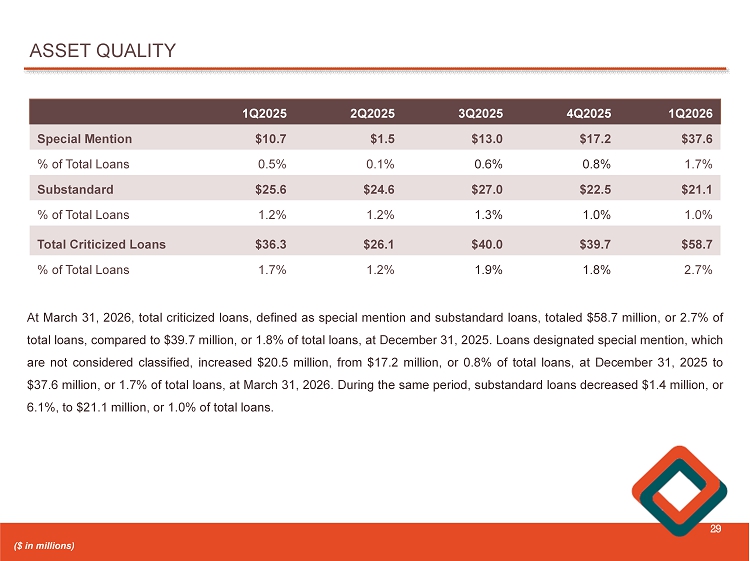
ASSET QUALITY 29 1Q2026 4Q2025 3Q2025 2Q2025 1Q2025 $37.6 $17.2 $13.0 $1.5 $10.7 Special Mention 1.7% 0.8% 0.6% 0.1% 0.5% % of Total Loans $21.1 $22.5 $27.0 $24.6 $25.6 Substandard 1.0% 1.0% 1.3% 1.2% 1.2% % of Total Loans $58.7 $39.7 $40.0 $26.1 $36.3 Total Criticized Loans 2.7% 1.8% 1.9% 1.2% 1.7% % of Total Loans At March 31 , 2026 , total criticized loans, defined as special mention and substandard loans, totaled $ 58 . 7 million, or 2 . 7 % of total loans, compared to $ 39 . 7 million, or 1 . 8 % of total loans, at December 31 , 2025 . Loans designated special mention, which are not considered classified, increased $ 20 . 5 million, from $ 17 . 2 million, or 0 . 8 % of total loans, at December 31 , 2025 to $ 37 . 6 million, or 1 . 7 % of total loans, at March 31 , 2026 . During the same period, substandard loans decreased $ 1 . 4 million, or 6 . 1 % , to $ 21 . 1 million, or 1 . 0 % of total loans . ($ in millions)

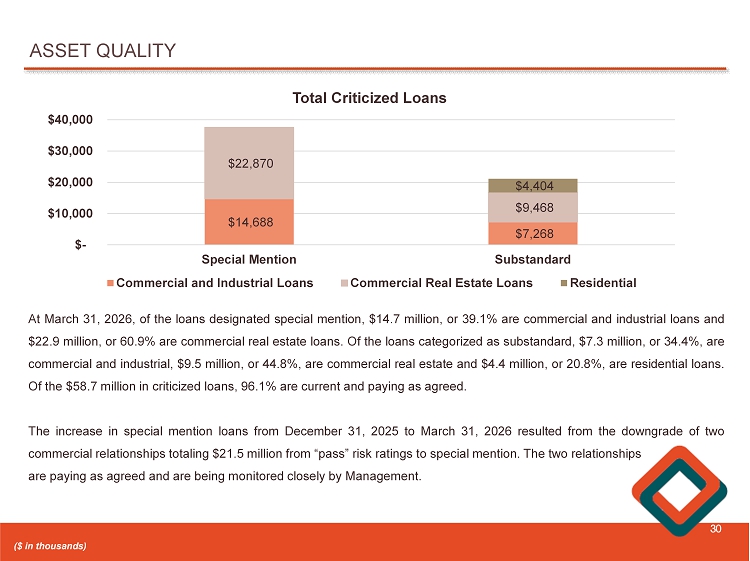
ASSET QUALITY 30 ($ in thousands) At March 31 , 2026 , of the loans designated special mention, $ 14 . 7 million, or 39 . 1 % are commercial and industrial loans and $ 22 . 9 million, or 60 . 9 % are commercial real estate loans . Of the loans categorized as substandard, $ 7 . 3 million, or 34 . 4 % , are commercial and industrial, $ 9 . 5 million, or 44 . 8 % , are commercial real estate and $ 4 . 4 million, or 20 . 8 % , are residential loans . Of the $ 58 . 7 million in criticized loans, 96 . 1 % are current and paying as agreed . The increase in special mention loans from December 31 , 2025 to March 31 , 2026 resulted from the downgrade of two commercial relationships totaling $ 21 . 5 million from “pass” risk ratings to special mention . The two relationships are paying as agreed and are being monitored closely by Management . $14,688 $7,268 $22,870 $9,468 $4,404 $- $10,000 $20,000 $30,000 $40,000 Special Mention Substandard Total Criticized Loans Commercial and Industrial Loans Commercial Real Estate Loans Residential

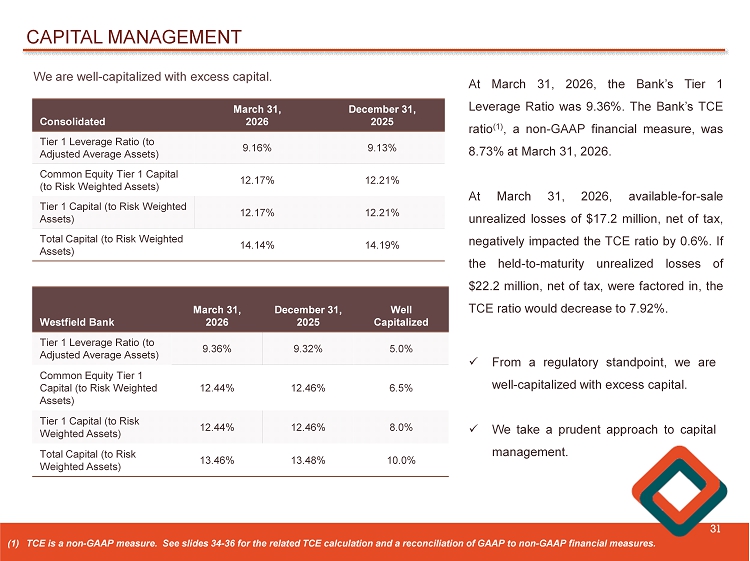
CAPITAL MANAGEMENT 31 We are well - capitalized with excess capital. December 31, 2025 March 31, 2026 Consolidated 9.13% 9.16% Tier 1 Leverage Ratio (to Adjusted Average Assets) 12.21% 12.17% Common Equity Tier 1 Capital (to Risk Weighted Assets) 12.21% 12.17% Tier 1 Capital (to Risk Weighted Assets) 14.19% 14.14% Total Capital (to Risk Weighted Assets) At March 31 , 2026 , the Bank’s Tier 1 Leverage Ratio was 9 . 36 % . The Bank’s TCE ratio ( 1 ) , a non - GAAP financial measure, was 8 . 73 % at March 31 , 2026 . At March 31 , 2026 , available - for - sale unrealized losses of $ 17 . 2 million, net of tax, negatively impacted the TCE ratio by 0 . 6 % . If the held - to - maturity unrealized losses of $ 22 . 2 million, net of tax, were factored in, the TCE ratio would decrease to 7 . 92 % . Well Capitalized December 31, 2025 March 31, 2026 Westfield Bank 5.0% 9.32% 9.36% Tier 1 Leverage Ratio (to Adjusted Average Assets) 6.5% 12.46% 12.44% Common Equity Tier 1 Capital (to Risk Weighted Assets) 8.0% 12.46% 12.44% Tier 1 Capital (to Risk Weighted Assets) 10.0% 13.48% 13.46% Total Capital (to Risk Weighted Assets) (1) TCE is a non - GAAP measure. See slides 34 - 36 for the related TCE calculation and a reconciliation of GAAP to non - GAAP financial measures. x From a regulatory standpoint, we are well - capitalized with excess capital . x We take a prudent approach to capital management .

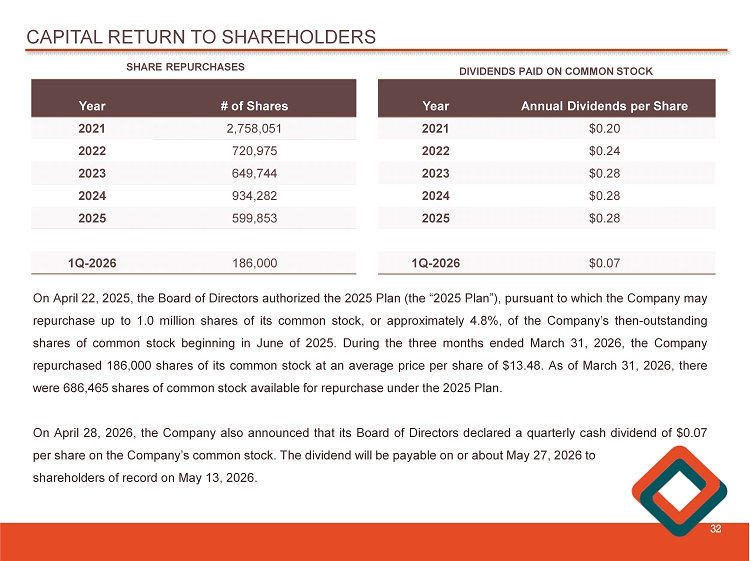
CAPITAL RETURN TO SHAREHOLDERS 32 # of Shares Year 2,758,051 2021 720,975 2022 649,744 2023 934,282 2024 599,853 2025 186,000 1Q - 2026 Annual Dividends per Share Year $0.20 2021 $0.24 2022 $0.28 2023 $0.28 2024 $0.28 2025 $0.07 1Q - 2026 SHARE REPURCHASES DIVIDENDS PAID ON COMMON STOCK On April 22 , 2025 , the Board of Directors authorized the 2025 Plan (the “ 2025 Plan”), pursuant to which the Company may repurchase up to 1 . 0 million shares of its common stock, or approximately 4 . 8 % , of the Company’s then - outstanding shares of common stock beginning in June of 2025 . During the three months ended March 31 , 2026 , the Company repurchased 186 , 000 shares of its common stock at an average price per share of $ 13 . 48 . As of March 31 , 2026 , there were 686 , 465 shares of common stock available for repurchase under the 2025 Plan . On April 28 , 2026 , the Company also announced that its Board of Directors declared a quarterly cash dividend of $ 0 . 07 per share on the Company’s common stock . The dividend will be payable on or about May 27 , 2026 to shareholders of record on May 13 , 2026 .

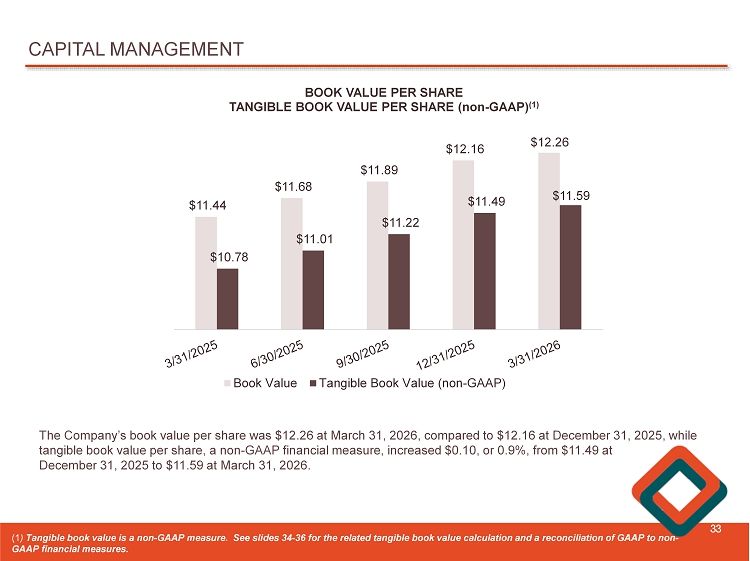
CAPITAL MANAGEMENT 33 $11.44 $11.68 $11.89 $12.16 $12.26 $10.78 $11.01 $11.22 $11.49 $11.59 BOOK VALUE PER SHARE TANGIBLE BOOK VALUE PER SHARE (non - GAAP) (1) Book Value Tangible Book Value (non-GAAP) The Company’s book value per share was $12.26 at March 31, 2026, compared to $12.16 at December 31, 2025, while tangible book value per share, a non - GAAP financial measure, increased $0.10, or 0.9%, from $11.49 at December 31, 2025 to $11.59 at March 31, 2026. (1 ) Tangible book value is a non - GAAP measure. See slides 34 - 36 for the related tangible book value calculation and a reconciliatio n of GAAP to non - GAAP financial measures .

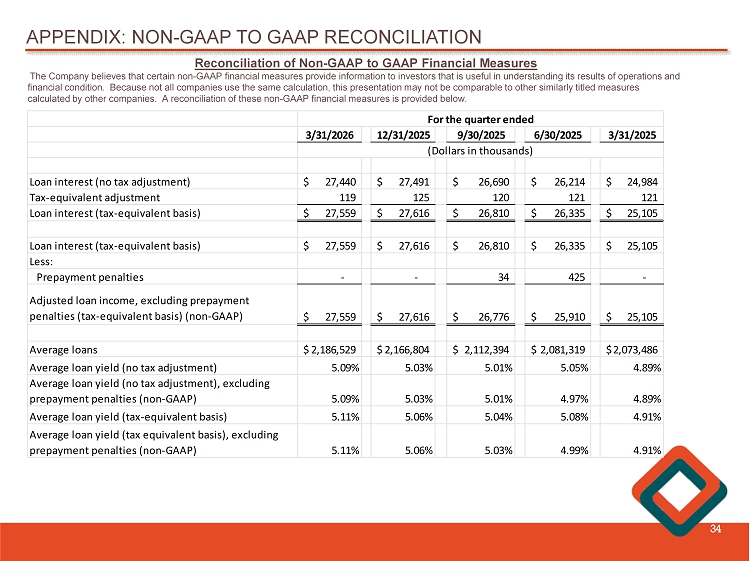
APPENDIX: NON - GAAP TO GAAP RECONCILIATION 34 Reconciliation of Non - GAAP to GAAP Financial Measures The Company believes that certain non - GAAP financial measures provide information to investors that is useful in understanding i ts results of operations and financial condition. Because not all companies use the same calculation, this presentation may not be comparable to other simil arly titled measures calculated by other companies. A reconciliation of these non - GAAP financial measures is provided below. 3/31/2026 12/31/2025 9/30/2025 6/30/2025 3/31/2025 Loan interest (no tax adjustment) 27,440$ 27,491$ 26,690$ 26,214$ 24,984$ Tax-equivalent adjustment 119 125 120 121 121 Loan interest (tax-equivalent basis) 27,559$ 27,616$ 26,810$ 26,335$ 25,105$ Loan interest (tax-equivalent basis) 27,559$ 27,616$ 26,810$ 26,335$ 25,105$ Less: Prepayment penalties - - 34 425 - Adjusted loan income, excluding prepayment penalties (tax-equivalent basis) (non-GAAP) 27,559$ 27,616$ 26,776$ 25,910$ 25,105$ Average loans 2,186,529$ 2,166,804$ 2,112,394$ 2,081,319$ 2,073,486$ Average loan yield (no tax adjustment) 5.09% 5.03% 5.01% 5.05% 4.89% Average loan yield (no tax adjustment), excluding prepayment penalties (non-GAAP) 5.09% 5.03% 5.01% 4.97% 4.89% Average loan yield (tax-equivalent basis) 5.11% 5.06% 5.04% 5.08% 4.91% Average loan yield (tax equivalent basis), excluding prepayment penalties (non-GAAP) 5.11% 5.06% 5.03% 4.99% 4.91% For the quarter ended (Dollars in thousands)

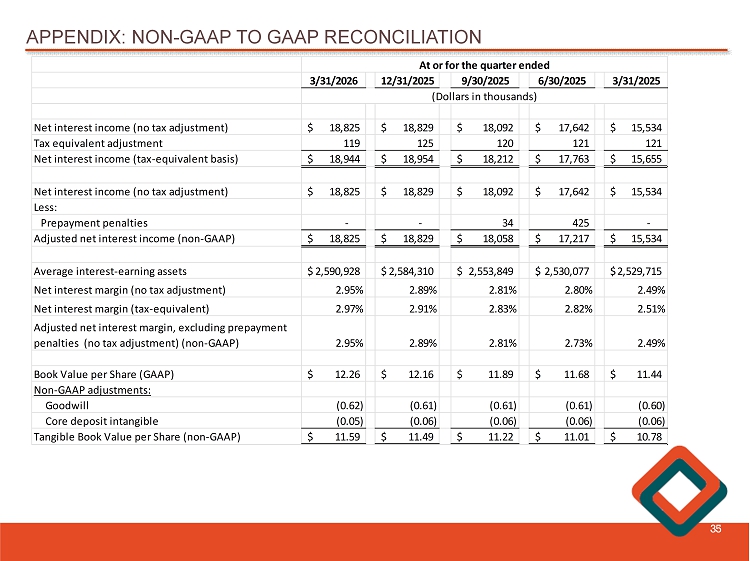
APPENDIX: NON - GAAP TO GAAP RECONCILIATION 35 3/31/2026 12/31/2025 9/30/2025 6/30/2025 3/31/2025 Net interest income (no tax adjustment) 18,825$ 18,829$ 18,092$ 17,642$ 15,534$ Tax equivalent adjustment 119 125 120 121 121 Net interest income (tax-equivalent basis) 18,944$ 18,954$ 18,212$ 17,763$ 15,655$ Net interest income (no tax adjustment) 18,825$ 18,829$ 18,092$ 17,642$ 15,534$ Less: Prepayment penalties - - 34 425 - Adjusted net interest income (non-GAAP) 18,825$ 18,829$ 18,058$ 17,217$ 15,534$ Average interest-earning assets 2,590,928$ 2,584,310$ 2,553,849$ 2,530,077$ 2,529,715$ Net interest margin (no tax adjustment) 2.95% 2.89% 2.81% 2.80% 2.49% Net interest margin (tax-equivalent) 2.97% 2.91% 2.83% 2.82% 2.51% Adjusted net interest margin, excluding prepayment penalties (no tax adjustment) (non-GAAP) 2.95% 2.89% 2.81% 2.73% 2.49% Book Value per Share (GAAP) 12.26$ 12.16$ 11.89$ 11.68$ 11.44$ Non-GAAP adjustments: Goodwill (0.62) (0.61) (0.61) (0.61) (0.60) Core deposit intangible (0.05) (0.06) (0.06) (0.06) (0.06) Tangible Book Value per Share (non-GAAP) 11.59$ 11.49$ 11.22$ 11.01$ 10.78$ At or for the quarter ended (Dollars in thousands)

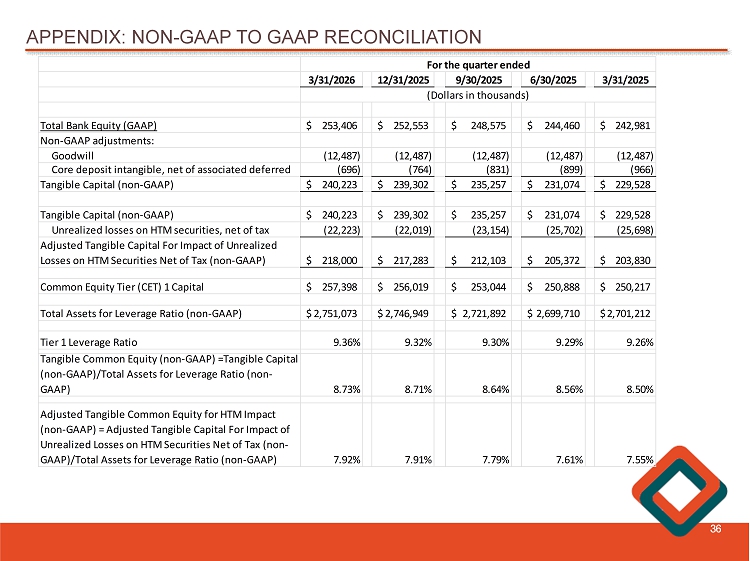
APPENDIX: NON - GAAP TO GAAP RECONCILIATION 36 3/31/2026 12/31/2025 9/30/2025 6/30/2025 3/31/2025 Total Bank Equity (GAAP) 253,406$ 252,553$ 248,575$ 244,460$ 242,981$ Non-GAAP adjustments: Goodwill (12,487) (12,487) (12,487) (12,487) (12,487) Core deposit intangible, net of associated deferred (696) (764) (831) (899) (966) Tangible Capital (non-GAAP) 240,223$ 239,302$ 235,257$ 231,074$ 229,528$ Tangible Capital (non-GAAP) 240,223$ 239,302$ 235,257$ 231,074$ 229,528$ Unrealized losses on HTM securities, net of tax (22,223) (22,019) (23,154) (25,702) (25,698) Adjusted Tangible Capital For Impact of Unrealized Losses on HTM Securities Net of Tax (non-GAAP) 218,000$ 217,283$ 212,103$ 205,372$ 203,830$ Common Equity Tier (CET) 1 Capital 257,398$ 256,019$ 253,044$ 250,888$ 250,217$ Total Assets for Leverage Ratio (non-GAAP) 2,751,073$ 2,746,949$ 2,721,892$ 2,699,710$ 2,701,212$ Tier 1 Leverage Ratio 9.36% 9.32% 9.30% 9.29% 9.26% Tangible Common Equity (non-GAAP) =Tangible Capital (non-GAAP)/Total Assets for Leverage Ratio (non- GAAP) 8.73% 8.71% 8.64% 8.56% 8.50% Adjusted Tangible Common Equity for HTM Impact (non-GAAP) = Adjusted Tangible Capital For Impact of Unrealized Losses on HTM Securities Net of Tax (non- GAAP)/Total Assets for Leverage Ratio (non-GAAP) 7.92% 7.91% 7.79% 7.61% 7.55% For the quarter ended (Dollars in thousands)

WESTFIELD BANK “WHAT BETTER BANKING’S ALL ABOUT” James C. Hagan , President and Chief Executive Officer Guida R. Sajdak , Executive Vice President and Chief Financial Officer Meghan Hibner , First Vice President and Investor Relations Officer 37 141 Elm Street, Westfield, MA
H7$NGW